abn for personal use only - asx · 2014-09-30 · victoria, australia 3205 principal places of...
TRANSCRIPT
Redflex Holdings Limited
Annual Report
For the year ended 30 June 2014
Redflex Holdings Limited ABN 96 069 306 216
REDFLEX – making a safer world
For
per
sona
l use
onl
y

REDFLEX HOLDINGS LIMITED Annual Report 2014
CONTENTS
Corporate Directory 1
Financial Performance Summary 2
Chairman’s Letter 3
From the Office of the Chief Executive Officer 6
Directors’ Report 11
Auditor’s Independence Declaration 23
Remuneration Report 24
Corporate Governance Statement 46
Consolidated Statement of Comprehensive Income 55
Consolidated Statement of Financial Position 56
Consolidated Statement of Changes in Equity 57
Consolidated Statement of Cash Flows 58
Notes to the Consolidated Financial Statements 59
Director’s Declaration 111
Independent Auditor’s Report 112
ASX Additional Information 114
For
per
sona
l use
onl
y

REDFLEX – making a safer world
‐ 1 ‐
REDFLEX HOLDINGS LIMITED
ABN 96 069 306 216
Redflex Holdings Limited shares are listed on ASX (Australian Securities Exchange) Code RDF
Directors
Adam Gray, Chairman
Paul Clark, Group Chief Executive Officer
Robert DeVincenzi
Michael McConnell
John Murphy
Herman Schwarz
Terence Winters
Company Secretary
Marilyn Stephens
Registered Office
31 Market Street, South Melbourne,
Victoria, Australia 3205
Principal Places of Business
Australia
31 Market Street, South Melbourne,
Victoria, Australia 3205
Redflex Holdings Limited: Phone: +61 3 9674 1715
Redflex Traffic Systems Pty Ltd: Phone: +61 3 9674 1800
USA
23751 N 23rd Avenue, Phoenix,
Arizona 85085, USA
Redflex Traffic Systems Inc: Phone: +1 623 207 2000
Share Register
Computershare Investor Services
452 Johnston Street, Abbotsford, Vic 3067
Phone: 1300 850 505
Solicitors
Baker & McKenzie
181 William Street, Melbourne, Vic 3000
DLA Piper Australia
1 Martin Place, Sydney NSW 2000
Auditor
Ernst & Young
8 Exhibition Street, Melbourne, Vic 3000
For
per
sona
l use
onl
y
REDFLEX HOLDINGS LIMITED Annual Report 2014
FINANCIAL PERFORMANCE SUMMARY
REDFLEX – making a safer world
‐ 2 ‐
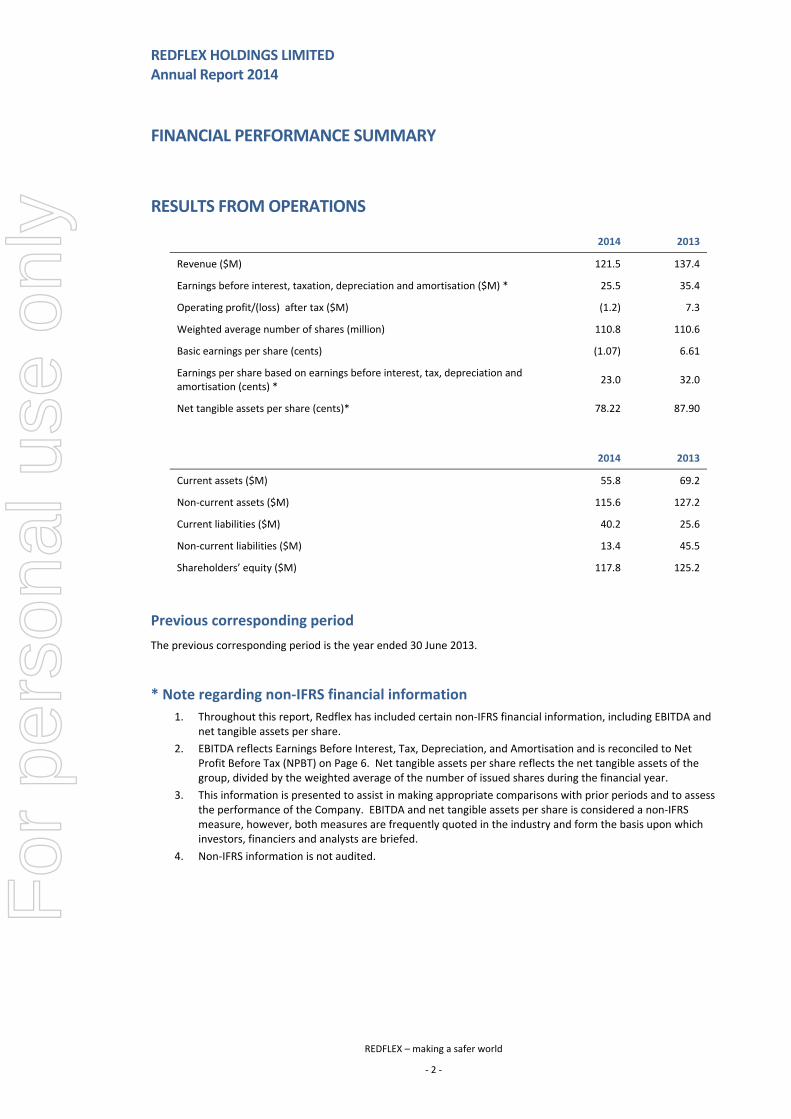
RESULTS FROM OPERATIONS
2014 2013
Revenue ($M) 121.5 137.4
Earnings before interest, taxation, depreciation and amortisation ($M) * 25.5 35.4
Operating profit/(loss) after tax ($M) (1.2) 7.3
Weighted average number of shares (million) 110.8 110.6
Basic earnings per share (cents) (1.07) 6.61
Earnings per share based on earnings before interest, tax, depreciation and amortisation (cents) *
23.0 32.0
Net tangible assets per share (cents)* 78.22 87.90
2014 2013
Current assets ($M) 55.8 69.2
Non‐current assets ($M) 115.6 127.2
Current liabilities ($M) 40.2 25.6
Non‐current liabilities ($M) 13.4 45.5
Shareholders’ equity ($M) 117.8 125.2
Previous corresponding period
The previous corresponding period is the year ended 30 June 2013.
* Note regarding non‐IFRS financial information
1. Throughout this report, Redflex has included certain non‐IFRS financial information, including EBITDA and net tangible assets per share.
2. EBITDA reflects Earnings Before Interest, Tax, Depreciation, and Amortisation and is reconciled to Net Profit Before Tax (NPBT) on Page 6. Net tangible assets per share reflects the net tangible assets of the group, divided by the weighted average of the number of issued shares during the financial year.
3. This information is presented to assist in making appropriate comparisons with prior periods and to assess the performance of the Company. EBITDA and net tangible assets per share is considered a non‐IFRS measure, however, both measures are frequently quoted in the industry and form the basis upon which investors, financiers and analysts are briefed.
4. Non‐IFRS information is not audited.
For
per
sona
l use
onl
y
REDFLEX HOLDINGS LIMITED Annual Report 2014
CHAIRMAN’S LETTER
MOVING FORWARD WITH MUCH WORK TO BE DONE
REDFLEX – making a safer world
‐ 3 ‐
Dear Associates and fellow Shareholders,
I am pleased to report that Redflex continues to move forward, though there remains much work to be done. FY14 represented an important transition period as we focused on stabilising our North American business. The Board and management have also focused attention on a number of critical forward‐looking initiatives, completing significant work over the last six months to position our company to enter FY15 with a clearly defined growth strategy in existing and adjacent markets, a leaner cost structure appropriate for the business, and a highly engaged and committed Board.
Strategic Roadmap
Earlier this year we worked with a global consulting firm was engaged to assist with a thorough evaluation of growth options and an assessment of expansion opportunities in the Company's core photo enforcement business. This review is substantially complete and has strongly informed our emerging vision for the future of a global Redflex: to enable efficient and safe traffic flows by delivering technology‐led end‐to‐end solutions to a host of different, but related, customer groups.
To achieve this vision, Redflex intends to build upon its leading market position in photo enforcement, where our technology provides significant benefits in lives saved and improved road safety, and to pursue organic and inorganic growth opportunities in adjacent Intelligent Transportation Systems (“ITS”) market segments. Certain ITS segments identified by the Company demonstrate attractive growth profiles, unmet market demand and needs, and a high level of market fragmentation.
We compete today in a market estimated to include nearly 70,000 photo enforcement cameras, approximately 40% of which reside in the UK and Europe (a significant percentage of which are vintage and outdated technology). Over the next five years, demand for approximately 35,000 cameras is expected to be driven by 15,000 replacement and 20,000 new camera installations.
North America (particularly the US), where the bulk of our asset base, EBITDA and cash flow resides, continues to be a low/no‐growth market made more challenging by public pushback against photo enforcement despite demonstrated and significant safety benefit. Outside of North America, the market is more dynamic and our pipeline more robust. 4 years ago, $11 million of our revenue outside of North America was reasonably expected to be recurring. In FY14 that measure had nearly doubled to just under $21 million and is expected to grow further to $27 million in FY15. But while we have made considerable progress, the speed and momentum of our change must increase.
Within our core Red Light and Speed photo enforcement market, we enjoy and will endeavour to drive incremental profitable growth by capitalising upon our (a) strong presence in the Australian market, (b) market‐leading product performance and growing presence in the attractive UK and European markets, and (c) deep penetration, knowledge, and strong relationships throughout North America.
In pursuing growth in adjacent ITS markets, we will seek to leverage our existing global platform, technology capabilities, and knowledge of municipal and government contract management, violation processing systems, electronic signaling, and traffic flow monitoring. We will be disciplined in pursuing only those opportunities that are “on‐target” strategically and provide the prospect of being meaningfully accretive to value. Toward this end, we have engaged a global investment bank, have assessed more than 80 companies operating primarily throughout Australia, North America and the UK/Europe, identified nearly two dozen prospects, and moved through exploratory discussions where appropriate.
For
per
sona
l use
onl
y

REDFLEX HOLDINGS LIMITED Annual Report 2014
CHAIRMAN’S LETTER (CONTINUED)
REDFLEX – making a safer world
‐ 4 ‐
CEO search
The Board engaged a leading recruitment firm to assist in the search for a global Group Chief Executive Officer. Through this process an extensive number of high quality candidates were identified and approached; a large number of which have been interviewed by the board. After considering all available alternatives, the board has appointed Paul Clark as Group CEO. Paul joined the Redflex board earlier this year, has gained significant insight into the business, and has helped us to develop a roster of key initiatives to drive shareholder value within the context of continued uncertainty regarding the resolution of some potentially significant issues for the Company. The Board believes that Paul has the capability and experience to extend the value of our existing Redflex business and to help lead the Company’s continued transformation. We look forward to working with Paul in this important role.
FY 14 Financial Performance
On behalf of my fellow directors I confirm FY14 results in line with our April guidance: EBITDA of $25.5 million and a net operating loss before tax of $3.8 million for the year. Cash flow from operations during the fiscal year was $29.9 million. These results include a long list of specific and largely offsetting items.
To be clear, our performance is not where we want it to be. We generate strong EBITDA and operating cash flow but do not convert enough of that to bottom line changes in cash. Historically, we have invested meaningful capital in new projects, then after an initial contract term of generally 3‐4 years, we suffer either price compression or contract termination, both of which significantly reduce returns on invested capital for such projects. This mismatch cannot continue and, rightly, we and shareholders expect better productivity. But I do believe that sharper attention to contract terms and reduction in capital costs has us heading in the right direction in important ways.
Acknowledging that integrity has no price, our first clear priority is to operate as a world class company in the markets in which we compete. In FY14 we invested meaningfully behind doing the right thing for our customers, to lead the industry with “best practices”, and to fully meet our obligations as we distance ourselves from a sobering past. I am proud of the actions our Company has taken, though costly and painful, demonstrating transparency; cooperating fully with various investigative authorities; instituting aggressive leadership change; robust training; reporting and compliance practices; and more.
The financial plan for FY14 focused on the retention of our US customer base while building our international presence. Key accomplishments of the year included:
Despite strong headwinds in the USA red light business, Redflex continued to effectively compete in the market with over 80 new contracts, renewals or extensions completed during the year.
Our International operations have enjoyed significant success in growing existing and new relationships while enduring disappointing, but not entirely unexpected, changes and delays with certain contracts. The recently announced award in support of the mobile speed camera road safety initiatives in New South Wales represents a positive development for our Australian business. During FY14, over $3.5 million was invested in this contract which is anticipated to deliver annual revenue of more than $9 million per annum over the next two and a half year period. This, together with our Saudi Arabia infringement processing operations, and other maintenance contracts, means that $27 million of the revenue attributable to the International operations is likely to be recurring.
We realigned resources across the Company to fund priority growth and customer retention initiatives while reducing costs. In total, the restructuring activities implemented from May 2013 to June 2014 drove a $12 million reduction in annualised expenditures. The Company continues to evaluate how to most efficiently steward both operating and capital outlays to balance rewards for shareholders today with the long‐term investment required for tomorrow.
For
per
sona
l use
onl
y
REDFLEX HOLDINGS LIMITED Annual Report 2014
CHAIRMAN’S LETTER (CONTINUED)
REDFLEX – making a safer world
‐ 5 ‐
Although improvements and its pipeline of attractive growth opportunities ramped throughout the last several months of FY14, Student Guardian delivered disappointing topline results for the year, translating to significant ($4.3 million) operating losses. The Redflex team understands the importance and discipline with which we will measure progress as we continue to evaluate how best to make Student Guardian a productive value contributor to the enterprise.
Importantly, Cash Flow from Operations increased by $2.4 million (+8.7%) over that achieved in FY13. We exit the year with net debt of $2.1 million and, subsequent to 30 June, a refreshed borrowing facility with attractive terms through FY17. With an eye toward preserving financial flexibility, the Company has not declared a dividend at this time.
Board Revitalisation
To strengthen the board, the Company welcomed five new non‐executive directors during FY14: Terence Winters, Paul Clark, John Murphy, Herman Schwarz, and me. Each new director brings to Redflex significant business, strategic, financial and operational experience.
After many years of change, this revitalised board has immersed itself in the current business, conducted a deep strategic review of potential growth opportunities, and taken on a heavy load of key projects in addition to the many oversight and compliance matters that require attention while helping the management team attend to driving operating priorities.
Given the challenges that we face, including the ultimate resolution of our legal matters in the United States, the uncertainties resident in our markets, and the exciting opportunities developing for Redflex, we place a meaningful premium on consistency and continuity in the board room with the goal of helping Redflex to move beyond its decade of instability and to emerge a more vital business.
Alignment of Interests
“Alignment of Interests” is a board matter of particular importance to shareholders. As you will see in the Remuneration Committee report below, we are elevating the links between strategy, performance and compensation. 100% of our CEOs incentive is proposed to be paid via performance rights that vest over time. Our Long Term Incentive Plan is designed around providing equity‐like incentives to key management; the key principle being that if shareholders benefit, then so should our executive team; and conversely, if there is no shareholder gain, neither should there be gains for management. We have proposed meaningful minimum equity ownership requirements for both the board and senior management.
In Summary
The Board and management have taken aggressive action to move the Company forward with much work remaining to be done. Despite continued headwinds, we believe Redflex is well positioned to deliver improved results in FY15 though the path will likely not be smooth. We have a clear strategic roadmap. The Company is favourably positioned to consider both compelling reinvestment and appropriate inorganic growth, and if neither evolves, to consider other means of returning value to shareholders. Our governance is strong and interests aligned.
On behalf of my fellow directors and fellow shareholders I would like to thank our entire Redflex team for their dedication, hard work and many contributions to shaping our Company’s performance. I also wish to thank my board colleagues for their tireless commitment to helping inform and navigate a brighter future for us all.
Adam Gray Chairman
For
per
sona
l use
onl
y

REDFLEX HOLDINGS LIMITED Annual Report 2014
FROM THE OFFICE OF THE CHIEF EXECUTIVE OFFICER
REDFLEX – making a safer world
‐ 6 ‐
REDFLEX GROUP ‐ REVIEW OF OPERATIONS
Revenue from operations for Redflex Holdings Limited (“Redflex”, the “Group”, or “Company”) for the financial year ended 30 June 2014 was $121.5 million, a decrease of 11.5% on the previous year revenue of $137.4 million. The reduced revenue was primarily attributable to the USA operations, with revenue down approximately $10.7 million on the previous financial year due primarily to the, previously announced, non‐renewal of the City of Chicago contract. The revenue attributable to the North America market, predominantly the USA BOOM business, decreased by 11.5% to $83.5 million, compared to $94.2 million in the previous financial year. Revenues to International customers totaled $38.0 million, compared to the previous financial year of $43.2 million, a decrease of 11.8%.
EBITDA was $25.5 million, a decrease of 28.0% over the previous year EBITDA of $35.4 million.
Net operating loss before tax was $3.8 million, compared to the previous year profit before tax of $8.6 million. Net operating loss after tax was $1.2 million, compared to the previous year profit after tax of $7.3 million.
These results were affected by a positive average AU$/US$ exchange rate movement of 10.6 % over the year.
The cash flow from operations during FY14 increased 8.7% to $29.9 million compared to $27.5 million in FY13.
Contributing factors to the year’s results were:
Recognition of revenue associated with the sale of software licences ‐ $3.2 million;
The non‐renewal of the Chicago contract reduced revenue by $9.7 million, which had a significant impact on gross profit;
Losses on the Student Guardian bus stop‐arm operation ‐ $4.3 million;
Costs relating to the strategy work, engagement of investment bankers, and the Group CEO search ‐ $1.5 million;
Ongoing legal and associated costs in responding to investigative authorities throughout the USA arising from previous disclosures and related matters ‐ $2.4 million (FY13 $3.7 million);
Costs relating to the settlement of a class action law suit in New Jersey, and a prevailing wage dispute in California ‐ $1.5 million;
Impairment of Capitalised Development costs of approximately $0.5 million;
Costs of retrenchments and early termination agreements relating to the cost reduction exercise ‐ $0.5 million; and
A bonus arising from the Transition Agreement for the Group’s previous CEO ‐ $0.6 million.
YEAR ON YEAR COMPARISON
A comparison of the Group’s performance for FY14 and FY13 is as follows.
FY14 FY13
$’000 $’000
EBITDA (non IFRS measure) 25,513 35,377
Less:
Depreciation 23,276 21,596
Amortisation 4,776 4,024
Interest 1,303 1,156
Net profit/(loss) before tax (3,842) 8,601
For
per
sona
l use
onl
y

REDFLEX HOLDINGS LIMITED Annual Report 2014
FROM THE OFFICE OF THE CHIEF EXECUTIVE OFFICER
REDFLEX – making a safer world
‐ 7 ‐
OPERATIONAL FOCUS
The key elements of the operational focus of the Company continue to be:
Profitably growing the business beyond the previous sustainment strategy of the USA business;
Continuing to look for operating efficiencies subsequent to the cost reduction exercises implemented during FY14;
Maximisation of revenue from existing, renewed and new contracts;
Investigation of new sources of revenue from existing customers; and
Increasing the level of recurring revenue arising from International operations.
FINANCIAL RESOURCES
The Syndicated Financing Facility was renewed on 8 August 2014 for a further three years with the existing syndicate of three Australian banks. The revised facility is a US$30.0 million loan (AU$31.8 million), with an accordion feature for a further US$30.0 million (AU$31.8 million) which is uncommitted. The Company previously had a US$70.0 million (AU$76.6 million) revolving credit facility.
In addition, the Company retained an AU$8.0 million working capital facility for bank guarantees and bonds required to support bids and contracts with certain customers.
The total drawn amount at 30 June 2014 was US$15.0 million (AU$15.9 million). The total amount drawn at 30 June 2013 was US$25.0 million (AU$26.0 million).
The net debt position of the Group at 30 June 2014 was $2.1 million (including restricted cash of $3.7 million).
The slowing rate of new installations within the USA market has reduced the demand for capital to service that market. The cash flow from operations is expected to be sufficient to fund the Group’s capital requirements.
The reduction in the facility limit was decided based on the current lack of need to draw down the facility, and the holding costs of carrying an unutilised facility.
DIVIDENDS
During the current financial year, Directors declared a final dividend in respect of FY13. This was a partially franked final dividend of 3.0 cents per share of which 2.0 cents was fully franked and 1.0 cent was unfranked. The dividend was paid on 2 December 2013.
No dividend has been declared in respect of FY14.
Despite having a strong balance sheet and the capacity to return capital to shareholders, the Board believes it appropriate to maintain maximum financial flexibility to ensure it is well positioned to address any potential acquisition opportunities as they arise.
For
per
sona
l use
onl
y
REDFLEX HOLDINGS LIMITED Annual Report 2014
FROM THE OFFICE OF THE CHIEF EXECUTIVE OFFICER
REDFLEX – making a safer world
‐ 8 ‐
NORTH AMERICAN OPERATIONS
Results for the North American Operations
Revenue for the year ended 30 June 2014 of $83.5 million was down 11.5% over the prior year (FY13: $94.2 million).
Redflex had previously installed and managed 384 automated enforcement systems for the City of Chicago. The contracts, together with extensions, expired on 31 January 2014 resulting in reduced revenue of approximately $18 million per annum going forward.
The total number of installed systems in the USA as at 30 June 2014 was 1,518 (FY13: 1,960).
During the year 55 new systems were installed and 140 were removed, excluding Chicago.
More than half of the terminating approaches were from California contracts, all of which elected to discontinue their photo enforcement programs.
The resultant reduction in cameras and associated asset write‐downs, together with a lack of new installations, has negatively impacted the USA revenue base and profitability.
Additionally, there was an extraordinarily adverse weather period in the north east of the USA that significantly reduced traffic volumes and traffic violations for an extended period of time.
All of the above factors have had a negative impact on our 2014 financial results.
Red Light and Speed Camera Contracts
The company signed 2 new contracts during FY14. Existing contracts with 610 approaches were renewed at a renewal rate of 68%, excluding Chicago.
Write‐downs for those contracts that were not renewed totalled $1.8 million (FY13: $1.8 million).
REDFLEX GuardianTM
REDFLEX Guardian™ is a school bus stop‐arm photo enforcement camera system, which addresses the safety needs of children on school buses. Video tracking is used to capture offences by drivers who pass a bus which is stationary with its safety lights flashing whilst children are getting on and off. The Redflex‐developed product has been introduced to the operations of Smart Bus which the Group acquired in FY12 for US$4.5 million.
Redflex has received an award to install an initial requirement on 300 buses for a school district in Georgia, however this is still subject to a formal agreement which is expected to be signed in the near term.
The ongoing volume of citations arising from expected detections is unproven at this stage, and this is a key determinant of future revenue and profitability. The carrying value of the investment in REDFLEX Guardian™ has not been further impaired in FY14 pending the results of the new contract along with changes being made to existing contracts.
Key performance indicators are improving, suggesting that any impairment of the investment is premature.
Accordingly, the operation is still considered to be in a start‐up phase and incurred an operating loss of $4.3 million for FY14 (FY13: $2.2 million loss).
For
per
sona
l use
onl
y
REDFLEX HOLDINGS LIMITED Annual Report 2014
FROM THE OFFICE OF THE CHIEF EXECUTIVE OFFICER
REDFLEX – making a safer world
‐ 9 ‐
NORTH AMERICAN OPERATIONS (CONTINUED)
Legal and Legislative Environment
The level of litigation throughout the industry remains significant but continues to decline as the industry matures and litigation precedents accumulate. Note 20 addresses legal actions that arise in the ordinary course of business.
Redflex’s legislative efforts are focused on preparing defences against potential adverse developments that may arise in state and local legislative initiatives. Redflex is supporting the filing of bills in certain states seeking enablement and enhancements for red light and speed road safety cameras, as well as for photo enforcement of school bus stop‐arm infractions.
Redflex continues to face the challenges raised through local voter initiatives and referendums. Citizen initiatives prevented several Redflex contracts being renewed after their terms expired, consistent with industry dynamics.
REDFLEX INTERNATIONAL OPERATIONS
The International business is subject to peaks and troughs with international customers. There has been an increase in the level of long term recurring revenue through service contracts and maintenance, which goes some way to smoothing the variability.
Although revenue was down approximately $5.1 million compared to the prior year, the NSW mobile speed contract was progressively rolled out in the last few months of FY14 and will have full year impact heading into FY15.
Some of the major achievements for the year include the following:
New South Wales
During FY14 Redflex was awarded four of the six regions of the NSW Roads and Maritime Services (RMS) expanded Mobile Camera Program. Redflex had been operating the Interim Mobile Camera Program since 2010 which involved the provision of 6 manned vehicles together with adjudication services. The expanded program is for delivery of 7,000 hours per month, a significant amount of which will be delivered by Redflex. Revenue is generated based on the number of deployment hours.
The program has been progressively implemented during the last few months of FY14 and became fully operational in August 2014.
The contract is valued at over $9 million per annum, and has an initial term of two and a half years, with two additional option periods of one year each.
RMS also purchased a technology enhancement for the six vehicles from the pilot program, that provides enhanced photo evidence of speeding vehicles, including the identification of speeding motorcycles.
Malaysia
The Automated Enforcement System (AES) program was launched in Malaysia in September 2012. Under the AES program, Redflex is contracted to provide state‐of‐the‐art speed enforcement technology with 450 fixed speed cameras, 140 mobile cameras, extensive enterprise back‐office software, and implementation services.
Initially, the implementation of the project was subcontracted to two concessionaires, one of whom represented Redflex technology. There has been significant debate regarding the use of a concession model for an enforcement program. To overcome negative public opinion, the Malaysian Government decided to hand the operations and enforcement of the program to a new Government‐owned company, AES Solutions.
Given the changes to the program, there is uncertainty in respect of the timing and the end requirements of the program. Orders originally anticipated for FY14 are uncertain and will be further delayed with any future deliveries extended over a number of years.
For
per
sona
l use
onl
y
REDFLEX HOLDINGS LIMITED Annual Report 2014
FROM THE OFFICE OF THE CHIEF EXECUTIVE OFFICER
REDFLEX – making a safer world
‐ 10 ‐
REDFLEX INTERNATIONAL OPERATIONS (CONTINUED)
United Kingdom
For the last few years, Redflex has been working with the UK highway authority, Highways Agency Digital Enforcement Camera System (HADECS), to introduce variable speed enforcement cameras on major UK roads. The ability to effectively enforce vehicle speed in locations where speed limits can be varied is an important management tool to most efficiently regulate traffic flows for maximum throughput. Redflex received Home Office approval for the cameras during FY14 and has recently received two initial orders for approximately $4.2 million, with anticipated recurring maintenance fees to follow. These are important orders for building the business in the UK, a priority geography for future growth. We expect the majority of the two orders to be filled in FY15, and anticipate further orders during FY15. The contracts will likely have ongoing maintenance revenue for a period of ten years after commissioning.
Middle East
Conditions in the Middle East remain challenging. In Saudi Arabia, the Company continues to provide ticket processing services for the Eastern Province, Aseer, and Tabuk and has also provided enhancements to the speed enforcement cameras to allow enforcement for vehicles travelling in both directions.
The Abu Dhabi project is progressing slowly, as management deals with a number of issues associated with the installation of the systems and changing customer requirements.
Ireland
The road safety program in Ireland, the “GoSafe” program, is run by a consortium in which Redflex owns a 16% stake alongside partners Spectra (from Ireland) and Egis Projects SA (from France). The investment generated coupon interest and a management fee in FY14, and we have expectations of further returns on that investment in FY15 and beyond. 44 vehicles now operate in GoSafe program which enforces speed violations.
RESEARCH AND DEVELOPMENT
Research and development continues to deliver competitive advantage for the business. Redflex has launched a freeway speed radar system to enable enforcement of busy freeways from bridges and gantries, and continues to devote significant resources on radar detection technology for red light intersections, and on both mobile and fixed speed enforcement.
Redflex recently developed a Mapping Radar technology product to monitor traffic‐light controlled intersections for both red light offences and speed offences. This has been highly successful and is being rolled out to new and existing customers within the USA enabling replacement of loops currently embedded in the road surface.
REALIGNMENT OF COST STRUCTURE
Subsequent to being informed that Redflex was not invited to renew its contracts with the City of Chicago, the Board and management undertook a review of the Company's operations. The aim of this review was to ensure that resources were focused on customer support, priority growth opportunities, and to acknowledge that the cost structure was no longer appropriate for the size of the existing business.
As a result, the Company instigated two rounds of expenditure cuts in April 2013, and May 2014, to reduce annualised cash costs (operating and capitalised), to help compensate for the loss of revenue and margin related to those contracts. These actions were designed to improve the financial performance of the Company, while at the same time reallocating resources to optimise future results.
OUTLOOK FOR THE 2015 FINANCIAL YEAR
The Company is forecasting an improved result in FY15 on FY14, with an expected trading loss in the first half of the year, followed by a recovery in the second half, and approximately break‐even result before tax for the full year.
For
per
sona
l use
onl
y

REDFLEX HOLDINGS LIMITED Annual Report 2014
DIRECTORS’ REPORT
REDFLEX – making a safer world
‐ 11 ‐
Your directors submit their report for the year ended 30 June 2014
DIRECTORS
The names and details of the company’s directors in office during the financial year and until the date of this report are as follows. Directors were in office for the entire period unless otherwise stated.
Adam Gray ‐ BSE (Fin), BS (Mech Eng'g) – Non‐executive chairman
Appointed 19 December 2013
Mr Gray co‐founded Coliseum Capital Management, LLC in 2006. Prior to Coliseum, Mr Gray had nearly 20 years of private equity and operating experience, working with and on behalf of firms including Metromedia Company, Texas Pacific Group, and Bain Capital.
In addition to various finance and transactional responsibilities, he has focused upon operational and financial restructurings as he helped lead organisations through highly complex and distressed situations.
Mr Gray is a Director of New Flyer Industries Inc and Uno Restaurant Holdings Corporation and Rocket Dog Brands LLC , where he serves as Chairman. He served as a Director of DEI Holdings Inc until the sale of the company in 2011 and of Benihana Inc until the sale of the company in August 2013.
He has a BSE Finance from the Wharton School and a BS Mechanical Engineering from the University of Pennsylvania.
Mr Gray serves on the Audit Committee and the Remuneration Committee.
During the last three years Mr Gray has not been a director of any other Australian listed public company.
Paul Clark ‐ B.Bus (Acc), MBA (Exec), FCA, GAICD – Group chief executive officer
Appointed 5 April 2014 as a Non Executive Director and appointed Group Chief Executive Officer on 25 September 2014
Mr Clark joined the Board as a Non Executive Director and on 25 September 2014 was appointed as Group Chief Executive Officer. Details of this appointment, including Mr Clarks’ remuneration arrangement are disclosed in this report under “subsequent events”.
Mr Clark has extensive experience at both a board and executive level in financial restructuring, process improvement, risk management, cost reduction, sales and business development and new product development. He has led large teams through significant cultural, structural and strategic change.
Mr Clark has served on a number of subsidiary company boards and executive committees of ASX, FSTE and NYSE listed companies and is currently Chairman of Melbourne Water, a Director of the Victorian Water Industry Association and an advisory board member of Salta Properties, one of Australia's largest privately
owned property companies. He previously held senior executive positions at Price Waterhousecoopers, Ernst & Young, National Australia Bank, Bank West, Bank of New Zealand and HBOS Australia.
Mr Clark has a Bachelor of Business (Accounting) from the Royal Melbourne Institute of Technology, an Executive MBA from the Australian Graduate School of Management (University of Sydney) and is a Graduate of the INSEAD AVIRA program. He is a fellow of the Institute of Chartered Accountants in Australia and a senior fellow of the Financial Services Institute of Australia.
During the period from 5 April 2014 to the date of his appointment as chief executive officer, Mr Clark served as Chair of the Nomination Committee and was also a member of the Audit Committee and the newly established Risk and Compliance Committee.
During the last three years Mr Clark has not been a director of any other Australian listed public company.
For
per
sona
l use
onl
y
REDFLEX HOLDINGS LIMITED Annual Report 2014
DIRECTORS’ REPORT
REDFLEX – making a safer world
‐ 12 ‐
Robert DeVincenzi ‐ BSBA, MA‐Org’l – Non‐executive director
Previously, Mr DeVincenzi was President and CEO of LaserCard Corporation, a biometric identification systems business supporting government and commercial clients around the world. Mr DeVincenzi joined LaserCard Corporation in June 2008 and was instrumental in repositioning the company's solution portfolio, and dramatically improving operating profitability. The financial and strategic turnaround of the company led to a successful merger with HID Global/ASSA ABLOY in 2011.
Mr DeVincenzi served as Senior Vice President of Corporate Development of Solectron Inc from January 2005 to December 2007. Prior to that Mr DeVincenzi was President and CEO of Inkra Networks Inc from January 2004 to January 2005, and CEO of Ignis Optics Inc from January 2003 to January 2004.
Mr DeVincenzi received a Master of Arts in Organisational Leadership from Gonzaga University, and a Bachelor of Science in Business Administration from California State University.
Mr DeVincenzi served as CEO of the Redflex Group until he transitioned to non‐executive director status on 16 January 2014. He also serves on the newly formed Risk and Compliance Committee.
During the last three years Mr DeVincenzi has not been a director of any other Australian listed public company.
Michael McConnell ‐ BA (Econ), MBA – Non‐executive director
Mr McConnell served as the CEO of Collectors Universe from March 2009 to August 2012 and since retiring as CEO, he has served in a non‐executive director role. From 1994 to 2007, Mr McConnell served as a Managing Director of Shamrock Capital Advisors. He led a $1.2 billion direct investment fund and was a member of the firm's Executive Committee. He was involved in 34 principal investment transactions of over $2.7 billion in both public and private companies. The investments spanned a variety of industries, including media, entertainment, software, radio broadcasting, cable distribution, basic materials, chemicals, and consumer products, in companies domiciled globally, including the USA, Australia, New Zealand, Ireland, and Israel.
Mr McConnell received his BA in economics from Harvard University in 1988 and his MBA degree (Shermet Scholar) from the Darden School of the University of Virginia in 1994. Mr McConnell is a member of the Board of Governors of the microfinance
organisation Opportunity International, an Elder of La Canada Presbyterian Church and former director of the La Canada Educational Foundation.
Mr McConnell was a non‐executive director of Paperlinx Limited until November 2012 and has served on numerous public and private company boards in the USA, Australia, New Zealand and Ireland. In August 2014 Mr McConnell became executive chairman of the US public company, Spark Networks.
Mr McConnell served as Interim Chair from 1 March to 31 December 2013 and he now serves as Chair of the newly established Risk and Compliance Committee and also serves on the Remuneration Committee.
During the last three years Mr McConnell has not been a director of any other Australian listed public company.
For
per
sona
l use
onl
y

REDFLEX HOLDINGS LIMITED Annual Report 2014
DIRECTORS’ REPORT
REDFLEX – making a safer world
‐ 13 ‐
John Murphy – CA, FCPA, B.Comm, M.Comm ‐ Non‐executive director
Appointed 5 April 2014
Mr Murphy spent the first 26 years of his business life working for the international accounting firm Arthur Andersen, the last 16 years as a global partner. Between 1999 and 2012 Mr Murphy was the Managing Director of Investec Wentworth Private Equity Limited which had in excess of $500m funds under management. He has served on the boards of many of the funds' investments and has extensive public and private company director experience in growing businesses.
Mr Murphy holds Bachelor's and Master's Degrees in Commerce from the University of New South Wales and is a Chartered Accountant and a Fellow of the Australian Society of Certified Practicing Accountants.
Mr Murphy is chair of the Audit Committee.
Mr Murphy's current directorships include Investec Bank Australia Limited, Vocus Communications Limited, Gale Pacific Limited and Ariadne Australia Limited. During the last three years Mr Murphy has not been a director of any other Australian listed company.
Herman Schwarz – MBA, B.Comm ‐ Non‐executive director
Appointed 1 May 2014
Since 2009 Mr Schwarz has served as the CEO of LogistiCare Solutions, the largest non‐emergency transportation management company in the Medicaid and Medicare space with nearly US$800 million in revenues and distributed operations in 40 states in the USA, managing 58 million trips annually.
Prior to LogistiCare, Mr Schwarz was President, CEO and Director of Aegis Communications (the seventh largest publicly‐traded provider of outsourced call centre services in the U.S.), and held multiple senior executive positions at National Service Industries (a US$2.5 billion publicly‐traded USA conglomerate). Mr Schwarz started his career with Arthur Andersen, where he earned his CPA.
Mr Schwarz has extensive experience in building and working with operating teams to develop and execute against a strategic vision while driving accountability for strong financial results. In addition, he brings to the Redflex board a wealth of knowledge
about the U.S. public‐to‐private contracting and transportation industries, the challenges of optimising growth and new market entry, and the management of transaction and claims processing, technology and IP‐based businesses.
Mr Schwarz holds a Bachelor of Science (Commerce) from the University of Virginia, and an MBA (Finance) from the Wharton School of Business at the University of Pennsylvania.
Mr Schwarz serves on the Remuneration and the newly established Risk and Compliance Committee.
During the last three years Mr Schwarz has not been a director of any other Australian listed public company.
For
per
sona
l use
onl
y
REDFLEX HOLDINGS LIMITED Annual Report 2014
DIRECTORS’ REPORT
REDFLEX – making a safer world
‐ 14 ‐
Terence Winters – FAICD – Non‐executive director
Appointed 7 August 2013
Mr Winters has served as Chairman and Non‐Executive Director of Australian listed and private companies and charities. He is currently Chairman of Seeing Machines Limited (a UK AIM listed company), Converge International Limited, and Intelledox Pty Ltd and completed his term as Chairman of Australian Home Care Services Pty Ltd on 10 September 2013.
He brings a great depth of experience in the governance and operations of international technology companies and social enterprises and he has a positive track record for leading strategic and cultural change programs at board level. After working for Motorola for 10 years, he founded Link Telecommunications Pty Ltd in Australia in 1982 and was Chief Executive Officer and/or Chairman of Link at different times until 1999 when he sold his interest in the company. He led the creation of Optus Communications Pty Ltd from 1989 to 1992 and served on the Optus board until 1995.
In addition, Mr Winters has spent over 17 years on various boards within the Opportunity International Network (OIN) and served as global Chairman of Opportunity International Network Inc for a four year term which was completed in May 2010. OIN is a non‐government organisation involved in the provision of Micro Enterprise Development and regulated Micro Finance Banking Services in over 30 developing countries. Mr Winters was also Chairman of the Multiple Sclerosis Society of Victoria and MS Limited for 10 years until his term ended in 2007.
Mr Winters serves as Chair of the Remuneration Committee
During the last three years Mr Winters has not been a director of any other Australian listed public company.
Robin Debernardi – former non‐executive director
Resigned on 5 April 2014
Mr Debernardi is a prominent businessman who has had significant success in a diverse range of businesses. His achievements include the creation of a product range within the horticultural industry, which continues to boast household name recognition decades later. Mr Debernardi enjoyed successes in commercial and rural property development in Victoria and Queensland. He has substantial experience in assisting companies involved in high growth phases of their development.
Mr Debernardi chaired the Remuneration Committee during the financial year. Mr Debernardi served on the Audit and Risk Management Committee.
Albert Moyer – former non‐executive director
Resigned on 30 April 2014
Mr Moyer has been a financial consultant since 2000. In 2005 Mr Moyer served as Interim President and CEO of Telenetics Corp. He served as an Executive VP and CFO for QAD Inc from March 1998 to February 2000, and to February 2002 he consulted to QAD. Mr Moyer served as the VP and CFO of Allergan Inc from August 1995 to March 1998 and he also served as CFO of Western Digital Corp, Coldwell Banker Corp, and National Semiconductor Corp, and as CEO of Enhansys Inc. Mr Moyer has been a Director of MaxLinear Inc since October 2009, of CalAmp Corp since February 2004, of Collectors Universe Inc since 2003 and of Virco Manufacturing Cor since 2004. He has also served as a Director of Occam Networks Inc, Lasercard Corporation, QAD Inc, and Earthshell Corporation.
Company Secretary
Ms Marilyn Stephens has been the Company Secretary of Redflex Holdings Limited since it listed on ASX in 1997. Prior to that, Ms Stephens was the Company Secretary and Administration Manager of various companies within the Redflex Group for nine years.
For
per
sona
l use
onl
y

REDFLEX HOLDINGS LIMITED Annual Report 2014
DIRECTORS’ REPORT
REDFLEX – making a safer world
‐ 15 ‐
Directors’ interests in the share capital of the company
As at the date of this report, the interests of the directors in the share capital of Redflex Holdings Limited were:
Number of Relevant Interests over Ordinary
Shares
Number of Performance Rights
over Ordinary Shares
Adam Gray 24,810,516 ‐
Paul Clark ‐ ‐
Robert DeVincenzi ‐ ‐
Mike McConnell 59,125 ‐
John Murphy ‐ ‐
Herman Schwarz ‐ ‐
Terence Winters ‐ ‐
Directors’ meetings
Directors’ meetings held and attended during the year ended 30 June 2014, and up to the date of this report were:
Board Audit Committee Remuneration Committee
Number of meetings held 26 4 5
Number of meetings attended
Adam Gray 14 4 5
Paul Clark 10 2 ‐
Robert DeVincenzi 23 4 5
Michael McConnell 26 4 5
John Murphy 9 2 ‐
Herman Schwarz 9 1 ‐
Terence Winters 26 4 5
Robin Debernardi 15 2 ‐
Albert Moyer 17 ‐ ‐
Mr McConnell was eligible to attend all meetings held. Mr Gray, who was appointed on 19 December 2013 was eligible to attend 14 board meetings; Mr Clark and Mr Murphy who were appointed on 5 April 2014, were eligible to attend 10; Mr Schwarz who was appointed on 1 May 2014, was eligible to attend 9; Mr Debernardi who resigned on 5 April, was eligible to attend 16; Mr Moyer who retired on 30 April 2014 was eligible to attend 17.
Committee membership
At the date of this report the company has three Committees – Audit, Remuneration, and Nominations, and in addition the board has set in train the establishment of a Risk and Compliance Committee.
Members acting on the committees of the board during the year were:
Audit Remuneration Risk and Compliance Nomination
Adam Gray Member Member ‐ ‐
Paul Clark Member to 24 Sep 14 ‐ Member ‐
Robert DeVincenzi ‐ ‐ Member ‐
Michael McConnell Member to 5 Apr 14 Member Current Chair ‐
John Murphy Current Chair ‐ ‐ ‐
Herman Schwarz ‐ Member Member Current Chair
Terence Winters Member Current Chair ‐ ‐
Rob Debernardi Member to 5 Apr 14 Chair to 1 Nov 13 ‐ ‐
Albert Moyer Chair to 5 Apr 14 Member to 30 Apr 14 ‐ ‐
Full board ‐ ‐ ‐ Full board
For
per
sona
l use
onl
y
REDFLEX HOLDINGS LIMITED Annual Report 2014
DIRECTORS’ REPORT
REDFLEX – making a safer world
‐ 16 ‐
OPERATING AND FINANCIAL REVIEW
Group overview
Redflex Holdings Limited (the “Company” or “Redflex” or “Group”) commenced operation in 1995 and has been listed on the Australian Securities Exchange (ASX) since 1997.
The Redflex vision is to enhance public safety through innovative technologies with a particular focus on providing red‐light and speed photo enforcement solutions.
The Group comprises two main subsidiaries: Redflex Traffic Systems Inc, (the “North American business”, or “RTSI”) based in the USA, focuses on the large North American market; Redflex Traffic Systems Pty Ltd, (the ”Australian International business” or “RI” or “Redflex International”) based in Australia, focuses on the Australian and International markets except North America.
The principal activities during the financial year of entities within the consolidated entity were:
Provision of road safety camera programs including red light and speed photo enforcement systems and back office processing services for jurisdictions within the USA by Redflex Traffic Systems lnc; and
Manufacture and supply of traffic cameras and back office processing systems and provision of associated services to international markets outside of North America, by Redflex Traffic Systems Pty Ltd.
A Build Own Operate Maintain (BOOM) business model prevails in the USA, where Redflex provides camera systems and a comprehensive range of services to customers on a fully outsourced basis. BOOM contract terms are typically three to five years with optional extension periods.
The International business comprises a mix of product and service sales, and BOOM type contracts.
Performance indicators
Management and the board monitor the Group's overall performance, from implementation of the mission statement and strategy plan through to the performance of the Group against operating plans and financial budgets.
The board, together with management have identified key performance indicators (KPIs) which are regularly monitored by key management personnel including directors.
Operating results for the year
Revenue from operations for the Group for the financial year ended 30 June 2014 was $121.5 million, a decrease of 11.5% on the previous year revenue of $137.4 million.
EBITDA was $25.5 million, a decrease of 28.0% over the previous year EBITDA of $35.4 million.
Net operating loss before tax was $3.8 million, compared to the previous year profit before tax of $8.6 million.
Net operating loss after tax was $1.2 million, compared to the previous year profit after tax of $7.3 million.
These results were affected by a positive average AU$/US$ exchange rate movement of 10.6 % over the year.
The cash flow from operations during FY14 increased 8.7% to $29.9 million compared to $27.5 million in FY13.
For
per
sona
l use
onl
y
REDFLEX HOLDINGS LIMITED Annual Report 2014
DIRECTORS’ REPORT
REDFLEX – making a safer world
‐ 17 ‐
OPERATING AND FINANCIAL REVIEW ‐ CONTINUED
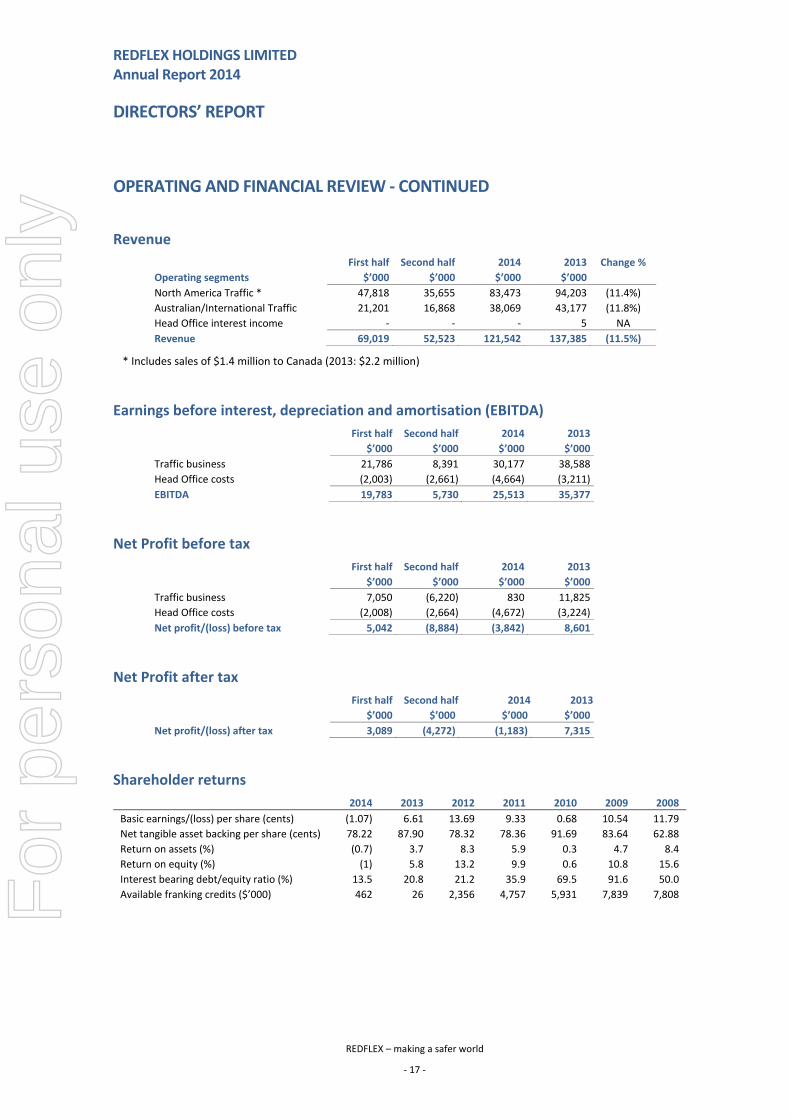
Revenue
First half Second half 2014 2013 Change %
Operating segments $’000 $’000 $’000 $’000
North America Traffic * 47,818 35,655 83,473 94,203 (11.4%)
Australian/International Traffic 21,201 16,868 38,069 43,177 (11.8%)
Head Office interest income ‐ ‐ ‐ 5 NA
Revenue 69,019 52,523 121,542 137,385 (11.5%)
* Includes sales of $1.4 million to Canada (2013: $2.2 million)
Earnings before interest, depreciation and amortisation (EBITDA)
First half Second half 2014 2013
$’000 $’000 $’000 $’000
Traffic business 21,786 8,391 30,177 38,588
Head Office costs (2,003) (2,661) (4,664) (3,211)
EBITDA 19,783 5,730 25,513 35,377
Net Profit before tax
First half Second half 2014 2013
$’000 $’000 $’000 $’000
Traffic business 7,050 (6,220) 830 11,825
Head Office costs (2,008) (2,664) (4,672) (3,224)
Net profit/(loss) before tax 5,042 (8,884) (3,842) 8,601
Net Profit after tax
First half Second half 2014 2013
$’000 $’000 $’000 $’000
Net profit/(loss) after tax 3,089 (4,272) (1,183) 7,315
Shareholder returns
2014 2013 2012 2011 2010 2009 2008
Basic earnings/(loss) per share (cents) (1.07) 6.61 13.69 9.33 0.68 10.54 11.79
Net tangible asset backing per share (cents) 78.22 87.90 78.32 78.36 91.69 83.64 62.88
Return on assets (%) (0.7) 3.7 8.3 5.9 0.3 4.7 8.4
Return on equity (%) (1) 5.8 13.2 9.9 0.6 10.8 15.6
Interest bearing debt/equity ratio (%) 13.5 20.8 21.2 35.9 69.5 91.6 50.0
Available franking credits ($’000) 462 26 2,356 4,757 5,931 7,839 7,808
For
per
sona
l use
onl
y

REDFLEX HOLDINGS LIMITED Annual Report 2014
DIRECTORS’ REPORT
REDFLEX – making a safer world
‐ 18 ‐
OPERATING AND FINANCIAL REVIEW ‐ CONTINUED
Liquidity and capital resources
The statement of cash flows illustrates that there was a decrease in cash and cash equivalents in the year ended 30 June 2014 of $7.5 million (FY13: decrease of $0.9 million). The decrease was caused by a number of factors which included the purchase of motor vehicles in order to service an Australian customer, the repayment of bank borrowings, an increase in capitalised development costs and unfavourable foreign exchange rate movements.
Operating activities generated $29.9 million (FY13: $27.5 million) of net cash in‐flows.
Cash flows used in investing activities of $23.4 million (FY13:21.5 million) reflect the purchase of motor vehicles and other assets to support ongoing customer servicing contracts, both in the International and the US operating segments and capitalised development costs.
Cash flows used in financing activities were $13.4 million (FY13: $8.7 million), of which $10.1 million (FY13: $1.0 million) was for repayment of borrowings, and $3.3 million (FY13: $7.7 million) was paid to shareholders as dividends.
Asset and capital structure
2014 2013
$’000 $’000
Debt
Interest bearing borrowings (15,895) (26,034)
Cash at bank, on hand, and restricted cash 13,749 21,246
Net debt (2,146) (4,788)
Total equity 117,766 125,250
Total capital employed 115,620 120,462
Gearing (%) 1.8% 4.0%
The Group’s level of gearing is within the limits that the board considers prudent and that the Group’s bankers consider acceptable.
Shares issued during the year
During FY14, nil shares were issued pursuant to the vesting of performance rights pertaining to executive remuneration. During the previous financial year, 416,711 shares were issued in respect of the vesting of performance rights.
Details of shares issued and performance rights vested are shown within the Remuneration Report.
Performance rights over shares
Obligations for future share‐based payments arise in relation to performance rights awarded during the year as remuneration entitlements for executives. Details are shown within the Remuneration Report.
At the date of this report there are 2,824,092 performance rights on issue. At 30 June 2014, there were 2,824,092 performance rights on issue (30 June 2013: 2,343,047). Pursuant to Mr DeVincenzi’s transition arrangements announced to ASX on 17 July 2013, Mr DeVincenzi waived his 129,323 performance rights and the forfeiture was taken into account in the financial results reported at 30 June 2013.
Options over shares
At the date of this report there are no options on issue (FY13: 3,000,000).
For
per
sona
l use
onl
y
REDFLEX HOLDINGS LIMITED Annual Report 2014
DIRECTORS’ REPORT
REDFLEX – making a safer world
‐ 19 ‐
OPERATING AND FINANCIAL REVIEW ‐ CONTINUED
Profile of debts
At 30 June 2014, the Group had a US$70 million (AU$74.3 million) secured revolving credit facility, together with an AU$8 million working capital facility to address international and local business opportunities
The total drawn amount at 30 June 2014 was US$15.0 million (AU$15.9 million). The total amount drawn at 30 June 2013 was US$25 million (AU$26.0 million). The net debt position of the Group at 30 June 2014 was $2.1 million (including restricted cash of $3.7 million).
The Syndicated Financing Facility was renewed on 8 August 2014 for a further three years with the existing syndicate of three Australian banks. The revised facility is a US$30 million loan (AU$31.8 million), with an accordion feature for a further US$30 million (AU$31.8 million) which is uncommitted. In addition, the Company retained the AU$8.0 million working capital facility for bank guarantees and bonds required to support bids and contracts with certain customers.
The reduction in the facility limit was decided based on the current lack of need to draw down the facility, and the holding costs of carrying an unutilised facility.
Capital expenditure
Capital expenditure for the year was $16.0 million (FY13: $14.5 million) This was spent on additional equipment required to service the “BOOM” customer base, including motor vehicles to service an Australian customer’s mobile speed detection requirements.
The North American Traffic business entity, Redflex Traffic Systems Inc, owns the capital assets located at intersections with the exception of those in Chicago, and derives recurring revenue streams from either: (i) fixed or variable monthly rentals that are based on red light and/or speed ticket infringements that have been paid or have been issued; or, (ii) monthly fixed fees.
Treasury policy
Redflex Holdings Limited coordinates the Group’s treasury function and is responsible for managing currency risks and finance facilities. It operates within policies set by the board which has the responsibility for ensuring management’s actions are in line with Group policy.
Transaction hedging is undertaken by using foreign exchange contracts and hedges where significant exposures have been identified. Translation effects are not hedged. In line with Group policy, interest rate exposures are not hedged.
Risk management
The Group takes a proactive approach to risk management. Through the Audit and Risk Management Committee the board is responsible for ensuring that risks, and also opportunities, are identified on a timely basis and that activities are aligned with objectives. The board regularly monitors operational and financial performance against budgets and other key performance measures. The board reviews and receives advice on operational and financial risks. Appropriate risk management strategies are developed to mitigate the significant identified risks of the business.
The board has a number of mechanisms in place to ensure that management’s objectives and activities are aligned with the risks identified by the board including:
Board approval of a strategic plan which encompasses the Group’s vision, mission and strategy and is designed to meet stakeholders’ needs and manage business risk; and
Implementation of board approved operating plans and budgets and board monitoring of progress against these budgets, including the establishment and monitoring of key performance indicators of both a financial and non‐financial nature.
For
per
sona
l use
onl
y
REDFLEX HOLDINGS LIMITED Annual Report 2014
DIRECTORS’ REPORT
REDFLEX – making a safer world
‐ 20 ‐
OPERATING AND FINANCIAL REVIEW – CONTINUED
Risk management ‐ continued
Risks Related To Our Business
The following risks have been identified as those most likely to have a significant effect on the Company’s performance in future periods, predominantly within the USA:
1. Banning or restrictive legislation may be enacted in some geographies caused by citizen backlash or local political actions counter to the Company’s interests.
Company strategy to mitigate – The Company maintains an active communications and legislative affairs program to minimise the risks associated with adverse legislation. The program is focused on developing local traffic safety advocacy groups, developing political support at a local, state or provincial level and communicating the safety and efficacy of automated traffic enforcement systems to the public.
2. Potential legal action challenging the validity of our enforcement programs, causing us significant costs to defend.
Company strategy to mitigate – In combination with our client agencies, the Company maintains an active outreach and communications program to communicate photo enforcement effectiveness and validity to the public. Further, the Company maintains an internal and external set of legal resources that represent and defend the Company’s interests from adverse legal actions.
3. Certain entities in the Group are party to various legal class actions and claims which arise in the ordinary course of business.
Company strategy to mitigate –The board and the Company’s legal advisers closely monitor these actions. Further, the Company maintains an internal and external set of legal resources that represent and defend the Company’s interests from adverse legal actions.
4. The potential contagion effect of our internal investigative disclosures may impact our ability to continue to retain existing customers and win new contracts.
Company strategy to mitigate – The Company has adopted, implemented and publicised a comprehensive remediation program to further strengthen our internal compliance and reporting systems to assure the confidence of our customers. The Company has also administered an intensive communications program with our client agencies to provide periodic updates on our actions and to seek input.
5. If we are unable to safeguard the integrity, security and privacy of our data or our customers’ data, our business could be disrupted and our reputation impaired.
Company strategy to mitigate – The Company utilises sophisticated methods, standards and technologies to address our customer data integrity and security needs, as stated in their respective procurement documents.
6. The uneven nature of our contracts outside of the North American business make it difficult to predict our future performance.
Company strategy to mitigate – As a result of an effective sales and marketing strategy, the Company has been steadily improving its market coverage and installed base of systems installed over prior years. In addition to achieving some level of geographic market diversification, the Company has also pursued steps necessary to increase as a percentage of total revenue, the recurring revenue that comes from service and maintenance agreements. The uneven nature of our international contracts is not due to the Company’s actions, but rather due to the characteristics of the market.
7. Other parties may claim that our products or services infringe the proprietary rights of others.
Company strategy to mitigate – The Company vigorously defends against unjustified and unsubstantiated patent infringement claims made from time to time. The research and development focus of the Company is to engage in the innovative development of unique technologies that are based on Company innovation or prior art. Where necessary the Company seeks and maintains patent protection on strategically valuable Intellectual property.
Commercial risks relating to credit risk, interest rate risk, exchange rate risk and liquidity risks are presented in the Financial Risk Management Objectives and Policies note described in Note 3 of the Financial Statements.
For
per
sona
l use
onl
y
REDFLEX HOLDINGS LIMITED Annual Report 2014
DIRECTORS’ REPORT
REDFLEX – making a safer world
‐ 21 ‐
SIGNIFICANT EVENTS AFTER THE BALANCE DATE
On 25 September 2014 Redflex Holdings Limited announced the appointment of Mr Paul Clark as Group Chief Executive Officer on a one‐year agreement commencing on 25 September 2014. Mr Clark subsequently resigned from his position of Non executive director at this date. The key terms of his contractual arrangements are as follows:‐
Mr Clark is entitled to be paid a salary of $400,000 per annum plus superannuation.
At the conclusion of his first year of service (30 September 2015), Mr Clark will also be entitled to an incentive payment of between 30% and 100% of his salary, depending on his achievement of agreed objectives, within 30 days of 30 September 2015. The incentive will be payable in performance rights (50% of which vest one year after grant and the remaining 50% of which vest two years after grant). If payment of Mr Clark’s incentive in performance rights is not approved by shareholders, then the Company will pay his incentive in cash.
The agreement may be terminated by the CEO with 6 month's prior notice, or by the Company making a payment equivalent to the CEO's remuneration until the expiration of the term. Summary termination is permitted for gross misconduct.
There were no other significant events subsequent to 30 June 2014 and prior to the date of this report, other than the renewal of the financing facility as described in the Operating and Financial Review section of the Director’s Report and also in Note 17 of the consolidated financial statements.
ENVIRONMENTAL REGULATION AND PERFORMANCE
The directors are not aware of any breaches of environmental legislation or regulations to which the Group is subject.
INDEMNIFICATION AND INSURANCE OF DIRECTORS AND OFFICERS
The company has agreed to indemnify the current directors of the company: Adam Gray, Paul Clark, Robert DeVincenzi, Michael McConnell, John Murphy, Herman Schwarz and Terence Winters, and the Company Secretary and all executive officers of the company and any related body corporate, against any liability that may arise from their positions within the company.
Redflex Holdings Limited, being the ultimate parent company, paid premiums in respect of directors’ and officers’ liability insurance during the financial year. The contract of insurance does not include details of premiums paid in respect of individual officers of the company and prohibits disclosure of the amount of the premium paid.
During the year or since the end of the year the Company has not indemnified nor agreed to indemnify any auditor of the company or any related entity against a liability that may arise in their capacity as an auditor.
ROUNDING
The amounts contained in this report and in the financial report have been rounded to the nearest $1,000 (where rounding is applicable) under the option available to the company under ASIC Class Order 98/100.
AUDITOR INDEPENDENCE
The directors received the declaration on the following page from the auditor of Redflex Holdings Limited. This auditor’s declaration forms part of the Directors’ Report.
For
per
sona
l use
onl
y

REDFLEX HOLDINGS LIMITED Annual Report 2014
DIRECTORS’ REPORT
REDFLEX – making a safer world
‐ 22 ‐
NON AUDIT SERVICES
From time to time non‐audit services are provided by the Company’s auditor, Ernst & Young. The directors are satisfied that the provision of any non‐audit services is compatible with the general standard of independence for auditors imposed by the Corporations Act 2001. The nature and scope of each type of non‐audit service provided means that auditor independence was not compromised.
Total non‐audit, remuneration related services provided by Ernst & Young in FY14 was $Nil (FY13 $Nil).
For
per
sona
l use
onl
y

A member firm of Ernst & Young Global LimitedLiability limited by a scheme approved under Professional Standards Legislation
Auditor’s Independence Declaration to the Directors of RedflexHoldings Limited
In relation to our audit of the financial report of Redflex Holdings Limited for the financial yearended 30 June 2014, to the best of my knowledge and belief, there have been no contraventions ofthe auditor independence requirements of the Corporations Act 2001 or any applicable code ofprofessional conduct.
Ernst & Young
Ashley ButlerPartner30 September 2014
Ernst & Young8 Exhibition StreetMelbourne VIC 3000 AustraliaGPO Box 67 Melbourne VIC 3001
Tel: +61 3 9288 8000Fax: +61 3 8650 7777ey.com/au
For
per
sona
l use
onl
y
REDFLEX HOLDINGS LIMITED Annual Report 2014
DIRECTORS’ REPORT
REDFLEX – making a safer world
‐ 24 ‐
REMUNERATION REPORT (AUDITED)
This remuneration report for the year ended 30 June 2014 outlines the remuneration arrangements of the Company and the Group in accordance with the requirements of the Corporations Act 2001 and its Regulations. This information has been audited as required by section 308(3C) of the Act.
The remuneration report is presented in the following sections:
1. Introduction
2. Remuneration governance
3. Executive remuneration arrangements:
a. Remuneration principles and strategy
b. Approach to setting remuneration
c. Detail of incentive plans
4. Executive remuneration outcomes for 2014 (including link to performance)
5. Summary of executive contractual arrangements
6. Non‐executive director remuneration arrangements
a. Remuneration policy for non‐executive directors
b. Structure of non‐executive director remuneration
c. Contractual arrangements with interim chairman
7. Additional disclosures relating to options and shares
8. Other transactions and balances with key management personnel and their related parties.
9. Subsequent events
1 INTRODUCTION
The remuneration report details the remuneration arrangements for key management personnel (KMP) who are defined as those persons having authority and responsibility for planning, directing and controlling the major activities of the Company and the Group, directly or indirectly, including any director (whether executive or otherwise) of the parent company.
For the purposes of this report, the term ‘executive’ includes the Group Chief Executive Officer, the Group Chief Financial Officer, the Chief Executive Officers of the two operating subsidiaries, and the Company Secretary of the parent for the year ending 30 June 2014.
For
per
sona
l use
onl
y

REDFLEX HOLDINGS LIMITED Annual Report 2014
DIRECTORS’ REPORT
REDFLEX – making a safer world
‐ 25 ‐
REMUNERATION REPORT (AUDITED) ‐ CONTINUED
1 INTRODUCTION ‐ CONTINUED
Directors and key management personnel
Non‐executive directors
Adam Gray Chairman (non‐executive) appointed 19 December 2013, and appointed Chair 6 February 2014
Paul Clark 1 Director (non‐executive) appointed 5 April 2014
Robert DeVincenzi Director (non‐executive) transitioned on 16 January 2014
Michael McConnell Director (non‐executive)
John Murphy Director (non‐executive) appointed 5 April 2014
Terence Winters Director (non‐executive) appointed 7 August 2013
Herman Schwarz Director (non‐executive) appointed 1 May 2014
Executives
Ron Johnson 2 Group Chief Financial Officer
Ricardo Fiusco Chief Executive Officer, Redflex International (RI), appointed to position 31 July 2013
James Saunders 3 Chief Executive Officer, Redflex Traffic Systems Inc, (RTSI) appointed to position 17 July 2013
Marilyn Stephens Company Secretary
Former KMP
Non‐executive directors
Robin Debernardi Director (non‐executive) resigned 5 April 2014
Albert Moyer Director (non‐executive) resigned 30 April 2014
Executives
Robert DeVincenzi 4 Group Chief Executive Officer until 16 January 2014
Simon Pickup 5 Redflex Enforcement Services Business Unit Manager, NSW
1 Mr Clark was appointed as a Non executive Director on 5 April 2014 and then subsequently appointed to the role of Group Chief Executive Officer on 25 September 2014. Details of Mr Clark’s appointment are disclosed in this report in section 9 ‐ Subsequent events. This disclosure in the remuneration report details Mr Clark’s remuneration for his term as Non executive Director for the period from his appointment on 5 April 2014 to the reporting date of 30 June 2014.
2 Mr Johnson fulfilled the role of Interim Group Chief Operating Officer for the period 16 January to 16 July 2014. Details regarding the Mr Johnson’s remuneration for performing this additional role is included in this report.
3 Mr Saunders became a KMP upon his appointment to the position of CEO of RTSI, on 17 July 2013. Prior to this date, Mr Saunders was employed in a managerial capacity.
4 Mr DeVincenzi was the Group CEO until 16 January 2014 when he transitioned to a consulting role whilst remaining a member of the board as a non‐executive director. Details regarding the transition agreement with Mr DeVincenzi are included in the relevant sections of this report.
5 Mr Pickup remains an employee of the Group, however he is not considered a KMP for the purposes of the FY14 remuneration report.
For
per
sona
l use
onl
y
REDFLEX HOLDINGS LIMITED Annual Report 2014
DIRECTORS’ REPORT
REDFLEX – making a safer world
‐ 26 ‐
REMUNERATION REPORT (AUDITED) ‐ CONTINUED
2 REMUNERATION GOVERNANCE
Remuneration Committee
The remuneration committee comprises four non‐executive directors (NED) including three independent directors.
The remuneration committee has been delegated decision making authority for some matters related to the remuneration arrangements for NEDs and executives, and is required to make recommendations to the board on other matters.
Specifically, the Redflex policy is that the board approves the remuneration arrangements of the Group CEO and other executives and all awards made under the Long Term Incentive Plan (LTIP), following recommendations from the remuneration committee. The board also sets the aggregate remuneration for NEDs, which is then subject to shareholder approval, and sets fee levels for individual NEDs. The remuneration committee approves the level of the Group Short Term Incentives (STI) pool, having regard to the recommendations made by the CEOs.
The remuneration committee meets at appropriate times during the year. On invitation, the Group CEO attends certain remuneration committee meetings where management input is required but the Group CEO is not present during any discussions related to his own remuneration arrangements.
The remuneration committee continues to review the approach to executive remuneration and the rewards available to KMPs for delivering the key business objectives. Further information on the remuneration committee’s role, responsibilities and membership is on line at www.redflex.com.au.
Use of remuneration consultants
To ensure the remuneration committee is fully informed when making remuneration decisions, it periodically seeks external remuneration advice on strategy and processes to ensure best practice and to benchmark remuneration arrangements against the industry and the markets in which Redflex operates.
Remuneration report shareholder vote
The resolution to accept the remuneration report at the 2013 AGM was passed by 52.3% of votes cast. As this was less than a 75% majority, and, as the remuneration report resolution put to shareholders at the 2012 AGM was also approved by less than a 75% majority (61.9%), the Company received a ‘second strike’. This resulted in a ‘spill’ resolution being put to shareholders at the 2013 AGM. The spill resolution was defeated as more than 50% of shareholders voted against it.
During 2014, the remuneration committee has continued to assess the appropriateness of the Company’s remuneration policies and competitiveness, with particular focus on executive remuneration to ensure it aligns executive reward with the Company's strategy and performance against key business goals and objectives. No changes were made to compensation policy for the Board or KMP during the year.
Having noted this, the Board is committed to further elevating the links between strategy, performance and compensation for key management personnel and to ensure there is demonstrable alignment between the Board and shareholders.
Our Long‐Term Incentive Plan is designed to provide equity based incentives to key management. The key principle is that if shareholders benefit, then so should our executive team. Conversely, if there is no shareholder gain, neither should there be any gains by management.
The Board has agreed to implement the following:
100% of our CEO’s incentive is proposed to be paid via performance rights that vest over a four year period. The CEO is expected to accumulate and hold vested performance rights equal to at least 500,000 shares in the company over time.
Direct KMP reports to the CEO are likewise expected to accumulate and hold vested performance rights equal to at least 300,000 shares over a four year period.
Board members are required to acquire shares in the Company on market to the value of 25% of their annual fees and are encouraged to accumulate 150,000 shares in the Company over a four year period.
For
per
sona
l use
onl
y
REDFLEX HOLDINGS LIMITED Annual Report 2014
DIRECTORS’ REPORT
REDFLEX – making a safer world
‐ 27 ‐
REMUNERATION REPORT (AUDITED) ‐ CONTINUED
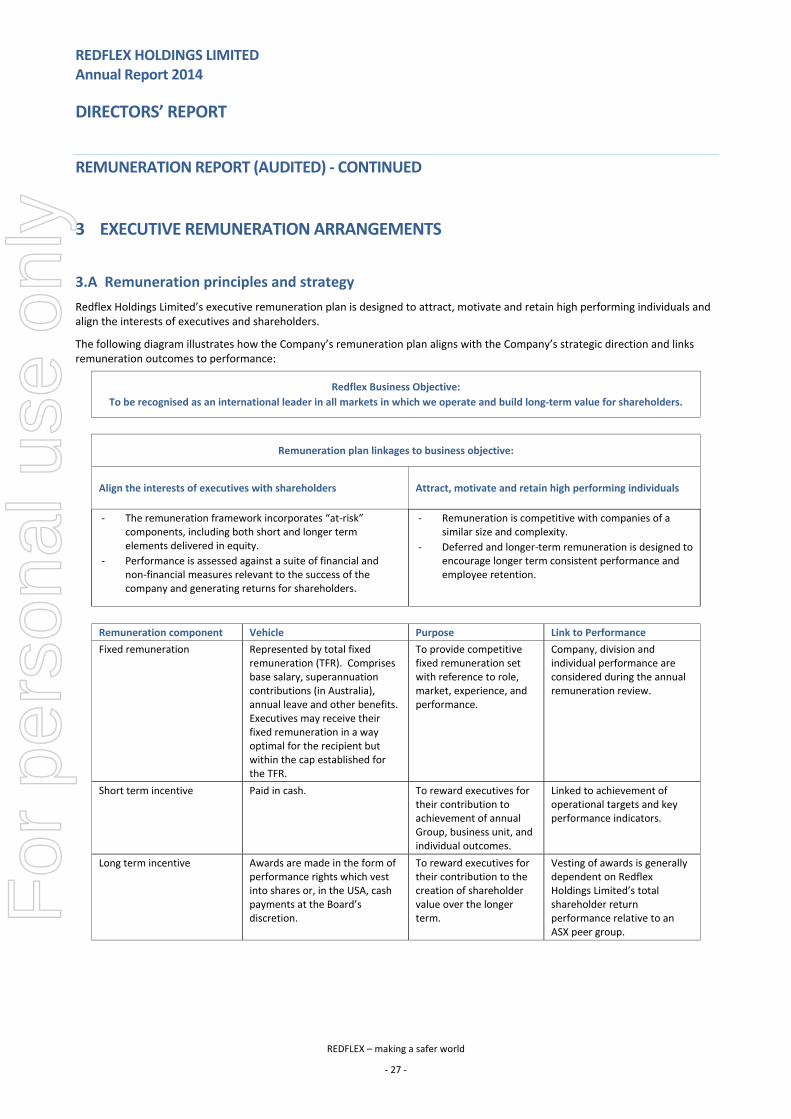
3 EXECUTIVE REMUNERATION ARRANGEMENTS
3.A Remuneration principles and strategy
Redflex Holdings Limited’s executive remuneration plan is designed to attract, motivate and retain high performing individuals and align the interests of executives and shareholders.
The following diagram illustrates how the Company’s remuneration plan aligns with the Company’s strategic direction and links remuneration outcomes to performance:
Redflex Business Objective:
To be recognised as an international leader in all markets in which we operate and build long‐term value for shareholders.
Remuneration plan linkages to business objective:
Align the interests of executives with shareholders Attract, motivate and retain high performing individuals
‐ The remuneration framework incorporates “at‐risk” components, including both short and longer term elements delivered in equity.
‐ Performance is assessed against a suite of financial and non‐financial measures relevant to the success of the company and generating returns for shareholders.
‐ Remuneration is competitive with companies of a similar size and complexity.
‐ Deferred and longer‐term remuneration is designed to encourage longer term consistent performance and employee retention.
Remuneration component Vehicle Purpose Link to Performance
Fixed remuneration Represented by total fixed remuneration (TFR). Comprises base salary, superannuation contributions (in Australia), annual leave and other benefits. Executives may receive their fixed remuneration in a way optimal for the recipient but within the cap established for the TFR.
To provide competitive fixed remuneration set with reference to role, market, experience, and performance.
Company, division and individual performance are considered during the annual remuneration review.
Short term incentive Paid in cash. To reward executives for their contribution to achievement of annual Group, business unit, and individual outcomes.
Linked to achievement of operational targets and key performance indicators.
Long term incentive Awards are made in the form of performance rights which vest into shares or, in the USA, cash payments at the Board’s discretion.
To reward executives for their contribution to the creation of shareholder value over the longer term.
Vesting of awards is generally dependent on Redflex Holdings Limited’s total shareholder return performance relative to an ASX peer group.
For
per
sona
l use
onl
y
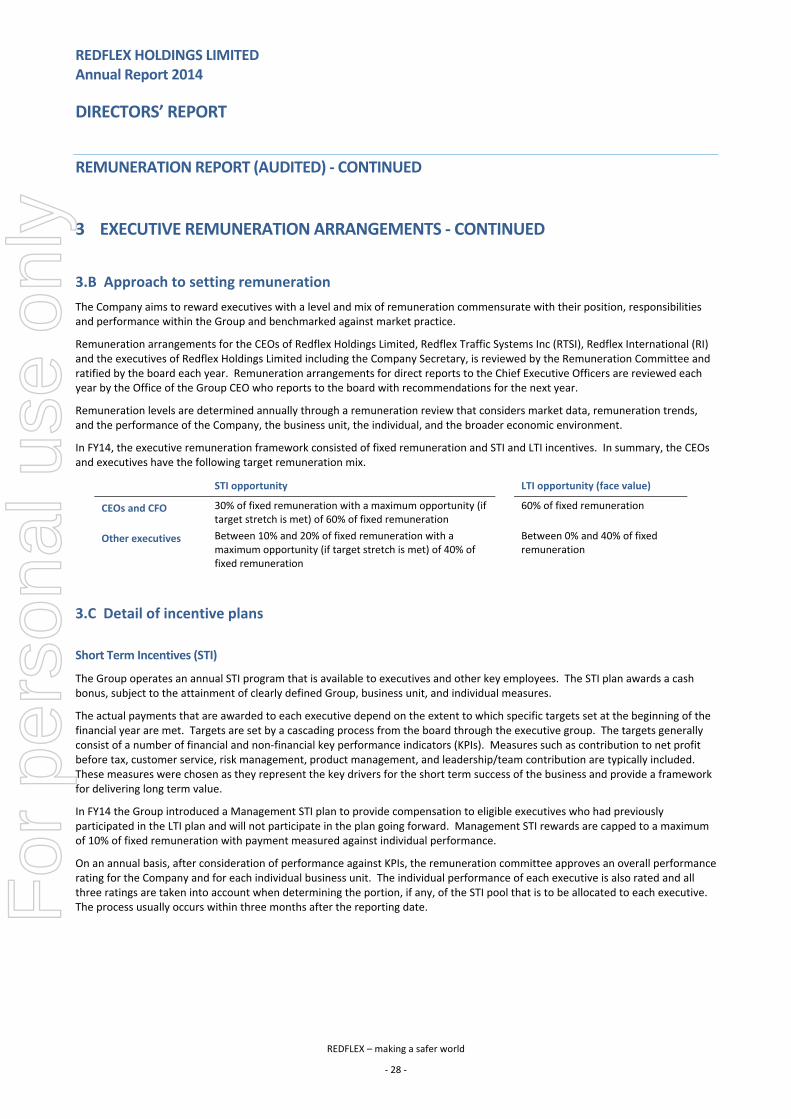
REDFLEX HOLDINGS LIMITED Annual Report 2014
DIRECTORS’ REPORT
REDFLEX – making a safer world
‐ 28 ‐
REMUNERATION REPORT (AUDITED) ‐ CONTINUED
3 EXECUTIVE REMUNERATION ARRANGEMENTS ‐ CONTINUED
3.B Approach to setting remuneration
The Company aims to reward executives with a level and mix of remuneration commensurate with their position, responsibilities and performance within the Group and benchmarked against market practice.
Remuneration arrangements for the CEOs of Redflex Holdings Limited, Redflex Traffic Systems Inc (RTSI), Redflex International (RI) and the executives of Redflex Holdings Limited including the Company Secretary, is reviewed by the Remuneration Committee and ratified by the board each year. Remuneration arrangements for direct reports to the Chief Executive Officers are reviewed each year by the Office of the Group CEO who reports to the board with recommendations for the next year.
Remuneration levels are determined annually through a remuneration review that considers market data, remuneration trends, and the performance of the Company, the business unit, the individual, and the broader economic environment.
In FY14, the executive remuneration framework consisted of fixed remuneration and STI and LTI incentives. In summary, the CEOs and executives have the following target remuneration mix.
STI opportunity LTI opportunity (face value)
CEOs and CFO 30% of fixed remuneration with a maximum opportunity (if target stretch is met) of 60% of fixed remuneration
60% of fixed remuneration
Other executives Between 10% and 20% of fixed remuneration with a maximum opportunity (if target stretch is met) of 40% of fixed remuneration
Between 0% and 40% of fixed remuneration
3.C Detail of incentive plans
Short Term Incentives (STI)
The Group operates an annual STI program that is available to executives and other key employees. The STI plan awards a cash bonus, subject to the attainment of clearly defined Group, business unit, and individual measures.
The actual payments that are awarded to each executive depend on the extent to which specific targets set at the beginning of the financial year are met. Targets are set by a cascading process from the board through the executive group. The targets generally consist of a number of financial and non‐financial key performance indicators (KPIs). Measures such as contribution to net profit before tax, customer service, risk management, product management, and leadership/team contribution are typically included. These measures were chosen as they represent the key drivers for the short term success of the business and provide a framework for delivering long term value.
In FY14 the Group introduced a Management STI plan to provide compensation to eligible executives who had previously participated in the LTI plan and will not participate in the plan going forward. Management STI rewards are capped to a maximum of 10% of fixed remuneration with payment measured against individual performance.
On an annual basis, after consideration of performance against KPIs, the remuneration committee approves an overall performance rating for the Company and for each individual business unit. The individual performance of each executive is also rated and all three ratings are taken into account when determining the portion, if any, of the STI pool that is to be allocated to each executive. The process usually occurs within three months after the reporting date.
For
per
sona
l use
onl
y

REDFLEX HOLDINGS LIMITED Annual Report 2014
DIRECTORS’ REPORT
REDFLEX – making a safer world
‐ 29 ‐
REMUNERATION REPORT (AUDITED) ‐ CONTINUED
3 EXECUTIVE REMUNERATION ARRANGEMENTS ‐ CONTINUED
3.C Detail of incentive plans (continued)
Long Term Incentives (LTI)
LTI awards are issued annually to executives in order to align remuneration with the creation of shareholder value over the long term. Accordingly, LTI awards are made only to key management personnel who can impact the Group’s performance against the relevant long‐term performance measure.
Structure
LTI awards are made under the Company’s LTI Plan, the rules of which are published on www.redflex.com. LTI awards are generally made annually in the form of performance rights that vest after three years subject to meeting the performance measure, with no opportunity to retest.
Performance Measure to determine vesting
The company uses relative total shareholder return (TSR) as the performance measure for the LTI Plan.
Relative TSR was selected as the LTI performance measure for the following reasons:
TSR ensures an alignment between comparative shareholder return and reward for executives;
The relative measure minimises the effects of market cycles.
For LTI awards granted in FY14, the peer group chosen for the comparison is the S&P/ASX300 constituents at the start of the performance period, despite a different approach for FY13 as shown below. This approach was used to simplify the plan and provide better transparency and tracking of actual performance versus the index, for executives in the plan.
For LTI awards granted in FY13, the peer group was the comparator group which comprised the S&P/ASX 300 index companies excluding companies that are in the Financial and Metals and Mining GICS (Global Industry Classification Standard) sector, at grant date. This reduced peer group was used in FY13 in an attempt to acknowledge the difference in sharemarket volatility between the excluded sector, and the remainder of the companies within the index.
The Group’s performance is determined according to Redflex Holdings Limited’s ranking against the companies in the TSR peer group over the performance period.
The vesting schedule is as follows:
Relative TSR performance outcome Percentage of award that will vest
Below the 50th percentile 0%
At the 50th percentile (target performance) 50%
Between the 50th and 75th percentile Straight line vesting between 50‐100%
At or above the 75th percentile 100%
TSR performance is monitored by an independent external adviser at 1 October each year.
Table 3 in section 7 provides details of LTIs awarded and vested during the year and Table 4 in section 7 provides details of the value of LTIs awarded, vested and lapsed during the year.
Change of control provisions
In the event of a change of control of the Group, the performance period end date will generally be brought forward to the date of the change of control, and awards will vest pro rata subject to performance over this shortened period and also subject to ultimate board discretion.
For
per
sona
l use
onl
y
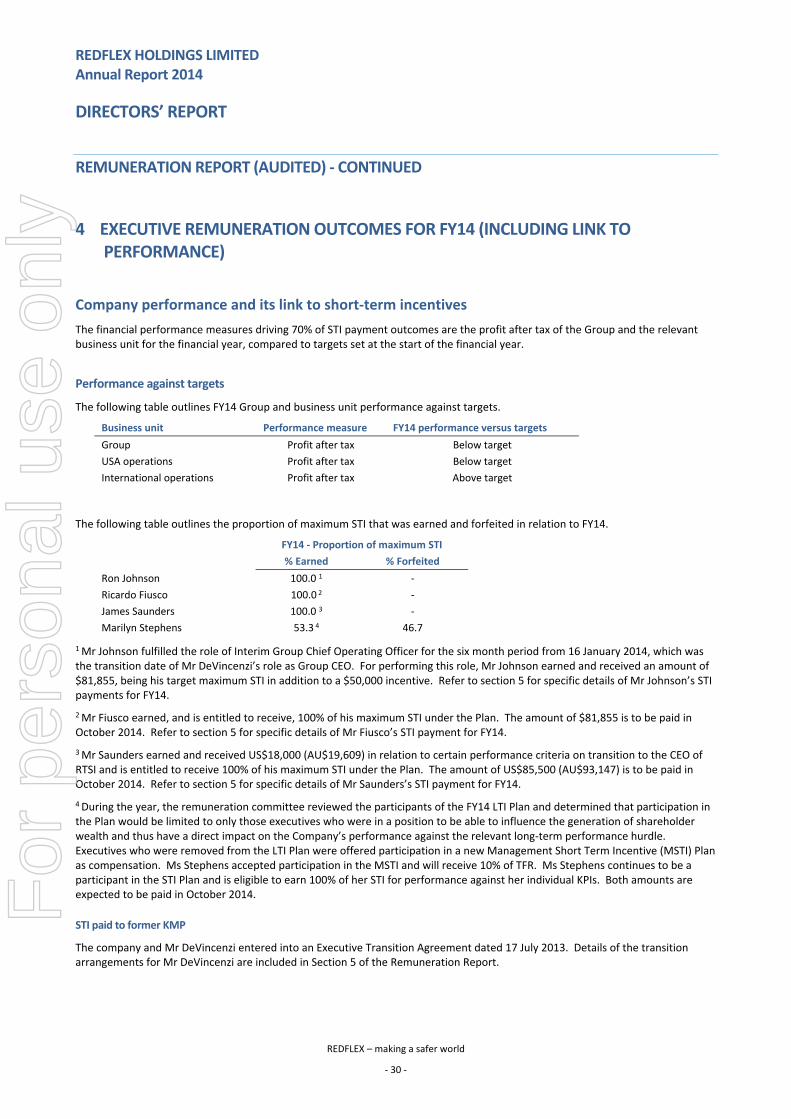
REDFLEX HOLDINGS LIMITED Annual Report 2014
DIRECTORS’ REPORT
REDFLEX – making a safer world
‐ 30 ‐
REMUNERATION REPORT (AUDITED) ‐ CONTINUED
4 EXECUTIVE REMUNERATION OUTCOMES FOR FY14 (INCLUDING LINK TO PERFORMANCE)
Company performance and its link to short‐term incentives
The financial performance measures driving 70% of STI payment outcomes are the profit after tax of the Group and the relevant business unit for the financial year, compared to targets set at the start of the financial year.
Performance against targets
The following table outlines FY14 Group and business unit performance against targets.
Business unit Performance measure FY14 performance versus targets
Group Profit after tax Below target
USA operations Profit after tax Below target
International operations Profit after tax Above target
The following table outlines the proportion of maximum STI that was earned and forfeited in relation to FY14.
FY14 ‐ Proportion of maximum STI
% Earned % Forfeited
Ron Johnson 100.0 1 ‐
Ricardo Fiusco 100.0 2 ‐
James Saunders 100.0 3 ‐
Marilyn Stephens 53.3 4 46.7
1 Mr Johnson fulfilled the role of Interim Group Chief Operating Officer for the six month period from 16 January 2014, which was the transition date of Mr DeVincenzi’s role as Group CEO. For performing this role, Mr Johnson earned and received an amount of $81,855, being his target maximum STI in addition to a $50,000 incentive. Refer to section 5 for specific details of Mr Johnson’s STI payments for FY14.
2 Mr Fiusco earned, and is entitled to receive, 100% of his maximum STI under the Plan. The amount of $81,855 is to be paid in October 2014. Refer to section 5 for specific details of Mr Fiusco’s STI payment for FY14.
3 Mr Saunders earned and received US$18,000 (AU$19,609) in relation to certain performance criteria on transition to the CEO of RTSI and is entitled to receive 100% of his maximum STI under the Plan. The amount of US$85,500 (AU$93,147) is to be paid in October 2014. Refer to section 5 for specific details of Mr Saunders’s STI payment for FY14.
4 During the year, the remuneration committee reviewed the participants of the FY14 LTI Plan and determined that participation in the Plan would be limited to only those executives who were in a position to be able to influence the generation of shareholder wealth and thus have a direct impact on the Company’s performance against the relevant long‐term performance hurdle. Executives who were removed from the LTI Plan were offered participation in a new Management Short Term Incentive (MSTI) Plan as compensation. Ms Stephens accepted participation in the MSTI and will receive 10% of TFR. Ms Stephens continues to be a participant in the STI Plan and is eligible to earn 100% of her STI for performance against her individual KPIs. Both amounts are expected to be paid in October 2014.
STI paid to former KMP
The company and Mr DeVincenzi entered into an Executive Transition Agreement dated 17 July 2013. Details of the transition arrangements for Mr DeVincenzi are included in Section 5 of the Remuneration Report.
For
per
sona
l use
onl
y

REDFLEX HOLDINGS LIMITED Annual Report 2014
DIRECTORS’ REPORT
REDFLEX – making a safer world
‐ 31 ‐
REMUNERATION REPORT (AUDITED) ‐ CONTINUED
4 EXECUTIVE REMUNERATION OUTCOMES FOR FY14 (INCLUDING LINK TO PERFORMANCE) ‐ CONTINUED
Company performance and its link to LTI
The performance measure that drives LTI vesting for awards made in FY14, and awards made in all years except FY13, is Redflex's TSR performance relative to the TSR of companies in the S&P/ASX 300 index. The comparator group for the FY13 award was the S&P/ASX 300 index excluding the Financials Sector, Metal and Mining Industry companies.
Redflex share price performance relative to the indices
During the 10 year period to 30 June 2014, the S&P/ASX300 Accumulation Index increased by 133%. The market performance of a Redflex share over the same period was a negative 49%.
During the two years to 30 June 2014 the S&P/ASX300 Accumulation Index (excluding Financials Sector, Metal and Mining Industry companies) increased by 22%. The market performance of a Redflex share over the same period was a negative 48%.
Based on Redflex’s share performance, as shown above:
Performance rights in relation to the performance period which completed during the financial year did not vest; and
Performance rights in relation to a performance period which will complete in FY15 are not expected to vest.
LTI vesting outcomes
The table below outlines both vesting and expected outcomes for outstanding awards in FY14. Projected outcomes for awards still to be tested are based on assuming a median ranking.
FY11 grant (1 Oct 2010)
FY12 grant (1 Oct 2011)
FY13 grant (1 Oct 2012)
FY14 grant (16 May 2014)
Relative TSR performance
31% Expect < 50% Median ranking Median ranking
Implication for vesting Testing date 1 Oct 2013; Nil vested. 526,164 performance rights
lapsed
At testing date 1 Oct 2014, it is likely nil will
vest and all performance rights will
lapse.
At testing date 1 Oct 2015, 50% of awards will vest if median ranking
achieved.
At testing date 1 Oct 2016, 50% of awards will vest if median ranking achieved.
For
per
sona
l use
onl
y
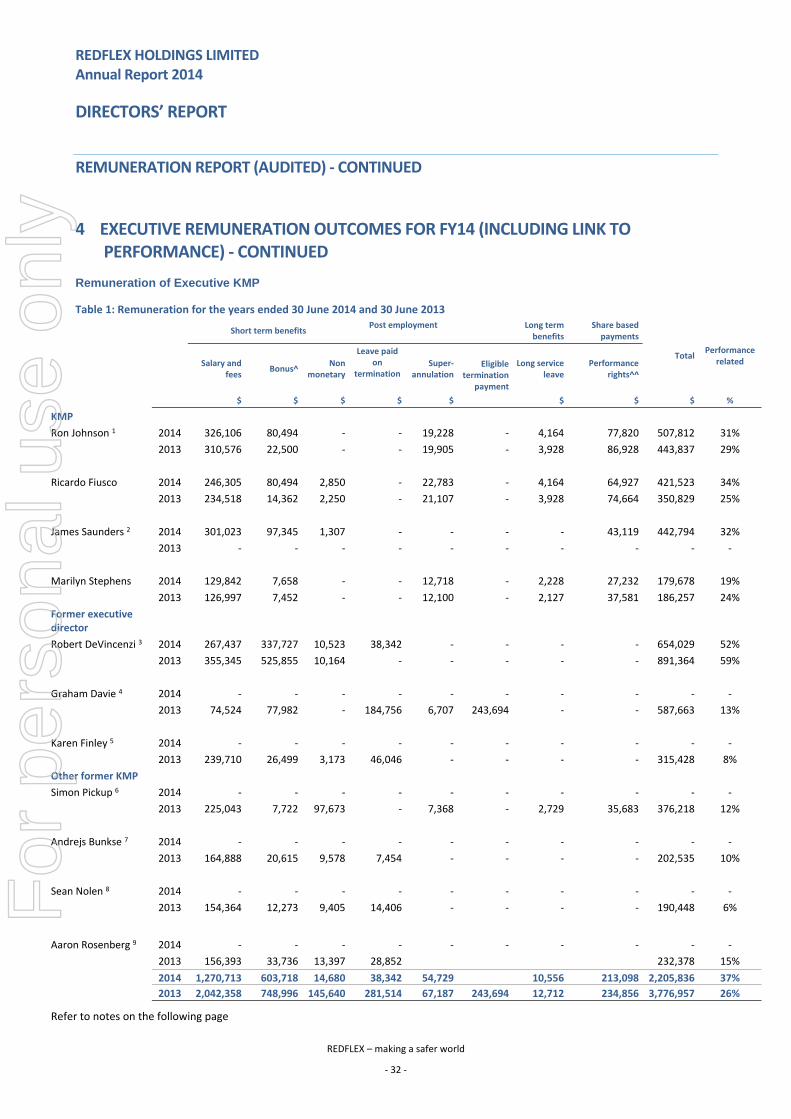
REDFLEX HOLDINGS LIMITED Annual Report 2014
DIRECTORS’ REPORT
REDFLEX – making a safer world
‐ 32 ‐
REMUNERATION REPORT (AUDITED) ‐ CONTINUED
4 EXECUTIVE REMUNERATION OUTCOMES FOR FY14 (INCLUDING LINK TO PERFORMANCE) ‐ CONTINUED
Remuneration of Executive KMP
Table 1: Remuneration for the years ended 30 June 2014 and 30 June 2013
Short term benefits Post employment Long term
benefits Share based payments
TotalPerformance
related
Salary and fees
Bonus^ Non
monetary
Leave paid on
termination Super‐
annulationEligible
termination payment
Long service leave
Performance rights^^
$ $ $ $ $ $ $ $ %
KMP
Ron Johnson 1 2014 326,106 80,494 ‐ ‐ 19,228 ‐ 4,164 77,820 507,812 31%
2013 310,576 22,500 ‐ ‐ 19,905 ‐ 3,928 86,928 443,837 29%
Ricardo Fiusco 2014 246,305 80,494 2,850 ‐ 22,783 ‐ 4,164 64,927 421,523 34%
2013 234,518 14,362 2,250 ‐ 21,107 ‐ 3,928 74,664 350,829 25%
James Saunders 2 2014 301,023 97,345 1,307 ‐ ‐ ‐ ‐ 43,119 442,794 32%
2013 ‐ ‐ ‐ ‐ ‐ ‐ ‐ ‐ ‐ ‐
Marilyn Stephens 2014 129,842 7,658 ‐ ‐ 12,718 ‐ 2,228 27,232 179,678 19%
2013 126,997 7,452 ‐ ‐ 12,100 ‐ 2,127 37,581 186,257 24%
Former executive director
Robert DeVincenzi 3 2014 267,437 337,727 10,523 38,342 ‐ ‐ ‐ ‐ 654,029 52%
2013 355,345 525,855 10,164 ‐ ‐ ‐ ‐ ‐ 891,364 59%
Graham Davie 4 2014 ‐ ‐ ‐ ‐ ‐ ‐ ‐ ‐ ‐ ‐
2013 74,524 77,982 ‐ 184,756 6,707 243,694 ‐ ‐ 587,663 13%
Karen Finley 5 2014 ‐ ‐ ‐ ‐ ‐ ‐ ‐ ‐ ‐ ‐
2013 239,710 26,499 3,173 46,046 ‐ ‐ ‐ ‐ 315,428 8%
Other former KMP
Simon Pickup 6 2014 ‐ ‐ ‐ ‐ ‐ ‐ ‐ ‐ ‐ ‐
2013 225,043 7,722 97,673 ‐ 7,368 ‐ 2,729 35,683 376,218 12%
Andrejs Bunkse 7 2014 ‐ ‐ ‐ ‐ ‐ ‐ ‐ ‐ ‐ ‐
2013 164,888 20,615 9,578 7,454 ‐ ‐ ‐ ‐ 202,535 10%
Sean Nolen 8 2014 ‐ ‐ ‐ ‐ ‐ ‐ ‐ ‐ ‐ ‐
2013 154,364 12,273 9,405 14,406 ‐ ‐ ‐ ‐ 190,448 6%
Aaron Rosenberg 9 2014 ‐ ‐ ‐ ‐ ‐ ‐ ‐ ‐ ‐ ‐
2013 156,393 33,736 13,397 28,852 232,378 15%
2014 1,270,713 603,718 14,680 38,342 54,729 10,556 213,098 2,205,836 37%
2013 2,042,358 748,996 145,640 281,514 67,187 243,694 12,712 234,856 3,776,957 26%
Refer to notes on the following page
For
per
sona
l use
onl
y
REDFLEX HOLDINGS LIMITED Annual Report 2014
DIRECTORS’ REPORT
REDFLEX – making a safer world
‐ 33 ‐
REMUNERATION REPORT (AUDITED) ‐ CONTINUED
4 EXECUTIVE REMUNERATION OUTCOMES FOR FY14 (INCLUDING LINK TO PERFORMANCE) – CONTINUED
Remuneration of Executive KMP - Continued
Notes to Table 1: Remuneration for the years ended 30 June 2014 and 30 June 2013
^ The bonus is calculated as being the actual cash bonus paid during the financial year for meeting individual KPIs, relating to the prior year, together with the amount accrued at year end based on Group and Divisional performance and either paid or expected to be paid during the next financial year.
^^ The performance rights amounts for FY13 in the table reflect the effect of amortisation of all valid performance rights.
1 Mr Johnson received an amount of $50,000 in his role as Interim Chief Operating Officer for the 6 month period ended 16 July 2014. Mr Johnson’s salary in FY13 reflects the remuneration for work performed on the RTSI restructure during FY13.
2 Mr Saunders was not considered a KMP for the purposes of the FY13 remuneration report. The amount shown in the table is Mr Saunder’s total remuneration for FY14, including the period from 1 July to 16 July 2013, when he served in a managerial capacity.
3 The former Group CEO, Mr DeVincenzi was an executive director until 16 January 2014, whilst remaining a member of the board as a non‐executive director, when he transitioned to a consulting role. Mr DeVincenzi entered into an Executive Transition Agreement with the company on 17 July 2013. Within this Agreement, Mr DeVincenzi waived his entitlement to 129,323 performance rights and 3 million options which were issued on 10 September 2012. The expensing of the performance rights and the options cost for FY13 was also reversed in FY13 as the terms of the Agreement had been substantially determined at 30 June 2013.
4 Mr Davie resigned as Group CEO and executive director on 30 September 2012.
5 Ms Finley resigned from her positon as CEO, RTSI, on 28 February 2013.
6 Mr Pickup remains an employee of the Group, however he is not considered a KMP for the purposes of the FY14 remuneration report.
7 Mr Bunkse resigned as General Counsel on 28 February 2013.
8 Mr Nolen resigned as CFO, RTSI on 28 February 2013.
9 Mr Rosenberg was dismissed as Executive Vice President Sales, RTSI, on 20 February 2013.
For
per
sona
l use
onl
y
REDFLEX HOLDINGS LIMITED Annual Report 2014
DIRECTORS’ REPORT
REDFLEX – making a safer world
‐ 34 ‐
REMUNERATION REPORT (AUDITED) ‐ CONTINUED
5 SUMMARY OF EXECUTIVE CONTRACTUAL ARRANGEMENTS
Remuneration arrangements for KMP are formalised in employment agreements.
Group Chief Financial Officer – Mr Ron Johnson
Mr Johnson is Group Chief Financial Officer and is employed by Redflex Holdings Limited. For the six month period commencing 16 January 2014, which is the date that Mr DeVincenzi transitioned from Group CEO to an NED role, Mr Johnson performed the role of Interim Chief Operating Officer.
Under the terms of Mr Johnson’s employment contract:
Mr Johnson’s annual TFR is AU$272,950, effective 1 October 2013. He received an additional $50,000 for his term as Interim Chief Operating Officer.
STIs of up to 30% of TFR are normally available on achievement of performance targets with a further 30% available for over‐achievement of those targets. The performance criteria for FY14 was amended such that Mr Johnson was entitled to receive 30% of TFR provided he served as Interim Group Operating Officer until 16 July 2014. The payment of $81,885 was made during FY14.
Mr Johnson is eligible to participate in the company’s LTI plan and his normal maximum LTI opportunity is 60% of TFR. For the LTI award made in FY14, Mr Johnson, along with all other LTI recipients in FY14, received an additional number of LTIs approximating 22% of his normal allocation. The number of LTIs awarded to Mr Johnson is included in Section 7.
Termination criteria (other than Cause):
Either Mr Johnson or the Company can terminate the employment relationship at any time for any lawful reason, or no reason, with or without cause. If the company terminates Mr Johnson’s employment for any reason other than cause the Company would pay any total fixed remuneration due to Mr Johnson through to the last day of employment, plus any accrued bonus, and the Company would continue to pay Mr Johnson’s total fixed remuneration for a period of one week for every four months of completed service up to a maximum of 39 weeks after the effective date of termination.
CEO of Redflex Traffic Systems Pty Ltd – Mr Ricardo Fiusco
Mr Fiusco is CEO of Redflex Traffic Systems Pty Ltd, and heads the Australian/International Traffic business.
Under the terms of Mr Fiusco’s employment contract:
Mr Fiusco’s annual TFR is $272,950 effective 1 October 2013.
STIs of up to 30% of TFR are normally available on achievement of performance targets with a further 30% available for over‐achievement of those targets. The performance criteria for FY14 was amended such that Mr Fiusco is entitled to receive 30% of TFR provided he serves until 1 October 2014, regardless of performance. The payment of $81,885 will occur in October 2014.
Mr Fiusco is eligible to participate in the Company’s LTI plan and his normal maximum LTI opportunity is 60% of TFR. For the LTI award made in FY14, Mr Fiusco, along with all other LTI recipients in FY14, received an additional number of LTIs approximating 22% of the normal allocation. The number of LTIs awarded to Mr Fiusco is included in Section 7.
Termination criteria (other than Cause):
Either Mr Fiusco or the company can terminate the employment relationship at any time for any lawful reason, or no reason, with or without cause. If the Company terminates Mr Fiusco’s employment for any reason other than cause the Company would pay any total fixed remuneration due to Mr Fiusco through to the last day of employment, plus any accrued bonus, and the Company would continue to pay Mr Fiusco’s total fixed remuneration for a period of one week for every four months of completed service up to a maximum of 39 weeks after the effective date of termination.
For
per
sona
l use
onl
y
REDFLEX HOLDINGS LIMITED Annual Report 2014
DIRECTORS’ REPORT
REDFLEX – making a safer world
‐ 35 ‐
REMUNERATION REPORT (AUDITED) ‐ CONTINUED
5 SUMMARY OF EXECUTIVE CONTRACTUAL ARRANGEMENTS ‐ CONTINUED
President and CEO of Redflex Traffic Systems Inc – Mr James Saunders
Mr Saunders is CEO of RTSI and heads the North America Traffic business. Mr Saunders has held this position since 17 July 2013.
Under the terms of Mr Saunders’ employment contract:
Mr Saunders’ annual TFR is US$285,000 (AU$301,023), effective 17 July 2013.
STIs of up to 30% of TFR are normally available on achievement of performance targets with a further 30% available for over‐achievement of those targets. The performance criteria for FY14 was amended such that Mr Saunders was entitled to receive 30% of TFR provided he continued to serve until 30 June 2014, regardless of performance. The payment of US$85,500 (AU$93,147) will occur in October 2014.
Mr Saunders is eligible to participate in the company’s LTI plan and his normal maximum LTI opportunity is 60% of TFR. For the LTI award made in FY14, Mr Saunders, along with all other LTI recipients in FY14, received an additional number of LTIs approximating 22% of the normal allocation. The number of LTIs awarded to Mr Saunders is included in Section 7.
Mr Saunders was entitled to, and received prior to 31 October 2013, a bonus of US$18,000 (AU$19,609) based on certain performance criteria.
Termination criteria (other than Cause)
If Mr Saunders is terminated by the Company for any reason other than Cause, during the 12 month period following the Company’s hiring of a Global CEO, the Company will pay Mr Saunders in full satisfaction of all its obligations, an amount equal to the lower of one year of Mr Saunders’ current annual salary, or the maximum permitted under the termination payments provisions of Part 2D.2 of the Corporations Act 2001.
Former Group CEO – Mr Robert DeVincenzi
Transition Agreement
On 17 July 2013, Redflex announced to ASX a transition of the leadership of the Redflex Group and that Mr DeVincenzi’s employment contract dated 17 September 2012 was terminated by virtue of an Executive Transition Agreement. Mr DeVincenzi continued as Group CEO up until 16 January 2014 when he became a Non‐executive Director, whilst the Board conducted a search for a replacement. The key terms of the Transition Agreement are:
Mr DeVincenzi:
waived his initial entitlement to a short term incentive under the STI Plan,
waived his entitlement to the 129,323 performance rights that were issued under the LTI Plan on 10 September 2012 which have been cancelled,
waived his rights to any future issue of performance rights under his long term incentive, and
waived his entitlement to 3 million options which were issued on 10 September 2012 and which have been cancelled.
was entitled to a bonus of US$540,000 (AU$589,134) for FY13 year performance based primarily on individual performance objectives determined in early 2013. This bonus was paid in August 2013.
continued to be employed in the position of CEO of the Redflex Group for the transition period ending 16 January 2014. He was entitled to a base annual salary of US$450,000 (AU$438,212) with no entitlement to participate in incentive or option plans. On the last day of the transition period, Mr DeVincenzi was paid a completion bonus of US$310,000 (AU$337,727). F
or p
erso
nal u
se o
nly

REDFLEX HOLDINGS LIMITED Annual Report 2014
DIRECTORS’ REPORT
REDFLEX – making a safer world
‐ 36 ‐
REMUNERATION REPORT (AUDITED) – CONTINUED
5 SUMMARY OF EXECUTIVE CONTRACTUAL ARRANGEMENTS ‐ CONTINUED
Former Group CEO – Mr Robert DeVincenzi (continued)
Transition Agreement ‐ continued
For a twelve month period from 16 January 2014, Mr DeVincenzi will provide consulting services as reasonably requested of up to 20 hours per week. Over this period he may perform services for or be employed by other companies other than a competitor. Over this period he is entitled to a consulting fee of US$25,000 (AU$27,373) per month and is entitled to be reimbursed for family health insurance premiums.
Whilst the Group CEO Transition Agreement was not finalised until 17 July 2013, the Board had high expectations of completing it at reporting date, and accordingly such items relating to FY13 were accounted for in FY13. These included:
reversal of STI accruals and expensing of the bonus;
expensing and reversal of performance rights; and
expensing and reversal of options.
Performance rights held by former Group CEO – Mr Graham Davie (retired 30 September 2012)
On 10 September 2012, the company announced that Mr Graham Davie had decided to retire from executive responsibilities. In regard to the cessation of his employment and directorship with effect from 30 September 2012, the Company and Mr Davie agreed on terms which are customary for an arrangement of this nature and included Mr Davie retaining his LTI performance rights on the basis that his employment ceased as a consequence of a qualifying reason for the purposes of the LTI Plan Rules, except that the LTIs that had a test date of 1 October 2012 vested in full.
In relation to FY14, and the testing on 1 October 2013, the LTIs did not vest as the Company’s TSR ranking was below the 50th percentile.
Mr Davie retains 110,770 performance rights that are due to be tested on 1 October 2014. These are considered unlikely to vest.
6 NON‐EXECUTIVE DIRECTOR REMUNERATION ARRANGEMENTS
6.A Remuneration policy for non‐executive directors
The board seeks to set aggregate remuneration at a level that provides the Company with the ability to attract and retain directors of the highest calibre whilst incurring a cost which is acceptable to shareholders.
The amount of aggregate remuneration sought to be approved by shareholders and the fee structure is reviewed annually against fees paid to NEDs of comparable companies. The board considers advice from external consultants when undertaking the annual review process.
The Company’s constitution and ASX listing rules specify that the aggregate remuneration of non‐executive directors shall be determined from time to time by a general meeting. The latest determination was at the Annual General Meeting held in 2010 when shareholders approved an aggregate remuneration of $700,000 per year.
For
per
sona
l use
onl
y
REDFLEX HOLDINGS LIMITED Annual Report 2014
DIRECTORS’ REPORT
REDFLEX – making a safer world
‐ 37 ‐
REMUNERATION REPORT (AUDITED) ‐ CONTINUED
6 NON‐EXECUTIVE DIRECTOR REMUNERATION ARRANGEMENTS ‐ CONTINUED
6.B Structure of non‐executive director remuneration
With the exception of Mr DeVincenzi, each NED receives a fixed fee for being a director and a fee for the additional time commitment made by directors who serve as Chair and/or on one or more sub committees. NEDs do not receive retirement benefits, except for superannuation where this is applicable, nor do they participate in any incentive programs. The remuneration of NEDs for the years ended 30 June 2014 and 30 June 2013 is detailed in Table 2.
Table 2: NED remuneration for the year ended 30 June 2014 and comparative 2013
Financial year
Short‐term benefits Post employment
Total Salary and Fees
Other fees Non
monetary Superannuation
Adam Gray 1 2014 68,480 ‐ ‐ ‐ 68,480
2013 ‐ ‐ ‐ ‐ ‐
Paul Clark 2 2014 17,966 ‐ ‐ 1,662 19,628
2013 ‐ ‐ ‐ ‐ ‐
Robert DeVincenzi 3 2014 ‐ ‐ ‐ ‐ ‐
2013 ‐ ‐ ‐ ‐ ‐
Michael McConnell 4 2014 263,421 ‐ ‐ ‐ 263,421
2013 172,986 80,454 ‐ ‐ 253,440
John Murphy 2 2014 21,233 ‐ ‐ 1,964 23,197
2013 ‐ ‐ ‐ ‐ ‐
Herman Schwarz 5 2014 13,750 ‐ ‐ ‐ 13,750
2013 ‐ ‐ ‐ ‐ ‐
Terence Winters 6 2014 96,787 ‐ ‐ 8,953 105,740
2013 ‐ ‐ ‐ ‐ ‐
Robin Debernardi 7 2014 60,740 ‐ ‐ 5,619 66,359
2013 80,849 ‐ ‐ 7,276 88,125
Albert Moyer 8 2014 81,250 ‐ ‐ ‐ 81,250
2013 36,956 ‐ ‐ ‐ 36,956
Ian Davis 9 2014 ‐ ‐ ‐ ‐ ‐
2013 42,596 ‐ ‐ 3,924 47,520
Maxwell Findlay 9 2014 ‐ ‐ ‐ ‐ ‐
2013 77,352 ‐ ‐ 6,962 84,314
2014 623,627 ‐ ‐ 18,198 641,825
2013 411,739 80,454 ‐ 18,162 510,355
1 Mr Gray was appointed to the board on 19 December 2013 and appointed chair on 6 February 2014. 2 Mr Clark and Mr Murphy were appointed 5 April 2014. 3 Mr DeVincenzi transitioned to non‐executive director status on 16 January 2014. Under the terms of his transition arrangements he does not receive NED fees. Mr DeVincenzi’s executive remuneration is included in Table 1. 4 Contractual arrangements with Mr McConnell for his role as interim chair are covered in section 6c. 5 Mr Schwarz was appointed 1 May 2014 6 Mr Winters was appointed 7 August 2013 7 Mr Debernardi resigned 5 April 2014. 8 Mr Moyer resigned 30 April 2014. 9 Mr Findlay and Mr Davis resigned on 6 February 2013.
For
per
sona
l use
onl
y

REDFLEX HOLDINGS LIMITED Annual Report 2014
DIRECTORS’ REPORT
REDFLEX – making a safer world
‐ 38 ‐
REMUNERATION REPORT (AUDITED) ‐ CONTINUED
6 NON‐EXECUTIVE DIRECTOR REMUNERATION ARRANGEMENTS ‐ CONTINUED
6.C Contractual arrangements with Mr McConnell as Interim Chairman
Mr McConnell served as interim chair from 1 March 2013 to 1 January 2014. His annual compensation for his appointment was $340,832 (US$350,000). The board determined unanimously (Mr McConnell abstained) that Mr McConnell’s remuneration arrangements were appropriate taking into consideration the additional work required to provide active management support and supervision to the business, related activities subsequent to the completion of the internal investigation, development and execution of the RTSI restructuring program, sufficient continuity with shareholders and other external constituents and board development activities.
At the conclusion of Mr McConnell’s term as interim chair on 1 January 2014, the chair compensation returned to its previous level of $145,000 per annum which came into effect on 1 October 2012. Mr McConnell relinquished the Chair on 6 February 2014, with his entitlements reducing to that of a NED.
Mr McConnell received an additional $80,454 (US$75,000) for his oversight of the 2013 CEO search process and the internal investigation in the USA. This amount was accrued for accounting purposes at 30 June 2013 as the services had been rendered, and was paid in September 2013.
For
per
sona
l use
onl
y
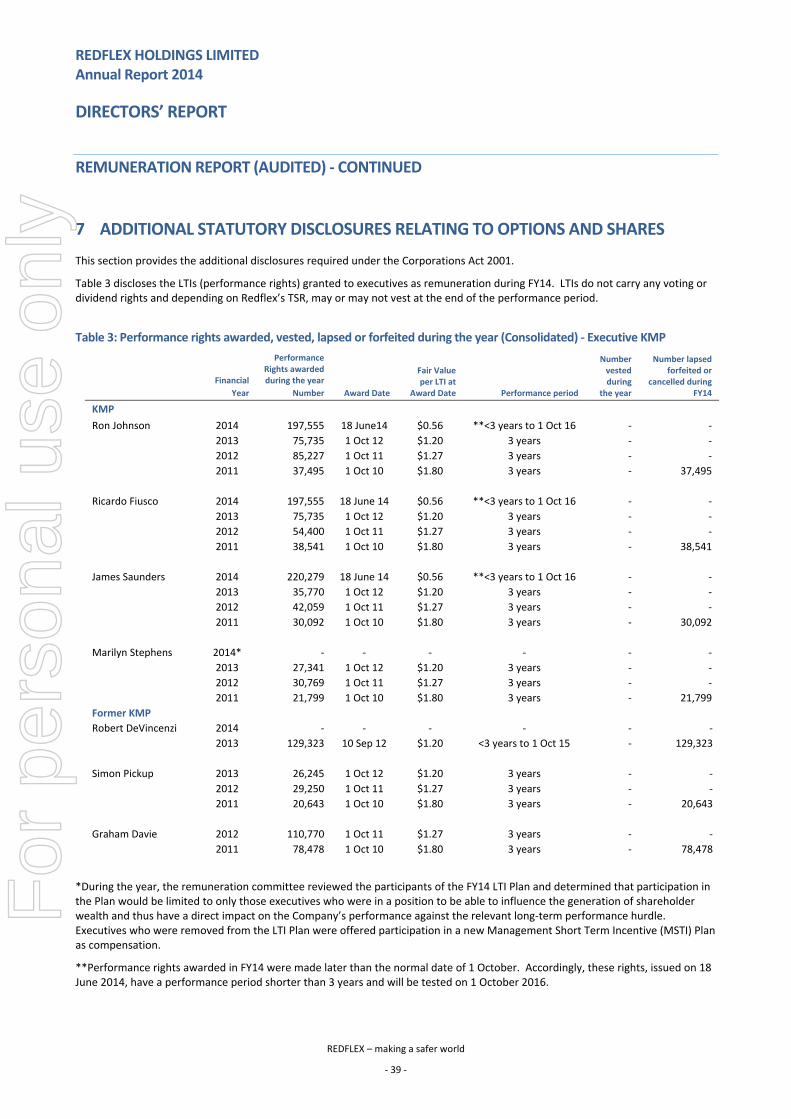
REDFLEX HOLDINGS LIMITED Annual Report 2014
DIRECTORS’ REPORT
REDFLEX – making a safer world
‐ 39 ‐
REMUNERATION REPORT (AUDITED) ‐ CONTINUED
7 ADDITIONAL STATUTORY DISCLOSURES RELATING TO OPTIONS AND SHARES
This section provides the additional disclosures required under the Corporations Act 2001.
Table 3 discloses the LTIs (performance rights) granted to executives as remuneration during FY14. LTIs do not carry any voting or dividend rights and depending on Redflex’s TSR, may or may not vest at the end of the performance period.
Table 3: Performance rights awarded, vested, lapsed or forfeited during the year (Consolidated) ‐ Executive KMP
Financial
Year
Performance Rights awarded during the year
Number Award Date
Fair Value per LTI at
Award Date Performance period
Number vested during
the year
Number lapsed forfeited or
cancelled during FY14
KMP
Ron Johnson 2014 197,555 18 June14 $0.56 **<3 years to 1 Oct 16 ‐ ‐
2013 75,735 1 Oct 12 $1.20 3 years ‐ ‐
2012 85,227 1 Oct 11 $1.27 3 years ‐ ‐
2011 37,495 1 Oct 10 $1.80 3 years ‐ 37,495
Ricardo Fiusco 2014 197,555 18 June 14 $0.56 **<3 years to 1 Oct 16 ‐ ‐
2013 75,735 1 Oct 12 $1.20 3 years ‐ ‐
2012 54,400 1 Oct 11 $1.27 3 years ‐ ‐
2011 38,541 1 Oct 10 $1.80 3 years ‐ 38,541
James Saunders 2014 220,279 18 June 14 $0.56 **<3 years to 1 Oct 16 ‐ ‐
2013 35,770 1 Oct 12 $1.20 3 years ‐ ‐
2012 42,059 1 Oct 11 $1.27 3 years ‐ ‐
2011 30,092 1 Oct 10 $1.80 3 years ‐ 30,092
Marilyn Stephens 2014* ‐ ‐ ‐ ‐ ‐ ‐
2013 27,341 1 Oct 12 $1.20 3 years ‐ ‐
2012 30,769 1 Oct 11 $1.27 3 years ‐ ‐
2011 21,799 1 Oct 10 $1.80 3 years ‐ 21,799
Former KMP
Robert DeVincenzi 2014 ‐ ‐ ‐ ‐ ‐ ‐ 2013 129,323 10 Sep 12 $1.20 <3 years to 1 Oct 15 ‐ 129,323
Simon Pickup 2013 26,245 1 Oct 12 $1.20 3 years ‐ ‐ 2012 29,250 1 Oct 11 $1.27 3 years ‐ ‐ 2011 20,643 1 Oct 10 $1.80 3 years ‐ 20,643
Graham Davie 2012 110,770 1 Oct 11 $1.27 3 years ‐ ‐ 2011 78,478 1 Oct 10 $1.80 3 years ‐ 78,478
*During the year, the remuneration committee reviewed the participants of the FY14 LTI Plan and determined that participation in the Plan would be limited to only those executives who were in a position to be able to influence the generation of shareholder wealth and thus have a direct impact on the Company’s performance against the relevant long‐term performance hurdle. Executives who were removed from the LTI Plan were offered participation in a new Management Short Term Incentive (MSTI) Plan as compensation.
**Performance rights awarded in FY14 were made later than the normal date of 1 October. Accordingly, these rights, issued on 18 June 2014, have a performance period shorter than 3 years and will be tested on 1 October 2016.
For
per
sona
l use
onl
y

REDFLEX HOLDINGS LIMITED Annual Report 2014
DIRECTORS’ REPORT
REDFLEX – making a safer world
‐ 40 ‐
REMUNERATION REPORT (AUDITED) ‐ CONTINUED
7 ADDITIONAL STATUTORY DISCLOSURES RELATING TO OPTIONS AND SHARES‐ CONTINUED
Table 4: Value of performance rights awarded, vested, lapsed or forfeited during the year ‐Executive KMP
Value ^ of Performance
Rights awarded during the year
Remuneration consisting of LTIs
for the year
Value^ of Performance Rights vested
during the year
Value^ of Performance Rights lapsed or forfeited
during the year
$ % $ $
KMP
Ron Johnson 110,631 26% ‐ 67,491
Ricardo Fiusco 110,631 31% ‐ 69,374
James Saunders 123,356 31% ‐ 54,166
Marilyn Stephens ‐ ‐ ‐ 39,238
Former KMP
Robert DeVincenzi 1 ‐ ‐ ‐ 155,187
Graham Davie ‐ ‐ ‐ 141,260
Simon Pickup ‐ ‐ ‐ 37,157
^ For details on the valuation of the performance rights, including models and assumptions used, please refer to Note 25.
1 Mr DeVincenzi transitioned from the role of CEO of the Redflex Group on 16 January 2014. Mr DeVincenzi continues to serve the board as a non‐executive director, subject to the usual shareholder approval at AGMs.
For
per
sona
l use
onl
y
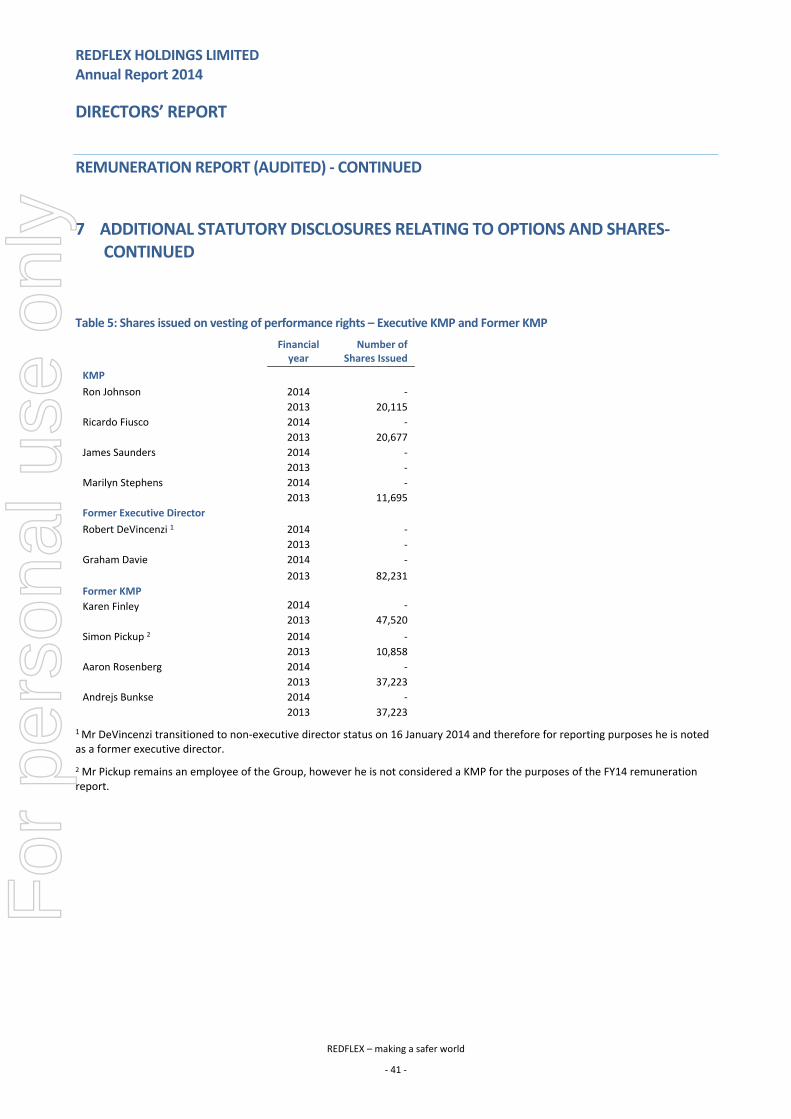
REDFLEX HOLDINGS LIMITED Annual Report 2014
DIRECTORS’ REPORT
REDFLEX – making a safer world
‐ 41 ‐
REMUNERATION REPORT (AUDITED) ‐ CONTINUED
7 ADDITIONAL STATUTORY DISCLOSURES RELATING TO OPTIONS AND SHARES‐ CONTINUED
Table 5: Shares issued on vesting of performance rights – Executive KMP and Former KMP
Financial year
Number of Shares Issued
KMP
Ron Johnson 2014 ‐
2013 20,115
Ricardo Fiusco 2014 ‐
2013 20,677
James Saunders 2014 ‐
2013 ‐
Marilyn Stephens 2014 ‐
2013 11,695
Former Executive Director
Robert DeVincenzi 1 2014 ‐
2013 ‐
Graham Davie 2014 ‐
2013 82,231
Former KMP
Karen Finley 2014 ‐
2013 47,520
Simon Pickup 2 2014 ‐
2013 10,858
Aaron Rosenberg 2014 ‐
2013 37,223
Andrejs Bunkse 2014 ‐
2013 37,223
1 Mr DeVincenzi transitioned to non‐executive director status on 16 January 2014 and therefore for reporting purposes he is noted as a former executive director.
2 Mr Pickup remains an employee of the Group, however he is not considered a KMP for the purposes of the FY14 remuneration report.
For
per
sona
l use
onl
y

REDFLEX HOLDINGS LIMITED Annual Report 2014
DIRECTORS’ REPORT
REDFLEX – making a safer world
‐ 42 ‐
REMUNERATION REPORT (AUDITED) ‐ CONTINUED
7 ADDITIONAL STATUTORY DISCLOSURES RELATING TO OPTIONS AND SHARES ‐ CONTINUED
Table 6a: Movements in Shareholdings of KMP during the year ended 30 June 2014
Shares held at 30 June 2013
VestedPerformance
Rights
Bought (Sold)on market
Shares held at 30 June 2014
Directors ‐ non executive
Adam Gray 15,737,427* ‐ 7,102,621 22,840,048
Paul Clark ‐ ‐ ‐ ‐
Robert DeVincenzi ‐ ‐ ‐ ‐
Michael McConnell 50,000 ‐ 9,125 59,125
John Murphy ‐ ‐ ‐ ‐
Herman Schwarz ‐ ‐ ‐ ‐
Terence Winters ‐ ‐ ‐ ‐
15,787,427 ‐ 7,111,746 22,899,173
Executive KMP
Ronald Johnson 119,740 ‐ ‐ 119,740
Ricardo Fiusco 239,754 ‐ (84,239) 155,515
James Saunders ‐ ‐ ‐ ‐
Marilyn Stephens 152,084 ‐ ‐ 152,084
511,578 ‐ (84,239) 427,339
* Mr Gray was appointed a Director on 19 December 2013. His shareholding as at the date of his appointment, was 22,024,340. This shareholding includes purchases by Mr Gray’s related party, Coliseum Capital.
Table 6b: Movements in Shareholdings of KMP during the year ended 30 June 2013
Shares held at 1 July 2012
VestedPerformance
Rights
Bought (Sold)on market/other
movements
Shares held at 30 June 2013
Directors ‐ non executive
Robert DeVincenzi ‐ ‐ ‐ ‐
Michael McConnell ‐ ‐ 50,000 50,000
Former NEDs
Robin Debernardi 3,171,783 ‐ ‐ 3,171,783
Albert Moyer ‐ ‐ ‐ ‐
3,171,783 ‐ 50,000 3,221,783
Executive KMP
Ronald Johnson 180,967 20,115 (81,342) 119,740
Ricardo Fiusco 299,077 20,677 (80,000) 239,754
James Saunders ‐ ‐ ‐ ‐
Marilyn Stephens 140,389 11,695 ‐ 152,084
Former KMP
Simon Pickup 50,298 10,858 ‐ 61,156
670,731 63,345 (161,342) 572,734
Other than the issue of shares resulting from vested performance rights, all equity transactions with key management personnel have been entered into under terms and conditions no more favourable than those the Group would have adopted if dealing at arm’s length.
For
per
sona
l use
onl
y
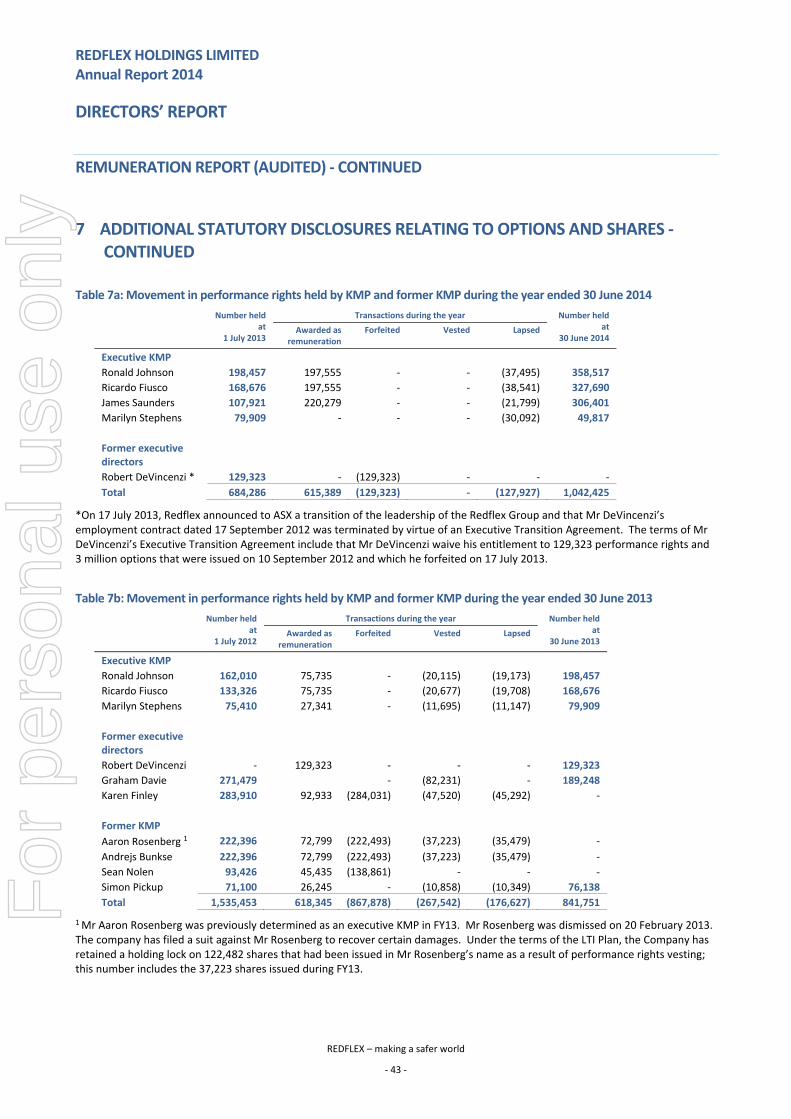
REDFLEX HOLDINGS LIMITED Annual Report 2014
DIRECTORS’ REPORT
REDFLEX – making a safer world
‐ 43 ‐
REMUNERATION REPORT (AUDITED) ‐ CONTINUED
7 ADDITIONAL STATUTORY DISCLOSURES RELATING TO OPTIONS AND SHARES ‐ CONTINUED
Table 7a: Movement in performance rights held by KMP and former KMP during the year ended 30 June 2014
Number held at
1 July 2013
Transactions during the year Number held at
30 June 2014 Awarded as
remuneration Forfeited Vested Lapsed
Executive KMP
Ronald Johnson 198,457 197,555 ‐ ‐ (37,495) 358,517
Ricardo Fiusco 168,676 197,555 ‐ ‐ (38,541) 327,690
James Saunders 107,921 220,279 ‐ ‐ (21,799) 306,401
Marilyn Stephens 79,909 ‐ ‐ ‐ (30,092) 49,817
Former executive directors
Robert DeVincenzi * 129,323 ‐ (129,323) ‐ ‐ ‐
Total 684,286 615,389 (129,323) ‐ (127,927) 1,042,425
*On 17 July 2013, Redflex announced to ASX a transition of the leadership of the Redflex Group and that Mr DeVincenzi’s employment contract dated 17 September 2012 was terminated by virtue of an Executive Transition Agreement. The terms of Mr DeVincenzi’s Executive Transition Agreement include that Mr DeVincenzi waive his entitlement to 129,323 performance rights and 3 million options that were issued on 10 September 2012 and which he forfeited on 17 July 2013.
Table 7b: Movement in performance rights held by KMP and former KMP during the year ended 30 June 2013
Number held at
1 July 2012
Transactions during the year Number held at
30 June 2013 Awarded as
remuneration Forfeited Vested Lapsed
Executive KMP
Ronald Johnson 162,010 75,735 ‐ (20,115) (19,173) 198,457
Ricardo Fiusco 133,326 75,735 ‐ (20,677) (19,708) 168,676
Marilyn Stephens 75,410 27,341 ‐ (11,695) (11,147) 79,909
Former executive directors
Robert DeVincenzi ‐ 129,323 ‐ ‐ ‐ 129,323
Graham Davie 271,479 ‐ (82,231) ‐ 189,248
Karen Finley 283,910 92,933 (284,031) (47,520) (45,292) ‐
Former KMP
Aaron Rosenberg 1 222,396 72,799 (222,493) (37,223) (35,479) ‐
Andrejs Bunkse 222,396 72,799 (222,493) (37,223) (35,479) ‐
Sean Nolen 93,426 45,435 (138,861) ‐ ‐ ‐
Simon Pickup 71,100 26,245 ‐ (10,858) (10,349) 76,138
Total 1,535,453 618,345 (867,878) (267,542) (176,627) 841,751
1 Mr Aaron Rosenberg was previously determined as an executive KMP in FY13. Mr Rosenberg was dismissed on 20 February 2013. The company has filed a suit against Mr Rosenberg to recover certain damages. Under the terms of the LTI Plan, the Company has retained a holding lock on 122,482 shares that had been issued in Mr Rosenberg’s name as a result of performance rights vesting; this number includes the 37,223 shares issued during FY13.
For
per
sona
l use
onl
y
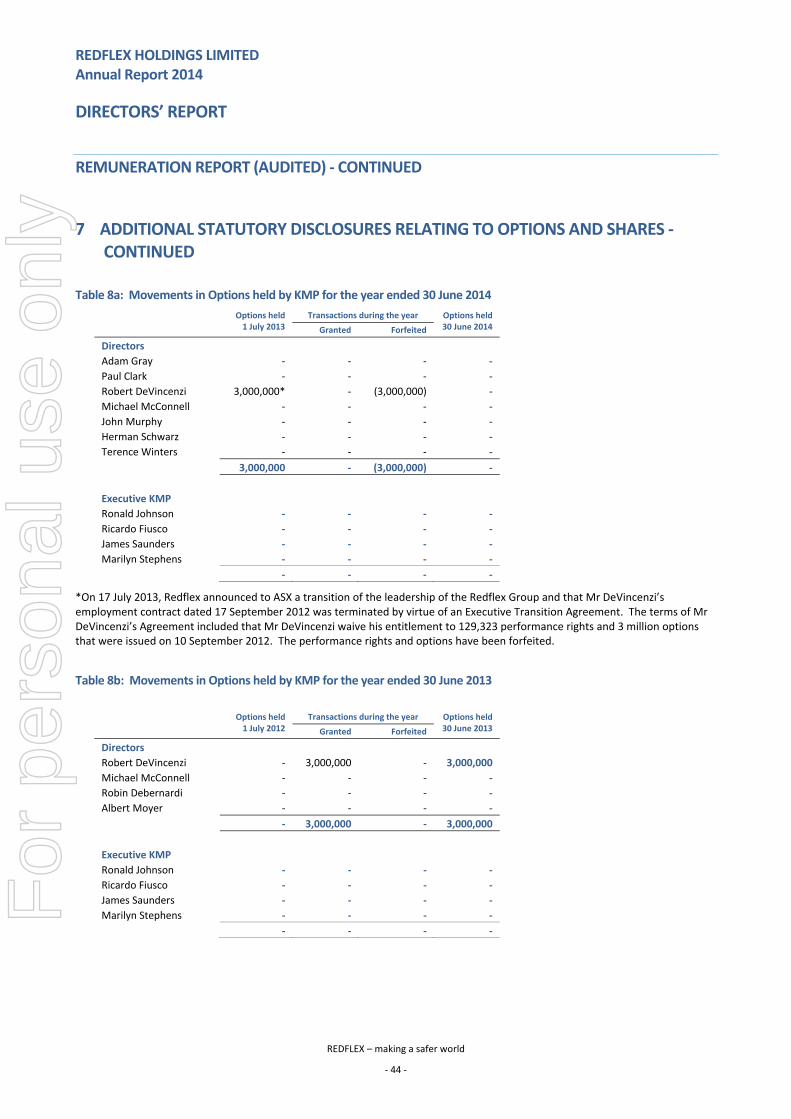
REDFLEX HOLDINGS LIMITED Annual Report 2014
DIRECTORS’ REPORT
REDFLEX – making a safer world
‐ 44 ‐
REMUNERATION REPORT (AUDITED) ‐ CONTINUED
7 ADDITIONAL STATUTORY DISCLOSURES RELATING TO OPTIONS AND SHARES ‐ CONTINUED
Table 8a: Movements in Options held by KMP for the year ended 30 June 2014
Options held 1 July 2013
Transactions during the year Options held30 June 2014 Granted Forfeited
Directors
Adam Gray ‐ ‐ ‐ ‐
Paul Clark ‐ ‐ ‐ ‐
Robert DeVincenzi 3,000,000* ‐ (3,000,000) ‐
Michael McConnell ‐ ‐ ‐ ‐
John Murphy ‐ ‐ ‐ ‐
Herman Schwarz ‐ ‐ ‐ ‐
Terence Winters ‐ ‐ ‐ ‐
3,000,000 ‐ (3,000,000) ‐
Executive KMP
Ronald Johnson ‐ ‐ ‐ ‐
Ricardo Fiusco ‐ ‐ ‐ ‐
James Saunders ‐ ‐ ‐ ‐
Marilyn Stephens ‐ ‐ ‐ ‐
‐ ‐ ‐ ‐
*On 17 July 2013, Redflex announced to ASX a transition of the leadership of the Redflex Group and that Mr DeVincenzi’s employment contract dated 17 September 2012 was terminated by virtue of an Executive Transition Agreement. The terms of Mr DeVincenzi’s Agreement included that Mr DeVincenzi waive his entitlement to 129,323 performance rights and 3 million options that were issued on 10 September 2012. The performance rights and options have been forfeited.
Table 8b: Movements in Options held by KMP for the year ended 30 June 2013
Options held 1 July 2012
Transactions during the year Options held30 June 2013 Granted Forfeited
Directors
Robert DeVincenzi ‐ 3,000,000 ‐ 3,000,000
Michael McConnell ‐ ‐ ‐ ‐
Robin Debernardi ‐ ‐ ‐ ‐
Albert Moyer ‐ ‐ ‐ ‐
‐ 3,000,000 ‐ 3,000,000
Executive KMP
Ronald Johnson ‐ ‐ ‐ ‐
Ricardo Fiusco ‐ ‐ ‐ ‐
James Saunders ‐ ‐ ‐ ‐
Marilyn Stephens ‐ ‐ ‐ ‐
‐ ‐ ‐ ‐
For
per
sona
l use
onl
y
REDFLEX HOLDINGS LIMITED Annual Report 2014
DIRECTORS’ REPORT
REDFLEX – making a safer world
‐ 45 ‐
REMUNERATION REPORT (AUDITED) ‐ CONTINUED
8 OTHER TRANSACTIONS AND BALANCES WITH KEY MANAGEMENT PERSONNEL AND THEIR RELATED PARTIES.
There have been no other transactions with KMP, apart from those listed in this report.
9 SUBSEQUENT EVENTS.
On 25 September 2014 Redflex Holdings Limited announced the appointment of Mr Paul Clark as Group Chief Executive Officer on a one‐year agreement commencing on 25 September 2014. Mr Clark subsequently resigned from his position of Non executive director at this date. The key terms of his contractual arrangements are as follows:‐
Mr Clark is entitled to be paid a salary of $400,000 per annum plus superannuation.
At the conclusion of his first year of service (30 September 2015), Mr Clark will also be entitled to an incentive payment of between 30% and 100% of his salary, depending on his achievement of agreed objectives, within 30 days of 30 September 2015. The incentive will be payable in performance rights (50% of which vest one year after grant and the remaining 50% of which vest two years after grant). If payment of Mr Clark’s incentive in performance rights is not approved by shareholders, then the Company will pay his incentive in cash.
The agreement may be terminated by the CEO with 6 month's prior notice, or by the Company making a payment equivalent to the CEO's remuneration until the expiration of the term. Summary termination is permitted for gross misconduct.
Signed in accordance with a resolution of the directors.
Adam Gray Chairman
30 September 2014
For
per
sona
l use
onl
y
REDFLEX HOLDINGS LIMITED Annual Report 2014
CORPORATE GOVERNANCE STATEMENT
REDFLEX – making a safer world
‐ 46 ‐
The board of directors of Redflex Holdings Limited ( “Redflex”, the ‘Company”, “Group”) is responsible for the corporate governance framework of the Group having regard to the ASX Corporate Governance Council’s (CGC) published Principles and Recommendations. The board guides and monitors the business and affairs of Redflex Holdings Limited on behalf of the shareholders by whom they are elected and to whom they are accountable.
Mr Clark was appointed as a Non executive director on 5 April 2014 and then subsequently appointed to the role of Group Chief Executive Officer on 25 September 2014. Details of Mr Clark’s appointment are disclosed in this report in Note 27 of the financial statements. Disclosures in the Corporate Governance Statement cover Mr Clark’s contribution to governance, and his memberships of Board Committees for his term as Non executive director for the period from his appointment on 5 April 2014 to the reporting date of 30 June 2014.
The table below summarises the company’s compliance with the CGC’s recommendations:
Recommendation Complies Yes / No Reference
Principle 1 – Lay solid foundations for management and oversight
1.1 Establish the functions reserved to the Board and those delegated to management and disclose those functions.
Yes Annual Report
1.2 Disclose the process for evaluating the performance of senior executives Yes Annual Report
1.3 Provide the information indicated in the guide to reporting on Principle 1. Yes
Principle 2 – Structure the board to add value
2.1 A majority of the Board should be independent directors. Yes
2.2 The chair should be an independent director. No Refer Annual Report
2.3 The roles of chair and chief executive officer (CEO) should not be exercised by the same individual.
Yes
2.4 The Board should establish a nomination committee. Yes
2.5 Disclose the process for evaluating the performance of the board, its committees and individual directors.
Yes Annual Report
2.6 Provide information indicated in the guide to reporting on Principle 2. Yes
Principle 3 – Promote ethical and responsible decision making
3.1 Establish a code of conduct and disclose the code or a summary of the code as to:
The practices necessary to maintain confidence in the company's integrity;
The practices necessary to take into account its legal obligations and the reasonable expectations of its stakeholders;
The responsibility and accountability of individuals for reporting and investigating reports
of unethical practices.
Yes Website
3.2 Establish a policy concerning diversity and disclose the policy or a summary of that policy. The policy should include requirements for the board to establish measurable objectives for achieving gender diversity and for the board to assess annually both the objectives and progress in achieving them.
Yes Website
3.3 Disclose in each annual report the measurable objectives for achieving gender diversity set by the board in accordance with the diversity policy and progress towards achieving them.
Yes
3.4 Disclose in each annual report the proportion of women employees in the whole organisation, women in senior executive positions and women on the board.
Yes
3.5 Provide the information indicated in the guide to reporting on Principle 3. Yes
Principle 4 ‐ Safeguard integrity in financial reporting
4.1 The board should establish an audit committee Yes
4.2 The audit committee should be structured so that it:
consists only of non‐executive directors;
consists of a majority of independent directors;
is chaired by an independent chair, who is not chair of the board;
has at least three members.
No Audit Committee Structure
4.3 The audit committee should have a formal charter Yes Website
4.4 Provide the information indicated in the guide to reporting on Principle 4. Yes
For
per
sona
l use
onl
y
REDFLEX HOLDINGS LIMITED Annual Report 2014
CORPORATE GOVERNANCE STATEMENT ‐ Continued
REDFLEX – making a safer world
‐ 47 ‐
Recommendation Complies Yes / No Reference
Principle 5 – Make timely and balanced disclosure
5.1 Establish written policies designed to ensure compliance with ASX Listing Rules disclosure requirements and to ensure accountability at a senior executive level for that compliance and disclose those policies or a summary of those policies.
Yes Website
5.2 Provide the information indicated in the guide to reporting on Principle 5. Yes
Principle 6 – Respect the rights of shareholders
6.1 Design a communications policy for promoting effective communication with shareholders and encouraging their participation at general meetings and disclose their policy or a summary of that policy.
Yes Website
6.2 Provide the information indicated in the guide to reporting on Principle 6. Yes Website
Principle 7 – Recognise and manage risk
7.1 Establish policies for the oversight and management of material business risks and disclose a summary of those policies.
Yes Website
7.2 The board should require management to design and implement the risk management and internal control system to manage the company’s material business risks and report to it on whether those risks are being managed effectively. The board should disclose that management has reported to it as to the effectiveness of the company’s management of its material business risks.
Yes
7.3 The board should disclose whether it has received assurance from the chief executive officer and the chief financial officer that the declaration provided in accordance with section 295A of the Corporations Act is founded on a sound system of risk management and internal control and that the system is operating effectively in all material respects in relation to financial reporting risk.
Yes Annual Report
7.4 Provide the information indicated in the guide to reporting on Principle 7. Yes
Principle 8 – Remunerate fairly and responsibly
8.1 The board should establish a remuneration committee Yes
8.2 The remuneration committee should be structured so that it:
consists of a majority of independent directors;
is chaired by an independent chair;
has at least three members.
Yes
8.3 Clearly distinguish the structure of non‐executive directors’ remuneration from that of executive directors and senior executives.
Yes
8.4 Provide the information indicated in the Guide to reporting on Principle 8. Yes
Redflex Holdings Limited’s corporate governance practices were in place throughout the year ended 30 June 2014.
Various corporate governance practices are discussed within this statement. For further information on corporate governance policies adopted by Redflex Holdings Limited, please refer to our website http://www.redflex.com.au.
For
per
sona
l use
onl
y
REDFLEX HOLDINGS LIMITED Annual Report 2014
CORPORATE GOVERNANCE STATEMENT ‐ Continued
REDFLEX – making a safer world
‐ 48 ‐
BOARD FUNCTIONS
The board seeks to identify the expectations of shareholders, as well as identifying other regulatory and ethical expectations and obligations. The board is responsible for identifying areas of significant business risk and for ensuring arrangements are in place to adequately manage those risks.
The Board is responsible for the overall operation and stewardship of Redflex and in particular is responsible for:
Strategy
Providing overall leadership by assisting and supporting management in the implementation of corporate strategy and performance objectives. This includes approval of business plans and operating and annual budgets developed by management;
Directing, monitoring and assessing performance against strategic and business plans; and
Approving and monitoring capital management including raising of capital, major capital expenditure, acquisitions and divestments.
Risk management
Ensuring that Redflex has an appropriate risk management framework in place and setting the risk appetite within which the Board expects to operate;
Ensuring a process is in place to identify the principal risks to Redflex’s businesses; and
Reviewing, ratifying and assessing the integrity of the systems of risk management, legal compliance, and internal compliance and control.
Reporting and disclosure
Approving and monitoring financial and other reporting, including reporting to shareholders and other stakeholders;
Establishing procedures to ensure implementation and adherence to RHL’s reporting policy;
Overseeing the integrity of Redflex's accounting and corporate reporting systems, including external audit; and
Overseeing Redflex’s process for making timely and balanced disclosure of all material information concerning RHL that a reasonable person would expect to have a material effect on the price or value of RHL's securities.
Management
Appointing, where appropriate, the Chair of the Board;
Delegating appropriate authority to management;
Appointing and approving the terms of engagement of the Chief Executive Officer and, where necessary, replacing the Chief Executive Officer;
Approving the appointment and terms of engagement of the Chief Financial Officer, the Company Secretary, senior executives and other key staff;
Ensuring that a process is in place so that the remuneration and conditions of service of senior executives is appropriately set;
Ensuring that a process is in place for executive succession planning, and monitoring that process; and
Overseeing management's implementation of Redflex’s strategic objectives and its performance generally.
Performance
Evaluating the Chief Executive Officer's performance; and
Approving and monitoring criteria for evaluating the performance of senior executives.
Corporate governance
Establishing appropriate standards and encouraging ethical behaviour and compliance with Redflex’s own governing documents, including the Code of Conduct; and
Monitoring Redflex’s compliance with corporate governance standards and the effectiveness of Redflex’s governance practices.
There are procedures in place, agreed by the board, to enable directors to seek independent professional advice at the company’s expense.
For
per
sona
l use
onl
y
REDFLEX HOLDINGS LIMITED Annual Report 2014
CORPORATE GOVERNANCE STATEMENT ‐ Continued
REDFLEX – making a safer world
‐ 49 ‐
BOARD FUNCTIONS ‐CONTINUED
The board has delegated to the Chief Executive Officers and through the CEOs to the executive management team, responsibility for the day to day management of our business. The scope of, and limitations to, authority delegated to management is determined by the board and covers areas such as implementation of, and monitoring progress against, board approved annual operating plans/budgets via the establishment and reporting of both financial and non‐financial key performance indicators.
Whilst at all times the board retains full responsibility for guiding and monitoring the Company, it makes use of specialist sub‐committees that are able to focus on particular responsibilities and provide informed feedback to the board. To this end the board has established the following committees, the roles and responsibilities of which are discussed throughout this corporate governance statement:
Audit and Risk Management
Nomination
Remuneration
The board has recently set in train the establishment of separate Risk and Compliance Committee to assist it to address elements of risk. It is expected that the Charter for the Risk and Compliance Committee will be approved by the board and placed on the Company’s website in the first half of FY15.
STRUCTURE OF THE BOARD
To ensure that the board is well equipped and appropriately qualified to discharge its responsibilities, it has established guidelines for the nomination and selection of directors and for the operation of the board. The skills, experience and expertise of each director relevant to the position of director is included in the Directors’ Report and is published on the Company’s website.
Directors of Redflex are considered to be independent when they are independent of management and free of any interest, position, association or relationship that might influence, or reasonably be perceived to influence, in a material respect, a director’s capacity to bring an independent judgment to bear on issues before the Board and to act in the best interests of RHL and its shareholders generally.
In the context of director independence, “materiality” is considered from both the Redflex and the individual director perspective. The determination of materiality requires consideration of both quantitative and qualitative elements. An item is presumed to be material (unless there is qualitative evidence to the contrary) if it is equal to or greater than 5% of the appropriate base amount. It is presumed to be material (unless there is qualitative evidence to the contrary) if it is equal to or greater than 10% of the appropriate base amount. Qualitative factors considered include whether a relationship is strategically important, the competitive landscape, the nature of the relationship and the contractual or other arrangements governing it, and other factors which point to the actual ability of the director in question to shape the direction of Redflex. The Board regularly assesses whether each non‐executive director is independent.
In accordance with the definition and the materiality thresholds set, the independence status of non‐executive directors of Redflex as at the date of this report is as follows:
Adam Gray, Chair
Robert DeVincenzi
Michael McConnell Independent
John Murphy Independent
Terence Winters Independent
Herman Schwarz Independent
Mr Gray, although meeting other criteria, and bringing independent judgement to bear on his role, is not defined as independent within the ASX Corporate Governance Principles and Recommendations, primarily due to the fact that he is an officer of Coliseum Capital, which is a substantial shareholder of the Company.
Mr DeVincenzi is not defined as independent within the definition above as he held the position of Chief Executive Officer for the period 10 September 2012 to 16 January 2014.
For
per
sona
l use
onl
y
REDFLEX HOLDINGS LIMITED Annual Report 2014
CORPORATE GOVERNANCE STATEMENT ‐ Continued
REDFLEX – making a safer world
‐ 50 ‐
STRUCTURE OF THE BOARD ‐ CONTINUED
Term in Office
The term in office held by each director in office at the date of this report is as follows:
Name Appointed Term in Office
Adam Gray, Chair 19 December 2013 9 months
Paul Clark 5 April 2014 6 months
Robert DeVincenzi 30 September 2012 2 years
Michael McConnell 2 August 2011 3 years 2 month
John Murphy 5 April 2014 6 months
Herman Schwarz 1 May 2014 5 months
Terence Winters 7 August 2013 1 year 1 month
PERFORMANCE
Performance of the board and key executives is reviewed regularly against both measurable and qualitative indicators that are aligned with the financial and non‐financial objectives of the Group. The performance of directors is scheduled to be reviewed annually by the Chair. If performance is considered unsatisfactory the director would be asked to retire. Due to the fact that five of the seven Non executive directors were recruited to the board during the current financial year, formal reviews of the board and directors have not been undertaken.
TRADING POLICY
The company's securities trading policy prohibits an executive or director trading in the company’s securities at any time when they are in possession of unpublished, price sensitive information in relation to those securities.
Before commencing to trade, a director must consult with the Chair or the Board and an employee must notify the company secretary within five days of the transaction occurring.
Trading in the company’s shares may be prohibited at any time if notified by the CEO or Chair, and in the absence of a specific prohibition, then the general prohibition of July through to August and January through to February, will apply. Only in exceptional circumstances will approval be given to trade within these two, two‐month periods.
As required by ASX Listing Rules, the company notifies ASX of any transaction in the company’s securities by a director.
NOMINATION COMMITTEE
The Nomination Committee operates under a board‐established charter which is published on the company’s website.
The purpose of the Committee is to:
identify and assess individuals qualified to become Board members;
review succession plans for the Board, CEO and other senior executives;
ensure performance of Board members is reviewed; and
evaluate performance of the Board as a whole
The Nomination Committee comprises the full board and is chaired by Mr Schwarz. The Nomination Committee was chaired by Mr Clark from 20 August 2014 until his appointment as Group CEO on 25 September 2014.
For
per
sona
l use
onl
y
REDFLEX HOLDINGS LIMITED Annual Report 2014
CORPORATE GOVERNANCE STATEMENT ‐ Continued
REDFLEX – making a safer world
‐ 51 ‐
AUDIT COMMITTEE
It is the board's responsibility to ensure that an effective internal control framework exists within the entity. This includes internal controls to deal with the effectiveness and efficiency of significant business processes, the safeguarding of assets, the maintenance of proper accounting records and the reliability of financial information, as well as non‐financial considerations such as the benchmarking of operational key performance indicators.
The board has delegated responsibility for establishing and maintaining a framework of internal control to the Audit Committee which operates under a board approved charter that is published on the company’s website.
The Committee provides the board with assurance regarding the reliability of financial information for inclusion in the financial reports.
The Audit Committee comprises three non‐executive directors:
John Murphy, committee chair appointed 5 April 2014
Adam Gray, appointed 19 December 2013
Paul Clark, appointed 5 April 2014
During the year other members of the committee were:
Albert Moyer, committee chair until 5 April 2014
Michael McConnell until 5 April 2014
Robin Debernardi until 5 April 2014
Mr Clark resigned from his membership of the Audit Committee at the date of his appointment to Group CEO on 25 September 2014. Mr Winters was appointed to the Audit Committee on 25 September 2014 to replace Mr Clark.
For details regarding the number of meetings, the qualifications of members, and the number of meetings they attended, please refer to the Directors’ Report.
Pursuant to Section 324DAC of the Corporations Act 2001, under a resolution from the board on 27 June 2013, the Company’s auditor, Mr Ashley Butler was re‐appointed for an additional two years due to his significant involvement in and knowledge of Redflex in the previous five successive financial years.
RISK MANAGEMENT
The identification and effective management of risk, including calculated risk taking, is viewed as an essential part of the company’s approach to creating long‐term shareholder value. In recognition of this, the board determines the company's risk profile and is responsible for overseeing and approving risk management strategy and policies, internal compliance, and internal control.
The board has continued its proactive approach to risk management and has recently set in train the establishment of separate Risk and Compliance Committee to assist it to address elements of risk. It is expected that a Charter for the Risk and Compliance Committee will be approved by the board and placed on the Company’s website in the first half of FY15.
The Risk and Compliance Committee members are:
Michael McConnell, Chair
Paul Clark
Robert DeVincenzi
Herman Schwarz
The board oversees an annual assessment of the effectiveness of risk management and internal compliance and control. The tasks of undertaking and assessing risk management and internal control effectiveness is delegated to management through the CEOs, including responsibility for the day to day design and implementation of the Company’s risk management and internal control system. Management reports to the board on the Company’s key risks and the extent to which it believes these risks are being adequately managed.
Management is required by the board to carry out risk specific management activities in five core areas:‐ strategic risk, operational risk, reporting risk, compliance risk, and environmental and sustainability risk. It is then required to assess risk management and associated internal compliance and control procedures and report back on the efficiency and effectiveness of these efforts.
For
per
sona
l use
onl
y

REDFLEX HOLDINGS LIMITED Annual Report 2014
CORPORATE GOVERNANCE STATEMENT ‐ Continued
REDFLEX – making a safer world
‐ 52 ‐
RISK MANAGEMENT‐ CONTINUED
A number of mechanisms are in place to ensure that management’s objectives and activities are aligned with the risks identified by the Risk and Compliance Committee and the board. These include:
Continuously identifying and measuring risks that might impact upon the achievement of the company's goals and objectives, and monitoring the environment for emerging factors and trends that affect these risks;
Formulating risk management strategies to manage identified risks, and designing and implementing appropriate risk management policies and internal controls; and
Monitoring the performance of, and continuously improving the effectiveness of, risk management systems and internal compliance and controls, including assessment of the effectiveness of risk management and internal compliance and control.
To assist investors in gaining a better understanding of the nature of the risks faced by the company, the board has prepared a list of operational risks as part of the Principle 7 disclosures. However, the board notes that this does not necessarily represent an exhaustive list and that it may be subject to change based on underlying market events such as fluctuations in exchange rates and demand volumes; political instability/sovereign risk in some operating sites; the occurrence of force majeure events by significant supplies; increasing costs of operations, including labour costs; and changed operating, market or regulatory environments as a result of climate change.
Underpinning the company’s risk management efforts are policies and procedures that are directed towards achieving the following objectives in relation to the requirements of Principle 7:
Effectiveness and efficiency in the use of the company’s resources;
Compliance with applicable laws and regulations; and
Preparation of reliable published financial information.
GROUP CFO CERTIFICATION
In accordance with section 295A of the Corporations Act, the Group CFO has provided a written statement to the board that:
Provides his view that the Company's financial report is founded on a sound system of risk management and internal compliance and control which implements the financial policies adopted by the board; and,
The Company's risk management and internal compliance and control system is operating effectively in all material respects.
The board agrees with the views of the ASX on this matter and notes that due to its nature, internal control assurance from the Group CFO can only be reasonable rather than absolute. This is due to such factors as the need for judgment, the use of testing on a sample basis, the inherent limitations in internal control and because much of the evidence available is persuasive rather than conclusive and therefore is not and cannot be designed to detect all weaknesses in control procedures.
In response to this, internal control questions are required to be completed by the key management personnel of all significant business units, including finance managers, in support of these written statements.
REMUNERATION
The company’s objective is to provide maximum stakeholder benefit from the retention of a high‐quality board and executive team by remunerating directors, executives and all employees fairly and appropriately with reference to relevant employment market conditions. To assist in achieving this objective, the nature and amount of executive directors’ and officers’ compensation is linked to the company’s financial and operational performance. The expected outcomes of the remuneration structure are:
retention and motivation of key executives;
attraction of quality management to the company; and
performance initiatives which allow executives to share the rewards of the success of the company.
For a full discussion of the Company’s remuneration philosophy and framework and the remuneration received by key management personnel, please refer to the remuneration report which is within the directors’ report.
The board is responsible for determining and reviewing compensation arrangements for the non‐executive directors, the Chief Executive Officers and the executive team. There is no scheme to provide retirement benefits to non‐executive directors, except for superannuation where it is applicable.
For
per
sona
l use
onl
y
REDFLEX HOLDINGS LIMITED Annual Report 2014
CORPORATE GOVERNANCE STATEMENT ‐ Continued
REDFLEX – making a safer world
‐ 53 ‐
REMUNERATION ‐ CONTINUED
The remuneration committee operates under a board approved Charter which is published on the company’s website. The committee comprises four non‐executive directors:
Terence Winters, committee chair
Adam Gray
Michael McConnell
Herman Schwarz
During the year other members of the remuneration committee were:
Robin Debernardi, committee chair until 1 November 2013 and member to 19 December 2013.
Albert Moyer, until 30 April 2014
For details regarding the qualifications of members and the number of committee meetings held and attended, please refer to the Directors’ Report.
SHAREHOLDER COMMUNICATION POLICY
Pursuant to Principle 6, Redflex Holdings Limited’s objective is to promote effective communication with its shareholders, and is committed to:
Ensuring that shareholders and the financial markets are provided with full and timely information about the Group’s activities in a balanced and understandable way;
Complying with continuous disclosure obligations contained in the ASX listing rules and the Corporations Act in Australia; and
Communicating effectively with shareholders and making it easy for shareholders to communicate with Redflex Holdings Limited.
To promote effective communication with shareholders and encourage effective participation at general meetings, information is communicated to shareholders:
through the release of information to the market via the ASX;
through the annual report and notices of general meetings;
through letters and other forms of communications directly with shareholders; and
by publishing relevant information on our website.
The Company’s website www.redflex.com.au has a dedicated investor relations section for the purpose of publishing all important Company information and relevant announcements made to the market.
The external auditors are required to attend the annual general meeting and are available to answer any questions shareholders may have concerning the conduct of the audit and preparation of the audit report.
DIVERSITY AT REDFLEX
The Group recognises the value contributed to the organisation by employing people with varying skills, cultural backgrounds, ethnicity and experience. Redflex values diversity at all levels within the Group and recognises that a talented workforce is a key to our business success. Each member of our workforce brings to Redflex their own unique capabilities, experiences and characteristics. Redflex actively values and embraces the diversity of our employees and is committed to creating an inclusive workplace where everyone is treated equally and fairly, and where discrimination, harassment and inequity are not tolerated.
To this end, the Group supports the recommendations contained in the ASX Corporate Governance Principles and Recommendations. The Group has established a diversity policy outlining the board’s measurable objectives for achieving diversity. The diversity policy is available in the corporate governance section on the Redflex website.
For
per
sona
l use
onl
y
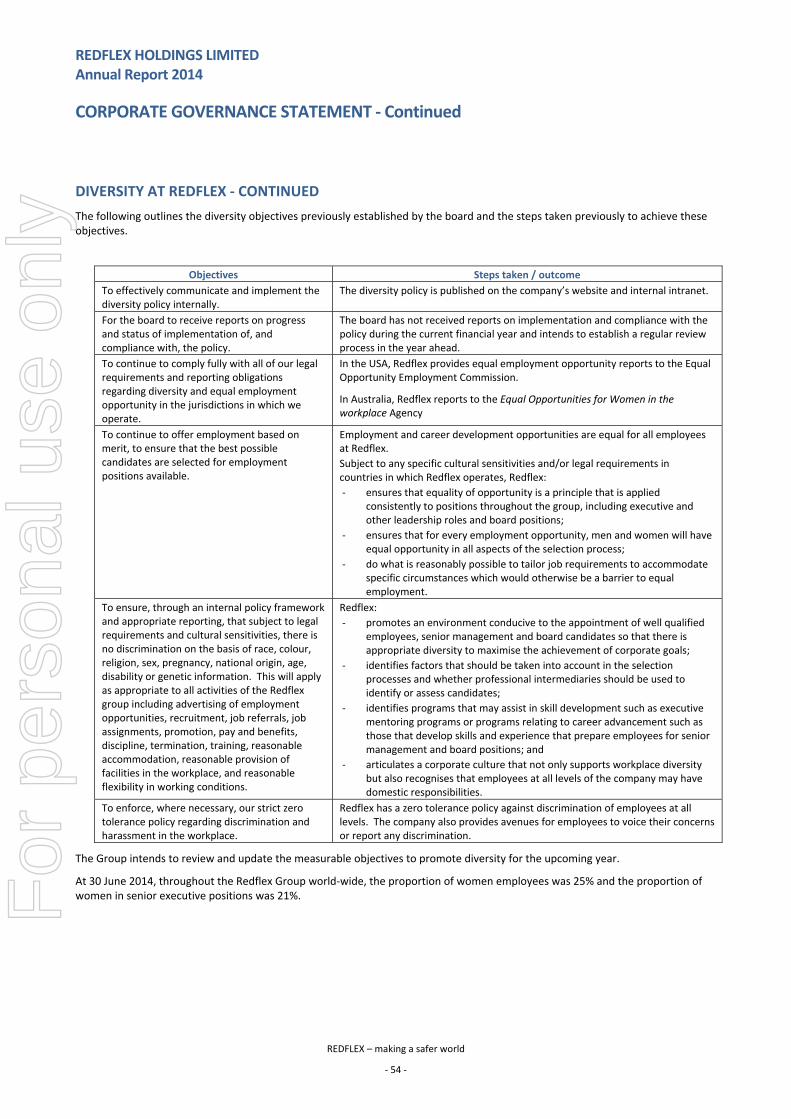
REDFLEX HOLDINGS LIMITED Annual Report 2014
CORPORATE GOVERNANCE STATEMENT ‐ Continued
REDFLEX – making a safer world
‐ 54 ‐
DIVERSITY AT REDFLEX ‐ CONTINUED
The following outlines the diversity objectives previously established by the board and the steps taken previously to achieve these objectives.
Objectives Steps taken / outcome
To effectively communicate and implement the diversity policy internally.
The diversity policy is published on the company’s website and internal intranet.
For the board to receive reports on progress and status of implementation of, and compliance with, the policy.
The board has not received reports on implementation and compliance with the policy during the current financial year and intends to establish a regular review process in the year ahead.
To continue to comply fully with all of our legal requirements and reporting obligations regarding diversity and equal employment opportunity in the jurisdictions in which we operate.
In the USA, Redflex provides equal employment opportunity reports to the Equal Opportunity Employment Commission.
In Australia, Redflex reports to the Equal Opportunities for Women in the workplace Agency
To continue to offer employment based on merit, to ensure that the best possible candidates are selected for employment positions available.
Employment and career development opportunities are equal for all employees at Redflex.
Subject to any specific cultural sensitivities and/or legal requirements in countries in which Redflex operates, Redflex:
‐ ensures that equality of opportunity is a principle that is applied consistently to positions throughout the group, including executive and other leadership roles and board positions;
‐ ensures that for every employment opportunity, men and women will have equal opportunity in all aspects of the selection process;
‐ do what is reasonably possible to tailor job requirements to accommodate specific circumstances which would otherwise be a barrier to equal employment.
To ensure, through an internal policy framework and appropriate reporting, that subject to legal requirements and cultural sensitivities, there is no discrimination on the basis of race, colour, religion, sex, pregnancy, national origin, age, disability or genetic information. This will apply as appropriate to all activities of the Redflex group including advertising of employment opportunities, recruitment, job referrals, job assignments, promotion, pay and benefits, discipline, termination, training, reasonable accommodation, reasonable provision of facilities in the workplace, and reasonable flexibility in working conditions.
Redflex:
‐ promotes an environment conducive to the appointment of well qualified employees, senior management and board candidates so that there is appropriate diversity to maximise the achievement of corporate goals;
‐ identifies factors that should be taken into account in the selection processes and whether professional intermediaries should be used to identify or assess candidates;
‐ identifies programs that may assist in skill development such as executive mentoring programs or programs relating to career advancement such as those that develop skills and experience that prepare employees for senior management and board positions; and
‐ articulates a corporate culture that not only supports workplace diversity but also recognises that employees at all levels of the company may have domestic responsibilities.
To enforce, where necessary, our strict zero tolerance policy regarding discrimination and harassment in the workplace.
Redflex has a zero tolerance policy against discrimination of employees at all levels. The company also provides avenues for employees to voice their concerns or report any discrimination.
The Group intends to review and update the measurable objectives to promote diversity for the upcoming year.
At 30 June 2014, throughout the Redflex Group world‐wide, the proportion of women employees was 25% and the proportion of women in senior executive positions was 21%.
For
per
sona
l use
onl
y
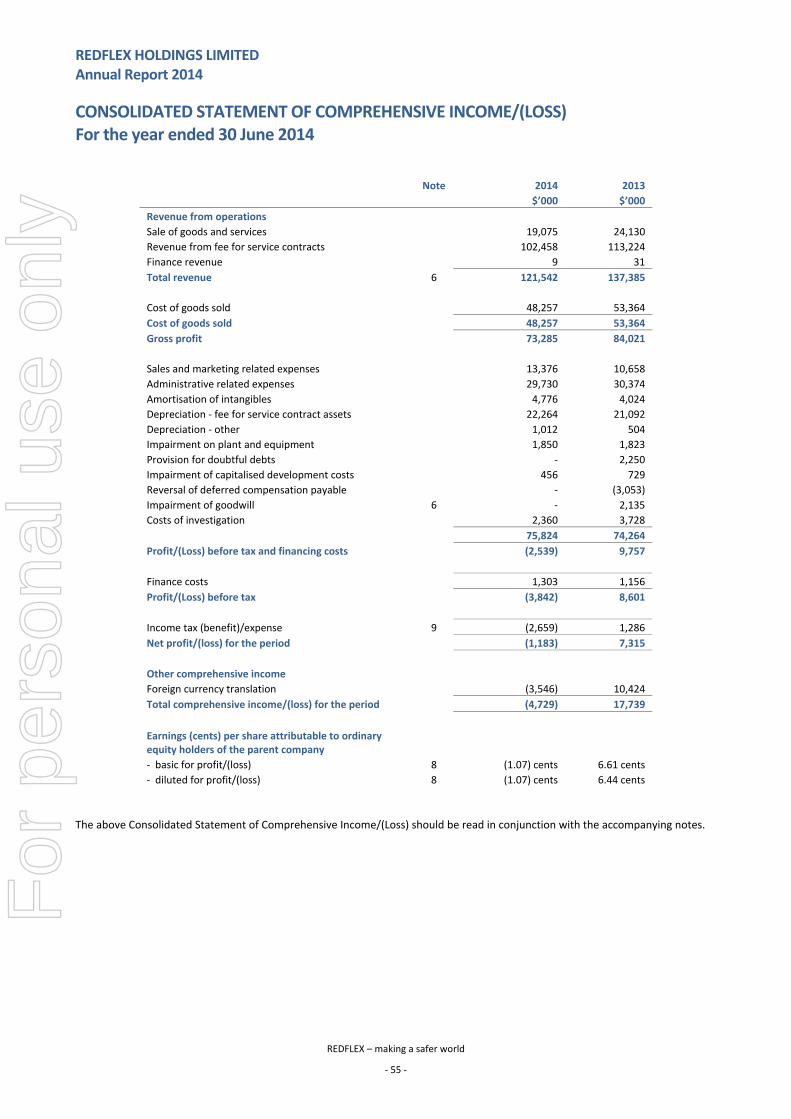
REDFLEX HOLDINGS LIMITED Annual Report 2014
CONSOLIDATED STATEMENT OF COMPREHENSIVE INCOME/(LOSS) For the year ended 30 June 2014
REDFLEX – making a safer world
‐ 55 ‐
Note 2014 2013
$’000 $’000
Revenue from operations
Sale of goods and services 19,075 24,130
Revenue from fee for service contracts 102,458 113,224
Finance revenue 9 31
Total revenue 6 121,542 137,385
Cost of goods sold 48,257 53,364
Cost of goods sold 48,257 53,364
Gross profit 73,285 84,021
Sales and marketing related expenses 13,376 10,658
Administrative related expenses 29,730 30,374
Amortisation of intangibles 4,776 4,024
Depreciation ‐ fee for service contract assets 22,264 21,092
Depreciation ‐ other 1,012 504
Impairment on plant and equipment 1,850 1,823
Provision for doubtful debts ‐ 2,250
Impairment of capitalised development costs 456 729
Reversal of deferred compensation payable ‐ (3,053)
Impairment of goodwill 6 ‐ 2,135
Costs of investigation 2,360 3,728
75,824 74,264
Profit/(Loss) before tax and financing costs (2,539) 9,757
Finance costs 1,303 1,156
Profit/(Loss) before tax (3,842) 8,601
Income tax (benefit)/expense 9 (2,659) 1,286
Net profit/(loss) for the period (1,183) 7,315
Other comprehensive income
Foreign currency translation (3,546) 10,424
Total comprehensive income/(loss) for the period (4,729) 17,739
Earnings (cents) per share attributable to ordinary equity holders of the parent company
‐ basic for profit/(loss) 8 (1.07) cents 6.61 cents
‐ diluted for profit/(loss) 8 (1.07) cents 6.44 cents
The above Consolidated Statement of Comprehensive Income/(Loss) should be read in conjunction with the accompanying notes.
For
per
sona
l use
onl
y

REDFLEX HOLDINGS LIMITED Annual Report 2014
CONSOLIDATED STATEMENT OF FINANCIAL POSITION As at 30 June 2014
REDFLEX – making a safer world
‐ 56 ‐
Note 2014 2013
$’000 $’000
ASSETS
Current Assets
Cash and cash equivalents 10 13,749 21,246
Trade and other receivables 11 18,299 25,508
Inventories 12 20,247 20,270
Income tax refundable 1,582 ‐
Other assets 1,953 2,193
Total Current Assets 55,830 69,217
Non‐Current Assets
Property plant and equipment 13 61,281 72,368
Deferred tax asset 9 13,076 15,221
Intangible assets and goodwill 14 31,126 28,233
Other financial assets 1,127 2,057
Other non‐current assets 15 8,947 9,289
Total Non‐Current Assets 115,557 127,168
TOTAL ASSETS 171,387 196,385
LIABILITIES AND EQUITY
Current Liabilities
Trade and other payables 16 17,826 18,502
Interest bearing borrowings 17 15,895 ‐
Income tax payable 917 2,006
Provisions 18 5,518 4,737
Other current liabilities 59 365
Total Current Liabilities 40,215 25,610
Non‐Current Liabilities
Interest bearing borrowings 17 ‐ 26,030
Deferred tax liabilities 9 9,380 15,933
Provisions 19 4,026 3,562
Total Non‐current Liabilities 13,406 45,525
TOTAL LIABILITIES 53,621 71,135
NET ASSETS 117,766 125,250
Equity attributable to equity holders of the parent company
Contributed equity 21 101,765 101,765
Reserves 22 (14,908) (10,907)
Retained earnings 22 30,909 34,392
EQUITY ATTRIBUTABLE TO OWNERS OF THE PARENT 117,766 125,250
The above Consolidated Statement of Financial Position should be read in conjunction with the accompanying notes.
For
per
sona
l use
onl
y
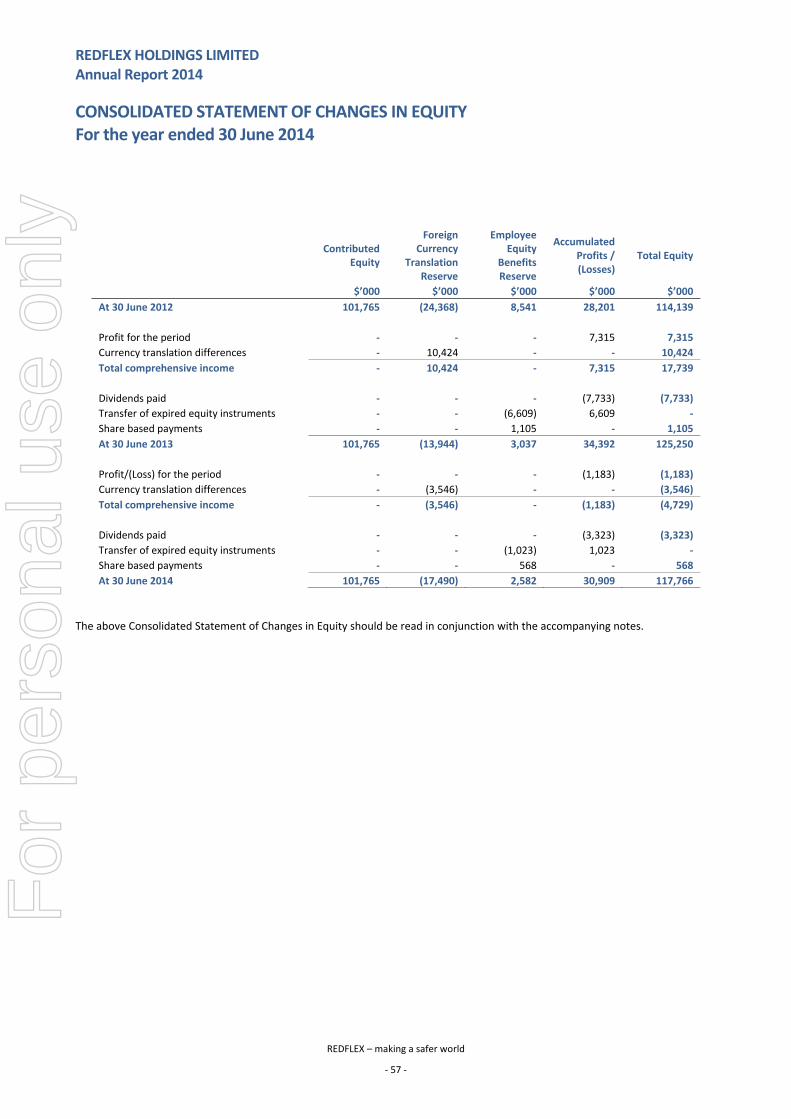
REDFLEX HOLDINGS LIMITED Annual Report 2014
CONSOLIDATED STATEMENT OF CHANGES IN EQUITY For the year ended 30 June 2014
REDFLEX – making a safer world
‐ 57 ‐
Contributed
Equity
Foreign Currency
Translation Reserve
Employee Equity
Benefits Reserve
Accumulated Profits / (Losses)
Total Equity
$’000 $’000 $’000 $’000 $’000
At 30 June 2012 101,765 (24,368) 8,541 28,201 114,139
Profit for the period ‐ ‐ ‐ 7,315 7,315
Currency translation differences ‐ 10,424 ‐ ‐ 10,424
Total comprehensive income ‐ 10,424 ‐ 7,315 17,739
Dividends paid ‐ ‐ ‐ (7,733) (7,733)
Transfer of expired equity instruments ‐ ‐ (6,609) 6,609 ‐
Share based payments ‐ ‐ 1,105 ‐ 1,105
At 30 June 2013 101,765 (13,944) 3,037 34,392 125,250
Profit/(Loss) for the period ‐ ‐ ‐ (1,183) (1,183)
Currency translation differences ‐ (3,546) ‐ ‐ (3,546)
Total comprehensive income ‐ (3,546) ‐ (1,183) (4,729)
Dividends paid ‐ ‐ ‐ (3,323) (3,323)
Transfer of expired equity instruments ‐ ‐ (1,023) 1,023 ‐
Share based payments ‐ ‐ 568 ‐ 568
At 30 June 2014 101,765 (17,490) 2,582 30,909 117,766
The above Consolidated Statement of Changes in Equity should be read in conjunction with the accompanying notes.
For
per
sona
l use
onl
y
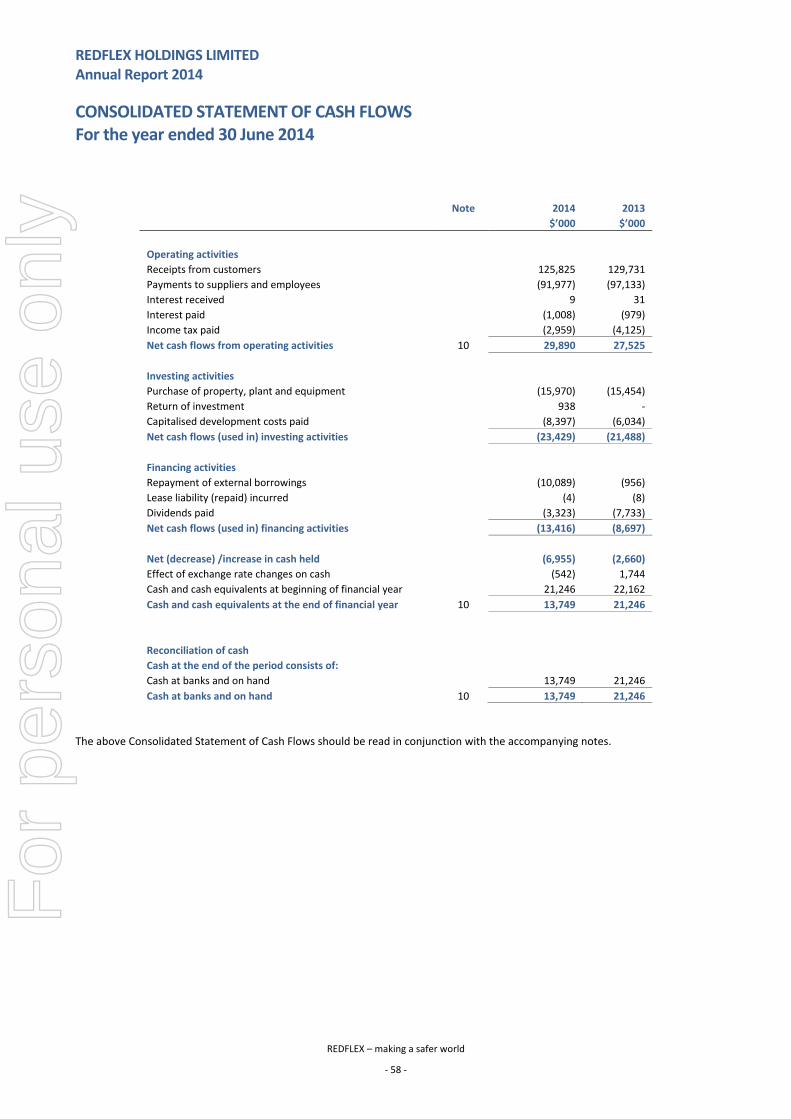
REDFLEX HOLDINGS LIMITED Annual Report 2014
CONSOLIDATED STATEMENT OF CASH FLOWS For the year ended 30 June 2014
REDFLEX – making a safer world
‐ 58 ‐
Note 2014 2013
$’000 $’000
Operating activities
Receipts from customers 125,825 129,731
Payments to suppliers and employees (91,977) (97,133)
Interest received 9 31
Interest paid (1,008) (979)
Income tax paid (2,959) (4,125)
Net cash flows from operating activities 10 29,890 27,525
Investing activities
Purchase of property, plant and equipment (15,970) (15,454)
Return of investment 938 ‐
Capitalised development costs paid (8,397) (6,034)
Net cash flows (used in) investing activities (23,429) (21,488)
Financing activities
Repayment of external borrowings (10,089) (956)
Lease liability (repaid) incurred (4) (8)
Dividends paid (3,323) (7,733)
Net cash flows (used in) financing activities (13,416) (8,697)
Net (decrease) /increase in cash held (6,955) (2,660)
Effect of exchange rate changes on cash (542) 1,744
Cash and cash equivalents at beginning of financial year 21,246 22,162
Cash and cash equivalents at the end of financial year 10 13,749 21,246
Reconciliation of cash
Cash at the end of the period consists of:
Cash at banks and on hand 13,749 21,246
Cash at banks and on hand 10 13,749 21,246
The above Consolidated Statement of Cash Flows should be read in conjunction with the accompanying notes.
For
per
sona
l use
onl
y
REDFLEX HOLDINGS LIMITED
Notes to the consolidated financial statements for the year ended 30 June 2014
REDFLEX – making a safer world
‐ 59 ‐
NOTE 1 CORPORATE INFORMATION
The consolidated financial statements of Redflex Holdings Limited (a for profit entity) for the year ended 30 June 2014 were authorised for issue in accordance with a resolution of directors on 30 September 2014.
Redflex Holdings Limited (“Redflex, the “Company”, “Group”) is an Australian incorporated company and is limited by shares that are publicly traded on the Australian Securities Exchange (ASX). Redflex shares trade as RDF.
The nature of the operations and principal activities of the Group are described in the Directors’ Report.
NOTE 2 SUMMARY OF SIGNIFICANT ACCOUNTING POLICIES
TABLE OF CONTENTS
2.1 Basis of Preparation
2.2 Compliance with IFRS
2.3 Accounting standards and interpretations
(i) Changes in accounting policy and disclosures
(ii) Accounting standards and interpretations issued but not yet effective
Summary of significant accounting policies
(a) Basis of consolidation
(b) Business combinations
(c) Goodwill
(d) Fair value
(e) Operating segments
(f) Foreign currency translation
(g) Revenue recognition
(h) Income tax and other taxes
(i) Property, plant and equipment
(j) Leases
(k) Borrowing costs
(l) Intangible assets
(m) Inventories
(n) Impairment of non‐financial assets other than goodwill
(o) Cash and cash equivalents
(p) Provisions and employee leave benefits
(q) Share based payment transactions
(r) Trade and other receivables
(s) Investment and other financial assets
(t) Trade and other payables
(u) Interest‐bearing loans and borrowings
(v) Contributed equity
(w) Earnings per share
(x) Maintenance warranty
(y) Asset retirement obligation
(z) Deferred costs asset
2.4 Changes in accounting policies and disclosures
For
per
sona
l use
onl
y
REDFLEX HOLDINGS LIMITED
Notes to the consolidated financial statements for the year ended 30 June 2014
REDFLEX – making a safer world
‐ 60 ‐
NOTE 2 SUMMARY OF SIGNIFICANT ACCOUNTING POLICIES ‐ CONTINUED
2.1 BASIS OF PREPARATION
This financial report is a general purpose financial report, which has been prepared in accordance with the requirements of the Corporations Act 2001, Australian Accounting Standards and other authoritative pronouncements of the Australian Accounting Standards Board. The financial report has been prepared on a historical cost basis.
The financial report is presented in Australian dollars and all values are rounded to the nearest thousand dollars ($’000) unless otherwise stated under the option available to the company under ASIC class order 98/100. The company is an entity to which the class order applies.
Prior period comparative have been adjusted to provide added disclosure on revenue attributes to more accurately reflect their recurring nature.
2.2 COMPLIANCE WITH IFRS
The financial report complies with Australian Accounting Standards as issued by the Australian Accounting Standards Board and International Financial Reporting Standards (IFRS) as issued by the International Accounting Standards Board.
2.3 ACCOUNTING STANDARDS AND INTERPRETATIONS
(i) Changes in accounting policy and disclosures
In the current year, the Group has applied a number of new and revised AASBs and Interpretations issued by the Australian Accounting Standards Board (AASB) that are mandatorily effective for an accounting period that begins on or after 1 July 2013.
The following new and revised Standards and Interpretations have been adopted in the current period. The adoption only affected the disclosures in the notes to the financial statements.
AASB 13: Fair value measurement
AASB 13 establishes a single source of guidance under AASB for determining the fair value of assets and liabilities. AASB 13 does not change when an entity is required to use fair value, but rather, provides guidance on how to determine fair value under Australian Accounting Standards. AASB 13 defines fair value as an exit price. As a result of guidance, the Group re‐assessed its policies for measuring fair values, in particular, its valuation inputs such as non‐ performance risk for fair value measurement of liabilities. Application of AASB 13 has not materially impacted the fair value measures of the Group. Additional disclosures, where required, are provided in the individual notes relating to the assets and liabilities whose fair values were determined.
AASB 2011‐4: Amendments to Australian Accounting standards to remove individual key management personnel disclosures and requirements
This amendment deletes from AASB 124 individual key management personnel disclosure requirements for disclosing entities that are not companies. It also removes the individual KMP disclosure requirements for all disclosing entities in relation to equity holdings, loans and other related party transactions. In the current year, the individual key management personnel disclosure, previously required by AASB 124 is now disclosed in the remuneration report due to an amendment to Corporations Regulations 2001 issued in June 2013.
AASB 10: ‘Consolidated financial statements’
AASB 10 establishes a new control model that applies to all entities. It replaces parts of AASB 127 Consolidated and Separate Financial Statements dealing with the accounting for consolidated financial statements and UIG‐112 Consolidated Special Purpose Entities. The new control model broadens the situations when an entity is considered to be controlled by another entity and includes new guidance for applying the model to specific situations, including when acting as a manager may give control, the impact of potential voting rights and when holding less than a majority voting rights may give control. Consequential amendments were also made to other standards via AASB 2011 7 and amendments to AASB 2002‐10.
Application of AASB 10 has not materially impacted on the amounts recognised in the financial statements. Additional disclosures, where required, have been provided.
For
per
sona
l use
onl
y
REDFLEX HOLDINGS LIMITED
Notes to the consolidated financial statements for the year ended 30 June 2014
REDFLEX – making a safer world
‐ 61 ‐
NOTE 2 SUMMARY OF SIGNIFICANT ACCOUNTING POLICIES ‐ CONTINUED
2.3 ACCOUNTING STANDARDS AND INTERPRETATIONS ‐ CONTINUED
(i) Changes in accounting policy and disclosures ‐ continued
Recoverable Amount Disclosures for Non‐Financial Assets – Amendments to AASB 136 Impairment of Assets
These amendments remove the unintended consequences of AASB 13 on the disclosures required under AASB 136. In addition, these amendments require disclosure of the recoverable amounts for the assets or CGUs for which impairment loss has been recognised or reversed during the period. These amendments are effective retrospectively for annual periods beginning on or after 1 January 2014 with earlier application permitted, provided AASB 13 is also applied. The Group has early adopted these amendments to AASB 136 in the current period since the amended/additional disclosures provide useful information as intended by the AASB. Accordingly, these amendments have been considered while making disclosures for impairment of nonfinancial assets in Note 14. These amendments would continue to be considered for future disclosures.
Other new and revised AASB’s and interpretations did not have any impact on the accounting policies, financial position or performance of the Group:
AASB 7 – Financial Instruments Disclosures: Offsetting Financial Assets and Financial Liabilities‐ amendments to AASB 7
AASB 127 Separate Financial Statements
AASB 11 Joint Arrangements, AASB 128 Investments in Associates and Joint Ventures.
AASB 12 Disclosure of Interests in Other Entities
AASB 119 Employee Benefits (revised 2011)
Improvements to AASB’s 2009‐2100 Cycle
(ii) Accounting standards and interpretations issued but not yet effective
Australian Accounting Standards and Interpretations that have recently been issued or amended but are not yet effective and have not been adopted by the Group for the annual reporting period ending 30 June 2014 and 30 June 2013 are outlined in the tables below.
Reference Title Summary Application date of standard
Impact on Group financial report
Application date for Group
AASB 2013‐3 Amendments to AASB 136 – Recoverable Amount Disclosures for Non‐Financial Assets
AASB 2013‐3 amends the disclosure requirements in AASB 136 Impairment of Assets. The amendments include the requirement to disclose additional information about the fair value measurement when the recoverable amount of impaired assets is based on fair value less costs of disposal.
1 Jan 2014 No material impact expected
1 Jul 2014
Ammend‐ments to IAS 16 and AIS 38
Clarification of Acceptable Methods of Depreciation and Amortisation (Amendments to
IAS 16 and IAS 38)
IAS 16 and IAS 38 both establish the principle for the basis of depreciation and amortisation as being the expected pattern of consumption of the future economic benefits of an asset.
The IASB has clarified that the use of revenue‐based methods to calculate the depreciation of an asset is not appropriate because revenue generated by an activity that includes the use of an asset generally reflects factors other than the consumption of the economic benefits embodied in the asset.
The IASB also clarified that revenue is generally presumed to be an inappropriate basis for measuring the consumption of the economic benefits embodied in an intangible asset. This presumption, however, can be rebutted in certain limited circumstances.
1 Jan 2016 No material impact expected
1 Jul 2016
For
per
sona
l use
onl
y
REDFLEX HOLDINGS LIMITED
Notes to the consolidated financial statements for the year ended 30 June 2014
REDFLEX – making a safer world
‐ 62 ‐
NOTE 2 SUMMARY OF SIGNIFICANT ACCOUNTING POLICIES ‐ CONTINUED
2.3 ACCOUNTING STANDARDS AND INTERPRETATIONS – CONTINUED
(ii) Accounting standards and interpretations issued but not yet effective ‐ continued
Reference Title Summary Application date of standard
Impact on Group financial report
Application date for Group
IFRS 15 Revenue from Contracts with Customers
IFRS 15 establishes principles for reporting useful information to users of financial statements about the nature, amount, timing and uncertainty of revenue and cash flows arising from an entity’s contracts with customers.
IFRS 15 supersedes:
(a) IAS 11 Construction Contracts
(b) IAS 18 Revenue
(c) IFRIC 13 Customer Loyalty Programmes
(d) IFRIC 15 Agreements for the Construction of Real Estate
(e) IFRIC 18 Transfers of Assets from Customers
(f) SIC‐31 Revenue—Barter Transactions Involving Advertising Services
The core principle of IFRS 15 is that an entity recognises revenue to depict the transfer of promised goods or services to customers in an amount that reflects the consideration to which the entity expects to be entitled in exchange for those goods or services. An entity recognises revenue in accordance with that core principle by applying the following steps:
(a) Step 1: Identify the contract(s) with a customer
(b) Step 2: Identify the performance obligations in the contract
(c) Step 3: Determine the transaction price
(d) Step 4: Allocate the transaction price to the performance obligations in the contract
(e) Step 5: Recognise revenue when (or as) the entity satisfies a performance obligation
Early application of this standard is permitted.
1 Jan 2017 Impact to be assessed
1 July 2017
For
per
sona
l use
onl
y

REDFLEX HOLDINGS LIMITED
Notes to the consolidated financial statements for the year ended 30 June 2014
REDFLEX – making a safer world
‐ 63 ‐
NOTE 2 SUMMARY OF SIGNIFICANT ACCOUNTING POLICIES ‐ CONTINUED
2.3 ACCOUNTING STANDARDS AND INTERPRETATIONS – CONTINUED
ii) Accounting standards and interpretations issued but not yet effective ‐ continued
Reference Title Summary Application date of standard
Impact on Group financial report
Application date for Group
AASB 9 Financial Instruments
AASB 9 includes requirements for the classification and measurement of financial assets. It was further amended by AASB 2010‐7 to reflect amendments to the accounting for financial liabilities.
These requirements improve and simplify the approach for classification and measurement of financial assets compared with the requirements of AASB 139. The main changes are described below.
a. Financial assets that are debt instruments will be classified based on (1) the objective of the entity's business model for managing the financial assets; (2) the characteristics of the contractual cash flows.
b. Allows an irrevocable election on initial recognition to present gains and losses on investments in equity instruments that are not held for trading in other comprehensive income. Dividends in respect of these investments that are a return on investment can be recognised in profit or loss and there is no impairment or recycling on disposal of the instrument.
c. Financial assets can be designated and measured at fair value through profit or loss at initial recognition if doing so eliminates or significantly reduces a measurement or recognition inconsistency that would arise from measuring assets or liabilities, or recognising the gains and losses on them, on different bases.
d. Where the fair value option is used for financial liabilities the change in fair value is to be accounted for as follows:
‐ The change attributable to changes in credit risk are presented in other comprehensive income (OCI),
‐ The remaining change is presented in profit or loss.
If this approach creates or enlarges an accounting mismatch in the profit or loss, the effect of the changes in credit risk are also presented in profit or loss.
Consequential amendments were also made to other standards as a result of AASB 9, introduced by AASB 2009‐11 and superseded by AASB 2010‐7 and 2010‐10.
The AASB issued a revised version of AASB 9 (AASB 2013‐9) during December 2013. The revised standard incorporates three primary changes:
1.New hedge accounting requirements including changes to hedge effectiveness testing, treatment of hedging costs, risk components that can be hedged and disclosures
2.Entities may elect to apply only the accounting for gains and losses from own credit risk without applying the other requirements of AASB 9 at the same time
3.In February 2014, the IASB tentatively decided that the mandatory effective date for AASB 9 will be 1 January 2018
1 Jan 2018 No material impact expected
1 Jul 2018
For
per
sona
l use
onl
y
REDFLEX HOLDINGS LIMITED
Notes to the consolidated financial statements for the year ended 30 June 2014
REDFLEX – making a safer world
‐ 64 ‐
NOTE 2 SUMMARY OF SIGNIFICANT ACCOUNTING POLICIES ‐ CONTINUED
(a) Basis of consolidation
The consolidated financial statements comprise the financial statements of the Group and its subsidiaries as at 30 June 2014.
Consolidation of a subsidiary begins when the Group obtains control over the subsidiary and ceases when the Group loses control of the subsidiary.
Control is achieved when the Group is exposed, or has rights, to variable returns from its involvement with the investee and has the ability to affect those returns through its power over the investee. Specifically, the Group controls an investee if and only if the Group has:
Power over the investee (i.e. existing rights that give it the current ability to direct the relevant activities of the investee)
Exposure, or rights, to variable returns from its involvement with the investee, and
The ability to use its power over the investee to affect its returns.
When the Group has less than a majority of the voting or similar rights of an investee, the Group considers all relevant facts and circumstances in assessing whether it has power over an investee, including:
The contractual arrangement with the other vote holders of the investee;
Rights arising from other contractual arrangements; and
The Group’s voting rights and potential voting rights.
The Group re‐assesses whether or not it controls an investee if facts and circumstances indicate that there are changes to one or more of the three elements of control. Assets, liabilities, income and expenses of a subsidiary acquired or disposed of during the year are included in the statement of comprehensive income from the date the Group gains control until the date the Group ceases to control the subsidiary.
Profit or loss and each component of other comprehensive income (OCI) are attributed to the equity holders of the parent of the Group and to the non‐controlling interests, even if this results in the non‐ controlling interests having a deficit balance. When necessary, adjustments are made to the financial statements of subsidiaries to bring their accounting policies into line with the Group’s accounting policies. All intra‐group assets and liabilities, equity, income, expenses and cash flows relating to transactions between members of the Group are eliminated in full on consolidation.
A change in the ownership interest of a subsidiary, without a loss of control, is accounted for as an equity transaction. If the Group loses control over a subsidiary, it:
De‐recognises the assets (including goodwill) and liabilities of the subsidiary;
De‐recognises the carrying amount of any non‐controlling interests;
De‐recognises the cumulative translation differences recorded in equity;
Recognises the fair value of the consideration received;
Recognises the fair value of any investment retained;
Recognises any surplus or deficit in profit or loss;
Reclassifies the parent’s share of components previously recognised in OCI to profit or loss or retained earnings, as appropriate, as would be required if the Group had directly disposed of the related assets or liabilities.
(b) Business combinations
Business combinations are accounted for using the acquisition method. The cost of an acquisition is measured as the aggregate of the consideration transferred, measured at acquisition date fair value and the amount of any non‐controlling interest in the acquiree. For each business combination, the Group elects whether it measures the non‐controlling interest in the acquiree either at fair value or at the proportionate share of the acquiree’s identifiable net assets. Acquisition costs incurred are expensed and included in administration expenses.
When the Group acquires a business, it assesses the financial assets and liabilities assumed for appropriate classification and designation in accordance with the contractual terms, economic circumstances and pertinent conditions at the acquisition date. This includes the separation of embedded derivatives in host contracts by the acquirer.
If the business combination is achieved in stages, the previously held equity interest is remeasured at its acquisition date fair value and any resulting gain or loss is recognised in profit or loss.
For
per
sona
l use
onl
y
REDFLEX HOLDINGS LIMITED
Notes to the consolidated financial statements for the year ended 30 June 2014
REDFLEX – making a safer world
‐ 65 ‐
NOTE 2 SUMMARY OF SIGNIFICANT ACCOUNTING POLICIES ‐ CONTINUED
(b) Business combinations (Continued)
Any contingent consideration to be transferred by the acquirer will be recognised at fair value at the acquisition date. Subsequent changes to the fair value of the contingent consideration that is deemed to be an asset or liability will be recognised in accordance with AASB 139 Financial Instruments – recognition and measurement, either in profit or loss or as a change to other comprehensive income. If the contingent consideration is classified as equity, it will not be remeasured. Subsequent settlement is accounted for within equity. In instances where the contingent consideration does not fall within the scope of AASB 139 it is measured in accordance with the appropriate accounting standard.
(c) Goodwill
Goodwill relates to the acquisition of the Redflex Student Guardian business. Goodwill is initially measured at cost, being the excess of the aggregate of the consideration transferred and the amount recognised for non‐controlling interest over the net identifiable assets acquired and liabilities assumed. If this consideration is lower than the fair value of the net assets of the subsidiary acquired, the difference is recognised in profit or loss.
After initial recognition, goodwill is measured at cost less any accumulated impairment losses. For the purpose of impairment testing, goodwill acquired in a business combination is, from the acquisition date, allocated to each of the Group’s cash‐generating units that are expected to benefit from the combination, irrespective of whether other assets or liabilities of the acquire are assigned to those units.
Where goodwill forms part of a cash‐generating unit and part of the operation within that unit is disposed of, the goodwill associated with the operation disposed of is included in the carrying amount of the operation when determining the gain or loss on disposal of the operation. Goodwill disposed of in this circumstance is measured based on the relative values of the operation disposed of and the portion of the cash‐generating unit retained.
For the purpose of impairment testing, goodwill acquired in a business combination is, from the acquisition date, allocated to each of the Group’s cash‐generating units or groups of cash‐generating units that are expected to benefit from the synergies of the combination, irrespective of whether other assets or liabilities of the Group are assigned to those units or groups of units. Each unit or group of units to which the goodwill is so allocated represents the lowest level within the Group at which the goodwill is monitored for internal management purposes; and is not larger than an operating segment determined in accordance with AASB 8, and includes:
The North American traffic business.
The Australia/International traffic business.
The Group performs its impairment testing as at 30 June each year using discounted cash flows under the value in use methodology to determine the fair value for the Redflex Student Guardian business to which goodwill is allocated.
When the recoverable amount of the cash‐generating unit (group of cash‐generating units) is less than the carrying amount, an impairment loss is recognised. When goodwill forms part of a cash‐generating unit (group of cash‐generating units) and an operation within that unit is disposed of, the goodwill associated with the operation disposed of is included in the carrying amount of the operation when determining the gain or loss on disposal of the operation. Goodwill disposed of in this manner is measured based on the relative values of the operation disposed of and the portion of the cash‐generating unit retained.
Impairment losses recognised for goodwill are not subsequently reversed.
For
per
sona
l use
onl
y

REDFLEX HOLDINGS LIMITED
Notes to the consolidated financial statements for the year ended 30 June 2014
REDFLEX – making a safer world
‐ 66 ‐
NOTE 2 SUMMARY OF SIGNIFICANT ACCOUNTING POLICIES ‐ CONTINUED
(d) Fair Value
Fair value is the price that would be received to sell an asset or paid to transfer a liability in an orderly transaction between market participants at the measurement date. The fair value measurement is based on the presumption that the transaction to sell the asset or transfer the liability takes place either:
In the principal market for the asset or liability, or
In the absence of a principal market, in the most advantageous market for the asset or liability.
The principal or the most advantageous market must be accessible to the Group.
The fair value of an asset or a liability is measured using the assumptions that market participants would use when pricing the asset or liability, assuming that market participants act in their economic best interest.
A fair value measurement of a non‐financial asset takes into account a market participant's ability to generate economic benefits by using the asset in its highest and best use or by selling it to another market participant that would use the asset in its highest and best use.
The Group uses valuation techniques that are appropriate in the circumstances and for which sufficient data are available to measure fair value, maximising the use of relevant observable inputs and minimising the use of unobservable inputs.
(e) Operating segments
An operating segment is a component of an entity that engages in business activities from which it may earn revenues and incur expenses (including revenues and expenses relating to transactions with other components of the same entity), whose operating results are regularly reviewed by the entity’s chief operating decision makers to make decisions about resources to be allocated to the segment and assess its performance, and for which discrete financial information is available. This includes startup operations which are yet to earn revenues. Management will also consider other factors in determining operating segments such as the existence of a line manager and the level of segment information presented to the board of directors.
Operating segments have been identified based on the information provided to the chief operating decision makers – being the executive management team.
The Group aggregates two or more operating segments when they have similar economic characteristics, and the segments are similar in each of the following respects:‐ nature of the products and services; nature of the production processes; type or class of customer for the products and services; methods used to distribute the products or provide the services; and if applicable, the nature of the regulatory environment.
Operating segments that meet the quantitative criteria as prescribed by AASB 8 are reported separately. However, an operating segment that does not meet the quantitative criteria is still reported separately where information about the segment would be useful to users of the financial statements. Refer to Note 5 for additional information.
(f) Foreign currency translation
The Group’s consolidated financial statements are presented in Australian dollars, which is also the parent company’s functional currency. Each entity in the Group determines its own functional currency and items included in the financial statements of each entity are measured using that functional currency. The Group has elected to recycle the gain or loss that arises from the direct method of consolidation, which is the method the Group uses to complete its consolidation.
Redflex Traffic Systems Inc, the North American traffic business’s functional currency is United States Dollars (US$); the functional currency of the back office operations in Saudi Arabia for Traffic Operating Services (Saudi Arabia) LLC is Saudi Arabian Riyals; the functional currency of Redflex Traffic Systems Limited operations in United Kingdom is Great British Pounds; and, the functional currency of Redflex Traffic Systems Malaysia Sdn Bhd is Malaysian Ringgit.
For
per
sona
l use
onl
y
REDFLEX HOLDINGS LIMITED
Notes to the consolidated financial statements for the year ended 30 June 2014
REDFLEX – making a safer world
‐ 67 ‐
NOTE 2 SUMMARY OF SIGNIFICANT ACCOUNTING POLICIES – CONTINUED
f) Foreign currency translation ‐ continued
(i) Transactions and balances
Transactions in foreign currencies are initially recorded in the functional currency by applying the exchange rates ruling at the date of the transaction. Monetary assets and liabilities denominated in foreign currencies are retranslated at the rate of exchange ruling at the reporting date.
Non‐monetary items that are measured in terms of historical cost in a foreign currency are translated using the exchange rate as at the date of the initial transaction. Non‐monetary items measured at fair value in a foreign currency are translated using the exchange rates at the date when the fair value was determined.
(ii) Group companies
On consolidation, the assets and liabilities of foreign operations are translated into Australian dollars at the rate of exchange prevailing at the reporting date and their income statements are translated at exchange rates prevailing at the dates of the transactions. The exchange differences arising on translation for consolidation are recognised in other comprehensive income. On disposal of a foreign operation, the component of other comprehensive income relating to that particular foreign operation is recognised in the income statement.
Any goodwill arising on the acquisition of a foreign operation subsequent to 1 January 2005 and any fair value adjustments to the carrying amounts of assets and liabilities arising on the acquisition are treated as assets and liabilities of the foreign operation and translated at the spot rate of exchange at the reporting date.
(g) Revenue recognition
Revenue is recognised and measured at the fair value of the consideration received or receivable to the extent it is probable that the economic benefits will flow to the Group and the revenue can be reliably measured. The following specific recognition criteria must also be met before revenue is recognised. Refer also to Note (Z).
Sale of goods
Revenue from sale of goods is recognised when the significant risks and rewards of ownership of the goods have passed to the buyer and can be reasonably measured. Revenue on certain fixed price contracts where the Group provides systems development integration and installation services are recognised over the contract term based on the percentage of completion. The percentage of completion methodology is used where the contract outcome can be reliably measured, control of a right to be compensated for the services has been attained and the stage of completion can be reliably measured. Under this method revenue recognised is measured by the percentage of costs incurred to date to total estimated costs for each contract. Stage of completion is measured by reference to the material costs and labour hours incurred to date as a percentage of total material costs and estimated labour hours for each contract. Where the contract outcome cannot be reliably measured, revenue is recognised only to the extent that costs have been incurred and are recoverable.
Additional revenue in the United States is derived from the sale of photo enforcement equipment to municipal governments under fixed contracts. Revenue on these equipment sales is recorded over the duration of the contract.
Fee for service contracts and licences
Revenue is principally derived from fees and traffic citations issued in jurisdictions where the company’s equipment is located. Revenue is recognised when a traffic infraction is recorded by the company’s equipment in various jurisdictions. The company records an allowance on revenues based on historical collection rates and citation enforceability. Licence revenue is recognised in accordance with specific contract arrangements between the Group and third parties.
For
per
sona
l use
onl
y

REDFLEX HOLDINGS LIMITED
Notes to the consolidated financial statements for the year ended 30 June 2014
REDFLEX – making a safer world
‐ 68 ‐
NOTE 2 SUMMARY OF SIGNIFICANT ACCOUNTING POLICIES – CONTINUED
(g) Revenue recognition ‐ continued
Deferred revenue
Certain of the Company’s sales include the sale of equipment combined with the provision of services for a period exceeding one year. Revenue is recognised based on a commercial equipment sales margin, and service revenue is deferred and recognised over the period of service. Deferred revenue principally represents payments received for which services remain to be provided. Amounts are recognised as revenue when service has been provided.
Interest income
Revenue is recognised as interest accrues using the effective interest method. This is a method of calculating the amortised cost of a financial asset and allocating the interest income over the relevant period using the effective interest rate, which is the rate that exactly discounts estimated future cash receipts through the expected life of the financial asset to the net carrying amount of the financial asset.
(h) Income tax and other taxes
Current tax assets and liabilities for the current and prior periods are measured at the amount expected to be recovered from or paid to the taxation authorities based on the current period’s taxable income. The tax rates and tax laws used to compute the amount are those that are enacted or substantively enacted by the reporting date.
Deferred income tax is provided on all temporary differences at the reporting date between the tax bases of assets and liabilities and their carrying amounts for financial reporting purposes.
Deferred income tax liabilities are recognised for all taxable temporary differences except:
When the deferred income tax liability arises from the initial recognition of goodwill or an asset or liability in a transaction that is not a business combination and that, at the time of the transaction, affects neither the accounting profit nor taxable profit or loss.
When the taxable temporary difference is associated with investments in associates, subsidiaries or interests in joint ventures, and the timing of the reversal of the temporary differences can be controlled and it is probable that the temporary difference will not reverse in the foreseeable future.
Deferred income tax assets are recognised for all deductible temporary differences, carry‐forward of unused tax assets and unused tax losses, to the extent that it is probable that taxable profit will be available against which the deductible temporary differences, and the carry‐forward of unused tax assets and unused tax losses can be utilised, except:
When the deferred income tax asset relating to the deductible temporary differences arises from the initial recognition of an asset or liability in a transaction that is not a business combination and, at the time of the transaction, affects neither the accounting profit or taxable profit or loss;
When the deductible temporary difference is associated with investments in associates, subsidiaries or interests in joint ventures, in which case a deferred tax asset is only recognised to the extent that it is probable that the temporary difference will reverse in the foreseeable future and taxable profit will be available against which the temporary difference can be utilised.
The carrying amount of deferred income tax assets is reviewed at each reporting date and reduced to the extent that it is no longer probable that sufficient taxable profit will be available to allow all or part of the deferred income tax asset to be utilised.
Unrecognised deferred income tax assets are reassessed at each reporting date and are recognised to the extent that it has become probable that future taxable profit will allow the deferred tax asset to be recovered.
Deferred income tax assets and liabilities are measured at the tax rates that are expected to apply to the year when the asset is realised or the liability is settled, based on tax rates (and tax laws) that have been enacted or substantively enacted at the reporting date.
Deferred tax assets and deferred tax liabilities are offset only if a legally enforceable right exists to set off current tax assets against current tax liabilities and the deferred tax assets and liabilities relate to the same taxable entity and the same tax authority.
For
per
sona
l use
onl
y

REDFLEX HOLDINGS LIMITED
Notes to the consolidated financial statements for the year ended 30 June 2014
REDFLEX – making a safer world
‐ 69 ‐
NOTE 2 SUMMARY OF SIGNIFICANT ACCOUNTING POLICIES – CONTINUED
(h) Income tax and other taxes ‐ continued
Tax consolidation legislation
Redflex Holdings Limited and its wholly‐owned Australian controlled entities implemented the tax consolidation legislation as of 1 July 2003.
The head entity Redflex Holdings Limited and the controlled entities in the tax consolidated group continue to account for their own current and deferred tax amounts. The Group has applied the Group allocation approach in determining the appropriate amount of current taxes and deferred taxes to allocate to members of the tax consolidated group.
In addition to its own current and deferred tax amounts, Redflex Holdings Limited also recognises the current tax liabilities (or assets) and the deferred tax assets arising from unused tax losses and unused tax credits assumed from controlled entities in the tax consolidated group.
Assets or liabilities arising under tax funding agreements with the tax consolidated entities are recognised as amounts receivable from or payable to other entities in the Group.
Any difference between the amounts assumed and amounts receivable or payable under the tax funding agreement are recognised as a contribution to wholly‐owned tax consolidated entities.
Other Taxes
Revenues, expenses and assets are recognised net of the amount of goods and services tax (GST) except:
when the GST incurred on a purchase of goods and services is not recoverable from the taxation authority, in which case the GST is recognised as part of the cost of acquisition of the asset or as part of the expense item as applicable; and;
receivables and payables are stated with the amount of GST included.
The net amount of GST recoverable from or payable to the taxation authority is included as part of receivables or payables in the statement of financial position.
Cash flows are included in the statement of cash flows on a gross basis and the GST component of cash flows arising from investing and financing activities, which is recoverable from or payable to the taxation authority are classified as operating cash flows.
Commitments and contingencies are disclosed net of the amount of GST recoverable from or payable to the taxation authority.
(i) Property, plant and equipment
Plant and equipment is stated at historical cost less accumulated depreciation and any accumulated impairment losses. Such cost includes the cost of replacing parts that are eligible for capitalisation when the cost of replacing the parts is incurred. Similarly, when each major inspection is performed, its cost is recognised in the carrying amount of the plant and equipment as a replacement only if it is eligible for capitalisation. All other repairs and maintenance are recognised in profit or loss as incurred.
Depreciation is calculated on a straight‐line basis over the estimated useful life of the specific assets as follows:
Furniture, fittings and other over a period of three to five years
Computer equipment over a period of three years
Plant and equipment over a period of five to seven years
The assets’ residual values, useful lives and amortisation methods are reviewed and adjusted if appropriate at each reporting date.
Derecognition
An item of property, plant and equipment is derecognised upon disposal or when no further economic benefits are expected from its use or disposal.
Any gain or loss arising on derecognition of the asset (calculated as the difference between the net disposal proceeds and the carrying amount of the asset) is included in profit or loss in the year the asset is derecognised.
For
per
sona
l use
onl
y

REDFLEX HOLDINGS LIMITED
Notes to the consolidated financial statements for the year ended 30 June 2014
REDFLEX – making a safer world
‐ 70 ‐
NOTE 2 SUMMARY OF SIGNIFICANT ACCOUNTING POLICIES ‐ CONTINUED
(j) Leases
The determination of whether an arrangement is or contains a lease is based on the substance of the arrangement and requires an assessment of whether the fulfillment of the arrangement is dependent on the use of a specific asset or assets and the arrangement conveys a right to use the asset.
Group as a lessee
Finance leases, which transfer to the Group substantially all the risks and benefits incidental to ownership of the leased item, are capitalised at the inception of the lease at the fair value of the leased asset or, if lower, at the present value of the minimum lease payments. Lease payments are apportioned between the finance charges and reduction of the lease liability so as to achieve a constant rate of interest on the remaining balance of the liability. Finance charges are recognised as an expense in profit and loss.
Capitalised leased assets are depreciated over the shorter of the estimated useful life of the asset and the lease term if there is no reasonable certainty that the Group will obtain ownership by the end of the lease term.
Operating lease payments are recognised as an expense in the profit or loss on a straight‐line basis over the lease term. Operating lease incentives are recognised as a liability when received and subsequently reduced by allocating lease payments between rental expense and reduction of the liability.
(k) Borrowing costs
Borrowing costs directly attributable to the acquisition, construction or production of a qualifying asset that necessarily takes a substantial period of time to get ready for its intended use or sale are capitalised as part of the cost of that asset. All other borrowing costs are expensed in the period they occur. Borrowing costs consist of interest and other costs that an entity incurs in connection with the borrowing of funds.
Redflex Holdings Limited does not currently hold qualifying assets but, if it did, the borrowing costs directly associated with this asset would be capitalised (including any other associated costs directly attributable to the borrowing and temporary investment income earned on the borrowing).
(l) Intangible assets
Intangible assets acquired separately or in a business combination are initially measured at cost. The cost of an intangible asset acquired in a business combination is its fair value as at the date of acquisition. Following initial recognition, intangible assets are carried at cost less any accumulated amortisation and any accumulated impairment losses. Internally generated intangible assets, excluding capitalised development costs, are not capitalised and expenditure is recognised in profit or loss in the year in which the expenditure is incurred.
The useful lives of intangible assets are assessed to be either finite or indefinite. Intangible assets with finite lives are amortised over the useful life and tested for impairment whenever there is an indication that the intangible asset may be impaired. The amortisation period and the amortisation method for an intangible asset with a finite useful life is reviewed at least each reporting date. Changes in the expected useful life or the expected pattern of consumption of future economic benefits embodied in the asset are accounted for prospectively by changing the amortisation period or method, as appropriate, which is a change in accounting estimate. The amortisation expense on intangible assets with finite lives is recognised in profit or loss in the expense category consistent with the function of the intangible asset.
Intangible assets with indefinite useful lives are tested for impairment annually either individually or at the cash‐generating unit level. Such intangibles are not amortised. The useful life of an intangible asset with an indefinite life is reviewed each reporting period to determine whether indefinite life assessment continues to be supportable. If not, the change in the useful life assessment from indefinite to finite is accounted for as a change in an accounting estimate and is thus accounted for on a prospective basis.
For
per
sona
l use
onl
y
REDFLEX HOLDINGS LIMITED
Notes to the consolidated financial statements for the year ended 30 June 2014
REDFLEX – making a safer world
‐ 71 ‐
NOTE 2 SUMMARY OF SIGNIFICANT ACCOUNTING POLICIES ‐ CONTINUED
(l) Intangible assets ‐ continued
Research and development costs
Research costs are expensed as incurred. An intangible asset arising from development expenditure on an internal project is recognised only when the Group can demonstrate the technical feasibility of completing the intangible asset so that it will be available for use or sale, its intention to complete and its ability to use or sell the asset, how the asset will generate future economic benefits, the availability of resources to complete the development and the ability to measure reliably the expenditure attributable to the intangible asset during its development. Following the initial recognition of the development expenditure, the cost model is applied requiring the asset to be carried at cost less any accumulated amortisation and accumulated impairment losses. Any expenditure so capitalised is amortised over the period of expected benefit from the related project, typically being ten years.
The carrying value of an intangible asset arising from development expenditure is tested for impairment annually when the asset is not yet available for use, or more frequently when an indication of impairment arises during the reporting period.
A summary of the policies applied to the Group’s intangible assets is as follows:
Contracts Acquired Non‐Compete Compensation
Trade names Goodwill Development Costs
Useful lives Finite Finite Finite Indefinite Finite
Amortisation method used
Amortised over the contract lives
Amortised over the non‐compete period
Amortised over expected use period
No amortisation. Amortised over the period of expected future benefit from the related project on a straight‐line basis. The amortisation period is generally 10 years.
Internally generated or acquired
Acquired Acquired Acquired Acquired Internally generated.
Impairment testing
Annually on the reporting date for assets not yet available for use and more frequently when an indication of impairments exists. The amortisation method is reviewed at each financial year end.
Gains or losses arising from derecognition of an intangible asset are measured as the difference between the net disposal proceeds and the carrying amount of the asset and are recognised in profit or loss when the asset is derecognised.
Expenditures on advertising and promotional expenses are recognised as a component of marketing expense in the statement of comprehensive income when the Group has either the right to access the goods or has received the services.
Development expenditure incurred on an individual project is carried forward when its future recoverability can reasonably be regarded as assured.
For
per
sona
l use
onl
y

REDFLEX HOLDINGS LIMITED
Notes to the consolidated financial statements for the year ended 30 June 2014
REDFLEX – making a safer world
‐ 72 ‐
NOTE 2 SUMMARY OF SIGNIFICANT ACCOUNTING POLICIES ‐ CONTINUED
(m) Inventories
Inventories including raw materials, work in progress and finished goods are valued at the lower of cost and net realisable value.
Costs incurred in bringing each product to its present location and condition are accounted for as follows:
Raw materials and camera components: Purchase cost on a first‐in, first‐out basis. Components held for resale or conversion into fixed in‐ground installations for traffic contracts are carried at cost. The conversion of these components to property, plant and equipment occurs at the point newly contracted sites are commissioned.
Finished goods and work‐in‐progress: Cost of direct material and labour and a proportion of variable and fixed manufacturing overheads based on normal operating capacity. Costs are assigned on the basis of weighted average costs.
Net realisable value is the estimated selling price in the ordinary course of business, less estimated costs of completion and the estimated costs necessary to make the sale.
(n) Impairment of non‐financial assets other than goodwill
Non‐financial assets other than goodwill and indefinite life intangibles are tested for impairment whenever events or changes in circumstances indicate that the carrying amount may not be recoverable.
The Group conducts an annual internal review of asset values, which is used as a source of information to assess any indicators of impairment. External factors, such as changes in expected future processes, technology and economic conditions, are also monitored to assess for indicators of impairment. If any indication of impairment exists, an estimate of the asset’s recoverable amount is calculated.
An impairment loss is recognised for the amount by which the asset’s carrying amount exceeds its recoverable amount. Recoverable amount is the higher of an asset’s fair value less costs to sell and value in use. For the purposes of assessing impairment, assets are grouped at the lowest levels for which there are separately identifiable cash inflows that are largely independent of the cash inflows from other assets or groups of assets (cash‐generating units). Non‐financial assets other than goodwill that suffered impairment are tested for possible reversal of the impairment whenever events or changes in circumstances indicate that the impairment may have reversed.
(o) Cash and cash equivalents
Cash and cash equivalents in the statement of financial position comprise cash at bank and in hand and short‐term deposits with an original maturity of three months or less that are readily convertible to known amounts of cash and which are subject to an insignificant risk of change in value.
For the purposes of the statement of cash flows, cash and cash equivalents consist of cash and cash equivalents, as defined above, net of outstanding bank overdrafts. Bank overdrafts are included within interest‐bearing loans and borrowings in liabilities on the statement of financial position.
The company collects citation revenue for cities in the USA under some contracts. The allocation of entitlements to the city and Redflex is made subsequent to each month end once the allocation has been determined. The proceeds are received in lock‐box accounts and are treated as restricted cash until the allocation has been determined.
For
per
sona
l use
onl
y
REDFLEX HOLDINGS LIMITED
Notes to the consolidated financial statements for the year ended 30 June 2014
REDFLEX – making a safer world
‐ 73 ‐
NOTE 2 SUMMARY OF SIGNIFICANT ACCOUNTING POLICIES – CONTINUED
(p) Provisions and employee leave benefits
Provisions
Provisions are recognised when the Group has a present obligation (legal or constructive) as a result of a past event, it is probable that an outflow of resources embodying economic benefits will be required to settle the obligation, and a reliable estimate can be made of the amount of the obligation.
Where the Group expects some or all of a provision to be reimbursed, for example under an insurance contract, the reimbursement is recognised as a separate asset but only when the reimbursement is virtually certain. The expense relating to any provision is presented in the profit or loss net of any reimbursement.
Provisions are measured at the present value of management’s best estimate of the expenditure required to settle the present obligation at the reporting date using a discounted cash flow methodology. The risks specific to the provision are factored into the cash flows and as such a risk‐free government bond rate relative to the expected life of the provision is used as a discount rate. If the effect of the time value of money is material, provisions are discounted using a current pre‐tax rate that reflects the time value of money and the risks specific to the liability. The increase in the provision resulting from the passage of time is recognised in finance costs.
Employee Benefits
(i) Wages, salaries, annual leave and personal leave
Liabilities for wages and salaries, including non‐monetary benefits and annual leave are recognised in accrued liabilities and provisions in respect of employees’ services up to the reporting date. They are measured at the amounts expected to be paid when the liabilities are settled. Expenses for non‐accumulating personal/sick leave are recognised when the leave is taken and are measured at the rates paid or payable.
(ii) Long Service Leave
The liability for long service leave is recognised in the provision for employee benefits and is measured as the present value of expected future payments to be made in respect of services provided by employees up to the reporting date using the projected unit credit method. Consideration is given to the expected future wage and salary levels, the Group’s experience of employee departures, and periods of service. Expected future payments are discounted using market yields at the reporting date on national government bonds with terms to maturity that match as closely as possible the estimated future cash outflows.
(q) Share Based payment transactions
Equity settled transactions
The Group provides benefits to certain employees (including key management personnel) in the form of share‐based payment transactions whereby employees render services in exchange for rights over shares (equity‐settled transactions).
Equity‐settled awards granted by Redflex Holdings Limited to employees of subsidiaries are recognised in the parent’s separate financial statements as an additional investment in the subsidiary with a corresponding credit to equity. These amounts are eliminated on consolidation. The expense recognised by the Group is the total expense associated with all such awards.
Until an award has vested, any amounts recorded are contingent and will be adjusted if more or fewer awards vest than were originally anticipated to do so. Any award subject to a market condition is considered to vest irrespective of whether or not that market condition is fulfilled, provided that all other conditions are satisfied.
For
per
sona
l use
onl
y
REDFLEX HOLDINGS LIMITED
Notes to the consolidated financial statements for the year ended 30 June 2014
REDFLEX – making a safer world
‐ 74 ‐
NOTE 2 SUMMARY OF SIGNIFICANT ACCOUNTING POLICIES – CONTINUED
(q) Share Based payment transactions ‐ continued
Equity settled transactions ‐ continued
If the terms of an equity‐settled award are modified, as a minimum an expense is recognised as if the terms had not been modified. An additional expense is recognised for any modification that increases the total fair value of the share based payment arrangement, or is otherwise beneficial to the employee, as measured at the date of modification.
If an equity‐settled award is cancelled, it is treated as if it had vested on the date of the cancellation, and any expense not yet recognised for the award is recognised immediately. However, if a new award is substituted for the cancelled award and designated as a replacement award on the date that it is granted, the cancelled and new award are treated as if they were a modification of the original award, as described in the previous paragraph.
Long Term Incentive Plan for Executives
Performance rights pricing model
The fair value of each performance right is estimated on the date of grant using a Black‐Scholes option formula, with a Monte Carlo simulation to take market conditions into consideration, with the following weighted average assumptions used for grants made during the year. The valuation of the performance rights is performed independently.
The company uses total shareholder return (TSR) as the performance hurdle for the LTI Plan. TSR is calculated as the change in capital value of Redflex Holdings Limited over a three‐year period, plus dividends, expressed as a percentage of the opening capital value. The use of a relative TSR based hurdle is currently market best practice as it ensures an alignment between comparative shareholder return and rewards for executives.
To assess whether the performance hurdles for each grant have been met, the company receives independent data from its external consultant which benchmarks the company’s TSR growth from the commencement of each grant against that of a pre‐selected ASX peer group. KMP must satisfy the service conditions set at grant date. Performance rights vest progressively from a threshold level of performance to a maximum level.
The weighted average remaining contractual life for the performance rights is 3 years.
(r) Trade and other receivables
Trade receivables, which generally have 30‐90 day terms, are recognised initially at fair value and subsequently measured at amortised costs using the effective interest method, less an allowance for impairment.
Collectability of trade receivables is reviewed on an ongoing basis at an operating unit level. Debts that are known to be uncollectible are written off when identified. An impairment provision is recognised when there is objective evidence that the Group will not be able to collect the receivable. Financial difficulties of the debtor, default payments or debts more than 90 days overdue are considered objective evidence of impairment. The amount of the impairment loss is the receivable carrying amount compared to the present value of estimated future cash flows, discounted at the original effective interest rate.
Trade receivables are classified as non‐current when their expected date of receipt is greater than 12 months.
For
per
sona
l use
onl
y

REDFLEX HOLDINGS LIMITED
Notes to the consolidated financial statements for the year ended 30 June 2014
REDFLEX – making a safer world
‐ 75 ‐
NOTE 2 SUMMARY OF SIGNIFICANT ACCOUNTING POLICIES ‐ CONTINUED
(s) Investment and other financial assets
Recognition and derecognition
All purchases and sales of financial assets are recognised on the trade date, i.e. the date on which the Group commits to purchase the asset.
Financial assets are derecognised when the right to receive cash flows from the financial assets has expired or when the entity transfers substantially all of the risks and rewards of the financial asset. If the entity neither retains nor transfers substantially all of the risks and rewards, it derecognises the asset as if it has transferred control of the assets.
After initial recognition, available for sale financial assets are held at cost as fair value cannot be reliably measured.
(t) Trade and other payables
Trade payables and other payables are carried at amortised cost and due to their short‐term nature they are not discounted. They represent liabilities for goods and services provided to the Group prior to the end of the financial year that are unpaid and arise when the Group becomes obliged to make future payments in respect of the purchase of these goods and services. The amounts are unsecured and are usually paid within 30 days of recognition.
(u) Interest‐bearing loans and borrowings
All loans and borrowings are initially recognised at the fair value of the consideration received less directly attributable transaction costs.
After initial recognition, interest‐bearing loans and borrowings are subsequently measured at amortised cost using the effective interest method. Fees paid on the establishment of loan facilities that are yield related are included as part of the carrying amount of the loans and borrowings.
Borrowings are classified as current liabilities unless the Group has an unconditional right to defer settlement of the liability for at least 12 months after reporting date.
(v) Contributed equity
Ordinary shares are classified as equity. Incremental costs directly attributable to the issue of new shares or options are shown in equity as a deduction, net of tax, from the proceeds.
(w) Earnings per share
Basic earnings per share is calculated as net profit/(loss) attributable to members of the parent, adjusted to exclude any costs of servicing equity (other than dividends), divided by the weighted average number of shares on issue, adjusted for any bonus element.
Diluted earnings per share are calculated as net profit attributable to members of the parent, adjusted for:
Costs of servicing equity (other than dividends);
The after tax effect of dividends and interest associated with dilutive potential ordinary shares that have been recognised as expenses; and
Other non‐discretionary changes in revenue and expenses during the period that would result from the dilution of potential ordinary shares, divided by the weighted average number of ordinary shares and dilutive potential ordinary shares, adjusted for any bonus element.
For
per
sona
l use
onl
y
REDFLEX HOLDINGS LIMITED
Notes to the consolidated financial statements for the year ended 30 June 2014
REDFLEX – making a safer world
‐ 76 ‐
NOTE 2 SUMMARY OF SIGNIFICANT ACCOUNTING POLICIES ‐ CONTINUED
(x) Maintenance warranty
In determining the level of provision required for maintenance warranties the Group has made judgments in respect of the expected performance of the product, number of customers who will actually use the maintenance warranty and how often, and the costs of fulfilling the performance of the maintenance warranty. Historical experience and current knowledge of the performance of products has been used in determining this provision. The related carrying amounts are included in accrued liabilities.
(y) Asset retirement obligation
The fair value of a liability for an Asset Retirement Obligation is recorded as an asset and a liability when there is a legal obligation associated with the retirement of a long‐lived asset and the amount can be reasonably estimated.
(z) Deferred costs asset
Under contracts with the City of Chicago, the company is required to sell cameras and installations, as well as providing full service back office processing of citations along similar lines to all other contracts performed under the BOOM model, however the sale and provision of services are dependent on each other. This dependency determines that the sale and provision of services be bundled together as a single transaction and accounted for accordingly.
Where the timing of the supply of fully installed cameras and provision of services are not in alignment with customer payment terms, a Deferred Costs Asset is created and released progressively over the contract term to align expected revenues with the full provision of the contracted services.
2.4 Changes in accounting policies and disclosures
There were no significant or material changes in accounting policies in the financial year.
For
per
sona
l use
onl
y
REDFLEX HOLDINGS LIMITED
Notes to the consolidated financial statements for the year ended 30 June 2014
REDFLEX – making a safer world
‐ 77 ‐
NOTE 3 FINANCIAL RISK MANAGEMENT OBJECTIVES AND POLICIES
The Group's principal financial instruments comprise receivables, payables, bank loans, finance leases, cash and short‐term deposits and occasionally derivatives.
Risk Exposures and Responses
The Group manages its exposure to key financial risks, including interest rate and currency risk, and credit risk and liquidity risk in accordance with the Group's financial risk management policy. The objective of the policy is to support the delivery of the Group's financial targets whilst protecting future financial security.
The Group occasionally enters into derivative transactions, principally forward currency contracts. The purpose is to manage the transactional currency risks arising from the Group's operations and its sources of finance. Where derivatives are purchased, they are specifically in forward currency contracts. These derivatives provide economic hedges, but do not qualify for hedge accounting and are based on limits set by management and authorised by the Board.
The main risks arising from the Group's financial instruments are interest rate risk, foreign currency risk, credit risk and liquidity risk. The Group uses different methods to measure and manage the different types of risks to which it is exposed. These include monitoring levels of exposure to interest rate and foreign exchange risk and assessments of market forecasts for interest rates and foreign exchange rates. Ageing analyses and monitoring of specific credit allowances are undertaken to manage credit risk, whilst liquidity risk is monitored through the development of future rolling cash flow forecasts.
The Board reviews and agrees policies for managing each of these risks as summarised below.
Primary responsibility for identification and control of financial risks rests with the Audit and Risk Management Committee under the authority of the Board. The Board reviews and agrees policies for managing each of the risks identified below, including the setting of limits for hedging cover of foreign currency and interest rate risk, credit allowances, and future cash flow forecast projections.
(i) Interest rate risk
The Group's exposure to market interest rates is primarily related to its debt obligations and cash holdings. The Group’s debt level is disclosed in Note 17.
At reporting date, the Group had the following mix of financial assets and liabilities exposed to variable interest rate risk.
Consolidated
2014 2013
$’000 $’000
Financial assets
Cash at banks and in hand 9,996 14,927
Cash – restricted lockboxes 3,753 6,319
13,749 21,246
Financial liabilities
Obligations under finance leases and hire purchases ‐ 4
Interest bearing liabilities 15,895 26,278
15,895 26,282
Net exposure (2,146) (5,036)
For
per
sona
l use
onl
y

REDFLEX HOLDINGS LIMITED
Notes to the consolidated financial statements for the year ended 30 June 2014
REDFLEX – making a safer world
‐ 78 ‐
NOTE 3 FINANCIAL RISK MANAGEMENT OBJECTIVES AND POLICIES ‐ CONTINUED
Risk Exposures and Responses ‐ continued
(i) Interest rate risk ‐ continued
The Group's policy is to manage its finance costs using predominantly variable rate debt associated with the currency in which the cash flows relating to the borrowings arise. The Group constantly analyses its interest rate exposure and considers alternative financing, alternative hedging positions, and a mix of fixed and variable interest rates.
The following sensitivity analysis is based on the interest rate risk exposures at the reporting date:
At 30 June 2014, if interest rates had moved, as illustrated in the table below, with all other variables held constant, post tax profit and equity would have been affected as follows:
Judgments of reasonable possible movements
Post Tax Profit/(Loss) Higher/(Lower) Equity Higher/(Lower)
2014 2013 2014 2013
Consolidated $’000 $’000 $’000 $’000
+1% (100 basis points) (159) (263) (159) (263)
‐ .5% (50 basis points) 79 131 79 131
The movements in profit are due to higher/lower interest costs/income from variable rate debt and cash balances.
(ii) Foreign currency risk
The Group separates the management of exchange rate risk between translational and transactional effects of currency movements.
The Group has two main operations, with approximately 69% of the Group business occurring within the USA, and the other 31% arising from within Australia, but through servicing other markets. As a result of significant investment in operations in the USA and large purchases of inventory from the USA, the Group’s statement of financial position can be affected significantly by movements in the US$/AU$ exchange rates. The USA business incurs all revenue and the vast majority of its expenses in US$, apart from the cost of cameras sourced from the Australian operations in AU$. The USA business operation accounts for the vast majority of the Group’s capital expenditure requirements and related borrowings and accordingly, the Group seeks to mitigate the effect of its foreign currency exposure by borrowing in US$.
Translational effects are therefore significant to the Group results with approximately 69% (FY13: 69%) of the Group’s revenues and costs incurred in currencies (predominantly US$) other than the presentation currency of the Group, and the large capital expenditure related to that business also denominated in US$. The Group does not hedge translational risk through available hedge products.
Aside from the USA operation, the Group also has transactional currency exposures arising occasionally from sales or purchases by an operating entity in currencies other than the functional currency. The Group requires its operating units to consider using forward currency contracts to eliminate the currency exposures on any substantial net transaction for which receipt or payment is anticipated to be more than one month after the Group has entered into a firm commitment for a sale or purchase. Sales and purchases in currencies other than the functional currency are irregular and evaluated against the revenue streams which they derive on a case by case basis. Any forward currency contracts entered into must be in the same currency as the hedged item. It is the Group's policy not to enter into forward contracts until a firm commitment is in place, and to negotiate the terms of the hedge derivatives to match the terms of the hedged item to maximise hedge effectiveness. F
or p
erso
nal u
se o
nly

REDFLEX HOLDINGS LIMITED
Notes to the consolidated financial statements for the year ended 30 June 2014
REDFLEX – making a safer world
‐ 79 ‐
NOTE 3 FINANCIAL RISK MANAGEMENT OBJECTIVES AND POLICIES ‐ CONTINUED
Risk Exposures and Responses ‐ continued
(ii) Foreign currency risk ‐ continued
At 30 June 2014 the Group had no foreign currency hedge arrangements in place.
The Group has a US$ denominated borrowing of $15.9 million (US$15.0 million) (FY13 $26.0 million: {US$24.0 million}) which is a natural hedge of the net investment in the USA operation.
At 30 June 2014, the Group had not hedged foreign currency purchases that are firm commitments, as offsetting natural hedges substantially offset risk. Other than the USA operation, most sales commitments were denominated in AU$, other than single contracts in Hong Kong, Canada, Saudi Arabia and Ireland.
The following sensitivity is based on the foreign currency risk exposures in existence at the reporting date.
At 30 June 2014, had the Australian dollar moved, as illustrated in the table below with all other variables held constant, post tax profit would have been affected as follows:
The net assets of the USA operation are reflected in the segment results shown in Note 6.
Judgments of reasonable possible movements
Post Tax Profit/(loss)
Higher/(Lower)
Equity
Higher/(Lower)
2014 2013 2013 2012
$’000 $’000 $’000 $’000
AU$/US$ +10% 210 (410) (4,752) (5,091)
AU$/US$ ‐ 5% (105) 205 2,376 2,546
Management believes the reporting date risk exposures are representative of the risk exposure inherent in the financial instruments.
(iii) Price risk
The Group's exposure to commodity and equity securities price risk is minimal.
(iv) Credit risk
Credit risk arises from the financial assets of the Group, which comprise cash and cash equivalents, trade and other receivables. The Group's exposure to credit risk arises from potential default of the counter party, with a maximum exposure equal to the carrying amount of these instruments. Exposure at reporting date is addressed in each applicable note.
The Group trades only with recognised, credit‐worthy third parties and collateral is not requested nor is it the Group's policy to securitise its trade and other receivables.
It is the Group's policy that all customers who wish to trade on credit terms are subject to credit verification procedures which include an assessment of their independent credit rating, financial position, past experience, and industry reputation. Risk limits are set for each customer in accordance with parameters set by the board. These risk limits are regularly monitored. In addition, receivable balances are monitored on an ongoing basis with the result that the Group's exposure to bad debts is spread. There are no significant concentrations of credit risk within the Group.
For transactions that are not denominated in the functional currency of the relevant operating unit, the Group does not offer credit terms and usually requires a letter of credit to secure the receivable.
For
per
sona
l use
onl
y
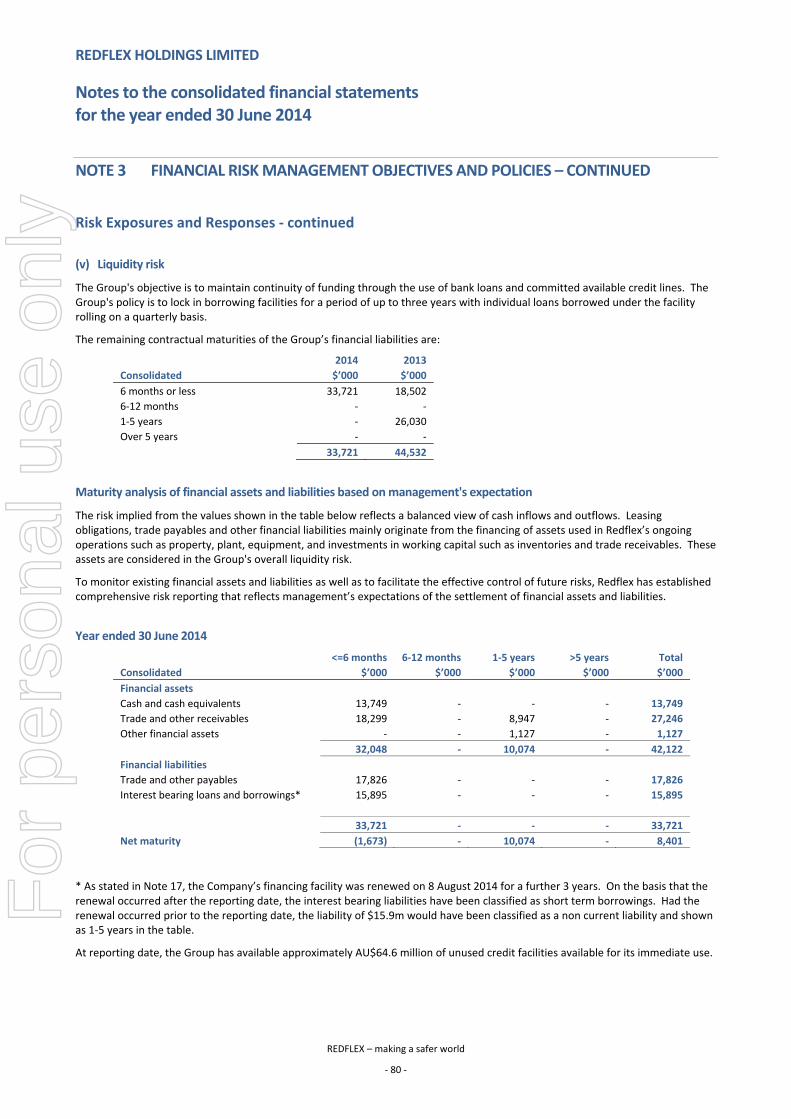
REDFLEX HOLDINGS LIMITED
Notes to the consolidated financial statements for the year ended 30 June 2014
REDFLEX – making a safer world
‐ 80 ‐
NOTE 3 FINANCIAL RISK MANAGEMENT OBJECTIVES AND POLICIES – CONTINUED
Risk Exposures and Responses ‐ continued
(v) Liquidity risk
The Group's objective is to maintain continuity of funding through the use of bank loans and committed available credit lines. The Group's policy is to lock in borrowing facilities for a period of up to three years with individual loans borrowed under the facility rolling on a quarterly basis.
The remaining contractual maturities of the Group’s financial liabilities are:
2014 2013
Consolidated $’000 $’000
6 months or less 33,721 18,502
6‐12 months ‐ ‐
1‐5 years ‐ 26,030
Over 5 years ‐ ‐
33,721 44,532
Maturity analysis of financial assets and liabilities based on management's expectation
The risk implied from the values shown in the table below reflects a balanced view of cash inflows and outflows. Leasing obligations, trade payables and other financial liabilities mainly originate from the financing of assets used in Redflex’s ongoing operations such as property, plant, equipment, and investments in working capital such as inventories and trade receivables. These assets are considered in the Group's overall liquidity risk.
To monitor existing financial assets and liabilities as well as to facilitate the effective control of future risks, Redflex has established comprehensive risk reporting that reflects management’s expectations of the settlement of financial assets and liabilities.
Year ended 30 June 2014
<=6 months 6‐12 months 1‐5 years >5 years Total
Consolidated $’000 $’000 $’000 $’000 $’000
Financial assets
Cash and cash equivalents 13,749 ‐ ‐ ‐ 13,749
Trade and other receivables 18,299 ‐ 8,947 ‐ 27,246
Other financial assets ‐ ‐ 1,127 ‐ 1,127
32,048 ‐ 10,074 ‐ 42,122
Financial liabilities
Trade and other payables 17,826 ‐ ‐ ‐ 17,826
Interest bearing loans and borrowings* 15,895
‐
‐ ‐ 15,895
33,721 ‐ ‐ ‐ 33,721
Net maturity (1,673) ‐ 10,074 ‐ 8,401
* As stated in Note 17, the Company’s financing facility was renewed on 8 August 2014 for a further 3 years. On the basis that the renewal occurred after the reporting date, the interest bearing liabilities have been classified as short term borrowings. Had the renewal occurred prior to the reporting date, the liability of $15.9m would have been classified as a non current liability and shown as 1‐5 years in the table.
At reporting date, the Group has available approximately AU$64.6 million of unused credit facilities available for its immediate use.
For
per
sona
l use
onl
y
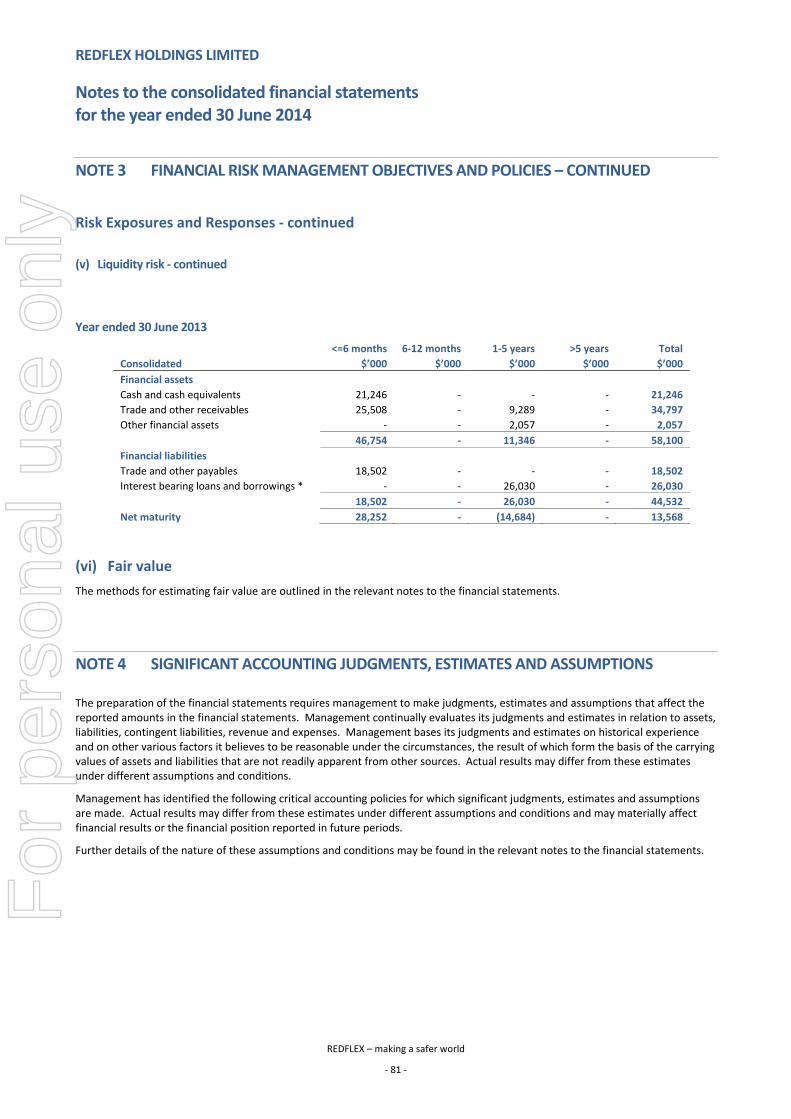
REDFLEX HOLDINGS LIMITED
Notes to the consolidated financial statements for the year ended 30 June 2014
REDFLEX – making a safer world
‐ 81 ‐
NOTE 3 FINANCIAL RISK MANAGEMENT OBJECTIVES AND POLICIES – CONTINUED
Risk Exposures and Responses ‐ continued
(v) Liquidity risk ‐ continued
Year ended 30 June 2013
<=6 months 6‐12 months 1‐5 years >5 years Total
Consolidated $’000 $’000 $’000 $’000 $’000
Financial assets
Cash and cash equivalents 21,246 ‐ ‐ ‐ 21,246
Trade and other receivables 25,508 ‐ 9,289 ‐ 34,797
Other financial assets ‐ ‐ 2,057 ‐ 2,057
46,754 ‐ 11,346 ‐ 58,100
Financial liabilities
Trade and other payables 18,502 ‐ ‐ ‐ 18,502
Interest bearing loans and borrowings * ‐ ‐ 26,030 ‐ 26,030
18,502 ‐ 26,030 ‐ 44,532
Net maturity 28,252 ‐ (14,684) ‐ 13,568
(vi) Fair value
The methods for estimating fair value are outlined in the relevant notes to the financial statements.
NOTE 4 SIGNIFICANT ACCOUNTING JUDGMENTS, ESTIMATES AND ASSUMPTIONS
The preparation of the financial statements requires management to make judgments, estimates and assumptions that affect the reported amounts in the financial statements. Management continually evaluates its judgments and estimates in relation to assets, liabilities, contingent liabilities, revenue and expenses. Management bases its judgments and estimates on historical experience and on other various factors it believes to be reasonable under the circumstances, the result of which form the basis of the carrying values of assets and liabilities that are not readily apparent from other sources. Actual results may differ from these estimates under different assumptions and conditions.
Management has identified the following critical accounting policies for which significant judgments, estimates and assumptions are made. Actual results may differ from these estimates under different assumptions and conditions and may materially affect financial results or the financial position reported in future periods.
Further details of the nature of these assumptions and conditions may be found in the relevant notes to the financial statements.
For
per
sona
l use
onl
y
REDFLEX HOLDINGS LIMITED
Notes to the consolidated financial statements for the year ended 30 June 2014
REDFLEX – making a safer world
‐ 82 ‐
NOTE 4 SIGNIFICANT ACCOUNTING JUDGMENTS, ESTIMATES AND ASSUMPTIONS ‐ CONTINUED
Significant accounting judgments
Depreciation and impairment of property, plant and equipment
The major Group assets are represented by property, plant and equipment consisting mainly of red light and speed camera detection equipment. These assets are installed in various cities throughout the USA. The contract periods for which these assets are installed vary significantly between contracts, however most contract periods are at least five years and have extension options of either one year or two years.
The Group depreciates these assets over a seven year period on a straight line basis regardless of the length of the contract. The major components of the installation relate to the construction and civil engineering works associated with the installation, in addition to the camera and detection equipment. The company expects the infrastructure to last for decades once installed, whilst the camera and detection equipment is expected to last for a period approximating seven years.
Despite the longevity of the installation it is impaired upon termination or non‐renewal of a contract to process traffic violations. Accordingly, it is difficult to assess the appropriate length of time over which to depreciate these assets.
The Group assesses impairment of all assets at each reporting date based on each contract and evaluates conditions specific to the Group and to the particular assets that may lead to impairment. These include contract termination date, any cost neutrality issues, legislative and legal challenges combined with economic and political environments. This review is performed on a contract by contract basis.
If an impairment trigger exists, the recoverable amount of the asset is determined and a write‐down taken.
Taxation
The Group's accounting policy for taxation requires management's judgment as to the types of arrangements considered to be a tax on income in contrast to an operating cost. Judgment is also required in assessing whether deferred tax assets and certain deferred tax liabilities are recognised on the statement of financial position. Deferred tax assets, including those arising from unrecouped tax losses, capital losses and temporary differences, are recognised only where it is considered more likely than not that they will be recovered, which is dependent on the generation of sufficient future taxable profits. Deferred tax liabilities arising from temporary differences in investments, caused principally by retained earnings held in foreign tax jurisdictions, are recognised unless repatriation of retained earnings can be controlled and are not expected to occur in the foreseeable future.
Assumptions about the generation of future taxable profits and repatriation of retained earnings depend on management's estimates of future cash flows. These depend on estimates of future production and sales volumes, operating costs, restoration costs, capital expenditure, dividends and other capital management transactions. Judgments are also required about the application of income tax legislation. These judgments and assumptions are subject to risk and uncertainty, hence there is a possibility that changes in circumstances will alter expectations, which may impact the amount of deferred tax assets and deferred tax liabilities recognised on the statement of financial position and the amount of other tax losses and temporary differences not yet recognised. In such circumstances, some or all of the carrying amounts of recognised deferred tax assets and liabilities may require adjustment, resulting in a corresponding credit or charge to the statement of profit or loss.
Uncertainty arising as a result of group tax restructure
During the year ended 30 June 2009, the Group’s global tax affairs were restructured to provide a more efficient flow of funds around the Group. The outcome of the restructure involves a significant degree of uncertainty, and as such the company commissioned independent advice from its professional legal and tax advisors. The outcome of the restructure could result in future potential tax liabilities of up to $10.65 million, with corresponding off‐setting tax benefits arising over future years. The likelihood of any such current tax liability is not considered probable.
For
per
sona
l use
onl
y
REDFLEX HOLDINGS LIMITED
Notes to the consolidated financial statements for the year ended 30 June 2014
REDFLEX – making a safer world
‐ 83 ‐
NOTE 4 SIGNIFICANT ACCOUNTING JUDGMENTS, ESTIMATES AND ASSUMPTIONS ‐ CONTINUED
Significant accounting judgments ‐ continued
Recoverability of receivables
The company encountered uncertainties surrounding some contracts in the USA, Middle East and South East Asia. Due to the uncertainty around our ultimate collection and timing of the receipt of these receivables, the Company decided to provide against the likelihood of ultimate collectability. Trade receivables are classified as non‐ current when their expected date of receipt is greater than 12 months.
Long service leave provision
In determining the present value of the liability, probabilities have been applied in estimating the proportion of employees who will be entitled to long service leave and a percentage applied to reflect pay increases through promotion and inflation.
Citation work in progress
Management in the USA reviews the expected collection rates in relation to citation work in progress which is calculated by jurisdiction.
Share based payments
The fair value of each performance right is estimated on the date of the award using a Black‐Scholes option formula, with a Monte Carlo simulation to take market conditions into consideration, with the assumptions detailed in Note 25.
Asset retirement obligations
The asset retirement obligation liability is based on what management expects future costs will be based on experience in terminated contracts.
Warranty provisions
Provisions for warranty‐related costs are recognised when the product is sold or service provided. Initial recognition is based on historical experience. The initial estimate of warranty‐related costs is revised monthly.
NOTE 5 SEGMENT INFORMATION
The operating businesses are organised and managed separately according to the nature of the products and services provided with each segment representing a strategic business unit that offers particular products and services to different markets.
The Group operates within two key markets, North America and Australia/International (which comprises all other business, outside of North America). The Traffic business in the USA is predominantly a Build Own Operate and Maintain (BOOM) business providing fully outsourced traffic enforcement programs. The Australia/International Traffic business involves the sale of traffic enforcement products. The segmental split segregates the operating units into revenue from recurring fee for service business and revenue related to the sale of goods and services.
Transfer prices between business segments are set on an arm’s length basis in a manner similar to transactions with third parties. Segment revenue, segment expense and segment result include transfers between operating segments. Those transfers are eliminated on consolidation.
The following tables present revenue and profit information and certain asset and liability information regarding operating segments for the years ended 30 June 2014 and 30 June 2013.
For
per
sona
l use
onl
y
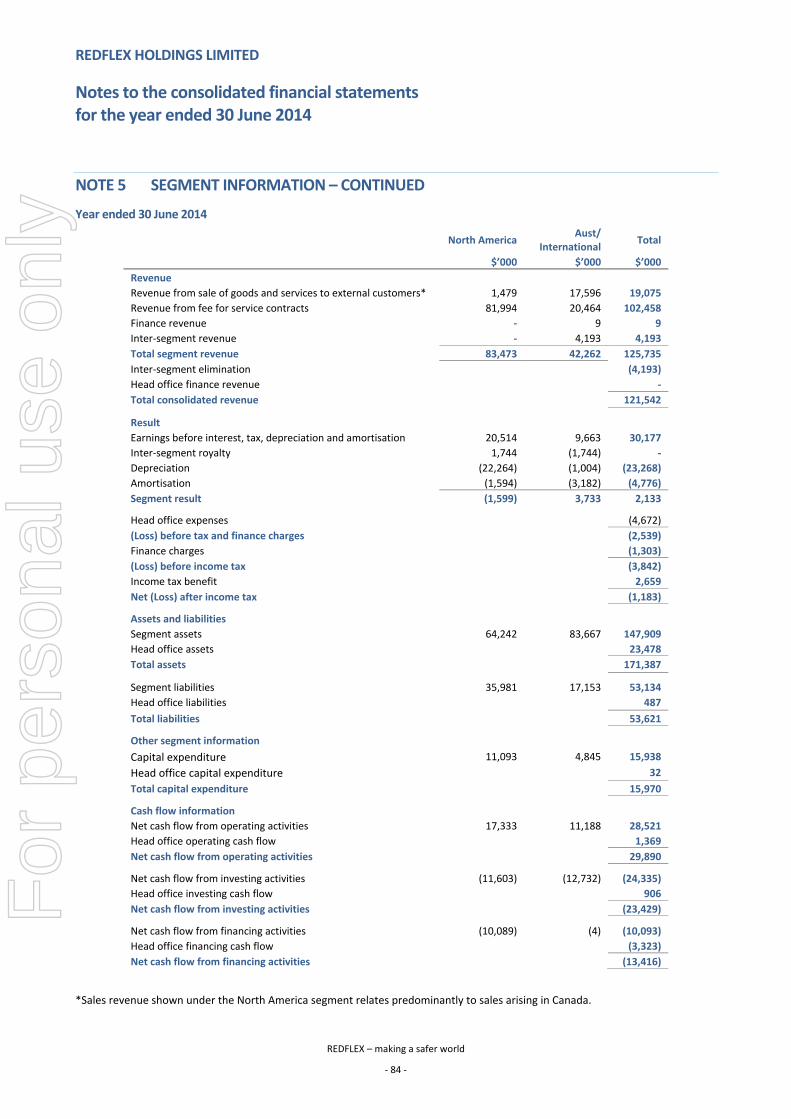
REDFLEX HOLDINGS LIMITED
Notes to the consolidated financial statements for the year ended 30 June 2014
REDFLEX – making a safer world
‐ 84 ‐
NOTE 5 SEGMENT INFORMATION – CONTINUED
Year ended 30 June 2014
North America Aust/
International Total
$’000 $’000 $’000
Revenue
Revenue from sale of goods and services to external customers* 1,479 17,596 19,075
Revenue from fee for service contracts 81,994 20,464 102,458
Finance revenue ‐ 9 9
Inter‐segment revenue ‐ 4,193 4,193
Total segment revenue 83,473 42,262 125,735
Inter‐segment elimination (4,193)
Head office finance revenue ‐
Total consolidated revenue 121,542
Result
Earnings before interest, tax, depreciation and amortisation 20,514 9,663 30,177
Inter‐segment royalty 1,744 (1,744) ‐
Depreciation (22,264) (1,004) (23,268)
Amortisation (1,594) (3,182) (4,776)
Segment result (1,599) 3,733 2,133
Head office expenses (4,672)
(Loss) before tax and finance charges (2,539)
Finance charges (1,303)
(Loss) before income tax (3,842)
Income tax benefit 2,659
Net (Loss) after income tax (1,183)
Assets and liabilities
Segment assets 64,242 83,667 147,909
Head office assets 23,478
Total assets 171,387
Segment liabilities 35,981 17,153 53,134
Head office liabilities 487
Total liabilities 53,621
Other segment information
Capital expenditure 11,093 4,845 15,938
Head office capital expenditure 32
Total capital expenditure 15,970
Cash flow information
Net cash flow from operating activities 17,333 11,188 28,521
Head office operating cash flow 1,369
Net cash flow from operating activities 29,890
Net cash flow from investing activities (11,603) (12,732) (24,335)
Head office investing cash flow 906
Net cash flow from investing activities (23,429)
Net cash flow from financing activities (10,089) (4) (10,093)
Head office financing cash flow (3,323)
Net cash flow from financing activities (13,416)
*Sales revenue shown under the North America segment relates predominantly to sales arising in Canada.
For
per
sona
l use
onl
y
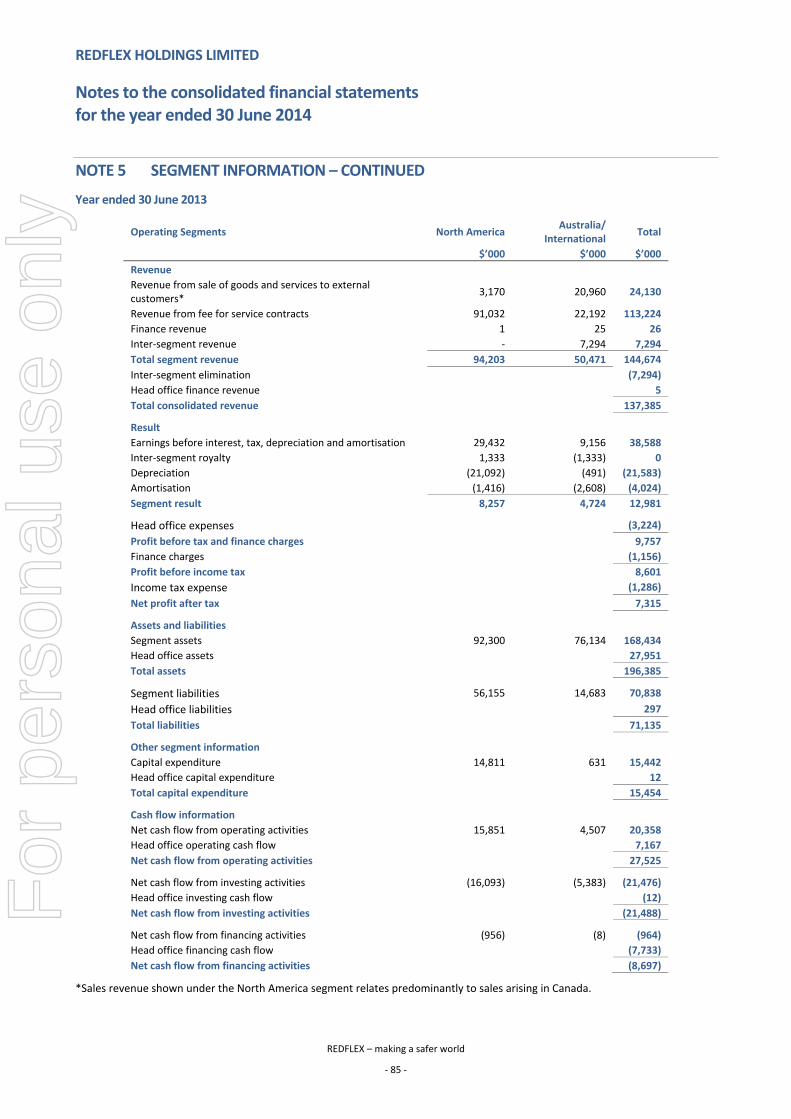
REDFLEX HOLDINGS LIMITED
Notes to the consolidated financial statements for the year ended 30 June 2014
REDFLEX – making a safer world
‐ 85 ‐
NOTE 5 SEGMENT INFORMATION – CONTINUED
Year ended 30 June 2013
Operating Segments North America Australia/
International Total
$’000 $’000 $’000
Revenue
Revenue from sale of goods and services to external customers*
3,170 20,960 24,130
Revenue from fee for service contracts 91,032 22,192 113,224
Finance revenue 1 25 26
Inter‐segment revenue ‐ 7,294 7,294
Total segment revenue 94,203 50,471 144,674
Inter‐segment elimination (7,294)
Head office finance revenue 5
Total consolidated revenue 137,385
Result
Earnings before interest, tax, depreciation and amortisation 29,432 9,156 38,588
Inter‐segment royalty 1,333 (1,333) 0
Depreciation (21,092) (491) (21,583)
Amortisation (1,416) (2,608) (4,024)
Segment result 8,257 4,724 12,981
Head office expenses (3,224)
Profit before tax and finance charges 9,757
Finance charges (1,156)
Profit before income tax 8,601
Income tax expense (1,286)
Net profit after tax 7,315
Assets and liabilities
Segment assets 92,300 76,134 168,434
Head office assets 27,951
Total assets 196,385
Segment liabilities 56,155 14,683 70,838
Head office liabilities 297
Total liabilities 71,135
Other segment information
Capital expenditure 14,811 631 15,442
Head office capital expenditure 12
Total capital expenditure 15,454
Cash flow information
Net cash flow from operating activities 15,851 4,507 20,358
Head office operating cash flow 7,167
Net cash flow from operating activities 27,525
Net cash flow from investing activities (16,093) (5,383) (21,476)
Head office investing cash flow (12)
Net cash flow from investing activities (21,488)
Net cash flow from financing activities (956) (8) (964)
Head office financing cash flow (7,733)
Net cash flow from financing activities (8,697)
*Sales revenue shown under the North America segment relates predominantly to sales arising in Canada.
For
per
sona
l use
onl
y

REDFLEX HOLDINGS LIMITED
Notes to the consolidated financial statements for the year ended 30 June 2014
REDFLEX – making a safer world
‐ 86 ‐
NOTE 5 SEGMENT INFORMATION – CONTINUED
Revenue from external customers by geographical locations is detailed below. Revenue is attributed to geographic location based on the location of the customers. The company does not have external revenues from external customers that are attributable to any foreign country other than as shown.
Consolidated
30 June 2014 30 June 2013
$’000 $’000
Revenue by geographical location
North America 83,473 94,203
Australia 20,303 21,844
Other* 17,766 21,338
Total Revenue 121,542 137,385
*other includes Saudi Arabia, United Arab Emirates, Ireland, United Kingdom, and Malaysia.
NOTE 6 REVENUE, OTHER REVENUE, OTHER INCOME AND EXPENSES
Consolidated
30 Jun 2014 30 Jun 2013
$’000 $’000
Revenues and expenses
Revenue from sales of goods and services 121,533 137,354
Finance revenue 9 31
Total Revenue 121,542 137,385
Depreciation, amortisation and impairment costs included in income statement
Depreciation of assets in fee for service business
22,264 21,092
Depreciation of other assets 1,012 504
Amortisation of intangibles 4,776 4,024
Impairment of receivables ‐ 2,250
Impairment of assets 1,850 1,823
Impairment of goodwill ‐ 2,135
Impairment of capitalised development costs 456 729
Employee benefits expense
Wages and salaries 41,143 40,755
Payroll benefits 5,965 4,884
Contract labour 2,124 2,052
Superannuation 1,681 1,473
Payroll taxes 2,741 2,839
Share‐based payment expense 567 1,105
Other payroll related expenses 2,190 2,021
56,411 55,129
Research and development costs
Expensed in administrative expenses 858 424
For
per
sona
l use
onl
y
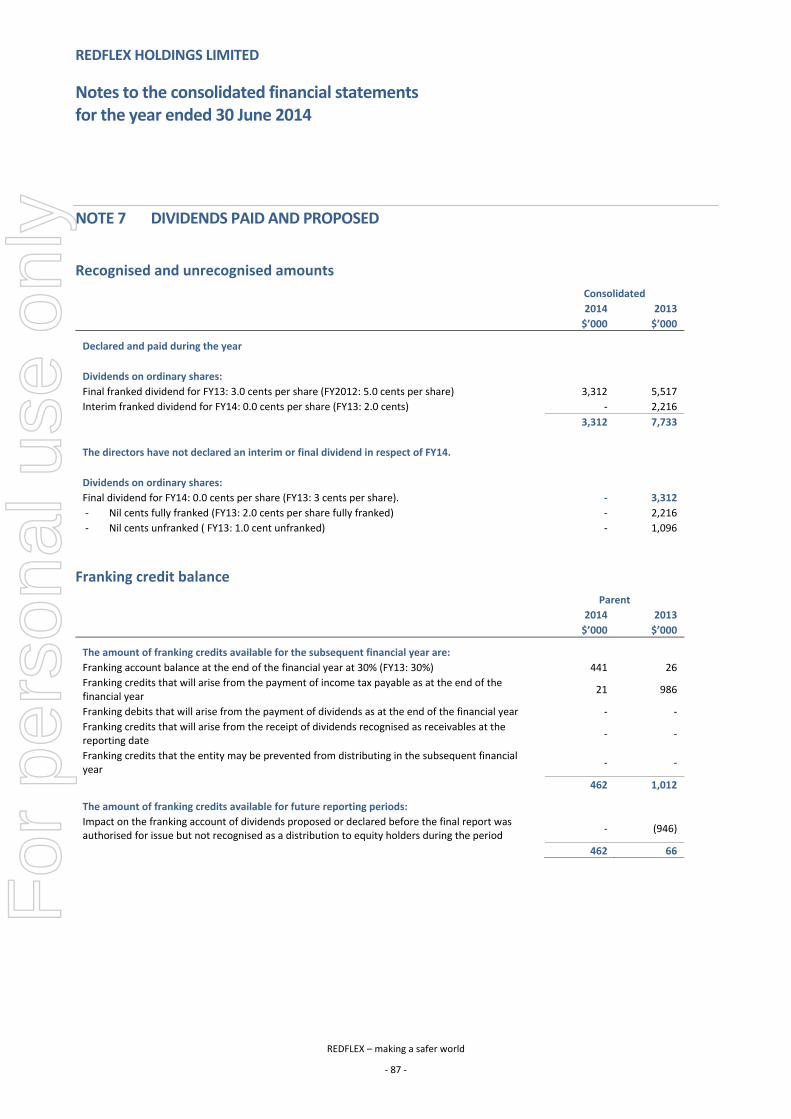
REDFLEX HOLDINGS LIMITED
Notes to the consolidated financial statements for the year ended 30 June 2014
REDFLEX – making a safer world
‐ 87 ‐
NOTE 7 DIVIDENDS PAID AND PROPOSED
Recognised and unrecognised amounts
Consolidated
2014 2013
$’000 $’000
Declared and paid during the year
Dividends on ordinary shares:
Final franked dividend for FY13: 3.0 cents per share (FY2012: 5.0 cents per share) 3,312 5,517
Interim franked dividend for FY14: 0.0 cents per share (FY13: 2.0 cents) ‐ 2,216
3,312 7,733
The directors have not declared an interim or final dividend in respect of FY14.
Dividends on ordinary shares:
Final dividend for FY14: 0.0 cents per share (FY13: 3 cents per share). ‐ 3,312
‐ Nil cents fully franked (FY13: 2.0 cents per share fully franked) ‐ 2,216
‐ Nil cents unfranked ( FY13: 1.0 cent unfranked) ‐ 1,096
Franking credit balance
Parent
2014 2013
$’000 $’000
The amount of franking credits available for the subsequent financial year are:
Franking account balance at the end of the financial year at 30% (FY13: 30%) 441 26
Franking credits that will arise from the payment of income tax payable as at the end of the financial year
21 986
Franking debits that will arise from the payment of dividends as at the end of the financial year ‐ ‐
Franking credits that will arise from the receipt of dividends recognised as receivables at the reporting date
‐ ‐
Franking credits that the entity may be prevented from distributing in the subsequent financial year
‐ ‐
462 1,012
The amount of franking credits available for future reporting periods:
Impact on the franking account of dividends proposed or declared before the final report was authorised for issue but not recognised as a distribution to equity holders during the period
‐ (946)
462 66
For
per
sona
l use
onl
y
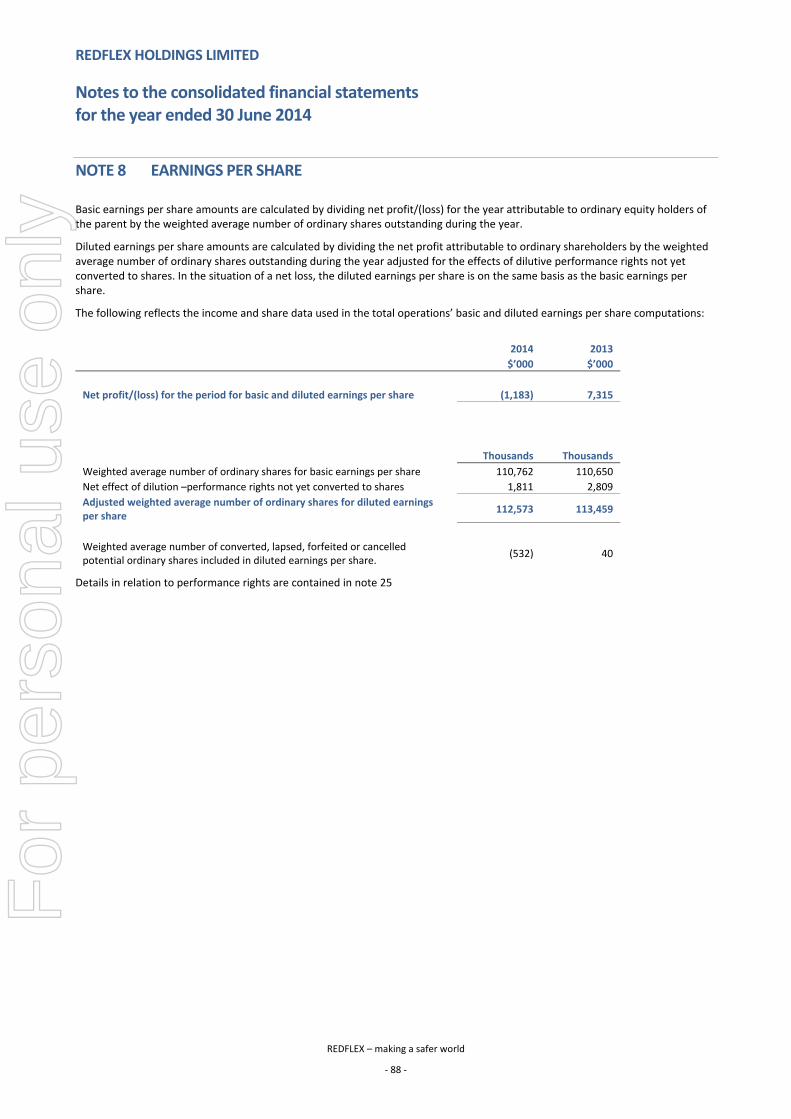
REDFLEX HOLDINGS LIMITED
Notes to the consolidated financial statements for the year ended 30 June 2014
REDFLEX – making a safer world
‐ 88 ‐
NOTE 8 EARNINGS PER SHARE
Basic earnings per share amounts are calculated by dividing net profit/(loss) for the year attributable to ordinary equity holders of the parent by the weighted average number of ordinary shares outstanding during the year.
Diluted earnings per share amounts are calculated by dividing the net profit attributable to ordinary shareholders by the weighted average number of ordinary shares outstanding during the year adjusted for the effects of dilutive performance rights not yet converted to shares. In the situation of a net loss, the diluted earnings per share is on the same basis as the basic earnings per share.
The following reflects the income and share data used in the total operations’ basic and diluted earnings per share computations:
2014 2013
$’000 $’000
Net profit/(loss) for the period for basic and diluted earnings per share (1,183) 7,315
Thousands Thousands
Weighted average number of ordinary shares for basic earnings per share 110,762 110,650
Net effect of dilution –performance rights not yet converted to shares 1,811 2,809
Adjusted weighted average number of ordinary shares for diluted earnings per share
112,573 113,459
Weighted average number of converted, lapsed, forfeited or cancelled potential ordinary shares included in diluted earnings per share.
(532) 40
Details in relation to performance rights are contained in note 25
For
per
sona
l use
onl
y
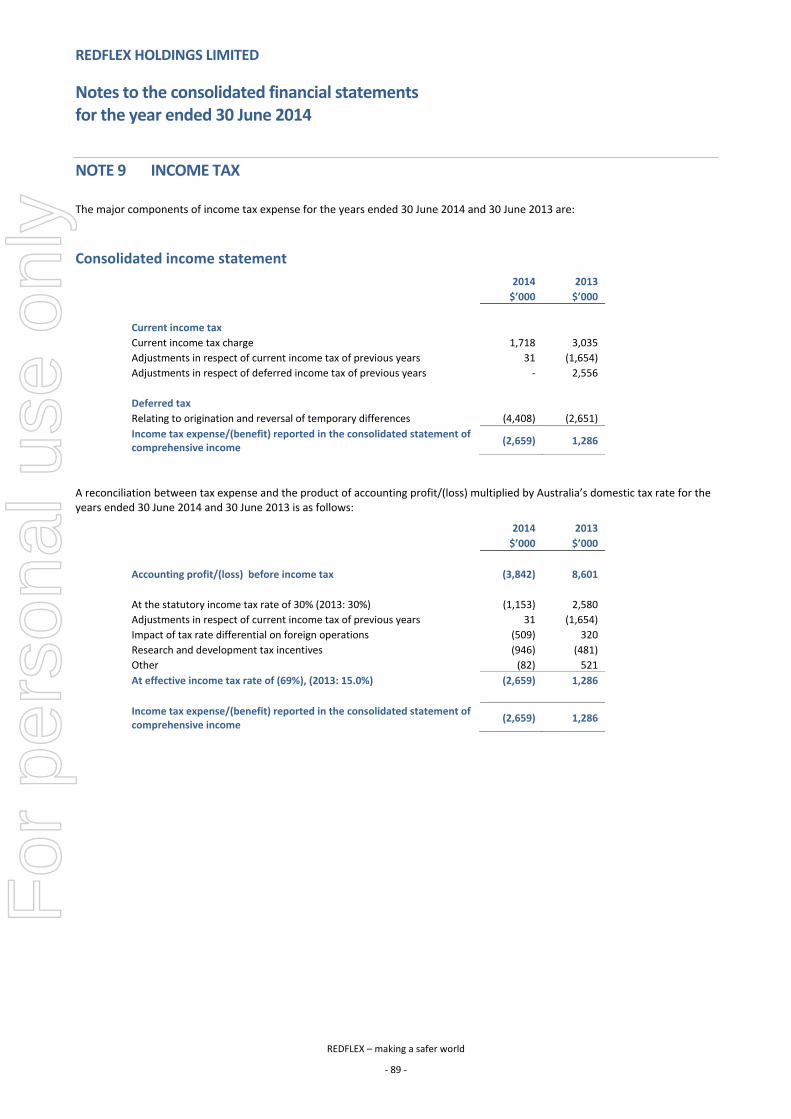
REDFLEX HOLDINGS LIMITED
Notes to the consolidated financial statements for the year ended 30 June 2014
REDFLEX – making a safer world
‐ 89 ‐
NOTE 9 INCOME TAX
The major components of income tax expense for the years ended 30 June 2014 and 30 June 2013 are:
Consolidated income statement
2014 2013
$’000 $’000
Current income tax
Current income tax charge 1,718 3,035
Adjustments in respect of current income tax of previous years 31 (1,654)
Adjustments in respect of deferred income tax of previous years ‐ 2,556
Deferred tax
Relating to origination and reversal of temporary differences (4,408) (2,651)
Income tax expense/(benefit) reported in the consolidated statement of comprehensive income
(2,659) 1,286
A reconciliation between tax expense and the product of accounting profit/(loss) multiplied by Australia’s domestic tax rate for the years ended 30 June 2014 and 30 June 2013 is as follows:
2014 2013
$’000 $’000
Accounting profit/(loss) before income tax (3,842) 8,601
At the statutory income tax rate of 30% (2013: 30%) (1,153) 2,580
Adjustments in respect of current income tax of previous years 31 (1,654)
Impact of tax rate differential on foreign operations (509) 320
Research and development tax incentives (946) (481)
Other (82) 521
At effective income tax rate of (69%), (2013: 15.0%) (2,659) 1,286
Income tax expense/(benefit) reported in the consolidated statement of comprehensive income
(2,659) 1,286
For
per
sona
l use
onl
y
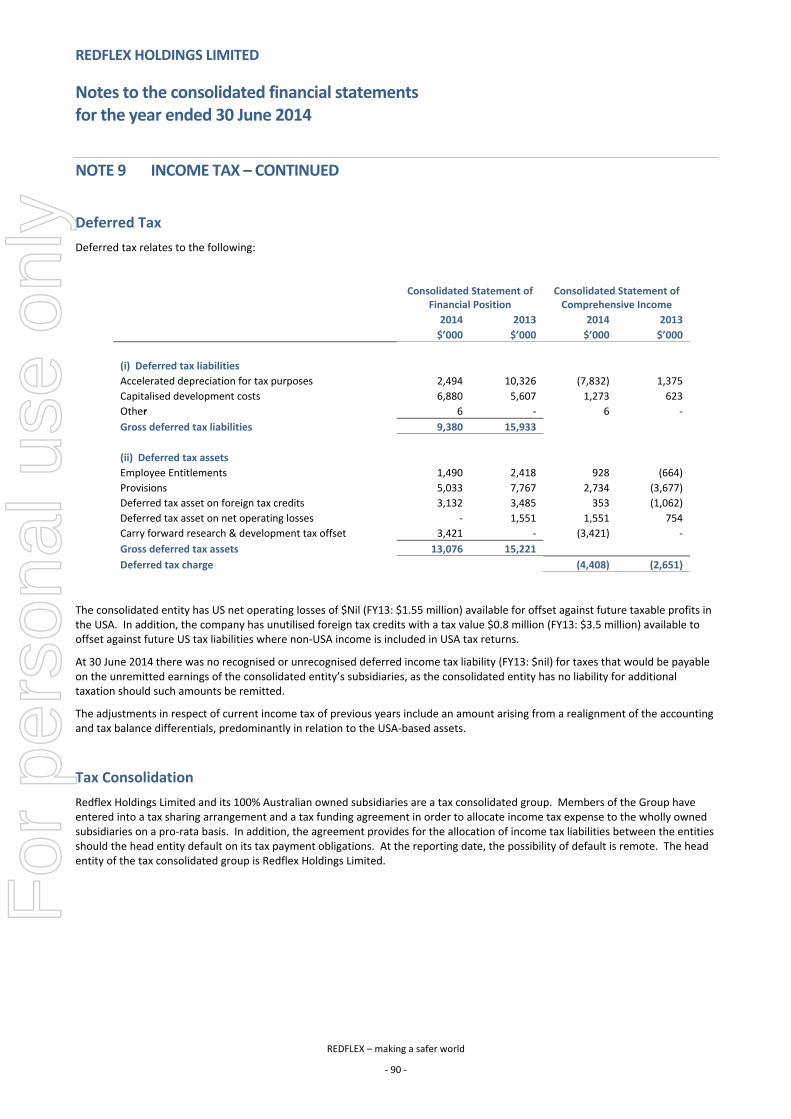
REDFLEX HOLDINGS LIMITED
Notes to the consolidated financial statements for the year ended 30 June 2014
REDFLEX – making a safer world
‐ 90 ‐
NOTE 9 INCOME TAX – CONTINUED
Deferred Tax
Deferred tax relates to the following:
Consolidated Statement of
Financial Position Consolidated Statement of Comprehensive Income
2014 2013 2014 2013
$’000 $’000 $’000 $’000
(i) Deferred tax liabilities
Accelerated depreciation for tax purposes 2,494 10,326 (7,832) 1,375
Capitalised development costs 6,880 5,607 1,273 623
Other 6 ‐ 6 ‐
Gross deferred tax liabilities 9,380 15,933
(ii) Deferred tax assets
Employee Entitlements 1,490 2,418 928 (664)
Provisions 5,033 7,767 2,734 (3,677)
Deferred tax asset on foreign tax credits 3,132 3,485 353 (1,062)
Deferred tax asset on net operating losses ‐ 1,551 1,551 754
Carry forward research & development tax offset 3,421 ‐ (3,421) ‐
Gross deferred tax assets 13,076 15,221
Deferred tax charge (4,408) (2,651)
The consolidated entity has US net operating losses of $Nil (FY13: $1.55 million) available for offset against future taxable profits in the USA. In addition, the company has unutilised foreign tax credits with a tax value $0.8 million (FY13: $3.5 million) available to offset against future US tax liabilities where non‐USA income is included in USA tax returns.
At 30 June 2014 there was no recognised or unrecognised deferred income tax liability (FY13: $nil) for taxes that would be payable on the unremitted earnings of the consolidated entity’s subsidiaries, as the consolidated entity has no liability for additional taxation should such amounts be remitted.
The adjustments in respect of current income tax of previous years include an amount arising from a realignment of the accounting and tax balance differentials, predominantly in relation to the USA‐based assets.
Tax Consolidation
Redflex Holdings Limited and its 100% Australian owned subsidiaries are a tax consolidated group. Members of the Group have entered into a tax sharing arrangement and a tax funding agreement in order to allocate income tax expense to the wholly owned subsidiaries on a pro‐rata basis. In addition, the agreement provides for the allocation of income tax liabilities between the entities should the head entity default on its tax payment obligations. At the reporting date, the possibility of default is remote. The head entity of the tax consolidated group is Redflex Holdings Limited.
For
per
sona
l use
onl
y
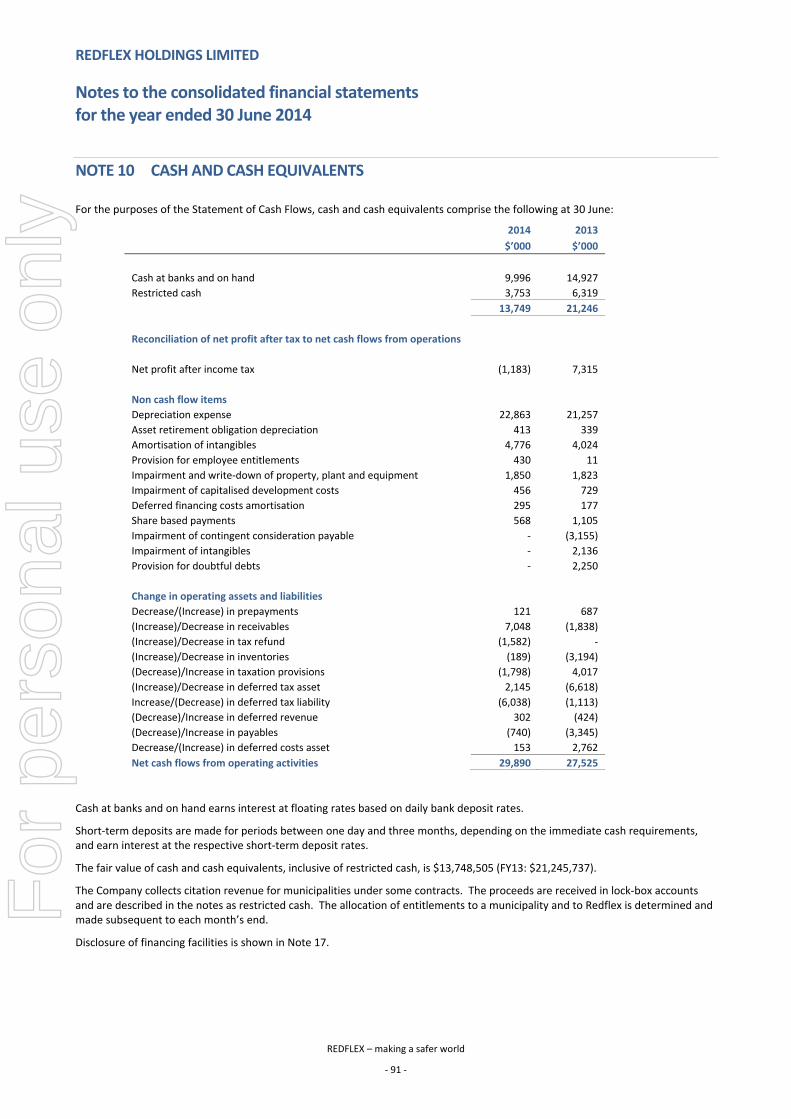
REDFLEX HOLDINGS LIMITED
Notes to the consolidated financial statements for the year ended 30 June 2014
REDFLEX – making a safer world
‐ 91 ‐
NOTE 10 CASH AND CASH EQUIVALENTS
For the purposes of the Statement of Cash Flows, cash and cash equivalents comprise the following at 30 June:
2014 2013
$’000 $’000
Cash at banks and on hand 9,996 14,927
Restricted cash 3,753 6,319
13,749 21,246
Reconciliation of net profit after tax to net cash flows from operations
Net profit after income tax (1,183) 7,315
Non cash flow items
Depreciation expense 22,863 21,257
Asset retirement obligation depreciation 413 339
Amortisation of intangibles 4,776 4,024
Provision for employee entitlements 430 11
Impairment and write‐down of property, plant and equipment 1,850 1,823
Impairment of capitalised development costs 456 729
Deferred financing costs amortisation 295 177
Share based payments 568 1,105
Impairment of contingent consideration payable ‐ (3,155)
Impairment of intangibles ‐ 2,136
Provision for doubtful debts ‐ 2,250
Change in operating assets and liabilities
Decrease/(Increase) in prepayments 121 687
(Increase)/Decrease in receivables 7,048 (1,838)
(Increase)/Decrease in tax refund (1,582) ‐
(Increase)/Decrease in inventories (189) (3,194)
(Decrease)/Increase in taxation provisions (1,798) 4,017
(Increase)/Decrease in deferred tax asset 2,145 (6,618)
Increase/(Decrease) in deferred tax liability (6,038) (1,113)
(Decrease)/Increase in deferred revenue 302 (424)
(Decrease)/Increase in payables (740) (3,345)
Decrease/(Increase) in deferred costs asset 153 2,762
Net cash flows from operating activities 29,890 27,525
Cash at banks and on hand earns interest at floating rates based on daily bank deposit rates.
Short‐term deposits are made for periods between one day and three months, depending on the immediate cash requirements, and earn interest at the respective short‐term deposit rates.
The fair value of cash and cash equivalents, inclusive of restricted cash, is $13,748,505 (FY13: $21,245,737).
The Company collects citation revenue for municipalities under some contracts. The proceeds are received in lock‐box accounts and are described in the notes as restricted cash. The allocation of entitlements to a municipality and to Redflex is determined and made subsequent to each month’s end.
Disclosure of financing facilities is shown in Note 17.
For
per
sona
l use
onl
y
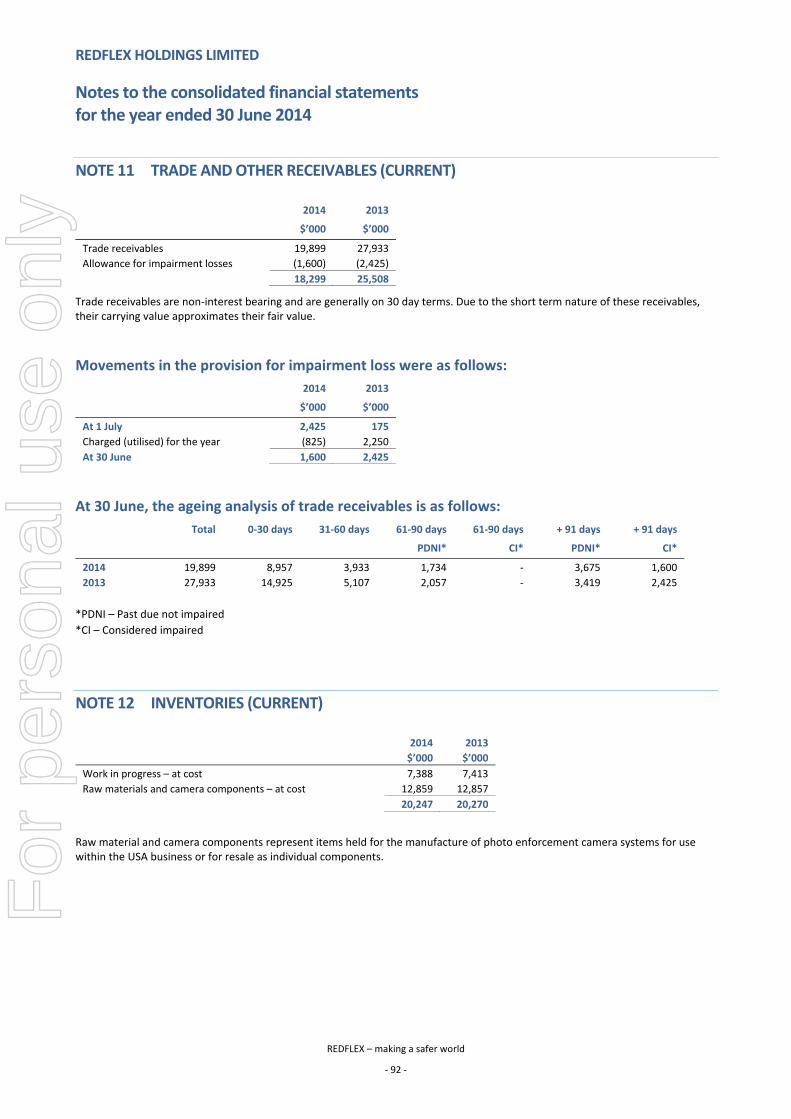
REDFLEX HOLDINGS LIMITED
Notes to the consolidated financial statements for the year ended 30 June 2014
REDFLEX – making a safer world
‐ 92 ‐
NOTE 11 TRADE AND OTHER RECEIVABLES (CURRENT)
2014 2013
$’000 $’000
Trade receivables 19,899 27,933
Allowance for impairment losses (1,600) (2,425)
18,299 25,508
Trade receivables are non‐interest bearing and are generally on 30 day terms. Due to the short term nature of these receivables, their carrying value approximates their fair value.
Movements in the provision for impairment loss were as follows:
2014 2013
$’000 $’000
At 1 July 2,425 175
Charged (utilised) for the year (825) 2,250
At 30 June 1,600 2,425
At 30 June, the ageing analysis of trade receivables is as follows:
Total 0‐30 days 31‐60 days 61‐90 days 61‐90 days + 91 days + 91 days
PDNI* CI* PDNI* CI*
2014 19,899 8,957 3,933 1,734 ‐ 3,675 1,600
2013 27,933 14,925 5,107 2,057 ‐ 3,419 2,425
*PDNI – Past due not impaired
*CI – Considered impaired
NOTE 12 INVENTORIES (CURRENT)
2014 2013
$’000 $’000
Work in progress – at cost 7,388 7,413
Raw materials and camera components – at cost 12,859 12,857
20,247 20,270
Raw material and camera components represent items held for the manufacture of photo enforcement camera systems for use within the USA business or for resale as individual components.
For
per
sona
l use
onl
y
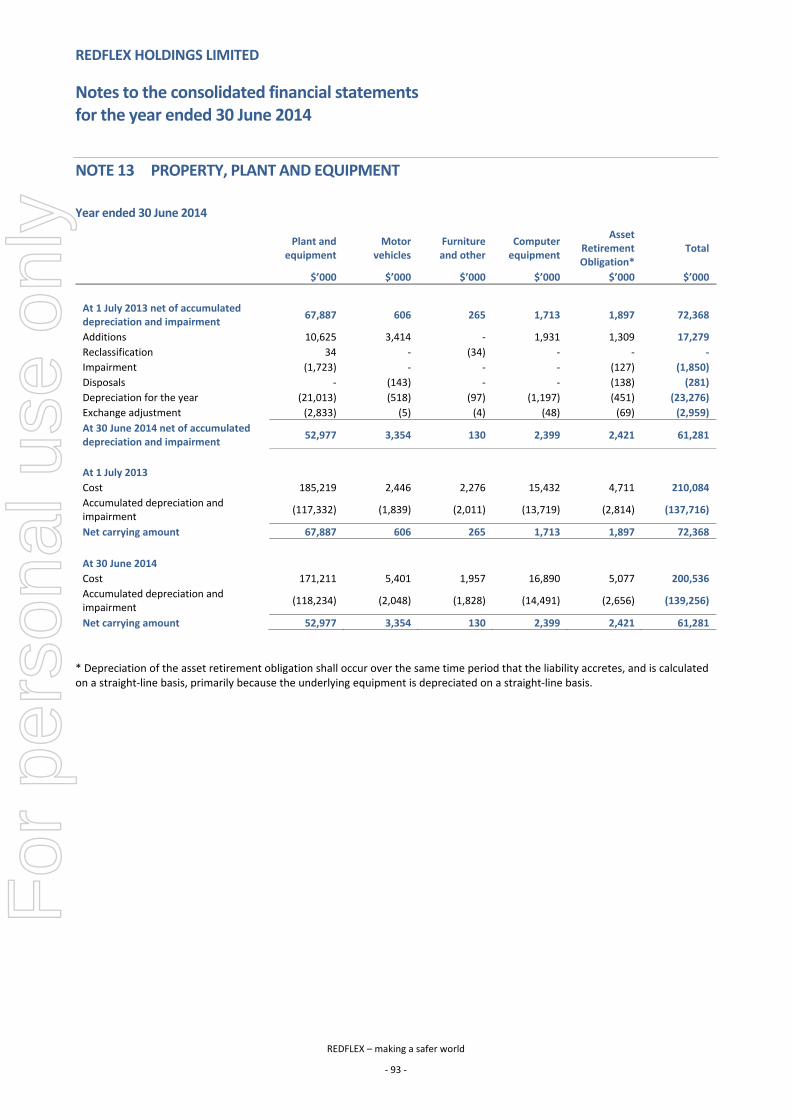
REDFLEX HOLDINGS LIMITED
Notes to the consolidated financial statements for the year ended 30 June 2014
REDFLEX – making a safer world
‐ 93 ‐
NOTE 13 PROPERTY, PLANT AND EQUIPMENT
Year ended 30 June 2014
Plant and
equipment Motor
vehicles Furniture and other
Computer equipment
Asset Retirement Obligation*
Total
$’000 $’000 $’000 $’000 $’000 $’000
At 1 July 2013 net of accumulated depreciation and impairment
67,887 606 265 1,713 1,897 72,368
Additions 10,625 3,414 ‐ 1,931 1,309 17,279
Reclassification 34 ‐ (34) ‐ ‐ ‐
Impairment (1,723) ‐ ‐ ‐ (127) (1,850)
Disposals ‐ (143) ‐ ‐ (138) (281)
Depreciation for the year (21,013) (518) (97) (1,197) (451) (23,276)
Exchange adjustment (2,833) (5) (4) (48) (69) (2,959)
At 30 June 2014 net of accumulated depreciation and impairment
52,977 3,354 130 2,399 2,421 61,281
At 1 July 2013
Cost 185,219 2,446 2,276 15,432 4,711 210,084
Accumulated depreciation and impairment
(117,332) (1,839) (2,011) (13,719) (2,814) (137,716)
Net carrying amount 67,887 606 265 1,713 1,897 72,368
At 30 June 2014
Cost 171,211 5,401 1,957 16,890 5,077 200,536
Accumulated depreciation and impairment
(118,234) (2,048) (1,828) (14,491) (2,656) (139,256)
Net carrying amount 52,977 3,354 130 2,399 2,421 61,281
* Depreciation of the asset retirement obligation shall occur over the same time period that the liability accretes, and is calculated on a straight‐line basis, primarily because the underlying equipment is depreciated on a straight‐line basis.
For
per
sona
l use
onl
y
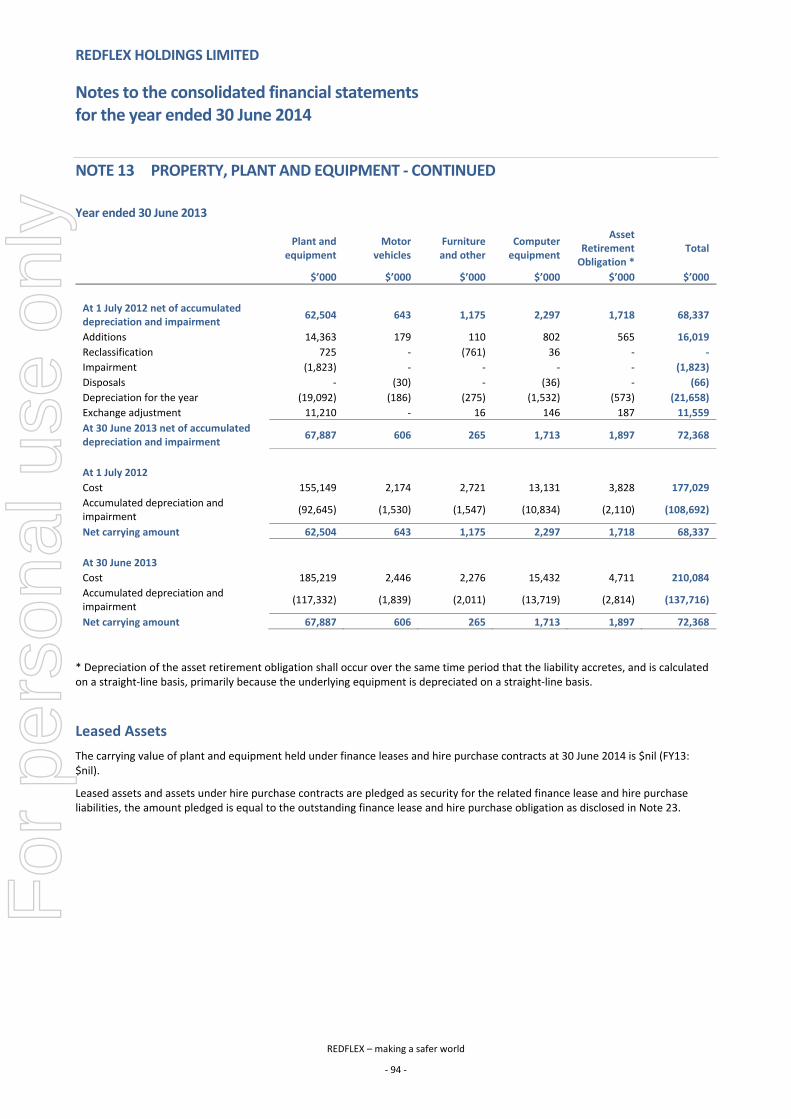
REDFLEX HOLDINGS LIMITED
Notes to the consolidated financial statements for the year ended 30 June 2014
REDFLEX – making a safer world
‐ 94 ‐
NOTE 13 PROPERTY, PLANT AND EQUIPMENT ‐ CONTINUED
Year ended 30 June 2013
Plant and
equipment Motor
vehicles Furniture and other
Computer equipment
Asset Retirement Obligation *
Total
$’000 $’000 $’000 $’000 $’000 $’000
At 1 July 2012 net of accumulated depreciation and impairment
62,504 643 1,175 2,297 1,718 68,337
Additions 14,363 179 110 802 565 16,019
Reclassification 725 ‐ (761) 36 ‐ ‐
Impairment (1,823) ‐ ‐ ‐ ‐ (1,823)
Disposals ‐ (30) ‐ (36) ‐ (66)
Depreciation for the year (19,092) (186) (275) (1,532) (573) (21,658)
Exchange adjustment 11,210 ‐ 16 146 187 11,559
At 30 June 2013 net of accumulated depreciation and impairment
67,887 606 265 1,713 1,897 72,368
At 1 July 2012
Cost 155,149 2,174 2,721 13,131 3,828 177,029
Accumulated depreciation and impairment
(92,645) (1,530) (1,547) (10,834) (2,110) (108,692)
Net carrying amount 62,504 643 1,175 2,297 1,718 68,337
At 30 June 2013
Cost 185,219 2,446 2,276 15,432 4,711 210,084
Accumulated depreciation and impairment
(117,332) (1,839) (2,011) (13,719) (2,814) (137,716)
Net carrying amount 67,887 606 265 1,713 1,897 72,368
* Depreciation of the asset retirement obligation shall occur over the same time period that the liability accretes, and is calculated on a straight‐line basis, primarily because the underlying equipment is depreciated on a straight‐line basis.
Leased Assets
The carrying value of plant and equipment held under finance leases and hire purchase contracts at 30 June 2014 is $nil (FY13: $nil).
Leased assets and assets under hire purchase contracts are pledged as security for the related finance lease and hire purchase liabilities, the amount pledged is equal to the outstanding finance lease and hire purchase obligation as disclosed in Note 23.
For
per
sona
l use
onl
y
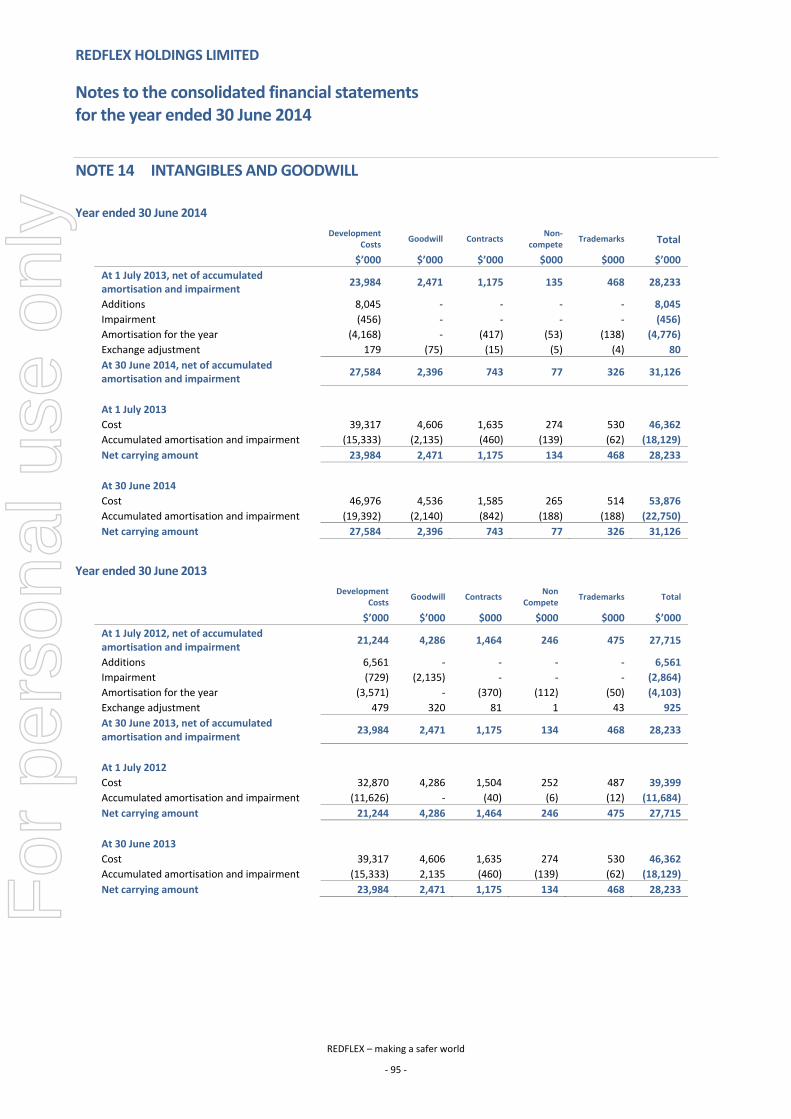
REDFLEX HOLDINGS LIMITED
Notes to the consolidated financial statements for the year ended 30 June 2014
REDFLEX – making a safer world
‐ 95 ‐
NOTE 14 INTANGIBLES AND GOODWILL
Year ended 30 June 2014
Development
Costs Goodwill Contracts
Non‐compete
Trademarks Total
$’000 $’000 $’000 $000 $000 $’000
At 1 July 2013, net of accumulated amortisation and impairment
23,984 2,471 1,175 135 468 28,233
Additions 8,045 ‐ ‐ ‐ ‐ 8,045
Impairment (456) ‐ ‐ ‐ ‐ (456)
Amortisation for the year (4,168) ‐ (417) (53) (138) (4,776)
Exchange adjustment 179 (75) (15) (5) (4) 80
At 30 June 2014, net of accumulated amortisation and impairment
27,584 2,396 743 77 326 31,126
At 1 July 2013
Cost 39,317 4,606 1,635 274 530 46,362
Accumulated amortisation and impairment (15,333) (2,135) (460) (139) (62) (18,129)
Net carrying amount 23,984 2,471 1,175 134 468 28,233
At 30 June 2014
Cost 46,976 4,536 1,585 265 514 53,876
Accumulated amortisation and impairment (19,392) (2,140) (842) (188) (188) (22,750)
Net carrying amount 27,584 2,396 743 77 326 31,126
Year ended 30 June 2013
Development
Costs Goodwill Contracts
Non Compete
Trademarks Total
$’000 $’000 $000 $000 $000 $’000
At 1 July 2012, net of accumulated amortisation and impairment
21,244 4,286 1,464 246 475 27,715
Additions 6,561 ‐ ‐ ‐ ‐ 6,561
Impairment (729) (2,135) ‐ ‐ ‐ (2,864)
Amortisation for the year (3,571) ‐ (370) (112) (50) (4,103)
Exchange adjustment 479 320 81 1 43 925
At 30 June 2013, net of accumulated amortisation and impairment
23,984 2,471 1,175 134 468 28,233
At 1 July 2012
Cost 32,870 4,286 1,504 252 487 39,399
Accumulated amortisation and impairment (11,626) ‐ (40) (6) (12) (11,684)
Net carrying amount 21,244 4,286 1,464 246 475 27,715
At 30 June 2013
Cost 39,317 4,606 1,635 274 530 46,362
Accumulated amortisation and impairment (15,333) 2,135 (460) (139) (62) (18,129)
Net carrying amount 23,984 2,471 1,175 134 468 28,233
For
per
sona
l use
onl
y
REDFLEX HOLDINGS LIMITED
Notes to the consolidated financial statements for the year ended 30 June 2014
REDFLEX – making a safer world
‐ 96 ‐
NOTE 14 INTANGIBLES AND GOODWILL ‐ CONTINUED
Development costs
Development costs are capitalised at cost. This intangible asset has been assessed as having a finite life and is amortised over its useful life using the straight line method. The asset is tested for impairment when an indicator of impairment arises.
Goodwill
Goodwill was acquired upon the acquisition of the business and business assets of Redflex Student Guardian ( Smart Bus) and is tested for impairment on an annual basis. The recoverable amount of the Redflex Guardian cash generating unit within the North American reporting segment has been determined based upon a value in use calculation using cash flow projections based on financial budgets approved by senior management covering a five year period.
Impairment testing of goodwill
The key assumptions used in cash flow projections to undertake impairment testing of goodwill are:
Revenue growth has been determined by extrapolating the number of new systems, anticipated issuance and paid citation rates for near term opportunities which have already been identified. These assumptions are based on historical performance and also the assumptions underlying the Company’s board approved budget. Specific assumptions include:
a. An approximate 42% (CAGR) growth in systems over the five year period. This is based on initial growth of over 100% in 2015 based on “pipeline” business being converted. Long term growth is estimated to be 25% p.a in subsequent years of the forecast period.
b. An improvement in the volume of citations identified per system by 66% over the first two years of the forecast and then flat thereafter. This assumption is based on the location of new systems being more high yielding than those currently installed to date.
Margins based on performance in the preceding year, increased for expected efficiency improvements.
The yield on a ten year USA based Government Bond rate consistent with external informational sources is utilised;
Projected cash flows have been discounted using an after‐tax discount rate of 15.5% (FY13: 15.8%); and
An extrapolated growth rate of 2% in the installed base has been used beyond the forecast period.
Sensitivity analysis has been performed on the key operational assumptions used in the forecast. The results from this analysis demonstrate that the following changes can be made to these assumptions, without the results giving rise for the need to consider impairment:
a. A reduction to 22% growth in the total forecasted volume of new installations.
b. A reduction to 28% growth in the daily citation rate and then remaining flat over the subsequent years of the forecast period.
Contracts, non compete and trademarks
These are other intangible assets arising from the acquisition of Smart Bus. These amounts are amortised over their useful economic lives ranging between 3 and 5 years.
For
per
sona
l use
onl
y
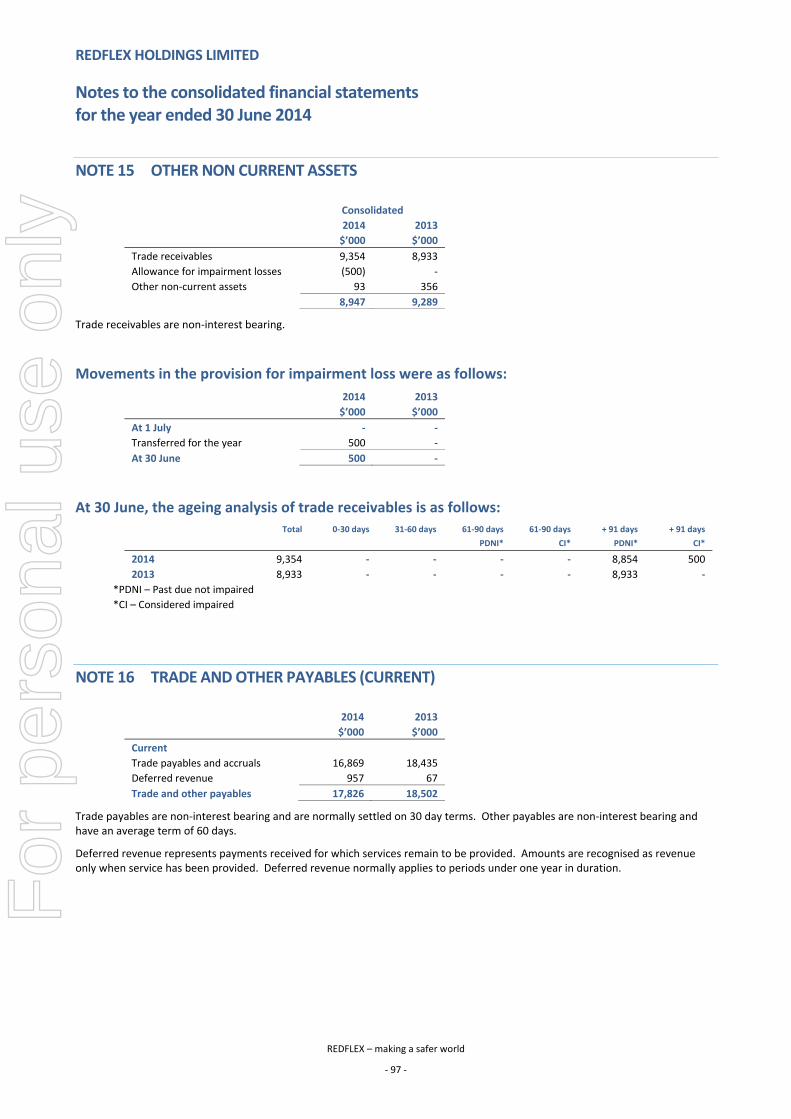
REDFLEX HOLDINGS LIMITED
Notes to the consolidated financial statements for the year ended 30 June 2014
REDFLEX – making a safer world
‐ 97 ‐
NOTE 15 OTHER NON CURRENT ASSETS
Consolidated
2014 2013
$’000 $’000
Trade receivables 9,354 8,933
Allowance for impairment losses (500) ‐
Other non‐current assets 93 356
8,947 9,289
Trade receivables are non‐interest bearing.
Movements in the provision for impairment loss were as follows:
2014 2013
$’000 $’000
At 1 July ‐ ‐
Transferred for the year 500 ‐
At 30 June 500 ‐
At 30 June, the ageing analysis of trade receivables is as follows: Total 0‐30 days 31‐60 days 61‐90 days 61‐90 days + 91 days + 91 days
PDNI* CI* PDNI* CI*
2014 9,354 ‐ ‐ ‐ ‐ 8,854 500
2013 8,933 ‐ ‐ ‐ ‐ 8,933 ‐
*PDNI – Past due not impaired
*CI – Considered impaired
NOTE 16 TRADE AND OTHER PAYABLES (CURRENT)
2014 2013
$’000 $’000
Current
Trade payables and accruals 16,869 18,435
Deferred revenue 957 67
Trade and other payables 17,826 18,502
Trade payables are non‐interest bearing and are normally settled on 30 day terms. Other payables are non‐interest bearing and have an average term of 60 days.
Deferred revenue represents payments received for which services remain to be provided. Amounts are recognised as revenue only when service has been provided. Deferred revenue normally applies to periods under one year in duration.
For
per
sona
l use
onl
y
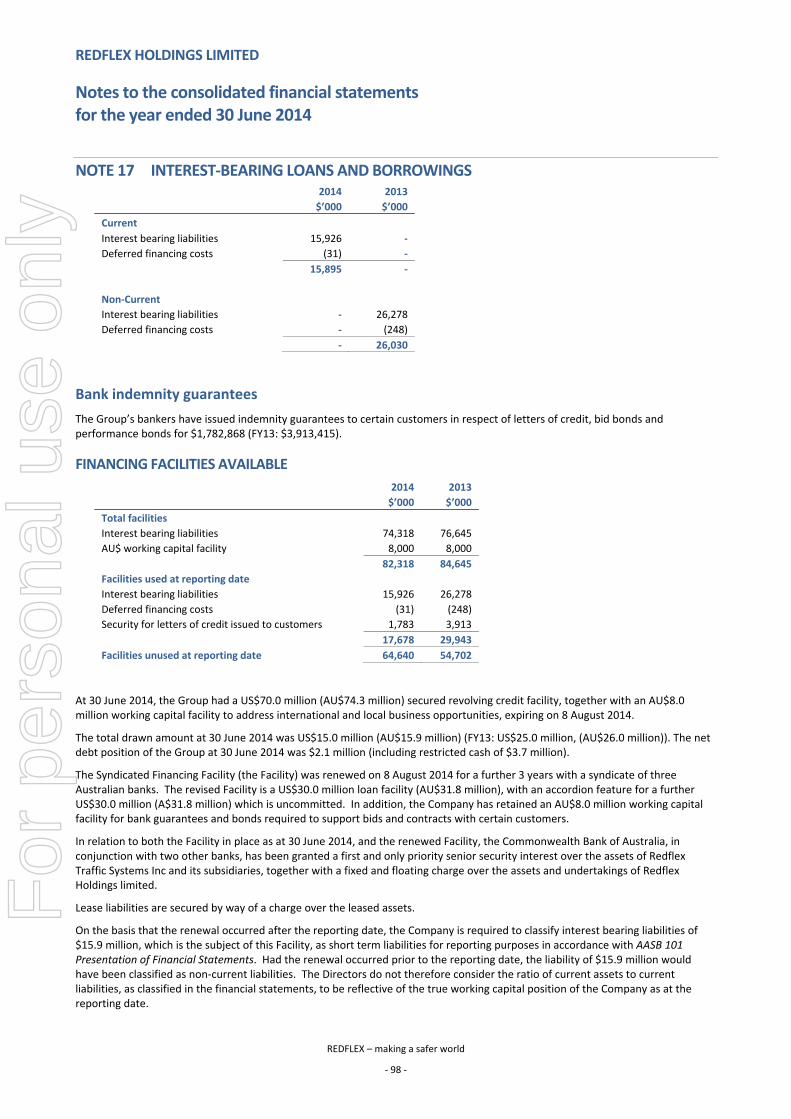
REDFLEX HOLDINGS LIMITED
Notes to the consolidated financial statements for the year ended 30 June 2014
REDFLEX – making a safer world
‐ 98 ‐
NOTE 17 INTEREST‐BEARING LOANS AND BORROWINGS 2014 2013
$’000 $’000
Current
Interest bearing liabilities 15,926 ‐
Deferred financing costs (31) ‐
15,895 ‐
Non‐Current
Interest bearing liabilities ‐ 26,278
Deferred financing costs ‐ (248)
‐ 26,030
Bank indemnity guarantees
The Group’s bankers have issued indemnity guarantees to certain customers in respect of letters of credit, bid bonds and performance bonds for $1,782,868 (FY13: $3,913,415).
FINANCING FACILITIES AVAILABLE
2014 2013
$’000 $’000
Total facilities
Interest bearing liabilities 74,318 76,645
AU$ working capital facility 8,000 8,000
82,318 84,645
Facilities used at reporting date
Interest bearing liabilities 15,926 26,278
Deferred financing costs (31) (248)
Security for letters of credit issued to customers 1,783 3,913
17,678 29,943
Facilities unused at reporting date 64,640 54,702
At 30 June 2014, the Group had a US$70.0 million (AU$74.3 million) secured revolving credit facility, together with an AU$8.0 million working capital facility to address international and local business opportunities, expiring on 8 August 2014.
The total drawn amount at 30 June 2014 was US$15.0 million (AU$15.9 million) (FY13: US$25.0 million, (AU$26.0 million)). The net debt position of the Group at 30 June 2014 was $2.1 million (including restricted cash of $3.7 million).
The Syndicated Financing Facility (the Facility) was renewed on 8 August 2014 for a further 3 years with a syndicate of three Australian banks. The revised Facility is a US$30.0 million loan facility (AU$31.8 million), with an accordion feature for a further US$30.0 million (A$31.8 million) which is uncommitted. In addition, the Company has retained an AU$8.0 million working capital facility for bank guarantees and bonds required to support bids and contracts with certain customers.
In relation to both the Facility in place as at 30 June 2014, and the renewed Facility, the Commonwealth Bank of Australia, in conjunction with two other banks, has been granted a first and only priority senior security interest over the assets of Redflex Traffic Systems Inc and its subsidiaries, together with a fixed and floating charge over the assets and undertakings of Redflex Holdings limited.
Lease liabilities are secured by way of a charge over the leased assets.
On the basis that the renewal occurred after the reporting date, the Company is required to classify interest bearing liabilities of $15.9 million, which is the subject of this Facility, as short term liabilities for reporting purposes in accordance with AASB 101 Presentation of Financial Statements. Had the renewal occurred prior to the reporting date, the liability of $15.9 million would have been classified as non‐current liabilities. The Directors do not therefore consider the ratio of current assets to current liabilities, as classified in the financial statements, to be reflective of the true working capital position of the Company as at the reporting date.
For
per
sona
l use
onl
y
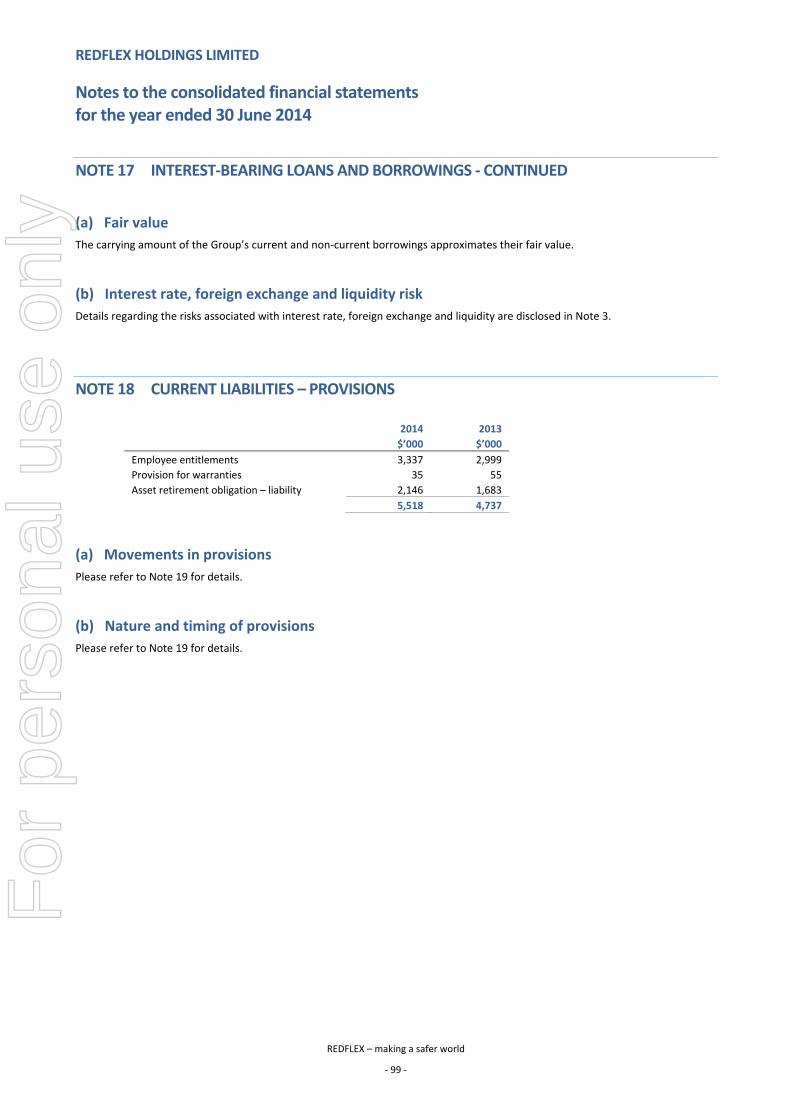
REDFLEX HOLDINGS LIMITED
Notes to the consolidated financial statements for the year ended 30 June 2014
REDFLEX – making a safer world
‐ 99 ‐
NOTE 17 INTEREST‐BEARING LOANS AND BORROWINGS ‐ CONTINUED
(a) Fair value
The carrying amount of the Group’s current and non‐current borrowings approximates their fair value.
(b) Interest rate, foreign exchange and liquidity risk
Details regarding the risks associated with interest rate, foreign exchange and liquidity are disclosed in Note 3.
NOTE 18 CURRENT LIABILITIES – PROVISIONS
2014 2013
$’000 $’000
Employee entitlements 3,337 2,999
Provision for warranties 35 55
Asset retirement obligation – liability 2,146 1,683
5,518 4,737
(a) Movements in provisions
Please refer to Note 19 for details.
(b) Nature and timing of provisions
Please refer to Note 19 for details.
For
per
sona
l use
onl
y
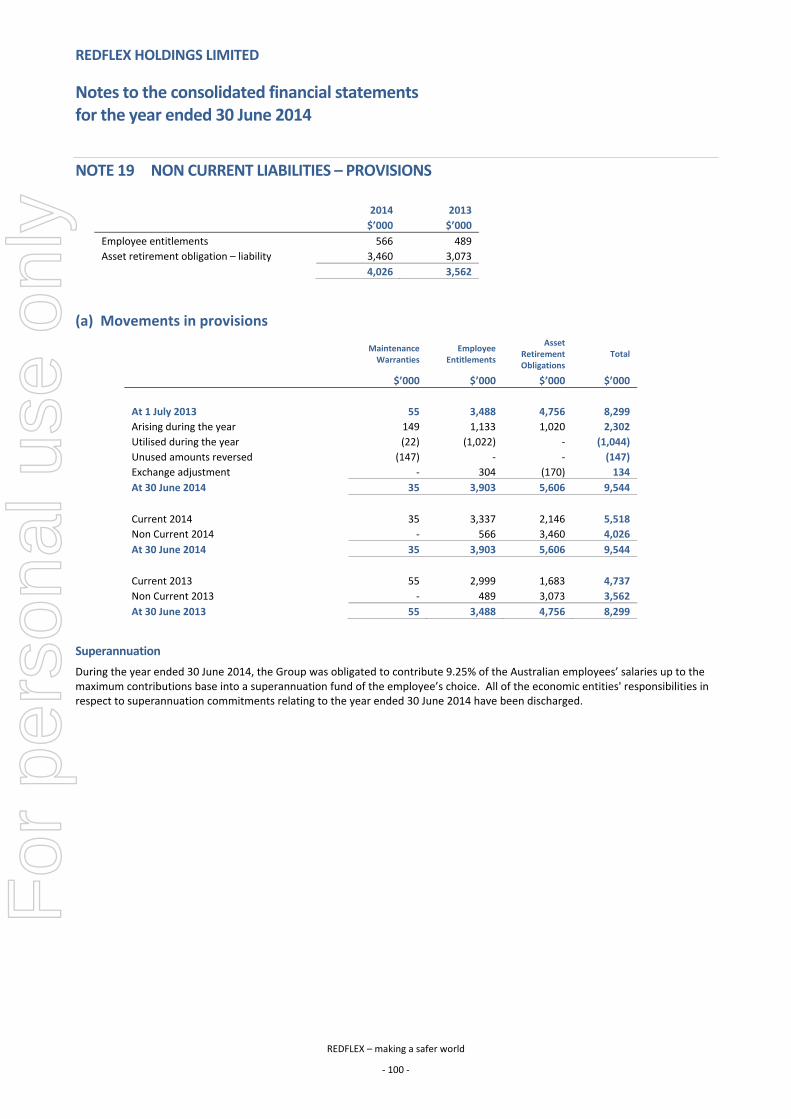
REDFLEX HOLDINGS LIMITED
Notes to the consolidated financial statements for the year ended 30 June 2014
REDFLEX – making a safer world
‐ 100 ‐
NOTE 19 NON CURRENT LIABILITIES – PROVISIONS
2014 2013
$’000 $’000
Employee entitlements 566 489
Asset retirement obligation – liability 3,460 3,073
4,026 3,562
(a) Movements in provisions
Maintenance Warranties
Employee Entitlements
Asset Retirement Obligations
Total
$’000 $’000 $’000 $’000
At 1 July 2013 55 3,488 4,756 8,299
Arising during the year 149 1,133 1,020 2,302
Utilised during the year (22) (1,022) ‐ (1,044)
Unused amounts reversed (147) ‐ ‐ (147)
Exchange adjustment ‐ 304 (170) 134
At 30 June 2014 35 3,903 5,606 9,544
Current 2014 35 3,337 2,146 5,518
Non Current 2014 ‐ 566 3,460 4,026
At 30 June 2014 35 3,903 5,606 9,544
Current 2013 55 2,999 1,683 4,737
Non Current 2013 ‐ 489 3,073 3,562
At 30 June 2013 55 3,488 4,756 8,299
Superannuation
During the year ended 30 June 2014, the Group was obligated to contribute 9.25% of the Australian employees’ salaries up to the maximum contributions base into a superannuation fund of the employee’s choice. All of the economic entities' responsibilities in respect to superannuation commitments relating to the year ended 30 June 2014 have been discharged.
For
per
sona
l use
onl
y

REDFLEX HOLDINGS LIMITED
Notes to the consolidated financial statements for the year ended 30 June 2014
REDFLEX – making a safer world
‐ 101 ‐
NOTE 19 NON CURRENT LIABILITIES – PROVISIONS ‐ CONTINUED
(b) Nature and Timing of Provisions
(i) Maintenance warranties
A provision is recognised for expected warranty claims on products sold during the last two years, based on past experience of the level of repairs and “make good” costs.
It is expected that most of these costs will be incurred in the next financial year and all will have been incurred within two years of the balance date.
Assumptions used to calculate the provision for warranties were based on current sales levels and current information available about returns based on the warranty period for products.
(ii) Asset retirement obligation
The ‘Build Own Operate and Maintain’ business within the North American traffic division is based on individual contracts with municipalities for Redflex to install and operate red light and/or speed enforcement equipment, generally for 5 years or less. Certain of these contracts require that, upon termination, Redflex removes the equipment and restores the municipality’s site to its original condition.
(iii) Employee entitlements
The movement in the employee entitlements provision relates to extra entitlements incurred net of entitlements taken during the financial year.
NOTE 20 CONTINGENCIES
There has been no change in contingent assets or liabilities since 30 June 2014.
Certain entities in the Group are party to various legal actions and claims which have arisen in the ordinary course of business. Any liabilities arising from such actions and claims are not expected to have a material adverse effect on Redflex. The Board and the Company’s legal advisors closely monitor these actions. Provisions are not required in respect of these matters, as it is either not probable that a future sacrifice of economic benefits will be required, or the amount is not capable of reliable measurement.
City of Chicago – possible outcomes
The Company has previously announced issues in regard to its US subsidiary’s historical dealings with the City of Chicago, and the outcome of the internal investigation.
The Chicago City Authorities has authority to issue a variety of penalties for local ordinance violations ranging from monetary penalties to debarment. To date no monetary penalties have been presented to the Company.
The United States Department of Justice has also commenced investigation into the conduct of the Company, selected employees and external parties in relation to the Company’s internal investigative findings. On 13 August 2014, the Department of Justice indicted a former company employee, a former company sales agent, and a representative of the City of Chicago. The Company was not indicted. As the Department of Justice continues its investigation and prosecution process, it is possible that the Company will be subject to monetary fines in association with the ultimate disposition of the matters. At this point in time it is not possible to estimate the potential timing for such a resolution, nor the level of potential monetary fine that the Company may face.
For
per
sona
l use
onl
y
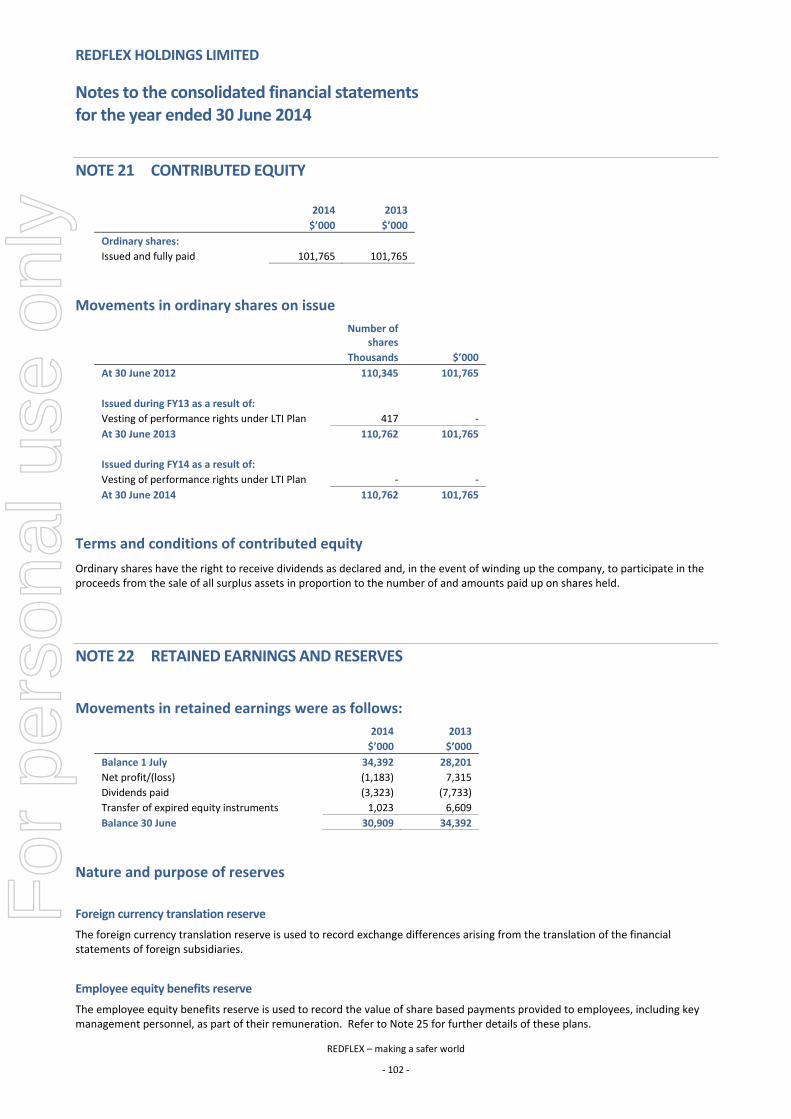
REDFLEX HOLDINGS LIMITED
Notes to the consolidated financial statements for the year ended 30 June 2014
REDFLEX – making a safer world
‐ 102 ‐
NOTE 21 CONTRIBUTED EQUITY
2014 2013
$’000 $’000
Ordinary shares:
Issued and fully paid 101,765 101,765
Movements in ordinary shares on issue
Number of
shares
Thousands $’000
At 30 June 2012 110,345 101,765
Issued during FY13 as a result of:
Vesting of performance rights under LTI Plan 417 ‐
At 30 June 2013 110,762 101,765
Issued during FY14 as a result of:
Vesting of performance rights under LTI Plan ‐ ‐
At 30 June 2014 110,762 101,765
Terms and conditions of contributed equity
Ordinary shares have the right to receive dividends as declared and, in the event of winding up the company, to participate in the proceeds from the sale of all surplus assets in proportion to the number of and amounts paid up on shares held.
NOTE 22 RETAINED EARNINGS AND RESERVES
Movements in retained earnings were as follows:
2014 2013
$’000 $’000
Balance 1 July 34,392 28,201
Net profit/(loss) (1,183) 7,315
Dividends paid (3,323) (7,733)
Transfer of expired equity instruments 1,023 6,609
Balance 30 June 30,909 34,392
Nature and purpose of reserves
Foreign currency translation reserve
The foreign currency translation reserve is used to record exchange differences arising from the translation of the financial statements of foreign subsidiaries.
Employee equity benefits reserve
The employee equity benefits reserve is used to record the value of share based payments provided to employees, including key management personnel, as part of their remuneration. Refer to Note 25 for further details of these plans.
For
per
sona
l use
onl
y
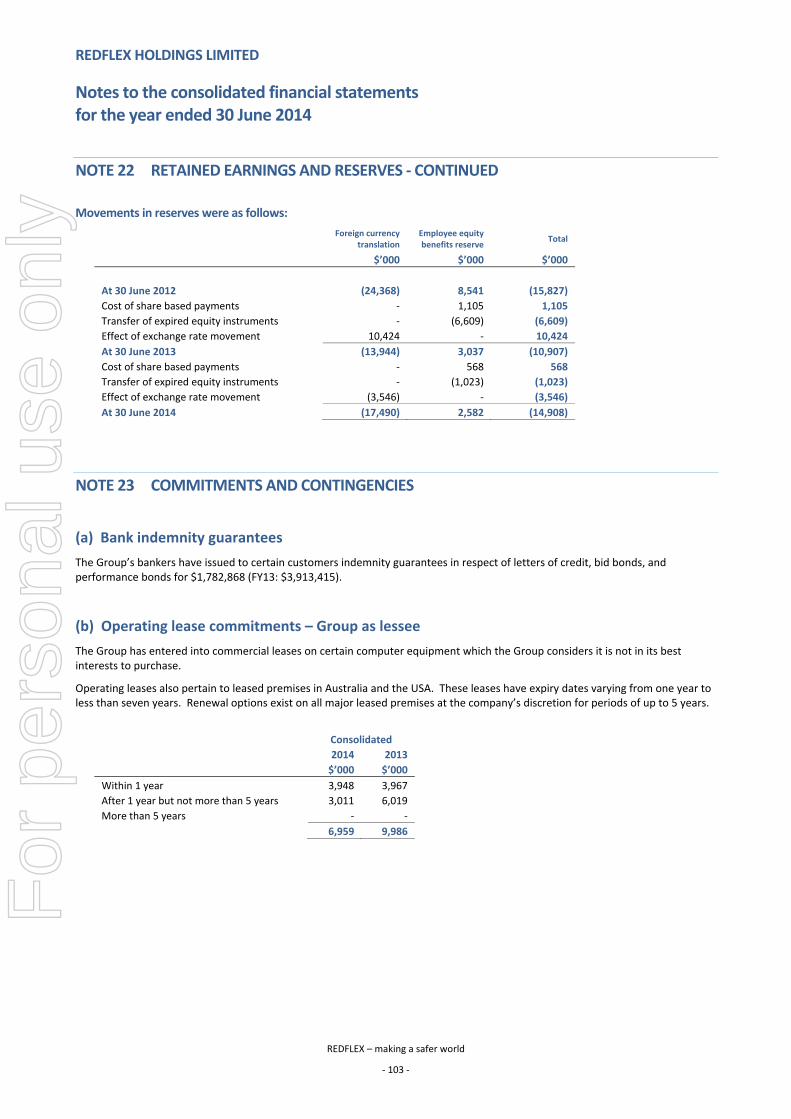
REDFLEX HOLDINGS LIMITED
Notes to the consolidated financial statements for the year ended 30 June 2014
REDFLEX – making a safer world
‐ 103 ‐
NOTE 22 RETAINED EARNINGS AND RESERVES ‐ CONTINUED
Movements in reserves were as follows:
Foreign currency
translation Employee equity benefits reserve
Total
$’000 $’000 $’000
At 30 June 2012 (24,368) 8,541 (15,827)
Cost of share based payments ‐ 1,105 1,105
Transfer of expired equity instruments ‐ (6,609) (6,609)
Effect of exchange rate movement 10,424 ‐ 10,424
At 30 June 2013 (13,944) 3,037 (10,907)
Cost of share based payments ‐ 568 568
Transfer of expired equity instruments ‐ (1,023) (1,023)
Effect of exchange rate movement (3,546) ‐ (3,546)
At 30 June 2014 (17,490) 2,582 (14,908)
NOTE 23 COMMITMENTS AND CONTINGENCIES
(a) Bank indemnity guarantees
The Group’s bankers have issued to certain customers indemnity guarantees in respect of letters of credit, bid bonds, and performance bonds for $1,782,868 (FY13: $3,913,415).
(b) Operating lease commitments – Group as lessee
The Group has entered into commercial leases on certain computer equipment which the Group considers it is not in its best interests to purchase.
Operating leases also pertain to leased premises in Australia and the USA. These leases have expiry dates varying from one year to less than seven years. Renewal options exist on all major leased premises at the company’s discretion for periods of up to 5 years.
Consolidated
2014 2013
$’000 $’000
Within 1 year 3,948 3,967
After 1 year but not more than 5 years 3,011 6,019
More than 5 years ‐ ‐
6,959 9,986
For
per
sona
l use
onl
y

REDFLEX HOLDINGS LIMITED
Notes to the consolidated financial statements for the year ended 30 June 2014
REDFLEX – making a safer world
‐ 104 ‐
NOTE 23 COMMITMENTS AND CONTINGENCIES ‐ CONTINUED
(c) Capital commitments
At 30 June 2014 the Group has commitments of $1,405,681 (30 June 2013: $2,060,135). These commitments principally relate to the installation of camera systems by the North American business. Contracts generally specify that Redflex may install a number of cameras up to a specified limit provided that Redflex and the customer agree on the location and suitability of the proposed installations. Accordingly, the company has obligations to install further camera systems but it is not possible to determine how many will ultimately be installed. The commitments shown, therefore represent only those commitments supported by firm orders that have been placed for installations.
At reporting date, the commitments contracted, but not provided for, are:
2014 2013
$’000 $’000
Within one year 1,406 2,060
After one year but not more than five years ‐ ‐
Longer than five years ‐ ‐
1,406 2,060
For
per
sona
l use
onl
y
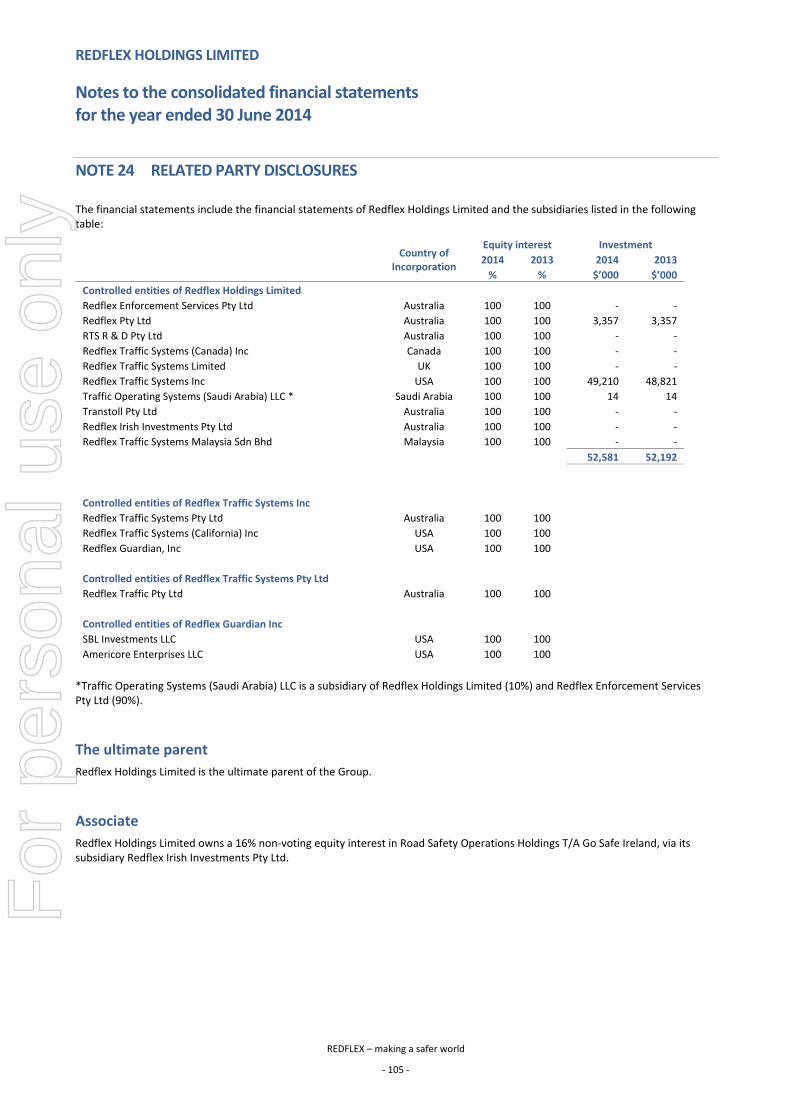
REDFLEX HOLDINGS LIMITED
Notes to the consolidated financial statements for the year ended 30 June 2014
REDFLEX – making a safer world
‐ 105 ‐
NOTE 24 RELATED PARTY DISCLOSURES
The financial statements include the financial statements of Redflex Holdings Limited and the subsidiaries listed in the following table:
Country of
Incorporation
Equity interest Investment
2014 2013 2014 2013
% % $’000 $’000
Controlled entities of Redflex Holdings Limited
Redflex Enforcement Services Pty Ltd Australia 100 100 ‐ ‐
Redflex Pty Ltd Australia 100 100 3,357 3,357
RTS R & D Pty Ltd Australia 100 100 ‐ ‐
Redflex Traffic Systems (Canada) Inc Canada 100 100 ‐ ‐
Redflex Traffic Systems Limited UK 100 100 ‐ ‐
Redflex Traffic Systems Inc USA 100 100 49,210 48,821
Traffic Operating Systems (Saudi Arabia) LLC * Saudi Arabia 100 100 14 14
Transtoll Pty Ltd Australia 100 100 ‐ ‐
Redflex Irish Investments Pty Ltd Australia 100 100 ‐ ‐
Redflex Traffic Systems Malaysia Sdn Bhd Malaysia 100 100 ‐ ‐
52,581 52,192
Controlled entities of Redflex Traffic Systems Inc
Redflex Traffic Systems Pty Ltd Australia 100 100
Redflex Traffic Systems (California) Inc USA 100 100
Redflex Guardian, Inc USA 100 100
Controlled entities of Redflex Traffic Systems Pty Ltd
Redflex Traffic Pty Ltd Australia 100 100
Controlled entities of Redflex Guardian Inc
SBL Investments LLC USA 100 100
Americore Enterprises LLC USA 100 100
*Traffic Operating Systems (Saudi Arabia) LLC is a subsidiary of Redflex Holdings Limited (10%) and Redflex Enforcement Services Pty Ltd (90%).
The ultimate parent
Redflex Holdings Limited is the ultimate parent of the Group.
Associate
Redflex Holdings Limited owns a 16% non‐voting equity interest in Road Safety Operations Holdings T/A Go Safe Ireland, via its subsidiary Redflex Irish Investments Pty Ltd.
For
per
sona
l use
onl
y
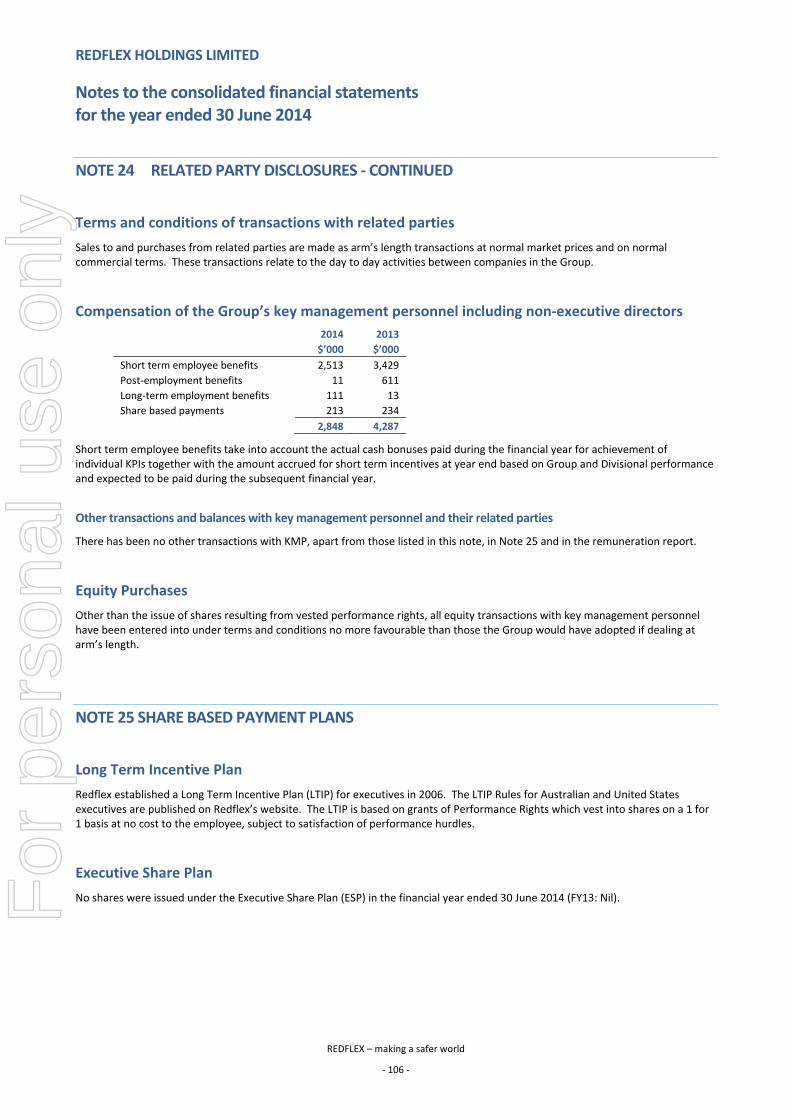
REDFLEX HOLDINGS LIMITED
Notes to the consolidated financial statements for the year ended 30 June 2014
REDFLEX – making a safer world
‐ 106 ‐
NOTE 24 RELATED PARTY DISCLOSURES ‐ CONTINUED
Terms and conditions of transactions with related parties
Sales to and purchases from related parties are made as arm’s length transactions at normal market prices and on normal commercial terms. These transactions relate to the day to day activities between companies in the Group.
Compensation of the Group’s key management personnel including non‐executive directors
2014 2013
$’000 $’000
Short term employee benefits 2,513 3,429
Post‐employment benefits 11 611
Long‐term employment benefits 111 13
Share based payments 213 234
2,848 4,287
Short term employee benefits take into account the actual cash bonuses paid during the financial year for achievement of individual KPIs together with the amount accrued for short term incentives at year end based on Group and Divisional performance and expected to be paid during the subsequent financial year.
Other transactions and balances with key management personnel and their related parties
There has been no other transactions with KMP, apart from those listed in this note, in Note 25 and in the remuneration report.
Equity Purchases
Other than the issue of shares resulting from vested performance rights, all equity transactions with key management personnel have been entered into under terms and conditions no more favourable than those the Group would have adopted if dealing at arm’s length.
NOTE 25 SHARE BASED PAYMENT PLANS
Long Term Incentive Plan
Redflex established a Long Term Incentive Plan (LTIP) for executives in 2006. The LTIP Rules for Australian and United States executives are published on Redflex’s website. The LTIP is based on grants of Performance Rights which vest into shares on a 1 for 1 basis at no cost to the employee, subject to satisfaction of performance hurdles.
Executive Share Plan
No shares were issued under the Executive Share Plan (ESP) in the financial year ended 30 June 2014 (FY13: Nil).
For
per
sona
l use
onl
y
REDFLEX HOLDINGS LIMITED
Notes to the consolidated financial statements for the year ended 30 June 2014
REDFLEX – making a safer world
‐ 107 ‐
NOTE 25 SHARE‐BASED PAYMENT PLANS ‐ CONTINUED
Option Holdings of key management personnel
Under the Employee Option Plan, Redflex may grant non‐transferable options over ordinary shares to executives and certain members of staff. Nil unlisted options were issued under this plan in the financial year ended 30 June 2014 (FY13: 3 million).
On 17 July 2013, Redflex announced to ASX a transition of the leadership of the Redflex Group and that Mr DeVincenzi’s employment contract dated 17 September 2012 was terminated by virtue of an Executive Transition Agreement. The terms of Mr DeVincenzi’s Agreement include that Mr DeVincenzi has waived his entitlement to 129,323 performance rights and 3 million unlisted options that were issued on 10 September 2012 and these were forfeited on 17 July 2013.
Equity‐settled transactions
The fair value of each performance right is estimated on the date of the grant using a Black‐Scholes option formula, with a Monte Carlo simulation to take market conditions into consideration, with the following weighted average assumptions used for grants made during the year. The valuation of the performance rights was performed independently by a suitably qualified external party.
The following table lists the inputs to the model used for the LTIP for the years ended 30 June 2014 and 30 June 2013.
Performance rights formula
Year ended 30 June 2014 18 June 2014
Share price at valuation date $1.00
Expected volatility 42%
Risk‐free interest rate 2.68%
Expected life of performance right 3 years
Dividend yield 4.1%
Year ended 30 June 2013 1 October 2012
Share price at valuation date $2.01
Expected volatility 43%
Risk‐free interest rate 2.42%
Expected life of performance right 3 years
Dividend yield 4.2%
The dividend yield reflects dividends previously paid and the expected life of the right is the period up to vesting. The expected volatility is based on the company’s historical volatility and is designed to be indicative of future trends, which may also not necessarily be the actual outcome.
The weighted average remaining contractual life for the performance rights is generally 3 years (FY13: 3 years).
For
per
sona
l use
onl
y
REDFLEX HOLDINGS LIMITED
Notes to the consolidated financial statements for the year ended 30 June 2014
REDFLEX – making a safer world
‐ 108 ‐
NOTE 25 SHARE‐BASED PAYMENT PLANS ‐ CONTINUED
Equity‐settled transactions ‐ continued
Movements in the year
Performance rights
The following table illustrates the movements in the performance rights during the year ended 30 June.
2014 2013
Number WAEP Number WAEP
Outstanding at the beginning of the year 2,343,047 ‐ 2,769,177 ‐
Granted during the year 1,344,159 ‐ 1,280,649 ‐
Cancelled outgoing CEO arrangements (129,323) ‐ ‐ ‐
Forfeited during the year (197,627) ‐ (971,267) ‐
Vested during the year ‐ ‐ (416,711) ‐
Lapsed during the year (536,164) ‐ (318,801) ‐
Outstanding at the end of the year 2,824,092 ‐ 2,343,047 ‐
Options
The following table illustrates the movements in the options during the year ended 30 June.
2014 2013
No. WAEP No. WAEP
Outstanding at the beginning of the year 3,000,000 ‐ ‐ ‐
Granted during the year ‐ ‐ 3,000,000 ‐
Forfeited during the year (3,000,000) ‐ ‐ ‐
Vested during the year ‐ ‐ ‐ ‐
Lapsed during the year ‐ ‐ ‐ ‐
Outstanding at the end of the year ‐ ‐ 3,000,000 ‐
WAEP: Weighted average exercise price
For
per
sona
l use
onl
y

REDFLEX HOLDINGS LIMITED
Notes to the consolidated financial statements for the year ended 30 June 2014
REDFLEX – making a safer world
‐ 109 ‐
NOTE 26 PARENT ENTITY INFORMATION
Information relating to the parent entity, Redflex Holdings Limited.
2014 2013
$’000 $’000
Current assets 5,618 4,730
Non‐current assets 74,130 78,959
Total assets 79,748 83,689
Current liabilities 1,586 1,593
Non‐current liabilities ‐ ‐
Total liabilities 1,586 1,593
Net assets 78,162 82,096
Contributed equity 101,765 101,765
Accumulated losses (33,817) (29,317)
Reserves 10,214 9,648
Total shareholders’ equity 78,162 82,096
Profit /(loss) of the parent entity (1,178) (420)
Total comprehensive income/(loss) of the parent entity (1,178) (420)
Contingent liabilities
With the exception of matters disclosed in Note 23, Redflex Holdings Ltd does not have any contingent liabilities at 30 June 2014. (2013: Nil)
Contractual Capital Commitments
With the exception of matters disclosed in Note 23, Redflex Holdings Ltd does not have any contingent liabilities at 30 June 2014. (2013: Nil)
Guarantees
As at 30 June 2014 (and 30 June 2013) Redflex Holdings Ltd is a joint party under the Syndicated Financing Facility which is described in Note 17.
Related Party Transactions
Refer to Note 24 for disclosure of transactions between the parent entity and related parties.
For
per
sona
l use
onl
y
REDFLEX HOLDINGS LIMITED
Notes to the consolidated financial statements for the year ended 30 June 2014
REDFLEX – making a safer world
‐ 110 ‐
NOTE 27 EVENTS AFTER BALANCE SHEET DATE
On 25 September 2014 Redflex Holdings Limited announced the appointment of Paul Clark as Group Chief Executive Officer on a one‐year agreement commencing on 25 September 2014. Mr Clark subsequently resigned from his position of Non executive director at this date. The key terms of his contractual arrangements are as follows:‐
Mr Clark is entitled to be paid a salary of $400,000 per annum plus superannuation.
At the conclusion of his first year of service (30 September 2015), Mr Clark will also be entitled to an incentive payment of between 30% and 100% of his salary, depending on his achievement of agreed objectives, within 30 days of 30 September 2015. The incentive will be payable in performance rights (50% of which vest one year after grant and the remaining 50% of which vest two years after grant). If payment of Mr Clark’s incentive in performance rights is not approved by shareholders, then the Company will pay his incentive in cash.
The agreement may be terminated by the CEO with 6 month's prior notice, or by the Company making a payment equivalent to the CEO's remuneration until the expiration of the term. Summary termination is permitted for gross misconduct.
There were no other significant events subsequent to 30 June 2014 and prior to the date of this report, other than the renewal of the financing facility as described in Note 17.
NOTE 28 AUDITOR’S REMUNERATION
2014 2013
$’000 $’000
Amount received or due and receivable by Ernst & Young (Australia) for:
An audit or review of the financial report of the consolidated entity 303 293
Amount received or due and receivable by Ernst & Young (Australia) for other services in relation to the consolidated entity for:
Assurance related matters 25 46
Amount received or due and receivable by related practices of Ernst & Young (Australia) for:
Audits or reviews of subsidiaries * 282 251
610 590
*fees relating to the audit of the North America business are denominated in US dollars. The amount shown is translated at the relevant exchange rate at the reporting date.
For
per
sona
l use
onl
y
REDFLEX HOLDINGS LIMITED Annual Report 2014
DIRECTOR’S DECLARATION
REDFLEX – making a safer world
‐ 111 ‐
In accordance with a resolution of the directors of Redflex Holdings Limited I state that:
1. In the opinion of the directors:
(a) The financial statements and notes of Redflex Holdings Limited for the financial year ended 30 June 2014 are in accordance with the Corporations Act 2001, including:
(i) Giving a true and fair view of its financial position as at 30 June 2014 and of its performance;
(ii) Complying with Accounting Standards (including the Australian Accounting Interpretations) and Corporations Regulations 2001;
(b) The financial statements and notes also comply with International Financial Reporting Standards as disclosed in Note 2.2;
(c) There are reasonable grounds to believe that the Company will be able to pay its debts as and when they become due and payable.
2. This declaration has been made after receiving the declarations required to be made to the directors by the chief financial officer in accordance with section 295A of the Corporations Act 2001 for the financial year ended 30 June 2014.
On behalf of the board
Adam Gray Director
30 September 2014
For
per
sona
l use
onl
y
A member firm of Ernst & Young Global LimitedLiability limited by a scheme approved under Professional Standards Legislation
Independent auditor's report to the members of Redflex HoldingsLimited
Report on the financial report
We have audited the accompanying financial report of Redflex Holdings Limited, which comprisesthe consolidated statement of financial position as at 30 June 2014, the consolidated statement ofcomprehensive income, the consolidated statement of changes in equity and the consolidatedstatement of cash flows for the year then ended, notes comprising a summary of significantaccounting policies and other explanatory information, and the directors' declaration of theconsolidated entity comprising the company and the entities it controlled at the year's end or fromtime to time during the financial year.
Directors' responsibility for the financial report
The directors of the company are responsible for the preparation of the financial report that gives atrue and fair view in accordance with Australian Accounting Standards and the Corporations Act2001 and for such internal controls as the directors determine are necessary to enable thepreparation of the financial report that is free from material misstatement, whether due to fraud orerror. In Note 2, the directors also state, in accordance with Accounting Standard AASB 101Presentation of Financial Statements, that the financial statements comply with InternationalFinancial Reporting Standards.
Auditor's responsibility
Our responsibility is to express an opinion on the financial report based on our audit. We conductedour audit in accordance with Australian Auditing Standards. Those standards require that we complywith relevant ethical requirements relating to audit engagements and plan and perform the audit toobtain reasonable assurance about whether the financial report is free from material misstatement.
An audit involves performing procedures to obtain audit evidence about the amounts anddisclosures in the financial report. The procedures selected depend on the auditor's judgment,including the assessment of the risks of material misstatement of the financial report, whether dueto fraud or error. In making those risk assessments, the auditor considers internal controls relevantto the entity's preparation and fair presentation of the financial report in order to design auditprocedures that are appropriate in the circumstances, but not for the purpose of expressing anopinion on the effectiveness of the entity's internal controls. An audit also includes evaluating theappropriateness of accounting policies used and the reasonableness of accounting estimates madeby the directors, as well as evaluating the overall presentation of the financial report.
We believe that the audit evidence we have obtained is sufficient and appropriate to provide a basisfor our audit opinion.
Independence
In conducting our audit we have complied with the independence requirements of the CorporationsAct 2001. We have given to the directors of the company a written Auditor’s IndependenceDeclaration, a copy of which is included in the directors’ report.
Ernst & Young8 Exhibition StreetMelbourne VIC 3000 AustraliaGPO Box 67 Melbourne VIC 3001
Tel: +61 3 9288 8000Fax: +61 3 8650 7777ey.com/au
For
per
sona
l use
onl
y
A member firm of Ernst & Young Global LimitedLiability limited by a scheme approved under Professional Standards Legislation
Opinion
In our opinion:
a. the financial report of Redflex Holdings Limited is in accordance with the Corporations Act2001, including:
i giving a true and fair view of the consolidated entity's financial position as at 30 June2014 and of its performance for the year ended on that date; and
ii complying with Australian Accounting Standards and the Corporations Regulations2001; and
b. the financial report also complies with International Financial Reporting Standards asdisclosed in Note 2.
Report on the remuneration report
We have audited the Remuneration Report included in the directors' report for the year ended 30June 2014. The directors of the company are responsible for the preparation and presentation ofthe Remuneration Report in accordance with section 300A of the Corporations Act 2001. Ourresponsibility is to express an opinion on the Remuneration Report, based on our audit conducted inaccordance with Australian Auditing Standards.
Opinion
In our opinion, the Remuneration Report of Redflex Holdings Limited for the year ended 30 June2014, complies with section 300A of the Corporations Act 2001.
Ernst & Young
Ashley ButlerPartnerMelbourne30 September 2014
For
per
sona
l use
onl
y
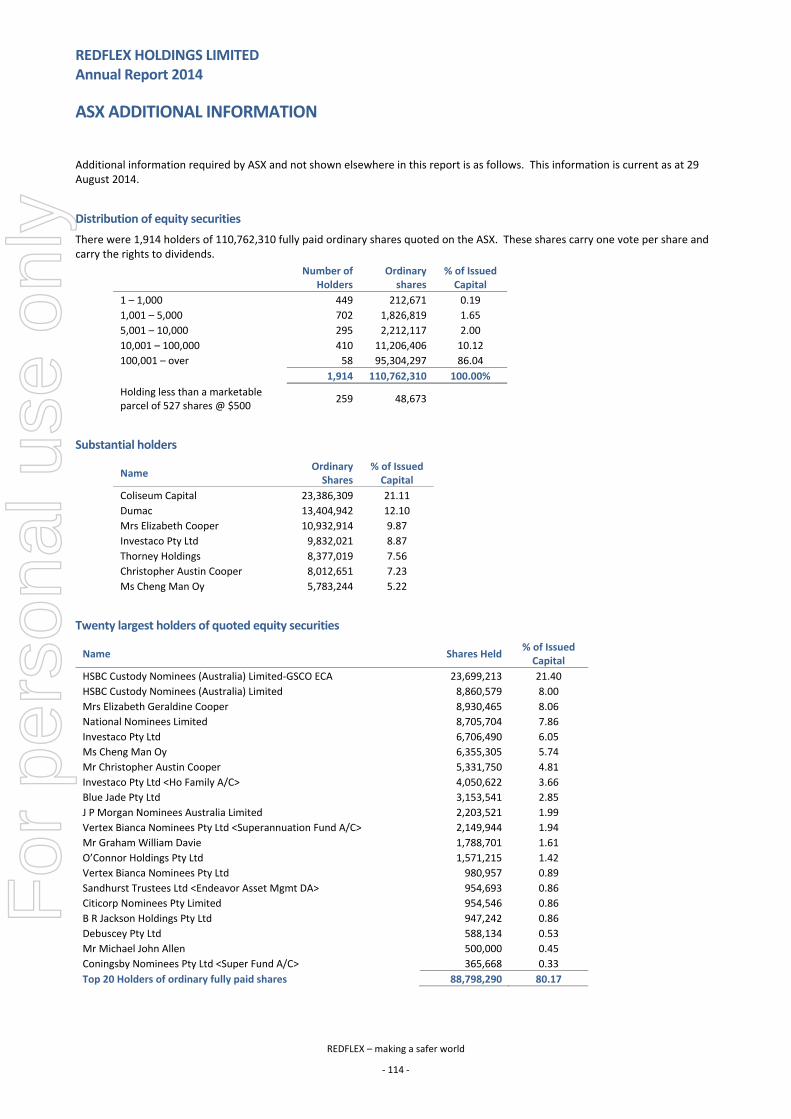
REDFLEX HOLDINGS LIMITED Annual Report 2014
ASX ADDITIONAL INFORMATION
REDFLEX – making a safer world
‐ 114 ‐
Additional information required by ASX and not shown elsewhere in this report is as follows. This information is current as at 29 August 2014.
Distribution of equity securities
There were 1,914 holders of 110,762,310 fully paid ordinary shares quoted on the ASX. These shares carry one vote per share and carry the rights to dividends.
Number of
Holders Ordinary shares
% of Issued Capital
1 – 1,000 449 212,671 0.19
1,001 – 5,000 702 1,826,819 1.65
5,001 – 10,000 295 2,212,117 2.00
10,001 – 100,000 410 11,206,406 10.12
100,001 – over 58 95,304,297 86.04
1,914 110,762,310 100.00%
Holding less than a marketable parcel of 527 shares @ $500
259 48,673
Substantial holders
Name Ordinary Shares
% of Issued Capital
Coliseum Capital 23,386,309 21.11
Dumac 13,404,942 12.10
Mrs Elizabeth Cooper 10,932,914 9.87
Investaco Pty Ltd 9,832,021 8.87
Thorney Holdings 8,377,019 7.56
Christopher Austin Cooper 8,012,651 7.23
Ms Cheng Man Oy 5,783,244 5.22
Twenty largest holders of quoted equity securities
Name Shares Held % of Issued Capital
HSBC Custody Nominees (Australia) Limited‐GSCO ECA 23,699,213 21.40
HSBC Custody Nominees (Australia) Limited 8,860,579 8.00
Mrs Elizabeth Geraldine Cooper 8,930,465 8.06
National Nominees Limited 8,705,704 7.86
Investaco Pty Ltd 6,706,490 6.05
Ms Cheng Man Oy 6,355,305 5.74
Mr Christopher Austin Cooper 5,331,750 4.81
Investaco Pty Ltd <Ho Family A/C> 4,050,622 3.66
Blue Jade Pty Ltd 3,153,541 2.85
J P Morgan Nominees Australia Limited 2,203,521 1.99
Vertex Bianca Nominees Pty Ltd <Superannuation Fund A/C> 2,149,944 1.94
Mr Graham William Davie 1,788,701 1.61
O’Connor Holdings Pty Ltd 1,571,215 1.42
Vertex Bianca Nominees Pty Ltd 980,957 0.89
Sandhurst Trustees Ltd <Endeavor Asset Mgmt DA> 954,693 0.86
Citicorp Nominees Pty Limited 954,546 0.86
B R Jackson Holdings Pty Ltd 947,242 0.86
Debuscey Pty Ltd 588,134 0.53
Mr Michael John Allen 500,000 0.45
Coningsby Nominees Pty Ltd <Super Fund A/C> 365,668 0.33
Top 20 Holders of ordinary fully paid shares 88,798,290 80.17
For
per
sona
l use
onl
y