abc appreciation survey may 2015 summary...
TRANSCRIPT

May 2015
ABC Appreciation Survey –
Summary Report

2
Table of contents
1. Executive Summary 3
2. Background and objectives 5
3. Methodology 6
4. Research findings 9
4.1 Overall value of the ABC 9
4.2 Television 12
4.3 Radio 20
4.4 Online 29
4.5 Coverage of country news and information 35
4.6 Other specific charter obligations 37
4.7 News and current affairs - being balanced and even handed 40

Background The objective of the Appreciation Survey is to provide an overview of community attitudes and opinions about the ABC - as distinct from the detailed behavioural information provided by television, radio and online ratings. The most recent wave was fielded nationally by telephone in May 2015, among 1,913 people aged 14 years and over. Overview As found in all previous waves of the survey, a large majority of Australians believe the ABC performs a valuable role (84 percent). A large majority also continue to believe it provides quality content, and that it is doing a good job satisfying its charter obligations. Although over several years there’s been a very gradual, small loss in the number of Australians who believe the ABC and its services are valuable, the 2015 waves finds no further change. Overall attitudes to ABC TV and ABC Radio have been relatively consistent over the last four or five waves. In contrast, while 2008-2011 saw a large increase in positive perceptions about commercial TV, they have been gradually declining since 2011, and have declined a little further this year. Although the attitudes of people aged 50+ remain more positive about ABC TV and ABC Radio than their commercial equivalents, the gap has generally been narrower in the last four or five waves. However at least for ABC TV, the gap has widened a little in 2015 due to a drop in positive perceptions about commercial TV.
3
1. Executive summary Overall value of the ABC Eighty four percent of Australians believe the ABC provides a valuable service to the community, and close to half believe it provides a very valuable service. Overall community sentiment is consistent with last year, following a pattern of subtle decline since 2006. Television Most Australians (78 percent) remain of the view that ABC TV provides quality programming, and two-thirds feel it does a 'good job' in terms of the number of shows it provides they personally like to watch. For commercial TV, the 2015 survey finds a continued gradual decline in community sentiment about the quality and quantity of content it provides. This trend has been evident since 2011. Australians continue to have a more favourable view about ABC TV than commercial TV. Overall attitudes about ABC TV have been relatively consistent over the last four waves following a period of gradual decline in positive sentiment towards it (more particularly in relation to the amount of appealing content it provides rather than the quality of its content). Nonetheless as noted in last year’s report, recent years have seen a shift in attitudes among people aged 50+. Between 2011 and 2014 although this group remained far more positive about ABC TV than commercial TV, the gap had narrowed quite substantially. The gap has widened a little this year with a drop in sentiment about commercial TV, however it remains well below pre-2010 levels.

4
1. Executive summary (cont’d) Similar patterns have been evident among people aged 35 to 49, but the narrowing of the gap has been far less pronounced than for people aged 50+. Radio Sixty two percent of Australian adults believe the ABC provides good quality radio programming (only 13 percent feel it is poor), and 57 percent believe ABC Radio does a 'good job' in terms of the amount of programming it provides that they personally 'like to listen to' (only 17 percent feel ABC Radio does a poor job). Attitudes concerning ABC Radio have been fairly consistent over the last few waves. However, since 2012 there’s been a small increase in the number of people who feel ABC Radio provides poor quality content. Reflecting patterns in TV, among people aged 50+ the last four waves have seen a narrower gap in perceptions between ABC Radio and commercial radio than was previously the case. On the other hand, among people aged 25 to 34, the last three waves have seen a greater positive gap in relation to the perceived quality of ABC radio content vs. commercial radio content. Online Forty percent of Australians claim to ever use the ABC website or online services, even if only occasionally, and 22 percent say they do so at least once a week. Users of the website and online services are largely sourced from people who are also heavy or medium users of either ABC TV or ABC Radio. The vast majority of users (around 90 percent) feel ABC the website and online provide quality content, and do a 'good job' in terms of the amount of relevant content they provide.
Coverage of country news and information Community perceptions about coverage of country news and information remain far more favourable for the ABC than for commercial media - both among people in capital cities and people in country/ regional areas. Eighty percent of Australians believe the ABC does a 'good job' covering country/regional issues compared with 42 percent for commercial media (down from 46 percent last year). Other specific charter obligations The majority of Australians remain of the view that the ABC is doing 'a good job' in meeting its various other charter obligations, and results this year are generally very consistent with last year’s. The only significant change is a small rise (after a dip last year) in the number of Australians who believe the ABC does a very good job of being balanced and even handed when reporting news and current affairs. Yet at the same time, compared with two years ago, there has also been a small increase in the number who feel the ABC does a poor job on this issue. Over the same two year period, there has a small increase in the number of Australians who believe the ABC does a poor job:
• broadcasting programs that are different from commercial television or radio;
• being distinctively Australian; and,
• broadcasting programs that reflect Australian cultural diversity.

5
2. Background and objectives This report presents findings from the 2015 ABC Appreciation Survey, which follows similar studies conducted in 1998, 1999, and annually from 2002 to 2014. The objective of the research is to provide an overview of community attitudes about the ABC - as distinct from the detailed behavioural information provided by television, radio and online ratings. Specifically, the research explored community attitudes and perceptions about:
• the overall value of the ABC and its services to the Australian community;
• the quality of programming on ABC Television and Radio;
• the extent to which ABC Television and Radio offer programming people like to watch, or listen to;
• usage of, and attitudes towards the ABC website and online services;
• the ABC’s coverage of country news and information;
• the extent to which the ABC fulfils various other charter obligations;
• the even-handedness of ABC news and current affairs reporting. As a point of comparison, and to assist interpretation of results, attitudes and perceptions were also measured in relation to commercial media on a number of dimensions. TV viewing and radio listening were also collected for cross-analysis purposes.

6
3. Methodology The research was conducted nationally, by telephone, among 1,913 respondents aged 14 years and over. Fieldwork was conducted over the period May 22-31, 2015, by fully trained and personally briefed interviewers. Respondents were selected by a stratified random sample process which included:
– a quota being set for each capital city and non-capital city area, and within each of these areas, a quota being set for groups of ABS Level 4 Statistical Areas;
– random selection of household telephone numbers
– random selection of an individual in each household.
To ensure the sample included those people who tend to spend more time away from home, a system of call backs and appointments was incorporated. Results were post-weighted to ABS data on age, highest level of schooling completed, sex and area. Heavy, Medium and Light/non-users of ABC services In order to explore attitudes according to people’s usage of ABC services, the sample was segmented into heavy, medium and light/non ABC users. The segments were constructed based on respondent’s own assessment of how much time they spend watching ABC TV, or listening to ABC Radio (i) on an average weekday and (ii) on an average weekend day. Although in absolute terms these self-assessments may not be particularly accurate, they are adequate for the purposes of a broad segmentation. The following definitions were used:
People who report that they do not spend any time watching/ listening to ABC TV/Radio on an average day, may still watch/ listen periodically. Consequently those who claim to watch “0” hours have been categorised as ‘Light/non’ users. A segmentation based on a combination of ABC TV and Radio usage was subsequently derived as follows:
% Heavy either heavy viewer of ABC TV or heavy listener of ABC Radio 41
Medium medium ABC TV or ABC Radio user, but not heavy user of either 40
Light/non viewers / listeners not heavy or medium user of either ABC TV or Radio 20
Amount of time ABC TV ABC Radio spent viewing/ viewing segments listening segments listening % of 14+ population % of 14+ population
Heavy 6+ hours a week 32 21
Medium <6 hours a week 42 28
Light/non 0 hours a week 26 51

7
3. Methodology A final segmentation incorporating ABC TV, Radio and the ABC website/ online services was derived as follows:
% Heavy heavy ABC TV/ Radio user or use ABC website/ online 43 4-6 days a week or more often
Medium medium ABC TV/ Radio user or use ABC website/ online 1-3 days 38 a week but not heavy user of any
Light/non not heavy or medium user users of ABC TV/ Radio or website/ online 18
Changes to question wording Over the years the ways in which people may consume ABC TV or ABC Radio content have expanded to include online and mobile platforms, and the number of ABC TV channels has also grown. Consequently from 2013, the questions concerning usage of ABC TV and ABC Radio have included expanded descriptions as follows:
Now a question about ABC television. These days the ABC has a number of different TV channels, and you can watch them on your TV, or you can watch them online. Now a question about listening to ABC radio stations - which could include listening to them on a radio, a computer, tablet or mobile phone.
In 2015, questions concerning the ABC website were also expended to include ‘online services’. Statistical significance testing Throughout the report, where relevant, statistically significant changes have been noted. All significance tests have been based on the 95 percent level of confidence. This means that if a change is noted as being statistically significant, there is a 95 percent probability that a real change has occurred, and is not simply due to chance variation between waves.

8
4. Research findings

9
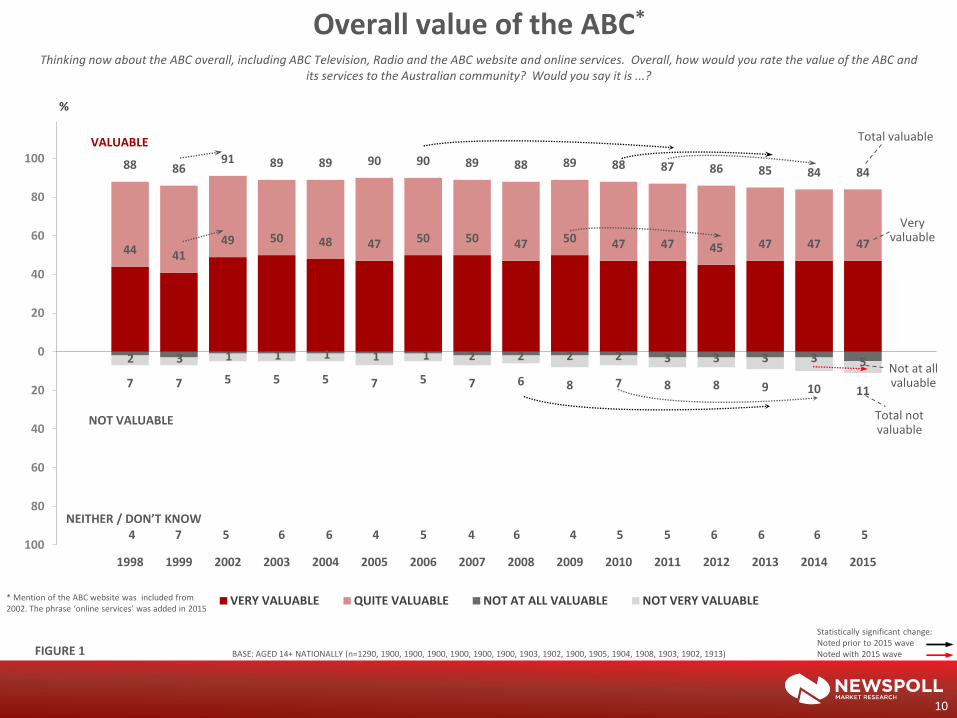
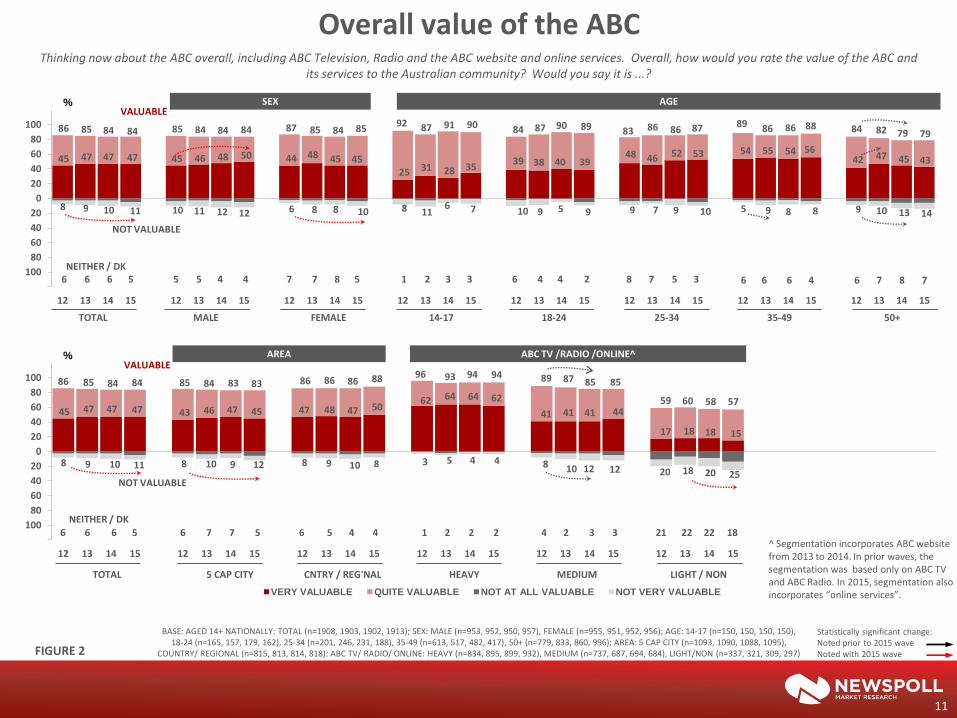
4. Research findings 4.1 Overall value of the ABC A large majority (84 percent) of Australians continue to believe the ABC provides a 'valuable' service to the community, and close to half regard it as being a very valuable service (Figure 1).1 Overall community sentiment is very consistent with last year, following a pattern of very subtle decline since about 2006. However the 2015 does find a very small increase (from 3 to 5 percent) in the number of Australians who feel the ABC and its services are ‘not at all valuable’. A generally positive view about the value of the ABC continues to be shared by men and women, all age groups and both capital city and country / regional residents. Also consistent with previous surveys, belief in the value of the ABC is correlated with usage of ABC services. For example:
• among heavy ABC Television / Radio/ online users, 94 percent believe the ABC and its services are 'valuable', (including 62 percent who think it is 'very’ valuable);
• while 57 percent of light/non-users believe it is 'valuable' (including 15 percent 'very’ valuable).
Related to this, a belief that the ABC is very valuable tends to increase with age, though drops off among those aged 50+ (Figure 2).
1. In 2002-2015, the survey was conducted in May/ June, but the 1998 and 1999 surveys were conducted in December. Moreover unlike the 1998 and 1999 surveys, in the 2002-2014 waves, the 'value' question included reference to the ABC website, and in 2015 reference to the website and online services. It is unknown if these differences in timing or question wording had any impact on results.
Last year’s report noted that the small drop in positive sentiment about the ABC between 2011 and 2014 had been primarily driven by less positive attitudes among people aged 50+. The current survey finds no further drop among this age group. However compared with a few years ago, negative sentiment about the value of the ABC is a little higher among women and also Light/ Non users of ABC services. Conversely more males now rate the ABC and its services as being very valuable compared with 2012.
44 41 49 50 48 47 50 50 47 50 47 47 45 47 47 47
88 86 91 89 89 90 90 89 88 89 88 87 86 85 84 84
2 3 1 1 1 1 1 2 2 2 2 3 3 3 3 5
7 7 5 5 5 7 5 7 6 8 7 8 8 9 10 11
100
80
60
40
20
0
20
40
60
80
100
1998 1999 2002 2003 2004 2005 2006 2007 2008 2009 2010 2011 2012 2013 2014 2015
%
VERY VALUABLE QUITE VALUABLE NOT AT ALL VALUABLE NOT VERY VALUABLE
FIGURE 1 BASE: AGED 14+ NATIONALLY (n=1290, 1900, 1900, 1900, 1900, 1900, 1900, 1903, 1902, 1900, 1905, 1904, 1908, 1903, 1902, 1913)
Overall value of the ABC* Thinking now about the ABC overall, including ABC Television, Radio and the ABC website and online services. Overall, how would you rate the value of the ABC and
its services to the Australian community? Would you say it is ...?
NEITHER / DON’T KNOW 4 7 5 6 6 4 5 4 6 4 5 5 6 6 6 5
NOT VALUABLE
VALUABLE
* Mention of the ABC website was included from 2002. The phrase ‘online services’ was added in 2015
Total valuable
Very valuable
Total not valuable
Not at all valuable
10
Statistically significant change: Noted prior to 2015 wave Noted with 2015 wave
45 47 47 47 43 46 47 45 47 48 47 50 62 64 64 62
41 41 41 44
17 18 18 15
86 85 84 84 85 84 83 83 86 86 86 88 96 93 94 94 89 87 85 85
59 60 58 57
8 9 10 11 8 10 9 12 8 9 10 8 3 5 4 4 8 10 12 12 20 18 20 25
120
100
80
60
40
20
0
20
40
60
80
100
12 13 14 15 12 13 14 15 12 13 14 15 12 13 14 15 12 13 14 15 12 13 14 15
%
VERY VALUABLE QUITE VALUABLE NOT AT ALL VALUABLE NOT VERY VALUABLE
BASE: AGED 14+ NATIONALLY: TOTAL (n=1908, 1903, 1902, 1913); SEX: MALE (n=953, 952, 950, 957), FEMALE (n=955, 951, 952, 956); AGE: 14-17 (n=150, 150, 150, 150), 18-24 (n=165, 157, 179, 162), 25-34 (n=201, 246, 231, 188), 35-49 (n=613, 517, 482, 417), 50+ (n=779, 833, 860, 996); AREA: 5 CAP CITY (n=1093, 1090, 1088, 1095),
COUNTRY/ REGIONAL (n=815, 813, 814, 818): ABC TV/ RADIO/ ONLINE: HEAVY (n=834, 895, 899, 932), MEDIUM (n=737, 687, 694, 684), LIGHT/NON (n=337, 321, 309, 297)
Thinking now about the ABC overall, including ABC Television, Radio and the ABC website and online services. Overall, how would you rate the value of the ABC and its services to the Australian community? Would you say it is ...?
45 47 47 47 45 46 48 50 44 48 45 45 25 31 28 35
39 38 40 39 48 46 52 53 54 55 54 56
42 47 45 43
86 85 84 84 85 84 84 84 87 85 84 85 92 87 91 90 84 87 90 89 83 86 86 87 89 86 86 88 84 82 79 79
8 9 10 11 10 11 12 12 6 8 8 10 8 11 6 7 10 9 5 9 9 7 9 10 5 9 8 8 9 10 13 14
120
100
80
60
40
20
0
20
40
60
80
100
12 13 14 15 12 13 14 15 12 13 14 15 12 13 14 15 12 13 14 15 12 13 14 15 12 13 14 15 12 13 14 15
%
TOTAL MALE FEMALE 14-17 18-24 25-34 35-49 50+
TOTAL 5 CAP CITY CNTRY / REG'NAL HEAVY MEDIUM LIGHT / NON
6 6 6 5
AGE
NOT VALUABLE
VALUABLE
NOT VALUABLE
VALUABLE
SEX
ABC TV /RADIO /ONLINE^ AREA
5 5 4 4 7 7 8 5 1 2 3 3 6 4 4 2 8 7 5 3 6 7 8 7 6 6 6 4
6 6 6 5 6 7 7 5 6 5 4 4 1 2 2 2 4 2 3 3
NEITHER / DK
NEITHER / DK 21 22 22 18
Overall value of the ABC
11
FIGURE 2
^ Segmentation incorporates ABC website from 2013 to 2014. In prior waves, the segmentation was based only on ABC TV and ABC Radio. In 2015, segmentation also incorporates “online services”.
Statistically significant change: Noted prior to 2015 wave Noted with 2015 wave

12
4.2 Television
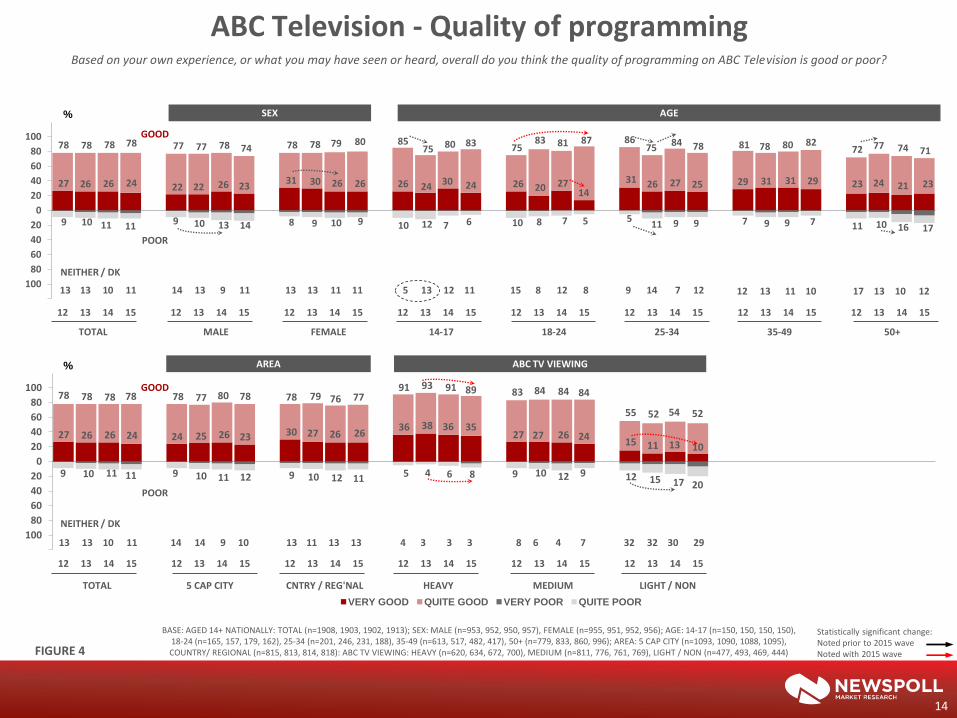
4.2.1 Quality of programming A large majority of Australians (78 percent) believe the quality of programming on ABC Television is 'very' or 'quite good'. Following a small decline in positive sentiment between 2009 and 20121, perceptions have remained fairly consistent in the four most recent waves. However sentiment about the quality of commercial TV has dropped a little compared with two years ago, and currently 40 percent of adults describe the quality of commercial TV as 'good', compared with 44 percent in 2013, and 51 percent at its peak level in 2011. Conversely, 52 percent describe the quality as ‘poor’. Consequently overall, there continues to be a far stronger association of 'quality' content with ABC TV rather than commercial TV. Analysis among demographic segments shows the drop in positive sentiment for commercial TV over the past two years is evident (even if it is not always statistically significant) among both men and women, people who live in capital city and country/ regional areas, and those aged 18 to 24, 25 to 34 and 50+. For ABC TV:
• Among Heavy ABC TV viewers, perceptions about the quality of ABC TV are a little less positive compared with two years ago.
• Among people aged 18 to 24, the overall level of positive sentiment is higher than a few years ago, but the number who describe the quality as being very good has dropped in the past 12 months.
1.The 2009 to 2012 decrease in positive sentiment about the quality of ABC TV was not reflected in
a commensurate increase in negative sentiment, but rather an increase in those who did not have a view about ABC TV.

20 18 20 23 20 22 23 24 24 25 26 27 27 26 26 24
4 5 5 5 6 7 6 6 6 6 9 8 9 7 6 6
75 75 78 79 77 80 80 81 82 82 81 79 78 78 78 78
41 40 43 41 40
38 39 37 37 42 44
51 49 44 43
40
2 3 2 2 1 2 2 2 3 2 2 2 1 2 3 4
19 24
18 18 21 21 19 21 22 18 17 14 16 17 20 19 12 11 9 8 9 10 7 9 9 10 10 9 9 10 11 11
53 54 50 51 53 56 54 57 58
52 49 42 45 48
52 52
100
80
60
40
20
0
20
40
60
80
100
1998 1999 2002 2003 2004 2005 2006 2007 2008 2009 2010 2011 2012 2013 2014 2015 1998 1999 2002 2003 2004 2005 2006 2007 2008 2009 2010 2011 2012 2013 2014 2015
%
VERY GOOD QUITE GOOD VERY POOR QUITE POOR
NEITHER / DON’T KNOW
Television - Quality of programming
POOR
GOOD
Based on your own experience, or what you may have seen or heard, overall do you think the quality of programming on... (TYPE) is good or poor?
13 14 13 13 14 9 12 10 9 8 9 12 13 13 10 11 7 6 7 8 7 6 7 7 5 6 7 7 6 8 5 8
ABC TV COMMERCIAL TV
BASE: AGED 14+ NATIONALLY: TOTAL (n=1290, 1900, 1900, 1900, 1900, 1900, 1900, 1903, 1902, 1900, 1905, 1904, 1908, 1903, 1902, 1913)
Total good
Very good
Total poor
Very poor
13
FIGURE 3
Statistically significant change: Noted prior to 2015 wave Noted with 2015 wave
27 26 26 24 24 25 26 23 30 27 26 26 36 38 36 35
27 27 26 24 15 11 13 10
78 78 78 78 78 77 80 78 78 79 76 77 91 93 91 89 83 84 84 84
55 52 54 52
9 10 11 11 9 10 11 12 9 10 12 11 5 4 6 8 9 10 12 9 12 15 17 20
120
100
80
60
40
20
0
20
40
60
80
100
12 13 14 15 12 13 14 15 12 13 14 15 12 13 14 15 12 13 14 15 12 13 14 15
%
VERY GOOD QUITE GOOD VERY POOR QUITE POOR
TOTAL 5 CAP CITY CNTRY / REG'NAL HEAVY MEDIUM LIGHT / NON
27 26 26 24 22 22 26 23 31 30 26 26 26 24 30 24 26 20 27
14 31 26 27 25 29 31 31 29 23 24 21 23
78 78 78 78 77 77 78 74 78 78 79 80 85 75 80 83 75
83 81 87 86 75
84 78 81 78 80 82 72 77 74 71
9 10 11 11 9 10 13 14 8 9 10 9 10 12 7 6 10 8 7 5 5 11 9 9 7 9 9 7 11 10 16 17
120
100
80
60
40
20
0
20
40
60
80
100
12 13 14 15 12 13 14 15 12 13 14 15 12 13 14 15 12 13 14 15 12 13 14 15 12 13 14 15 12 13 14 15
%
TOTAL MALE FEMALE 14-17 18-24 25-34 35-49 50+
ABC Television - Quality of programming Based on your own experience, or what you may have seen or heard, overall do you think the quality of programming on ABC Television is good or poor?
POOR
GOOD
POOR
GOOD
13 13 10 11 14 13 9 11 13 13 11 11 5 13 12 11 15 8 12 8 9 14 7 12 17 13 10 12 12 13 11 10
13 13 10 11 14 14 9 10 13 11 13 13 4 3 3 3 8 6 4 7 32 32 30 29
AGE SEX
ABC TV VIEWING AREA
NEITHER / DK
NEITHER / DK
BASE: AGED 14+ NATIONALLY: TOTAL (n=1908, 1903, 1902, 1913); SEX: MALE (n=953, 952, 950, 957), FEMALE (n=955, 951, 952, 956); AGE: 14-17 (n=150, 150, 150, 150), 18-24 (n=165, 157, 179, 162), 25-34 (n=201, 246, 231, 188), 35-49 (n=613, 517, 482, 417), 50+ (n=779, 833, 860, 996); AREA: 5 CAP CITY (n=1093, 1090, 1088, 1095), COUNTRY/ REGIONAL (n=815, 813, 814, 818): ABC TV VIEWING: HEAVY (n=620, 634, 672, 700), MEDIUM (n=811, 776, 761, 769), LIGHT / NON (n=477, 493, 469, 444) FIGURE 4
14
Statistically significant change: Noted prior to 2015 wave Noted with 2015 wave

9 7 6 6 9 7 5 7 10 7 7 6 5 5 3 3 8 6 5 7 16 10 10 11
49 44 43 40 49 44 45 42 49 44 41 37 34 33
26 24
50 43 44 44
64 57 63 56
16 17 20 19 16 16 18 19 17 20 22 20 24 25 27 25 15 17 18 17 11 11 12 15
45 48 52 52 46 47 51 51 44
50 53 54 60 58
69 68
44 51 51 49
30 34 31 36
120
100
80
60
40
20
0
20
40
60
80
100
12 13 14 15 12 13 14 15 12 13 14 15 12 13 14 15 12 13 14 15 12 13 14 15
%
VERY GOOD QUITE GOOD VERY POOR QUITE POOR
TOTAL 5 CAP CITY CNTRY / REG'NAL HEAVY MEDIUM LIGHT / NON
9 7 6 6 9 5 4 6 10 8 7 7 10 6 10 11 19 7 6 7 12 10 10 7 9 8 6 8 5 5 3 4
49 44 43 40 46 41 42 37
52 47 45 43
73 74 68 77
68 61 55 58 62 58 56
42 50 44 45 44
33 28 29 26
16 17 20 19 20 19 20 22
13 16 19 16 3 4 3 1
9 1
11 8 8 6 14 18 15 18 17 17
26 29 28 27 45 48 52 52 49 51 54 56
41 45 50 49
24 20 18 19 29 29
40 35 33 33 40 52
45 49 51 49 59 65 66 64
120
100
80
60
40
20
0
20
40
60
80
100
12 13 14 15 12 13 14 15 12 13 14 15 12 13 14 15 12 13 14 15 12 13 14 15 12 13 14 15 12 13 14 15
%
TOTAL MALE FEMALE 14-17 18-24 25-34 35-49 50+
Commercial Television - Quality of programming Based on your own experience, or what you may have seen or heard, overall do you think the quality of programming on commercial television is good or poor?
POOR
GOOD
POOR
GOOD
NEITHER / DK 6 8 5 8 6 8 5 7 6 8 6 8 3 6 14 4 4 10 6 7 5 9 5 6 8 7 5 10 5 6 4 6
6 8 5 8 5 8 5 7 7 6 6 9 6 9 5 8 6 5 5 8 6 9 6 8 NEITHER / DK
AGE SEX
ABC TV VIEWING AREA
FIGURE 5
15
Statistically significant change: Noted prior to 2015 wave Noted with 2015 wave
BASE: AGED 14+ NATIONALLY: TOTAL (n=1908, 1903, 1902, 1913); SEX: MALE (n=953, 952, 950, 957), FEMALE (n=955, 951, 952, 956); AGE: 14-17 (n=150, 150, 150, 150), 18-24 (n=165, 157, 179, 162), 25-34 (n=201, 246, 231, 188), 35-49 (n=613, 517, 482, 417), 50+ (n=779, 833, 860, 996); AREA: 5 CAP CITY (n=1093, 1090, 1088, 1095), COUNTRY/ REGIONAL (n=815, 813, 814, 818): ABC TV VIEWING: HEAVY (n=620, 634, 672, 700), MEDIUM (n=811, 776, 761, 769), LIGHT / NON (n=477, 493, 469, 444)

16
4.2 Television (cont’d)
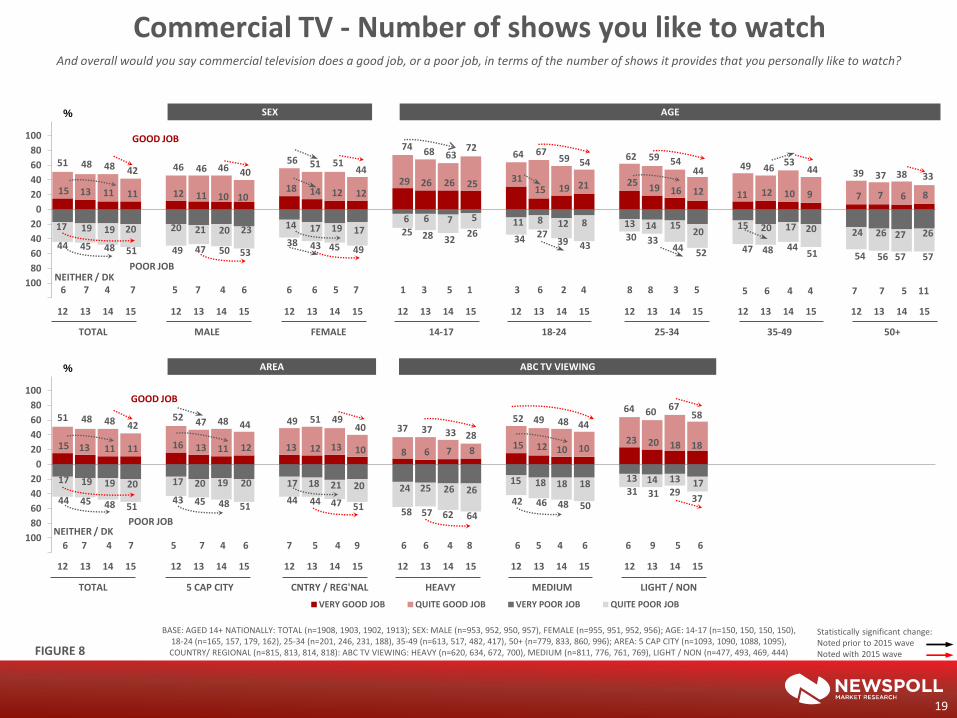
4.2.2 The number of shows people like to watch In terms of the number of shows they personally like to watch, two-thirds of Australians believe ABC TV does a 'good job', compared with 42 percent for commercial TV1 (Figure 6). Reflecting patterns in perceptions about quality, the level of positive sentiment about the volume of appealing content on commercial TV has generally been trending down since 2011, and this year sees a further decease from 48 percent to 42 percent. The number who feel commercial TV does a poor job is now 51 percent. This means attitudes about commercial TV are now almost back to the same level they were at their lowest point in 2007. Even if it is not always statistically significant, there is evidence of a drop in positive sentiment over the last 12 months in every segment apart from people aged 14 to 17. For ABC TV, overall public sentiment has been quite consistent over the last four waves, following a period of gradual decline in the level of positive sentiment between 2005 and 2012. Looking at attitudes towards ABC TV amongst demographic segments:
• During 2011-2015 the number of people aged 50+ who felt ABC TV does a ‘good’ job at providing shows they like to watch has levelled off at around 70 percent after a decline from figures historically closer to 80 percent. Although sentiment among people aged 50+ is far more positive for ABC TV than commercial TV, the gap had been narrowing since about 2008. However it has widened again this year with the drop in positive attitudes towards commercial TV.
• Similarly, the gap in sentiment had also been narrowing among 35 to 49 year olds, however it has widened again this year.
1. This finding is perhaps surprising given audience ratings for ABC TV vs commercial TV. However we believe respondents answer this question relative to their expectations, and the role they have for ABC Television and commercial television in their lives. For example, a person may mainly use the ABC for news or current affairs, and believe it delivers. In their mind, the ABC provides quality content, and does a good job at providing the number of shows they like to watch. The same person may turn to commercial television for light entertainment - and in fact they spend more time watching light entertainment than anything else. But they may complain 'there’s nothing worth watching', and so, the commercial networks fall short of their expectations.

0
18 19 19 21 21 23 24 25 22 24 22 24
21 22 24 22
9 8 10 12 9 12 10 12 10
15 17 15 15 13 11 11
0
70 69 71 71 69 74 72 70 70 70 68 67 65 65 67 66
48 46 51
47 46 47 47 42 44
48 51 55
51 48 48 42
5 4 3 3 4 5 4 5 6 5 6 6 5 6 5 5
17 20 16 17
21 20 19 23 23
18 18 15 17 19 19 20
17 17 16 16 18 16 15 19 20 21 22 21 22 23 22 22
47 48 43 46 48 49 47
54 52 48 44 41 44 45 48
51
100
80
60
40
20
0
20
40
60
80
100
0 1998 1999 2002 2003 2004 2005 2006 2007 2008 2009 2010 2011 2012 2013 2014 2015 1998 1999 2002 2003 2004 2005 2006 2007 2008 2009 2010 2011 2012 2013 2014 2015
%
VERY GOOD JOB QUITE GOOD JOB VERY POOR JOB QUITE POOR JOB
Television - Number of shows you like to watch And overall would you say ... (TYPE) does a good job, or a poor job, in terms of the number of shows it provides that you personally like to watch?
13 14 13 14 13 11 12 11 10 9 10 12 13 13 11 11 5 6 6 6 6 4 5 5 4 4 5 5 6 7 4 7
ABC TV COMMERCIAL TV
GOOD JOB
POOR JOB
Total good
Total poor
BASE: AGED 14+ NATIONALLY: TOTAL (n=1290, 1900, 1900, 1900, 1900, 1900, 1900, 1903, 1902, 1900, 1905, 1904, 1908, 1903, 1902, 1913)
Very good
Very poor
FIGURE 6
17
NEITHER / DON’T KNOW
Statistically significant change: Noted prior to 2015 wave Noted with 2015 wave

21 22 24 22 21 21 23 20 22 22 25 25 15 15 19 18 15 11
20 14 15 18 25 16
23 27 28 27 26 24 23 25
65 65 67 66 66 64 68 63 65 66 66 69 61
53 55 61 48
60 64 59
64 56 62 64 68 64 71 69 70 72 69 68
5 6 5 5 4 6 6 6 6 6 4 4 7 3 8 4 8 9 1 5 5 7 9 6 5 7 4 4 4 4 5 4
22 23 22 22 23 25 23 25 21 21 22 20 33 36 34 30
39 31 28 34 25 28 28 24 17
24 17 19 17 15 19 20
120
100
80
60
40
20
0
20
40
60
80
100
12 13 14 15 12 13 14 15 12 13 14 15 12 13 14 15 12 13 14 15 12 13 14 15 12 13 14 15 12 13 14 15
%
TOTAL MALE FEMALE 14-17 18-24 25-34 35-49 50+
ABC Television - Number of shows you like to watch And overall would you say ABC Television does a good job, or a poor job, in terms of the number of shows it provides that you personally like to watch?
21 22 24 22 19 22 24 23 25 21 23 21 35 36 39 36
21 22 22 19 6 6 8 9
65 65 67 66 64 63 67 66 68 67 67 67
89 90 90 87 71 71 73 71
30 30 29 31
5 6 5 5 6 6 5 5 5 5 5 4 2 1 1 1 3 5 4 3 12 12 12 12
22 23 22 22 23 23 23 24 21 22 21 20 9 8 8 11 22 24 23 23
36 37 39 37
120
100
80
60
40
20
0
20
40
60
80
100
12 13 14 15 12 13 14 15 12 13 14 15 12 13 14 15 12 13 14 15 12 13 14 15
%
VERY GOOD JOB QUITE GOOD JOB VERY POOR JOB QUITE POOR JOB
POOR JOB
GOOD JOB
POOR JOB
GOOD JOB
13 13 11 11 12 12 10 12 14 14 12 11 5 11 11 9 14 8 8 7 10 15 10 12 13 13 11 12 15 12 11 12
13 13 11 11 14 13 10 10 11 11 12 13 2 2 2 2 6 5 4 6 34 34 31 32
TOTAL 5 CAP CITY CNTRY / REG'NAL HEAVY MEDIUM LIGHT / NON
AGE SEX
ABC TV VIEWING AREA
NEITHER / DK
NEITHER / DK
FIGURE 7
18
Statistically significant change: Noted prior to 2015 wave Noted with 2015 wave
BASE: AGED 14+ NATIONALLY: TOTAL (n=1908, 1903, 1902, 1913); SEX: MALE (n=953, 952, 950, 957), FEMALE (n=955, 951, 952, 956); AGE: 14-17 (n=150, 150, 150, 150), 18-24 (n=165, 157, 179, 162), 25-34 (n=201, 246, 231, 188), 35-49 (n=613, 517, 482, 417), 50+ (n=779, 833, 860, 996); AREA: 5 CAP CITY (n=1093, 1090, 1088, 1095), COUNTRY/ REGIONAL (n=815, 813, 814, 818): ABC TV VIEWING: HEAVY (n=620, 634, 672, 700), MEDIUM (n=811, 776, 761, 769), LIGHT / NON (n=477, 493, 469, 444)
Commercial TV - Number of shows you like to watch And overall would you say commercial television does a good job, or a poor job, in terms of the number of shows it provides that you personally like to watch?
15 13 11 11 12 11 10 10 18 14 12 12
29 26 26 25 31
15 19 21 25 19 16 12 11 12 10 9 7 7 6 8
51 48 48 42 46 46 46 40 56 51 51
44
74 68 63 72
64 67 59 54
62 59 54 44 49 46
53 44 39 37 38 33
17 19 19 20 20 21 20 23 14 17 19 17 6 6 7 5 11 8 12 8 13 14 15
20 15 20 17 20 24 26 27 26
44 45 48 51 49 47 50 53 38 43 45 49
25 28 32 26
34 27 39 43
30 33 44 52 47 48 44
51 54 56 57 57
120
100
80
60
40
20
0
20
40
60
80
100
12 13 14 15 12 13 14 15 12 13 14 15 12 13 14 15 12 13 14 15 12 13 14 15 12 13 14 15 12 13 14 15
%
15 13 11 11 16 13 11 12 13 12 13 10 8 6 7 8 15 12 10 10
23 20 18 18
51 48 48 42 52 47 48 44 49 51 49
40 37 37 33 28
52 49 48 44
64 60 67 58
17 19 19 20 17 20 19 20 17 18 21 20 24 25 26 26 15 18 18 18
13 14 13 17
44 45 48 51 43 45 48 51
44 44 47 51 58 57 62 64
42 46 48 50
31 31 29 37
120
100
80
60
40
20
0
20
40
60
80
100
12 13 14 15 12 13 14 15 12 13 14 15 12 13 14 15 12 13 14 15 12 13 14 15
%
VERY GOOD JOB QUITE GOOD JOB VERY POOR JOB QUITE POOR JOB
POOR JOB
GOOD JOB
POOR JOB
GOOD JOB
AGE SEX
ABC TV VIEWING AREA
TOTAL MALE FEMALE 14-17 18-24 25-34 35-49 50+
TOTAL 5 CAP CITY CNTRY / REG'NAL HEAVY MEDIUM LIGHT / NON
NEITHER / DK
NEITHER / DK
6 7 4 7 5 7 4 6 6 6 5 7 1 3 5 1 3 6 2 4 8 8 3 5 7 7 5 11 5 6 4 4
6 7 4 7 5 7 4 6 7 5 4 9 6 6 4 8 6 5 4 6 6 9 5 6
FIGURE 8
19
Statistically significant change: Noted prior to 2015 wave Noted with 2015 wave
BASE: AGED 14+ NATIONALLY: TOTAL (n=1908, 1903, 1902, 1913); SEX: MALE (n=953, 952, 950, 957), FEMALE (n=955, 951, 952, 956); AGE: 14-17 (n=150, 150, 150, 150), 18-24 (n=165, 157, 179, 162), 25-34 (n=201, 246, 231, 188), 35-49 (n=613, 517, 482, 417), 50+ (n=779, 833, 860, 996); AREA: 5 CAP CITY (n=1093, 1090, 1088, 1095), COUNTRY/ REGIONAL (n=815, 813, 814, 818): ABC TV VIEWING: HEAVY (n=620, 634, 672, 700), MEDIUM (n=811, 776, 761, 769), LIGHT / NON (n=477, 493, 469, 444)
20
4.3 Radio
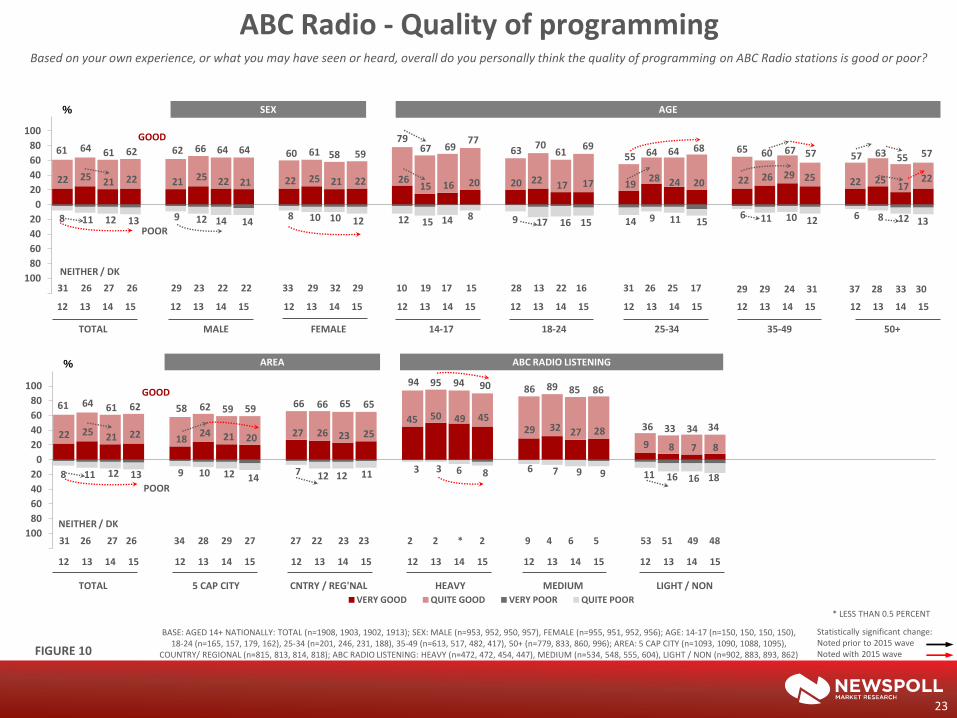
4.3.1 Quality of programming There continues to be a greater similarity in Australians’ overall perceptions about the quality of ABC vs commercial radio than in their perceptions about the quality of ABC vs commercial television. Sixty two percent describe the quality of ABC Radio programming as 'good' (13 percent feel it is poor), while 51 percent feel commercial radio offers good quality programming (and 33 percent feel it is poor) - Figure 9. Perceptions about ABC Radio have been reasonably consistent over the last five waves after a drop from the unusually high levels of 2009 and 20101. However, although the number of people who have a positive view about the quality of ABC content has remained relatively unchanged, since 2012 there has been a small, gradual increase in the number who feel the quality is poor – and this has mainly come from people who were previously uncommitted in their opinion. Perceptions about commercial radio have also been generally consistent, though there has been a slightly higher level of negative sentiment about its quality between 2013 and 2015 compared with the previous two years. Within demographic segments:
• The small, gradual increase in the number who have negative perceptions about the quality of ABC Radio is evident in several segments, even if it is not always statistically significant (men, women, Heavy, Medium and Light/ Non ABC Radio listeners, and people aged 18-24, 35 to 49 and 50+).
• Positive sentiment about ABC Radio has decreased among 35 to 49’s after a rise last year, but this just appears to be part of an ‘up then down again’ pattern evident in recent waves.
• Among 25 to 34’s, positive sentiment is up significantly on three years ago – though the 2012 level was unusually low. At the same time, over the last three waves, perceptions about the quality of commercial radio among 25 to 34’s have been at their lowest recorded in the tracking series. Consequently during 2013-2015, relative perceptions about ABC Radio vs. commercial radio among this age group have been the most favourable for some time.
1. As discussed in previous reports, the higher level in 2009 appeared related to ABC Radio’s
coverage of the fire and flood disasters of that year.
21
4.3 Radio
4.3.1 Quality of programming (cont’d)
• However among people 50+, the opposite is true. On average, over the last four waves, the gap between ABC Radio and commercial radio has been its narrowest for some time.
The loss in positive sentiment about the quality of ABC Radio is because of a combination of two things: (i) a slight increase in the number of people who feel ABC Radio offers poor content, and (ii) fewer people aged 50+ have any view about it at all. As noted in last year’s report, this relates to a loss of behavioural connection with ABC Radio. [Appreciation surveys over 2011 to 2015 have seen, based on peoples’ claimed listening behaviour, an increase in the absolute number categorised as ‘light/non’ listeners of ABC Radio, and a reduction in those categorised as ‘heavy’ listeners – and this has been most evident among people aged 50+] 1.
1. See Section 3, Methodology, for a description of how the heavy, medium and light/non listening segments are derived.

17 19 21 22 20 22 22 22 21 21 23 22 22 25 21 22
12 13 10 12 13 14 13 11 12 12 13 15 15 13 11 12
60 58 59 60 61 63 63 64 65 69 69
64 61 64 61 62
55 58 53 55 55 58 56
53 54 53 52 55 53 51 51 51
1 2 1 2 2 2 1 2 2 2 3 3 2 3 3 4
12 12 12 13 12 13 13 13 13 12 15 12 13
16 14 13 7 6 7 8 6 8 7 7 8 9 10 9 8
11 12 13
29 29 31 30 29 30 32 31 33 33 34 30 30
35 34 33
100
80
60
40
20
0
20
40
60
80
100
1998 1999 2002 2003 2004 2005 2006 2007 2008 2009 2010 2011 2012 2013 2014 2015 1998 1999 2002 2003 2004 2005 2006 2007 2008 2009 2010 2011 2012 2013 2014 2015
%
VERY GOOD QUITE GOOD VERY POOR QUITE POOR
Radio - Quality of programming
POOR
GOOD
Based on your own experience, or what you may have seen or heard, overall do you personally think the quality of programming on... (TYPE) is good or poor?
33 36 34 32 33 28 31 29 27 22 21 27 31 26 27 26 16 14 16 16 16 13 13 16 13 14 14 14 16 14 15 16
ABC RADIO COMMERCIAL RADIO
Total good
Very good
Total poor
Very poor
BASE: AGED 14+ NATIONALLY: TOTAL (n=1290, 1900, 1900, 1900, 1900, 1900, 1900, 1903, 1902, 1900, 1905, 1904, 1908, 1903, 1902, 1913)
22
FIGURE 9
NEITHER / DON’T KNOW
Statistically significant change: Noted prior to 2015 wave Noted with 2015 wave
22 25 21 22 21 25 22 21 22 25 21 22 26 15 16 20 20 22 17 17 19
28 24 20 22 26 29 25 22 25 17
22
61 64 61 62 62 66 64 64 60 61 58 59
79 67 69
77 63
70 61
69 55 64 64 68 65 60 67 57 57 63 55 57
8 11 12 13 9 12 14 14 8 10 10 12 12 15 14 8 9 17 16 15 14 9 11 15
6 11 10 12 6 8 12 13
120
100
80
60
40
20
0
20
40
60
80
100
12 13 14 15 12 13 14 15 12 13 14 15 12 13 14 15 12 13 14 15 12 13 14 15 12 13 14 15 12 13 14 15
%
22 25 21 22 18 24 21 20 27 26 23 25
45 50 49 45 29 32 27 28
9 8 7 8
61 64 61 62 58 62 59 59 66 66 65 65
94 95 94 90 86 89 85 86
36 33 34 34
8 11 12 13 9 10 12 14 7 12 12 11 3 3 6 8 6 7 9 9 11 16 16 18
120
100
80
60
40
20
0
20
40
60
80
100
12 13 14 15 12 13 14 15 12 13 14 15 12 13 14 15 12 13 14 15 12 13 14 15
%
VERY GOOD QUITE GOOD VERY POOR QUITE POOR
TOTAL MALE FEMALE 14-17 18-24 25-34 35-49 50+
ABC Radio - Quality of programming Based on your own experience, or what you may have seen or heard, overall do you personally think the quality of programming on ABC Radio stations is good or poor?
POOR
GOOD
POOR
GOOD
AGE SEX
ABC RADIO LISTENING AREA
TOTAL 5 CAP CITY CNTRY / REG'NAL HEAVY MEDIUM LIGHT / NON
31 26 27 26 29 23 22 22 33 29 32 29 10 19 17 15 28 13 22 16 31 26 25 17 37 28 33 30 29 29 24 31
31 26 27 26 34 28 29 27 27 22 23 23 2 2 * 2 9 4 6 5 53 51 49 48
NEITHER / DK
NEITHER / DK
BASE: AGED 14+ NATIONALLY: TOTAL (n=1908, 1903, 1902, 1913); SEX: MALE (n=953, 952, 950, 957), FEMALE (n=955, 951, 952, 956); AGE: 14-17 (n=150, 150, 150, 150), 18-24 (n=165, 157, 179, 162), 25-34 (n=201, 246, 231, 188), 35-49 (n=613, 517, 482, 417), 50+ (n=779, 833, 860, 996); AREA: 5 CAP CITY (n=1093, 1090, 1088, 1095),
COUNTRY/ REGIONAL (n=815, 813, 814, 818); ABC RADIO LISTENING: HEAVY (n=472, 472, 454, 447), MEDIUM (n=534, 548, 555, 604), LIGHT / NON (n=902, 883, 893, 862) FIGURE 10
23
Statistically significant change: Noted prior to 2015 wave Noted with 2015 wave
* LESS THAN 0.5 PERCENT

Commercial Radio - Quality of programming Based on your own experience, or what you may have seen or heard, overall do you personally think the quality of programming on commercial radio stations is good or poor?
15 13 11 12 12 12 9 12 18 14 13 12 24
14 9 12 11 13 10 13 20 15 12 12 15 15 10 15 12 11 12 10
53 51 51 51 50 48 47 50 56 54 55 51
78 65 68 71
57 62 53
60 60 52 53 49 55 53 51 52 45 44 48 45
13 16 14 13 16 18 16 14 11 14 11 12 5 8 7 6 11 12 14
6 14 20 19 16 16 18 14 16 13 16 13 12
30 35 34 33 35 39 39 36 26 31 29 30
18 28
20 20 27 33
41 29 32
38 37 43 33 37 37 35 31 33 30 31
120
100
80
60
40
20
0
20
40
60
80
100
12 13 14 15 12 13 14 15 12 13 14 15 12 13 14 15 12 13 14 15 12 13 14 15 12 13 14 15 12 13 14 15
%
15 13 11 12 16 13 10 11 14 12 12 13 6 6 5 6
13 13 11 11 20 16 14 15
53 51 51 51 57 52 51 51 48 50 51 50
33 29 33 35 52 54 53 52
62 59 58 57
13 16 14 13 13 17 13 14 14 14 15 12 22 30 23 17 17 17 15 14 8 9 10 10
30 35 34 33 29 36 34 34 33 33 33 31
47 55 52 48
38 38 36 37
20 23 24 24
120
100
80
60
40
20
0
20
40
60
80
100
12 13 14 15 12 13 14 15 12 13 14 15 12 13 14 15 12 13 14 15 12 13 14 15
%
VERY GOOD QUITE GOOD VERY POOR QUITE POOR
POOR
GOOD
POOR
GOOD
AGE SEX
ABC RADIO LISTENING AREA
16 14 15 16 15 13 14 14 17 15 16 19 4 8 12 8 16 5 6 11 8 10 11 9 25 23 22 24 12 10 12 14
16 14 15 16 15 12 15 15 19 18 16 19 20 16 15 17 11 7 11 12 17 18 18 19
TOTAL MALE FEMALE 14-17 18-24 25-34 35-49 50+
TOTAL 5 CAP CITY CNTRY / REG'NAL HEAVY MEDIUM LIGHT / NON
NEITHER / DK
NEITHER / DK
FIGURE 11
24
Statistically significant change: Noted prior to 2015 wave Noted with 2015 wave
BASE: AGED 14+ NATIONALLY: TOTAL (n=1908, 1903, 1902, 1913); SEX: MALE (n=953, 952, 950, 957), FEMALE (n=955, 951, 952, 956); AGE: 14-17 (n=150, 150, 150, 150), 18-24 (n=165, 157, 179, 162), 25-34 (n=201, 246, 231, 188), 35-49 (n=613, 517, 482, 417), 50+ (n=779, 833, 860, 996); AREA: 5 CAP CITY (n=1093, 1090, 1088, 1095),
COUNTRY/ REGIONAL (n=815, 813, 814, 818); ABC RADIO LISTENING: HEAVY (n=472, 472, 454, 447), MEDIUM (n=534, 548, 555, 604), LIGHT / NON (n=902, 883, 893, 862)

25
4.3 Radio (cont’d)
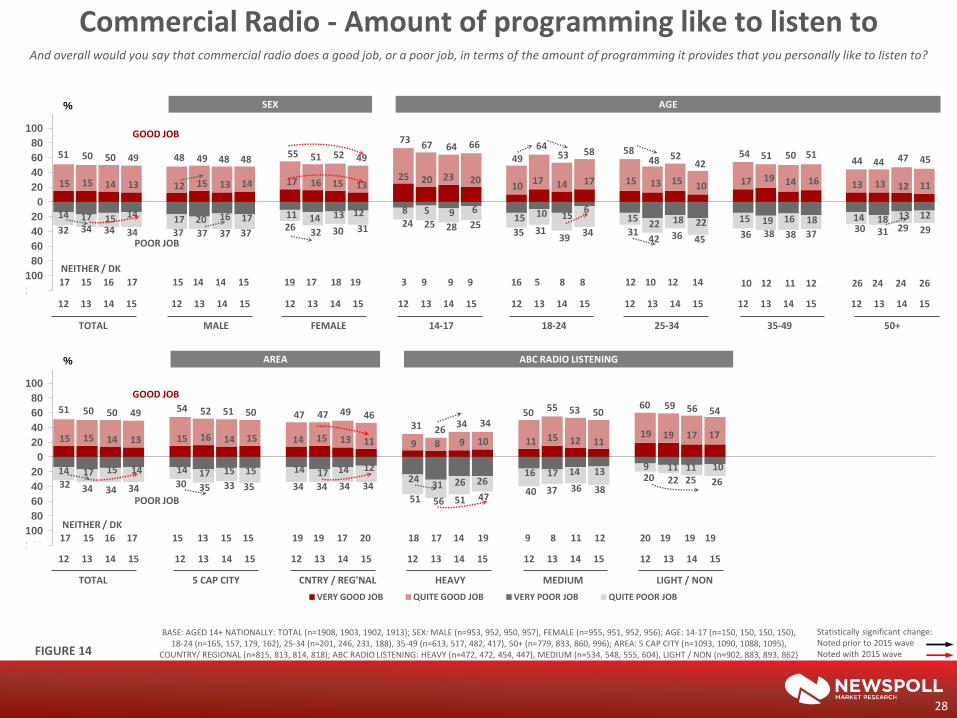
4.3.2 Amount of programming personally like to listen to Fifty seven percent of Australians believe ABC Radio does a 'good job' in terms of the amount of programming it provides that they personally like to listen to, compared with 49 percent for commercial radio (Figure 12). The number who feel commercial radio does a 'poor' job remains substantially greater (34 percent) than for ABC Radio (17 percent). Reflecting attitudes about quality, perceptions about the appeal of ABC Radio and commercial radio content have been broadly consistent over the last four to five waves. Among people aged 50+, the narrowing of the gap in perceptions about the quality of ABC Radio and commercial radio is also found in relation to the amount of appealing content that each provides. However, among 25 to 34’s, the large positive gap in perceptions about the quality of ABC Radio vs. commercial radio over the last three waves is only evident in the current wave for appealing content.

16 18 19 22 23 20 20 22 22 23 22 23 20
24 22 21 13
16 11
15 15 17 14 14 14 14 16 17 15 15 14 13
57 56 57 56 59 59 59 59 59 62 61
57 53 57 54 57 56 58
53 55 54 55 55 53 54 54 52 53 51 50 50 49
2 4 2 3 3 4 3 4 5 5 5 4 4 5 5 5 12 12 14 14 13 14 14 15 14 13
17 14 14 17 15 14 10 10 8 9 9 12
10 12 14 16 17 14 15 16 17 17
28 27 30 29 28 31 32 32 33 33 34 31 32 34 34 34
100
80
60
40
20
0
20
40
60
80
100
1998 1999 2002 2003 2004 2005 2006 2007 2008 2009 2010 2011 2012 2013 2014 2015 1998 1999 2002 2003 2004 2005 2006 2007 2008 2009 2010 2011 2012 2013 2014 2015
%
VERY GOOD JOB QUITE GOOD JOB VERY POOR JOB QUITE POOR JOB
Radio - Amount of programming like to listen to And overall would you say that ... (TYPE) does a good job, or a poor job, in terms of the amount of programming it provides that you personally like to listen to?
33 34 35 34 32 30 31 29 27 23 22 29 32 27 29 26 16 15 16 16 18 14 14 16 13 13 14 15 17 15 16 17
ABC RADIO COMMERCIAL RADIO
GOOD JOB
POOR JOB
Total good
BASE: AGED 14+ NATIONALLY: TOTAL (n=1290, 1900, 1900, 1900, 1900, 1900, 1900, 1903, 1902, 1900, 1905, 1904, 1908, 1903, 1902, 1913)
Very good
Total poor
Very poor
FIGURE 12
26
NEITHER / DON’T KNOW
Statistically significant change: Noted prior to 2015 wave Noted with 2015 wave

ABC Radio - Amount of programming like to listen to And overall would you say that ABC Radio does a good job, or a poor job, in terms of the amount of programming it provides that you personally like to listen to?
20 24 22 21 20 25 25 21 20 23 19 21 23
10 15 15 15 18 18 13 14 22 25 23 20 26 25 24 23 28 20 20
53 57 54 57 56 61 57 59 50 53 51 55
63 53 55
63 53
61 50
59 47
54 56 64 59 55 61 55 50
60 49
53
15 16 17 17 15 16 18 19 14 16 16 15 27 26 29
22 23 26 29 24 20 21 20 21 11 16 11 12 10 9 15 15
120
100
80
60
40
20
0
20
40
60
80
100
12 13 14 15 12 13 14 15 12 13 14 15 12 13 14 15 12 13 14 15 12 13 14 15 12 13 14 15 12 13 14 15
%
20 24 22 21 18 24 21 19 22 23 22 24
47 54 52 52
25 31 26 24
6 6 6 5
53 57 54 57 49 57 51 55 59 59 58 61
95 92 94 92 76 84 79 81
25 25 23 27
15 16 17 17 16 15 18 18 12 17 16 14
3 5 4 6 14 12 15 13 20 23 24 24
120
100
80
60
40
20
0
20
40
60
80
100
12 13 14 15 12 13 14 15 12 13 14 15 12 13 14 15 12 13 14 15 12 13 14 15
%
VERY GOOD JOB QUITE GOOD JOB VERY POOR JOB QUITE POOR JOB
POOR JOB
GOOD JOB
GOOD JOB
32 27 29 26 29 23 25 22 35 31 33 30 9 21 15 15 24 12 21 17 33 24 24 15 40 32 36 32 30 30 28 32
32 27 29 26 35 28 31 27 29 24 25 25 2 3 2 2 9 4 6 7 55 52 52 49
TOTAL MALE FEMALE 14-17 18-24 25-34 35-49 50+
TOTAL 5 CAP CITY CNTRY / REG'NAL HEAVY MEDIUM LIGHT / NON
AGE SEX
ABC RADIO LISTENING AREA
NEITHER / DK
NEITHER / DK
POOR JOB
FIGURE 13
27
Statistically significant change: Noted prior to 2015 wave Noted with 2015 wave
BASE: AGED 14+ NATIONALLY: TOTAL (n=1908, 1903, 1902, 1913); SEX: MALE (n=953, 952, 950, 957), FEMALE (n=955, 951, 952, 956); AGE: 14-17 (n=150, 150, 150, 150), 18-24 (n=165, 157, 179, 162), 25-34 (n=201, 246, 231, 188), 35-49 (n=613, 517, 482, 417), 50+ (n=779, 833, 860, 996); AREA: 5 CAP CITY (n=1093, 1090, 1088, 1095),
COUNTRY/ REGIONAL (n=815, 813, 814, 818); ABC RADIO LISTENING: HEAVY (n=472, 472, 454, 447), MEDIUM (n=534, 548, 555, 604), LIGHT / NON (n=902, 883, 893, 862)
Commercial Radio - Amount of programming like to listen to And overall would you say that commercial radio does a good job, or a poor job, in terms of the amount of programming it provides that you personally like to listen to?
15 15 14 13 12 15 13 14 17 16 15 13 25 20 23 20
10 17 14 17 15 13 15 10 17 19 14 16 13 13 12 11
51 50 50 49 48 49 48 48 55 51 52 49
73 67 64 66
49 64
53 58 58 48 52
42 54 51 50 51
44 44 47 45
14 17 15 14 17 20 16 17 11 14 13 12 8 5 9 6
15 10 15 6
15 22 18 22 15 19 16 18 14 18 13 12
32 34 34 34 37 37 37 37 26 32 30 31 24 25 28 25
35 31 39 34 31
42 36 45 36 38 38 37 30 31 29 29
120
100
80
60
40
20
0
20
40
60
80
100
12 13 14 15 12 13 14 15 12 13 14 15 12 13 14 15 12 13 14 15 12 13 14 15 12 13 14 15 12 13 14 15
%
15 15 14 13 15 16 14 15 14 15 13 11 9 8 9 10 11 15 12 11 19 19 17 17
51 50 50 49 54 52 51 50 47 47 49 46 31 26
34 34 50 55 53 50
60 59 56 54
14 17 15 14 14 17 15 15 14 17 14 12 24
31 26 26 16 17 14 13 9 11 11 10
32 34 34 34 30 35 33 35 34 34 34 34 51 56 51 47
40 37 36 38 20 22 25 26
120
100
80
60
40
20
0
20
40
60
80
100
12 13 14 15 12 13 14 15 12 13 14 15 12 13 14 15 12 13 14 15 12 13 14 15
%
VERY GOOD JOB QUITE GOOD JOB VERY POOR JOB QUITE POOR JOB
POOR JOB
GOOD JOB
POOR JOB
GOOD JOB
AGE SEX
ABC RADIO LISTENING AREA
TOTAL MALE FEMALE 14-17 18-24 25-34 35-49 50+
TOTAL 5 CAP CITY CNTRY / REG'NAL HEAVY MEDIUM LIGHT / NON
NEITHER / DK
NEITHER / DK
17 15 16 17 15 14 14 15 19 17 18 19 3 9 9 9 16 5 8 8 12 10 12 14 26 24 24 26 10 12 11 12
17 15 16 17 15 13 15 15 19 19 17 20 18 17 14 19 9 8 11 12 20 19 19 19
FIGURE 14
28
Statistically significant change: Noted prior to 2015 wave Noted with 2015 wave
BASE: AGED 14+ NATIONALLY: TOTAL (n=1908, 1903, 1902, 1913); SEX: MALE (n=953, 952, 950, 957), FEMALE (n=955, 951, 952, 956); AGE: 14-17 (n=150, 150, 150, 150), 18-24 (n=165, 157, 179, 162), 25-34 (n=201, 246, 231, 188), 35-49 (n=613, 517, 482, 417), 50+ (n=779, 833, 860, 996); AREA: 5 CAP CITY (n=1093, 1090, 1088, 1095),
COUNTRY/ REGIONAL (n=815, 813, 814, 818); ABC RADIO LISTENING: HEAVY (n=472, 472, 454, 447), MEDIUM (n=534, 548, 555, 604), LIGHT / NON (n=902, 883, 893, 862)

2 2
6 8 7 7
9 10 11 12 13
17 15 16 17
22
8 12
18 20
22 23 23
26 25
31 31
35 34 37 37
40
0
20
40
60
80
1998 1999 2002 2003 2004 2005 2006 2007 2008 2009 2010 2011 2012 2013 2014 2015
%
AT LEAST ONCE A WEEK LESS THAN ONCE A WEEK
29
Now thinking about the ABC website. About how often would you personally visit the ABC website? Would it be at least once a week, less than once a week or never?
Total ever use
At least once a week
BASE: AGED 14+ NATIONALLY: TOTAL (n=1290, 1900, 1900, 1900, 1900, 1900, 1900, 1903, 1902, 1900, 1905, 1904, 1908, 1903, 1902, 1913) FIGURE 15
Frequency use ABC website (and online services) Now a question about the ABC website (and online services). About how often would you personally visit the ABC
website (or use ABC online services) for any purpose at all? Would it be at least once a week, less than once a week or never?^
Statistically significant change: Noted prior to 2015 wave Noted with 2015 wave
^Prior to 2015, question included ABC website only – not online services
4.4 Online
4.4.1 Usage of the ABC website (and online services) Forty percent of Australians claim to ever use the ABC website or online services, even if only occasionally, and 22 percent say they do so at least once a week (Figure 15). In the current wave, this survey question was broadened to include ABC ‘online services’ as well as the website, and it’s likely this has contributed to the large gain in ‘at least weekly’ usage (up from 17 percent to 22 percent).
Consistent with previous findings about the website, usage of the website and online services is higher among people aged under 50, and continues to be mainly concentrated among those who are heavy/ medium users of ABC TV/ ABC Radio. However, while usage of the website has generally been higher among men than women, the inclusion of online services finds men and women more closely aligned (Figure 16).

15 16 17 22
15 17 18 22
15 15 16 23 22 21
24 30
15 17 16 21
3 5 5 6
34 37 37 40
35 39 38 41
33 32 34 37 44 44
48 47
35 40
37 43
14 14 13 15
0
20
40
60
80
100
12 13 14 15 12 13 14 15 12 13 14 15 12 13 14 15 12 13 14 15 12 13 14 15
%
AT LEAST ONCE A WEEK LESS THAN ONCE A WEEK
Frequency use ABC website and online services Now a question about the ABC website and online services. About how often would you personally visit the ABC website or use ABC online services for any purpose at
all? Would it be at least once a week, less than once a week or never?^
15 16 17 22 19 18 19
25
12 15 15 20
13 14 15
23
14 14 13
24 23 20 24
29
18 21 23 26
11 12 12 17
34 37 37 40 38 38 39 40
31 35 34
39 40 37
41
50
35 41 40 43
47 40
44 51
40 45 45 44
24 28 27
29
0
20
40
60
80
100
12 13 14 15 12 13 14 15 12 13 14 15 12 13 14 15 12 13 14 15 12 13 14 15 12 13 14 15 12 13 14 15
% AGE SEX
ABC TV/ RADIO AREA
TOTAL MALE FEMALE 14-17 18-24 25-34 35-49 50+
TOTAL 5 CAP CITY CNTRY / REG'NAL HEAVY MEDIUM LIGHT / NON
FIGURE 16
30
Statistically significant change: Noted prior to 2015 wave Noted with 2015 wave
BASE: AGED 14+ NATIONALLY: TOTAL (n=1908, 1903, 1902, 1913); SEX: MALE (n=953, 952, 950, 957), FEMALE (n=955, 951, 952, 956); AGE: 14-17 (n=150, 150, 150, 150), 18-24 (n=165, 157, 179, 162), 25-34 (n=201, 246, 231, 188), 35-49 (n=613, 517, 482, 417), 50+ (n=779, 833, 860, 996); AREA: 5 CAP CITY (n=1093, 1090, 1088, 1095), COUNTRY/ REGIONAL (n=815, 813, 814, 818): ABC TV/ RADIO: HEAVY (n=834, 851, 852, 871), MEDIUM (n=737, 710, 726, 727), LIGHT/NON (n=337, 342, 324, 315)
^Prior to 2015, question included ABC website only – not online services

31
4.4 Online (cont’d)
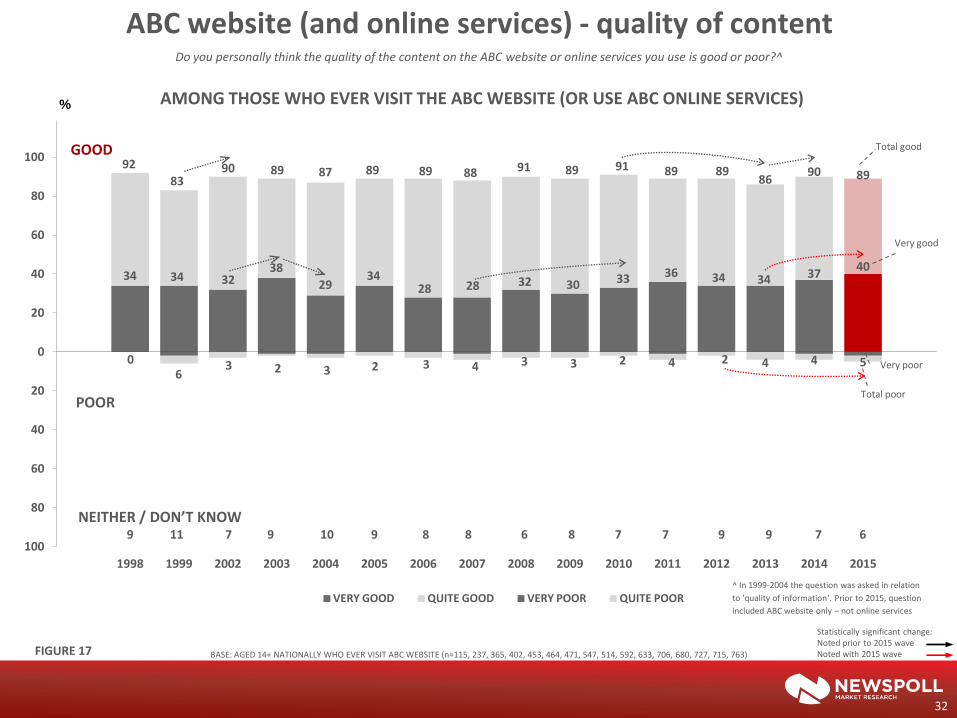
4.4.2 Quality and amount of content on ABC website (and online services) Among those who ever use the ABC’s website or online services, the vast majority (89 percent) believe the quality of content is 'good', and 40 percent rate the quality as very good, which is up on 34 percent in relation to the website two years ago. At the same time, compared with 2012, the number who describe the content as poor is also up very slightly (from 2 percent to 5 percent) - Figure 17. Nine-in-ten users also feel the website/ online services do a 'good job' on the amount of relevant content they provide, with 44 percent describing it as very good. There is no significant change compared with last year (Figure 18). Analysis among demographics shows that the vast majority of users in each segment rate the site positively both on quality and quantity of content, though not surprisingly, those who use it more frequently are more enthusiastic in their rating of the site.
34 34 32 38
29 34
28 28 32 30 33 36 34 34 37 40
92
83 90 89 87 89 89 88 91 89 91 89 89
86 90 89
0 6
3 2 3 2 3 4 3 3 2 4 2 4 4 5
100
80
60
40
20
0
20
40
60
80
100
1998 1999 2002 2003 2004 2005 2006 2007 2008 2009 2010 2011 2012 2013 2014 2015
%
VERY GOOD QUITE GOOD VERY POOR QUITE POOR
ABC website (and online services) - quality of content Do you personally think the quality of the content on the ABC website or online services you use is good or poor?^
9 11 7 9 10 9 8 8 6 8 7 7 9 9 7 6
BASE: AGED 14+ NATIONALLY WHO EVER VISIT ABC WEBSITE (n=115, 237, 365, 402, 453, 464, 471, 547, 514, 592, 633, 706, 680, 727, 715, 763)
GOOD
POOR
AMONG THOSE WHO EVER VISIT THE ABC WEBSITE (OR USE ABC ONLINE SERVICES)
^ In 1999-2004 the question was asked in relation
to 'quality of information‘. Prior to 2015, question
included ABC website only – not online services
Total good
Very good
Total poor
Very poor
FIGURE 17
32
NEITHER / DON’T KNOW
Statistically significant change: Noted prior to 2015 wave Noted with 2015 wave

39 34 31 35 37 38
42 37
41 41 44
93 89 90 92 91 93 92 92 91 93 91
2 6 4 4 4 3 3 3 3 3 4
100
80
60
40
20
0
20
40
60
80
100
1998 1999 2002 2003 2004 2005 2006 2007 2008 2009 2010 2011 2012 2013 2014 2015
%
VERY GOOD JOB QUITE GOOD JOB VERY POOR JOB QUITE POOR JOB
ABC website (and online services) – amount of content As far as the things you use the ABC website or online services for, would you say they do a good job, or a poor job, in terms of the amount of content they provide on those
things?^
5 5 5 3 5 4 5 6 5 5 5
BASE: AGED 14+ NATIONALLY WHO EVER VISIT ABC WEBSITE (n= 464, 471, 547, 514, 592, 633, 706, 680, 727, 715, 763)
GOOD JOB
POOR JOB
AMONG THOSE WHO EVER VISIT THE ABC WEBSITE (OR USE ABC ONLINE SERVICES)
Total good
Very good
Total poor
Very poor
NEITHER / DON’T KNOW
FIGURE 18
33
Statistically significant change: Noted prior to 2015 wave Noted with 2015 wave
^Prior to 2015, question included ABC website only – not online services

40 42 38 43 39 36 51
28 18
89 90 88 90 93 83 94 90
66
5 5 6 5 3 8 4 5 12
100
50
0
50
100
TOTAL MALE 35-49 FORTNIGHTLY/ MONTHLY
%
ABC website and online services
6 5 6 4 4 9 2 5 21
GOOD
POOR
AMONG THOSE WHO EVER VISIT THE ABC WEBSITE OR USE ABC ONLINE SERVICES
BASE: AGED 14+ NATIONALLY WHO EVER VISIT ABC WEBSITE / USE ONLINE SERVICES AGED 14+ NATIONALLY: TOTAL (n=763); SEX: MALE (n=385), FEMALE (n=378); AGE: 14-34 (n=240), 35-49 (n=201), 50+ (n=322); FREQUENCY USE WEBSITE/ ONLINE SERVICES: AT LEAST WEEKLY (n=430), FORTNIGHTLY / MONTHLY (n=227), LESS OFTEN (n=106)
TOTAL MALE FEMALE 14-34 35-49 50+ AT LEAST FORTNIGHTLY / LESS WEEKLY MONTHLY OFTEN
NEITHER / DK
44 41 48 43 48 43 53
37 24
91 92 91 91 95 88 96 92
71
4 5 3 4 2 5 3 3 9
100
50
0
50
100
TOTAL MALE 35-49 FORTNIGHTLY/ MONTHLY
%
VERY GOOD QUITE GOOD VERY POOR QUITE POOR
5 3 7 4 4 7 1 5 20
GOOD
POOR
NEITHER / DK
Quality of content
Amount of content
SEX AGE FREQUENCY USE WEBSITE OR ONLINE SERVICES
FIGURE 19
34
SEX AGE
TOTAL MALE FEMALE 14-34 35-49 50+ AT LEAST FORTNIGHTLY / LESS WEEKLY MONTHLY OFTEN
FREQUENCY USE WEBSITE OR ONLINE SERVICES
35
4.5 Coverage of country news and information
Community perceptions about coverage of country news and information remain far more favourable for the ABC than for commercial media - both among people in capital cities and people in country/ regional areas (Figure 20). Eighty percent of Australians believe the ABC does a 'good job' covering country/regional issues compared with 42 percent for commercial media. Compared with last year, there’s been a small drop in positive sentiment about commercial media, and the level of negative sentiment is up compared with two years ago. There is also a small increase in negative sentiment about the ABC compared with two years ago – but the level of criticism about the ABC on this issue remains very low compared with commercial media.

33 35 32 32
12 15 11 12
31 33 32 30
10 13 8 9
36 38 33 34
16 20 16 16
79 80 80 80
46 45 46 42
78 78 80 79
41 39 41 38
81 84 81 82
54 56 53 50
1 1 2 3
12 17 14 15
1 1 2 3
13 18
14 16
1 2 2 3
12 14 12 13 7 6 8 9
44 43 44 47
7 6 8 9
47 46 48 50
8 8 9 8
38 38 37 41
120
100
80
60
40
20
0
20
40
60
80
100
12 13 14 15 12 13 14 15 12 13 14 15 12 13 14 15 12 13 14 15 12 13 14 15
%
VERY GOOD JOB QUITE GOOD JOB VERY POOR JOB QUITE POOR JOB
Doing a good or poor job in country and regional areas
POOR
GOOD
Thinking now of news and information about things happening in country and regional areas of Australia. In your opinion, do ABC / commercial TV & radio stations & websites do a good job, or a poor job of covering things happening in country and regional areas of Australia?
BASE: AGED 14+ NATIONALLY: TOTAL (n=1908, 1903, 1902, 1913); AREA: 5 CAP CITY (n=1093, 1090, 1088, 1095), COUNTRY / REGIONAL (n=815, 813, 814, 818)
14 13 11 12 11 12 10 11 15 16 12 13 12 15 11 12 11 8 9 10 8 6 9 9
ABC COMMERCIAL ABC COMMERCIAL ABC COMMERCIAL
36
FIGURE 20
NEITHER / DON’T KNOW
TOTAL FIVE CAP CITY COUNTRY / REGIONAL
Statistically significant change: Noted prior to 2015 wave Noted with 2015 wave

37
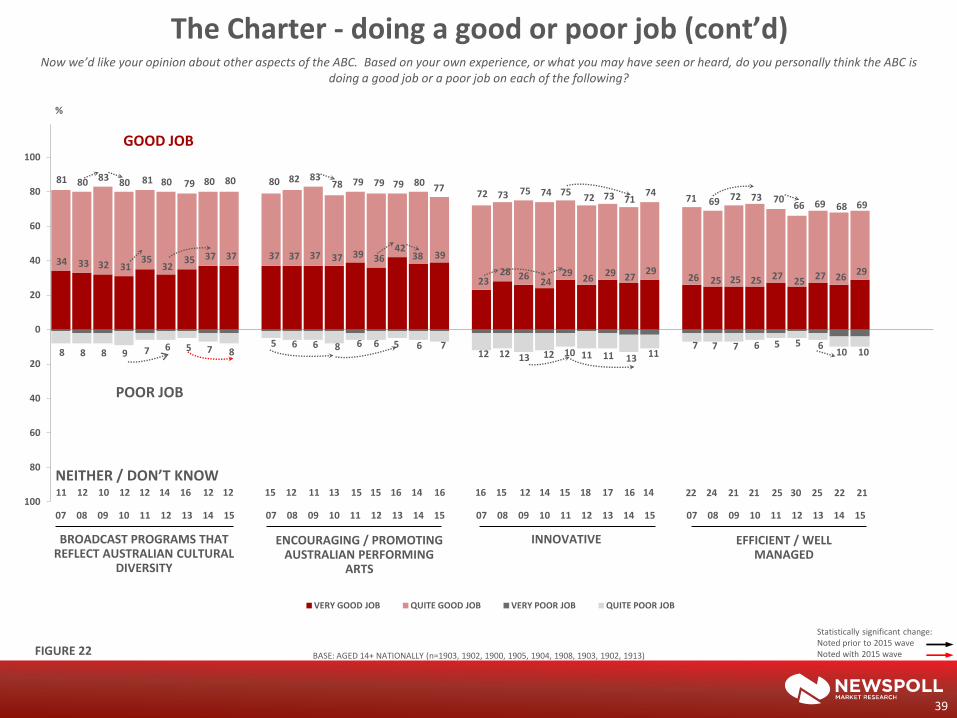
4.6 Other specific charter obligations Respondents to the Appreciation Survey are asked if they believe the ABC is doing a 'good job' or a 'poor job' on nine other specific aspects of the ABC charter: The majority of Australians remain of the view that the ABC is doing 'a good job' in fulfilling each area (Figures 21 and 22).
The only significant change compared with last year is a small rise (after a dip last year) in the number of Australians who believe the ABC does a very good job of being being balanced and even handed when reporting news and current affairs. Yet at the same time, compared with two years ago, there has also been a small increase in the number who feel the ABC does a poor job on this issue. Over the same two year period, there has a small increase in the number of Australians who believe the ABC does a poor job:
• broadcasting programs that are different from commercial television or radio;
• being distinctively Australian; and,
• broadcasting programs that reflect Australian cultural diversity.
a) being innovative - that is trying to do new things and different types of programs
b) being balanced and even-handed when reporting news and current affairs
c) encouraging and promoting Australian performing arts such as music and drama
d) broadcasting programs of an educational nature
e) being distinctively Australian and contributing to Australia’s national identity
f) being efficient and well managed
g) broadcasting programs that are different from the sort of programs you would get on commercial television and commercial radio stations
h) having a good balance between broadcasting programs of wide appeal, and broadcasting programs that appeal to people with special interests
i) broadcasting programs that reflect the cultural diversity of the Australian community

48 49 48 47 50
47 48 48 46 42 45
47 44
50 47
50 47 47
35 37 36 33 38
34 36 38 37 39 41 40 39 42 39 42 41 42
35 37 40 38 41 40 42
38 42
87 89 92 89 87 86 85 84 84 85 86 88 86 84 82 83 83 84 85 83 86 85 83 82 80 80 82 84 84 86 84 83 83 82 82 82
79 81 83 82 81 80 78 77 77
4 3 3 4 4 4 4 5 7 4 3 4 4 3 3 3 4 4 5 6 6 6 5 6 6 8 7 5 6 6 7 5 5 5 7 8 10 9 11 9 10 7 11
13 15
100
80
60
40
20
0
20
40
60
80
100
07 08 09 10 11 12 13 14 15 07 08 09 10 11 12 13 14 15 07 08 09 10 11 12 13 14 15 07 08 09 10 11 12 13 14 15 07 08 09 10 11 12 13 14 15
%
VERY GOOD JOB QUITE GOOD JOB VERY POOR JOB QUITE POOR JOB
The Charter - doing a good or poor job
GOOD JOB
Now we’d like your opinion about other aspects of the ABC. Based on your own experience, or what you may have seen or heard, do you personally think the ABC is doing a good job or a poor job on each of the following?
BASE: AGED 14+ NATIONALLY (n=1903, 1902, 1900, 1905, 1904, 1908, 1903, 1902, 1913)
9 8 5 7 9 10 11 10 10 11 10 9 10 13 15 14 12 12 10 11 8 9 11 12 14 12 11 10 10 7 9 11 13 13 10 10 11 10 7 9 10 13 11 10 9
BROADCAST DIFFERENT PROGRAMS TO COMMERCIAL TV
& RADIO
BROADCAST PROGRAMS OF AN EDUCATIONAL NATURE
GOOD BALANCE / WIDE APPEAL / SPECIAL INTEREST PROGRAMS
DISTINCTIVELY AUSTRALIAN
BALANCED & EVEN-HANDED
NEITHER / DON’T KNOW
38
FIGURE 21
POOR JOB
Statistically significant change: Noted prior to 2015 wave Noted with 2015 wave
34 33 32 31 35
32 35 37 37 37 37 37 37 39 36
42 38 39
23 28 26
24 29
26 29 27
29 26 25 25 25 27
25 27 26
29
81 80 83 80 81 80 79 80 80 80 82 83 78 79 79 79 80
77 72 73 75 74 75
72 73 71 74
71 69 72 73 70 66 69 68 69
8 8 8 9 7 6 5 7 8 5 6 6 8 6 6 5 6 7
12 12 13 12 10 11 11 13 11 7 7 7 6 5 5 6
10 10
100
80
60
40
20
0
20
40
60
80
100
07 08 09 10 11 12 13 14 15 07 08 09 10 11 12 13 14 15 07 08 09 10 11 12 13 14 15 07 08 09 10 11 12 13 14 15
%
VERY GOOD JOB QUITE GOOD JOB VERY POOR JOB QUITE POOR JOB
The Charter - doing a good or poor job (cont’d)
POOR JOB
GOOD JOB
Now we’d like your opinion about other aspects of the ABC. Based on your own experience, or what you may have seen or heard, do you personally think the ABC is doing a good job or a poor job on each of the following?
11 12 10 12 12 14 16 12 12 15 12 11 13 15 15 16 14 16 16 15 12 14 15 18 17 16 14 22 24 21 21 25 30 25 22 21
BROADCAST PROGRAMS THAT REFLECT AUSTRALIAN CULTURAL
DIVERSITY
ENCOURAGING / PROMOTING AUSTRALIAN PERFORMING
ARTS
INNOVATIVE EFFICIENT / WELL MANAGED
BASE: AGED 14+ NATIONALLY (n=1903, 1902, 1900, 1905, 1904, 1908, 1903, 1902, 1913)
39
FIGURE 22
NEITHER / DON’T KNOW
Statistically significant change: Noted prior to 2015 wave Noted with 2015 wave

40
4.7 News and current affairs – being balanced and even handed
Perceptions about balance and even-handedness in reporting were explored in more detail among viewers and listeners1 of the ABC’s flagship News and Current Affairs programs:
– Television: 7pm News, 7.30 (previously 7.30 Report);
– Radio: The World Today, AM and PM. The vast majority of those who watch/listen to the respective programs believe it does a 'good job' of being balanced and even-handed – and in each case, around 40 to 45 percent of viewers/listeners believe it does a 'very good job'. Changes of note are as follows:
• Although the number of 7.30 viewers who feel the program does a very good job is at its highest level since 2012, compared with last year, there has also been a small increase in the number who feel it does a poor job of being balanced and even handed.
• Over the last few years, there has also been a slight rise in the number of AM/ PM listeners who feel the programs do a poor job.
• Compared with last year, fewer listeners of The World Today feel the program does a good job. However this is mainly because fewer have an opinion on this issue, rather than more listeners having a negative view about the program.
1. Those who claim to 'ever' watch / listen to the respective programs.

43 41 44
40
48 46 47 46 47 45 41
45 42 45
39 43 43 45
39 41 36 40
44 42 44 47 44
40 42 38 39
46 41
45 48 41
95 94 96 95 94 92 91 92 90 89 90 90 88 90 87 87 89 87
82 85 89
85 87 90
85 86 84 83 83 88 86 85 84 85 86
80
3 3 2 3 3 4 5 4 6 7 6 6 8 4 6 7 5 8
4 3 1 3 4 2 4 4 6 3 2 1 2 1 3 2 4
100
80
60
40
20
0
20
40
60
80
100
07 08 09 10 11 12 13 14 15 07 08 09 10 11 12 13 14 15 07 08 09 10 11 12 13 14 15 07 08 09 10 11 12 13 14 15
%
VERY GOOD JOB QUITE GOOD JOB VERY POOR JOB QUITE POOR JOB
ABC program does a good / poor job of being balanced and even handed
Thinking now about the extent to which ABC programs are balanced and even handed. For each of the following, please tell me if you personally think they do a good job or a poor job of being balanced and even handed when reporting news and current affairs. Firstly…
BASE: AGED 14+ NATIONALLY: WATCH / LISTEN TO SPECIFIC PROGRAM: ABC 7PM NEWS (n=1340, 1305, 1324, 1284, 1126, 1082, 1053, 1070, 1121), 7.30 (n=1237, 1266, 1261, 1231, 1046, 998, 1004, 1002, 1042),
AM / PM (n=690, 627, 681, 728, 679, 613, 647, 629, 687), WORLD TODAY (n=516, 500, 540, 540, 509, 432, 481, 460, 512)
GOOD JOB
POOR JOB
Total good
Very good
Total poor
Very poor
ABC 7PM NEWS 7:30 REPORT / 7:30# AM/PM THE WORLD TODAY
2 3 2 3 3 4 4 4 4 4 5 4 4 5 7 6 5 5 15 13 10 12 9 8 10 9 11 14 15 11 11 15 15 12 12 16
#PRIOR TO 2011 KNOWN AS 7:30 REPORT
NEITHER / DON’T KNOW
41
FIGURE 23
POOR JOB
*
Statistically significant change: Noted prior to 2015 wave Noted with 2015 wave
* LESS THAN 0.5 PERCENT