abasyn journal of social sciences. 8(2) volatility
TRANSCRIPT

Abasyn Journal of Social Sciences. 8(2)
Rafay, Gilani, Naeem, & Ijaz 298
Volatility Modeling for Spot and Futures of Crude Oil – Evidence
from Pakistan
Abdul Rafay
Associate Professor, Department of Finance @ SBE, University of Management
& Technology (UMT),
Usman Javed Gilani
Assistant Professor, Department of Finance @ SBE, University of Management
& Technology (UMT),
Muhammad Abu Bakar Naeem
MS Scholar, University of Management & Technology (UMT),
Maham Ijaz
MS Scholar, Department of Finance @ SBE, University of Management &
Technology (UMT)
Abstract In this article, we study the volatility of Spots and Futures of Crude Oil
using daily data from the period 2010-2013. We examine both the
Crude Oil Spots and Crude Oil Futures traded on the Pakistan
Mercantile Exchange. Our main findings suggest that (1) shocks tend
to persist over a long period of time for both Crude Oil Spots and
Crude Oil Futures; and (2) shocks have asymmetric effect on the
volatility. Hence our findings indicate that behavior of Crude Oil Spots
prices and Crude Oil Future prices tends to vary over time.
Keywords: Asymmetry, Crude Oil, EGARCH, Shock Persistence, Volatility
During last 20-30 years, crude oil has obtained the position of
leading traded commodity in the world. It accounts for about 10% of
world trade and is considered as one of the most significant and active
commodity market (Verleger, 1993). Crude oil is playing a significant
role in economy, as two-third of energy demands in the world is covered
by crude oil. As far as market dealing is concerned, crude oil is traded
under a variety of contract agreements including spots as well as futures.
Crude oil has generally found to be traded nearer the time of production,
and is transported at the time when oil runs from the stocking terminal
towards the ship point of free on board (FOB). Thus, prices as spot ones
are estimated for instant delivery of commodity (oil) as prices on FOB.
In international trading four major benchmark of oil in these days are: (1)
WTI; named as West Texas Intermediate, USA reference crude oil, (2)
Brent, as North Sea reference crude oil, (3) Dubai, as Middle East as well
as Far East benchmark for crude oil, (4) Tapis, as Asia-Pacific region’s
benchmark for crude oil.
Uncertainty is considered as a significant issue in the field of
finance and generally found to be non-measureable, so the externalities
effect of volatility markets as well. As a result, a term, volatility
spillover, occurs. Volatility spillover happens when changes in volatility
within one market produce a lagged impact on volatility occurring in
some other markets, over and above restricted effects.

Abasyn Journal of Social Sciences. 8(2)
Rafay, Gilani, Naeem, & Ijaz 299
The capacity of the unpredictability implied by option prices to
predict future precariousness is considered a measure of the information
content of option prices. It has been repeatedly verified in the literature
and the results have been slightly mixed. In general, the results of the
studies on information content of implied unpredictability offer adequate
indication of its efficiency and greater predictive ability. However,
implied unpredictability is an upward-biased interpreter of future realized
unpredictability, such that the implied unpredictability is on average
higher than the realized unpredictability. One of the possible
clarifications for the bias in implied unpredictability is the presence of an
unpredictability risk premium.
When unpredictability forecast is produced, the participants of
energy market identify the most exact estimate yield by model. It also
finds whether the complex time series models contribute any significant
unpredictability information beyond that contained in option prices. Day
& Lewis (1993) describes relative facts and predictive influence of
implied unpredictability and ARCH-type forecast forecasts for crude oil
future prices. Duffie & Gray (1995) link the forestalling precision of
ARCH type models, Markov switching models, and implied uncertainties
for natural gas markets, heating Oil and crude oil.
In order to forecast of volatility in energy sector, participants
have to pick up which model is accurate for the forecasting of data and
also take into consideration whether the respective model under
consideration (like time series models), depicts any information
regarding volatility that includes the option prices. Day & Lewis (1993)
performed ARCH- type forecasts for crude oil futures and implied
volatility in comparison with the information content and forecasted
power. A study conducted by Xu & Taylor (1996) shows that currency
options market for forecasting is checked by the efficiency of PHLX.
Regarding volatilities of crude oil and natural gas markets Duffie & Gray
(1995) conducted study work by using accuracy of Markov switching
models and ARCH type models.
The generalized autoregressive conditional model is widely used
to define the concept of uncertainty. The volatility modeling is plays a
significant role in hedging, price derivatives and handling risk.
Most of the published researches about volatility modeling focus
on bond, equity and exchange rate markets and pays little attention on
commodities markets. Studies revealed that since 1980s, volatility in
prices of crude oil is significantly higher than other energy products
(Regnier, 2007). Because of its importance in overall economy, large
fluctuations in oil prices adversely impacts not only macro economy but
also financial markets (Sharma et al., 1998). The purpose of this article is
to determine the model volatility of crude oil spots and futures by using
the ARCH/GARCH Model.
Abasyn Journal of Social Sciences. 8(2)
Rafay, Gilani, Naeem, & Ijaz 300
Literature Review
A detailed research has been conducted on modeling volatility
particularly in financial markets. It is an area of interest for the
researchers because it helps the researchers for managing risks,
derivatives pricing, hedging, portfolio selection and poliy makking.
However, understanding the volatility factor in crude oil price is critical.
Tenacious variations in volatility can create risks for the investors, and
thus investment in oil inventories will be at a crucial stage. Volatility is a
significant perspective of derivative valuation, investment and decisions
regarding tied to the consumption as well as production of natural oil
(Pindyck, 2004).
Federer (1996) states as the crude oil becomes more volatile, it
creates more uncertainty, thus causing economic instability for the
countries heavily engaged in oil trading (import/export). One mechanism
states that there are symmetric effects of shocks in oil price; positive
shocks cause reduction in economic growth, however, negative shocks
increase growth. Hamilton (1983) considered the period after Second
World War up to 1973 and found that economic activity of that period
was strongly correlated with oil prices. This relationship had been
weakened after crisis. Hooker (1996) found out the reduced linear
relationship between oil prices and those of economic activities since
1973. The mechanism that explains the asymmetry in the relationship of
oil prices with that of economic activities lies in the theories regarding
investment as well as real options (Bremnan & Schwertz, 1985;
Bremnan, 1990).
Some studies investigate the direct effects of uncertainty in oil
price on the economic activities. Pindyck (1991) considered many
uncertainty issues and stated that recessions of 1980 and 1982 may have
been subsidized due to these uncertainties in oil prices. Federer (1996)
found that uncertainty in oil prices had unfavorably exaggerated output
in United States from 1970 to 1990. Edelstein & Kilian (2007) and
Kilian & Vigfusson (2009) found slight evidence of asymmetries caused
due to uncertainty effect. It has been studied that demand shocks, uneven
investment and lethargic energy production could be the reasons for oil
price jumps (Wirl, 2008). The uncertainty in oil prices elucidates two
features of oil prices and output relationship. One is the failure of mid
1980s vivid oil prices drop to produce rapid growth in output. Other is
the failure of increased oil prices from 2002 to 2008 for reducing
recession more eagerly (Serletis & Elder, 2010).
It has also been researched that the variations in oil prices at
international level has an impact on various macroeconomic factors such
as; inflation, GDP, growth as well as exchange rates, stock markets
(Davis & Haltiwanger, 2001; Hooker, 2002). Guo & Kliesen (2006) used
the daily crude oil futures traded in NYMEX and described the results
that oil price volatility measures of 1984 to 2004 had adverse and
substantial effect on U.S macro-economic measure; like consumption,

Abasyn Journal of Social Sciences. 8(2)
Rafay, Gilani, Naeem, & Ijaz 301
fixed investment and employment rates. This depicts that increased
prices of crude oil matters less than increased volatility. Kilian (2008)
reviewed that shocks in prices of oil and transmission of these shocks
through channels has a noteworthy impact on U.S as well as global
economy. However, speculation has played an important role in sharp
increase in prices. These speculative behaviors have also been reported
by Gaballero et al. (2008) and Hamilton (2009) in crude oil prices
projection processes.
The volatility of oil prices over past years has increased interest
regarding relationship of oil prices with economy as well as monetary
markets. Chenn et al. (1986) contended no impact of oil prices towards
the stock prices trends. However, Jones & Kaul (1996) stated that impact
of oil prices in stock returns vary country to country, depending upon the
production and consumption level of oil. They also found that post war
period increase in prices of oil had a noteworthy influence on stock
returns. Sadorsky (1999) reported that increase in prices of oil has a
noteworthy negative effect on U.S. stocks. Driesprong et al. (2008)
studied if stock prices are predicted by the changes in oil prices. They
found that sensitivity to changes in oil prices vary from country to
country. Park & Ratti (2008) found that oil prices have a greater role in
the stock market of countries specialized in importing oil. Here stock
markets are less affected by oil price changes.
On hypothetical grounds, shocks in prices of oil exert an effect
on stock market returns by exerting their impact on predictable earnings
(Jones et al., 2004). Pollet (2002) and Driesprong et al. (2008) reported
that globally, variations in oil-price found to have prediction about stock
market returns. Some researchers reported that volatility in oil-price has
proved to have a negative impact on stock prices (Apergis & Miller,
2008). In another study, there has been found negative correlation
between price and volatility that proved tobe a better forecasting result
for changes in prices of crude oil (Morana, 2011).
Various models have been used previously by the researches to
analyze the volatility in crude oil markets. A sophisticated econometric
model has been used by Humington (1994) in 1980s. Another model
named as probabilistic one has been applied by Abranson & Finiza
(1995) for oil prices prediction. Morona (2001) worked on forecasting
short-term oil prices, based on crude oil price GARCH properties, using
semi-parametric statistical method. Similarly, VAR (value at risk) model
has been used for U.S oil price prediction (Mirmrani & Li, 2004). Error
correction model (ECM) has also been used by Lanza et al. (2005) for
projecting crude oil as well crude oil products’ prices.(Bekiros & Diks,
2008)
Various experiments have, however, revealed that using these
econometric traditional models might decrease the forecasting
performance. The reason lies in the phenomena that these models are
based on linear assumptions and are unable to cover non-linear patterns

Abasyn Journal of Social Sciences. 8(2)
Rafay, Gilani, Naeem, & Ijaz 302
in price series of crude oil. Thus, ARCH/GARCH approach covering
various models has been put forward for the projection of crude oil
prices.
Day & Leiwis (1993) compared volatility predictions/ forecasts
of oil prices using GARCH and EGARCH, along with implied and
histoical volatility. They reported the results showing both implied along
with EGARCH or GARCH as conditional volatilities provides the
information about volatility. Morana (2001) and Sadorsky (2002) stated
that ARMA & ARCH type models tend to forecast quite accurately, as
they cover linear as well as non-linear time series models. But if the data
under study is non-linear and chaotic for projecting oil prices process,
linear and non-linear models do not appear to be ideal. This is because;
the parametric ARCH type models will have changing means and
variances in such a situation. Some researchers neglected those structural
breaks in GARCH parameters that tend to induce upward partialities in
estimating GARCH based conditional volatility persistence (Arouri et al.,
2010).
Sadorsky (2006) preferred univariate, state-space as well as
bivariate models for crude oil price predictions. He concluded GARCH
with single equation to outperform other models for the prediction of oil
price futures. A period from 1991 to 2006 has been examined by
Narayan & Narayan (2007) for conditional volatility projection of crude
oil prices through ARCH-GARCH methods and reported enduring and
asymmetric effects of price shocks on volatility. Marzo & Zagagli (2007)
researched on predicting crude oil prices based on closing-day futures
traded in NYMEX, using linear GARCH models. These volatility models
had been compared in the study and results depicted that EGARCH and
GARCH-G models perform best in underlying scenario. However,
GARCH-G performs best for one to three days ahead short horizon. On
contrary, no model had been identified to be superior for one week
horizon. Agnolucci (2009) worked on the oil futures that are traded in
NYMEX and covered the data up to 2005. He compared implied
volatility model with those of GARCH type models, and concluded that
later performs better than implied volatility models. For forecasting
scenarios, he further suggested that the CGARCH model seems to
perform better than GARCH.
Another study used various GARCH models for forecasting
volatility power of competitive GARCH models. The study compared
standard GARCH, CGARCH (component GARCH), IGARCH
(integrated GARCH) and FIGARCH (fractional integrated GARCH).
Three benchmarks for oil prices had been used, named as WTI (USA),
Dubai (Middle East), Brent (North Sea). The results identified CGARCH
and FIGARCH to be better measures of modeling and projecting the
persistence of crude oil returns volatility, as compared to standard
GARCH and IGARCH(El et al., 2010). Wei et al. (2010) also compared
the aptitude of GARCH type models to predict the volatility in crude oil

Abasyn Journal of Social Sciences. 8(2)
Rafay, Gilani, Naeem, & Ijaz 303
prices and reported that these models outperforms in few areas. Vo
(2009) compared the forecasting ability of four different models: (1) a
Markov switching stochastic volatility (MSSV) model, (2) a stochastic
volatility (SV) model, (3) a GARCH model, and (4) a Markov switching
(MS) model and finally documented that nonlinear GARCH model
outperforms all others. Thus, to model volatility, this article uses
GARCH type models. It covers most recent years related to the prices of
crude oil, as previous researches have proved these models to outperform
all other models.
Data Analysis and Results
The data required for the purpose of analysis is the returns on the
crude oil spots. In order to calculate the returns we use daily spot prices
of crude oil, obtained from Thompson Reuter’s database and the data on
crude oil futures, obtained from PMEX (Pakistan Mercantile Exchange).
We used the closing price of Crude100 future contract as Crude Oil
Futures. The price taken as daily prices is the closing price of each traded
day. For the purpose of modeling, the data on crude oil spots span from
January 4, 2010 to December 31, 2013 – a total of 1,008 observations.
Table 1. Summary Statistics Mean SD Skewness Kurtosis Max Min
Oil Prices 91.598 9.831 -0.157 2.281 113.39 64.78
Oil Futures 92.3999 9.471171 -0.19251 2.36346 113.83 69.54
Table 2. Dickey Fuller Test Returns p-value for Z(t)
Crude Oil Spot 0.0000
Crude Oil Future 0.0000
Table 1 shows that mean price of crude oil over the period 2010-
2013 is $91.58 per barrel. The maximum and minimum prices are
$113.39 and $64.78 respectively. The mean price of crude oil futures is
$92.4 with the standard deviation of $9.47. The maximum price of oil
futures is $113.83 and the minimum price of $69.54. The summary
statistics table also shows us that the return series has kurtosis greater
than 2, indicating the presence of fat tails. It is also analyzed that both the
prices and the return series are not normal. Table 2 shows the Dickey
Fuller test on the crude oil spot and 1-month future contracts returns
series. From that we see that the return series is stationary, which is
required for time series analysis.
Abasyn Journal of Social Sciences. 8(2)
Rafay, Gilani, Naeem, & Ijaz 304
60
80
100
120
Pri
ce
01jan2010 01jan2011 01jan2012 01jan2013 01jan2014Date
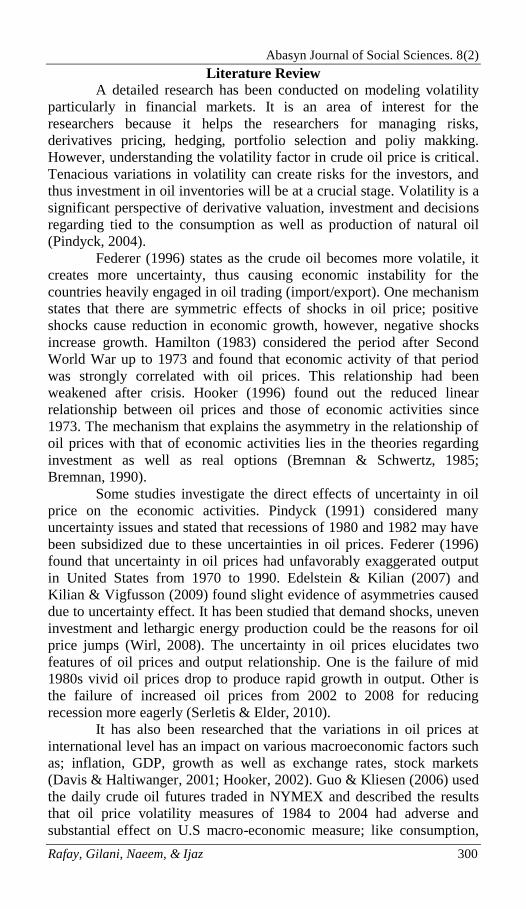
Figure 1. Line Plot of Crude Oil prices
70
80
90
100
110
Clo
se
1-Jan-10 1-Jan-11 1-Jan-12 1-Jan-13 1-Jan-14Trading Date
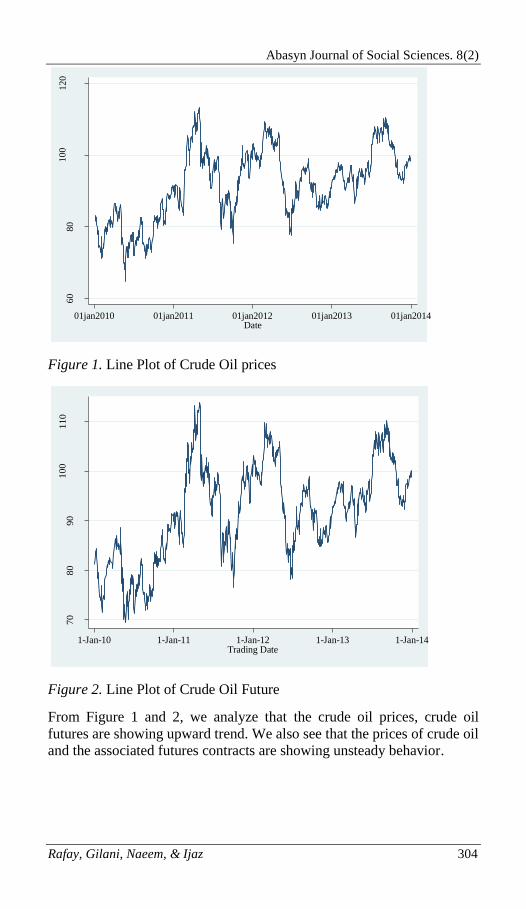
Figure 2. Line Plot of Crude Oil Future
From Figure 1 and 2, we analyze that the crude oil prices, crude oil
futures are showing upward trend. We also see that the prices of crude oil
and the associated futures contracts are showing unsteady behavior.

Abasyn Journal of Social Sciences. 8(2)
Rafay, Gilani, Naeem, & Ijaz 305
-.1
-.05
0
.05
.1rp
01jan2010 01jan2011 01jan2012 01jan2013 01jan2014Date
Figure 3. Line Plot of Returns (Crude Oil Spots)
-.1
-.0
5
0
.05
.1rp
1-Jan-10 1-Jan-11 1-Jan-12 1-Jan-13 1-Jan-14Trading Date
Figure 4. Line Plot of Returns (Oil Futures)
Figure 3 and 4 shows the line plot for returns, from that we also get the
evidence of volatility clustering i.e. periods of high volatility are
followed by periods of serenity.

Abasyn Journal of Social Sciences. 8(2)
Rafay, Gilani, Naeem, & Ijaz 306
Model
Following is the representation of returns of crude oil spots
Where the price of crude is oil and is the previous day
price of crude oil. We calculated returns by subtracting the log of prices
at the beginning of the period from the log of prices at the end of period.
To test the conditional heteroskedasticity we used the ARCH-
LM test of squared residuals. The ARCH-LM test indicates the presence
of conditional heteroskedasticity. We observe Null hypothesis of arch-lm
test based on ARMA; we observe statistics and reject null hypothesis
which is NO ARCH effect. Therefore we suggest return series is
hetroskedasticity. EGARCH model suggested by Nelson (1991) is used
which is an extension of the GARCH model in order to model the
volatility of oil price spots and oil price futures. A conditional normal
distribution is assumed having the following mean and variance
equations:
Mean Equation
Variance Equation
We favor the EGARCH model because it does not impose
restrictions on , and . EGARCH allows for more natural
interpretation of size and persistence of shocks.The estimate evaluates
whether shocks are persistent or not. confirms stationarity,
which is required for the analysis of time series data.The parameter
captures the asymmetric volatility. If , then positive shocks give
rise to higher volatility.The magnitude of conditional shocks on
conditional variance is represented by .

Abasyn Journal of Social Sciences. 8(2)
Rafay, Gilani, Naeem, & Ijaz 307
Empirical Findings
We notice that for both crude oil spots and crude oil futures, our
coefficient is positive and significant at 1%. Hence we can say that the
positive shocks have more impact on volatility, whereas negative shocks
impact less on the volatility of crude oil spots and crude oil futures. This
also shows that shocks have asymmetric effect on crude oil prices as both
negative and positive shocks have different impact on the volatility.
Co-efficient that captures persistence of shocks, is positive and
statistically significant at 1%. The value of the coefficient 0.66 for crude
oil spots and 0.79 for crude oil futures suggests that the shocks tend to
persist over long period of time. It is noticed that the value of the
coefficient is close to 1, which indicates that the shocks to the volatility
do not die out rapidly. It also indicates that shocks have permanent effect
on the volatility. The value of coefficient is -.146 for crude oil spots
and -0.437 for crude oil futures, which indicates the magnitude of the
conditional shocks. Negative sign can be eliminated as it is the
magnitude. The coefficient for crude oil futures is not statistically
significant. Hence have a little or no impact on the model. In view of the
foregoing, it is clearly evident that shocks to crude oil spots and crude oil
futures volatility have asymmetric and persistent effect.
Conclusion
This purpose of this paper is to model the volatility of the crude
oil spots and crude oil futures. To model the volatility we used EGARCH
(exponential GARCH) model which is an extension of the GARCH
model. The aim was to check whether shocks have asymmetric and
persistent effects on volatility. Our results indicate that shocks have
asymmetric effect on the volatility of crude oil spots as well as the
volatility of the crude oil futures. Our results suggest that prices are not
stable. Our findings confirm that negative shocks that give rise to the oil
prices are not fully compensate for by the positive shock that reduces the
oil price. The effects from the shocks tend to be persist over a long
period of time. Also when modeling the oil prices we need to keep in
mind about the regime shifts. Hence whether there is political or
economic shift, there will be impact on the volatility of crude oil, which
will lead to the increase or decrease of the price of crude oil, depending
whether the shocks are of positive or negative nature.
Table 3. Parameters of Mean Equation (ARMA)
Oil Price Oil Futures
C 0.0001786
0.0002487
(0.0005496)
(0.000576)
δ1 `-0.8481145***
`-1.384666*
(.4828056)
(0.0209378)

Abasyn Journal of Social Sciences. 8(2)
Rafay, Gilani, Naeem, & Ijaz 308
δ2
`-0.9584329*
(0.0216773)
ϑ1 0.8379404***
1.335637*
(.4946124)
(0.0318677)
Θ2
0.9178685*
(0.0314334)
Note: ***, **, * indicate statistical significance at 10%, 5% and 1%.
Standard Error in Parenthesis.
Table 4. Parameters of Variance Equation (EGARCH)
Oil Price Oil Futures
Ω `-2.742574*
`-1.678011**
(0.9090799)
(0.8227037)
`-0.14567*
-0.0437722
(0.03768)
(0.0335897)
0.4680849*
0.5983219*
(0.0558665)
(0.0508991)
0.6630586*
0.7906651*
(0.1117893)
(.1025825)
Note: ***, **, * indicate statistical significance at 10%, 5% and 1%.
References
Agnolucci, P. (2009). Volatility in crude oil futures: A comparison of the
predictive ability of GARCH and implied volatility models. Energy
Economics, 31, 316–321.
Apergis, N., & Miller, S. M. (2008). Do Structural Oil-Market Shocks Affect
Stock Prices? Department of Economics Working Paper Series.
Bekiros, S. D., & Diks, C. G. H. (2008). The relationship between crude oil spot
and futures prices : Cointegration , linear and nonlinear causality, 30, 2673–
2685.
Brennan, M. (1990). Latent assets. Journal of Finance, 45, 709-730.
Brennan, M., & Schwartz. E. (1985). Evaluating Natural Resource Investment.
Journal of Business, 58, 1135-1157.
Chen, N. F., Roll, R., & Ross, S. A. (1986). Economic Forces and the Stock
Market. Journal of Business, 59, 383-403.
Cheong, C.W. (2009). Modeling and forecasting crude oil markets using ARCH-
type models. Energy Policy, 37, 2346-2355.
Davis, S. J., & Haltiwanger, J. (2001). Sectoral Job Creation and Destruction
Responses to Oil Price Changes. Journal of Monetary Economics, 48, 465-
512.
Day, T. E., & Lewis, C.M. (1993). Forecasting futures market volatility. Journal
of Derivatives, 1, 33-50.
Driesprong et al. (2008). Striking oil: Another puzzle? Journal of Financial
Economics, 89, 307-327.
Duffie D., & Gray S. (1995). Volatility in Energy Prices: Managing Energy
Price Risk. RiskPublications London, pp. 39 - 55.

Abasyn Journal of Social Sciences. 8(2)
Rafay, Gilani, Naeem, & Ijaz 309
El, M., Arouri, H., Nguyen, D. K., & Lahiani, A. (2010). Forecasting the
conditional volatility of oil spot and futures prices with structural breaks
and long memory models, 2 - 33.
Elder, J., & Serletis, A. (2009). Oil price uncertainty in Canada. Energy
Economics, 31(6), 852–856.
Ferderer, J.P. (1996). Oil Price Volatility and the Macroeconomy.Journal of
Macroeconomics, 18, pp. 1-26.
Guo, H., & Kliesen, K. L. (2005). Oil Price Volatility and U . S .
Macroeconomic Activity, 669–684.
Hamilton,J. D. (2009). Causes and Consequences of the Oil Shock of 2007‐08,
Brookings Papers on Economic Activity, 215-259.
Hooker, M.A. (1996). What Happened to the Oil Price-Macroeconomy
Relationship? Journal of Monetary Economics, 38, 195-213.
Hooker, M. A. (2002). Are Oil Shocks Inflationary? Asymmetric and Nonlinear
Specifications versus Changes in Regime. Journal of Money, Credit and
Banking, 34, 540-561.
Jones, C. M., & Kaul, G. (1996). Oil and the Stock Market. Journal of Finance,
51, 463-491.
Jones, D. W., Leiby, P. N.,& Paik, I. K.(2004). Oil price shocks and the
Macroeconomy: What has been learned since 1996.The Energy Journal, 25,
1-32.
Kilian, L. (2007). The Impact of Oil Price Shocks on the U . S . Stock Market, 1
- 35.
Kilian, L., &Vigfusson, R. (2009). Are the Responses of the U.S. Economy
Asymmetric in Energy Price Increases and Decreases? Working Paper,
University of Michigan.
Marzo, M., & Zagaglia, P. (2007). Volatility forecasting for crude oil futures, 2 -
33.
Morana, C. (2001). A semiparametric approach to Short-Term Oil Price
Forecasting. Energy Economics 23, 325-338.
Narayan, P. K., & Narayan, S. (2007). Modelling oil price volatility. Energy
Policy, 35(12), 6549–6553.
Park, J. W., & Ratti, R. A. (n.d.) (2007). Oil price shocks and Stock markets in
the U . S . and 13 European Countries, 1 - 31.
Pollet, J. (2002). Predicting Asset Returns with Expected Oil Price Changes.
Working Paper, Harvard University.
Regnier, E. (2006). Oil and Energy Price Volatility. Energy Economics 29, 405 -
427.