abacus storage operations limited and its controlled ... · appendix 4e abacus property group...
TRANSCRIPT

Appendix 4E
Abacus Property Group (comprising Abacus Group Holdings Limited and its controlled entities, Abacus Trust and its controlled entities, Abacus Income Trust and its controlled entities, Abacus Group Projects Limited and its controlled entities, Abacus Storage Property Trust and its controlled entities and Abacus Storage Operations Limited and its controlled entities)
ABN: 31 080 604 619
Annual Financial Report For the year ended 30 June 2012
Results for announcement to the market (corresponding period: year ended 30 June 2011) (1)
Total revenues and other income down 16% to $253.5m
Net profit after income tax expense attributable to stapled security holders down 70% to $8.47m
Underlying profit (2) up 7% to $76.8m
(1) Certain numbers shown here do not correspond to the 2011 financial statements as they reflect required adjustments resulting from the
adoption of AASB10.
(2) The underlying profit reflects the statutory profit / (loss) as adjusted in order to present a figure which reflects the Directors’ assessment of the result for the ongoing business activities of the Group, in accordance with the AICD / Finsia principles for reporting underlying profit. Adjustments have been adjusted for the fair value of investments held at balance date.
30 June 2012 30 June 2011$'000 $'000
Consolidated statutory net profit after tax attributable to members of the Group 8,470 28,587 less: consolidated profits/(losses) relating to Abacus Hospitality Fund, Abacus Storage FundAbacus Diversified Income Fund II and Abacus Miller Street Holding Trust (includes a netloss in fair value of derivatives of $19.1 million) (16,033) 11,237
Net profit attributable to ABP securityholders 24,503 17,350
Certain significant items:Net change in fair value of investment properties held at balance date 4,958 6,158 Net loss in fair value of investments and financial instruments held at balance date 1,908 16,285 Net loss in fair value of derivatives 35,205 8,458 Net change in fair value of property, plant and equipment, inventory and investment properties included in equity accounted investments 4,707 7,900 Costs relating to the merger and restructuring of managed funds 5,564 16,000
Underlying profit attributable to ABP securityholders 76,845 72,151
Basic earnings per security (cents) 2.11 7.68Basic underlying earnings per security (cents) 19.17 19.38 Distribution per security (cents - including proposed distribution) 16.50 16.50Weighted average securities on issue (million) 400.9 372.3
For
per
sona
l use
onl
y

Abacus Property Group Appendix 4E
2
Distributions
Record date for determining entitlement to the distributions 12 July 2012
8.25 centsJune 2012 half
This distribution was declared on 2 July 2012 and was paid on 15 August 2012
per stapled security
Refer to the attached announcement for a detailed discussion of the Abacus Property Group's results and the above figures for the
year ended 30 June 2012.
Total
Half December 2011 distribution $32.0 m
credits attached.
paid 13 March 2012
per stapled security
8.25 cents
The distributions were paid in full by Abacus Trust and Abacus Income Trust which do not pay tax, hence there were no franking
Details of individual and total distribution payments
Net tangible assets per security (3)$2.51$2.34
30 June 201130 June 2012
(3) Net tangible assets per security excludes the external non-controlling interest.
- Abacus Hospitality Fund
- Abacus Diversified Income Fund II
- Abacus Miller Street Holding Trust
The Group also merged with Abacus Storage Fund on 6 March 2012. The Abacus Storage Fund had been previously consolidated
by the Group following the adoption of AASB10.
The Group has consolidated the following entities during the period following the adoption of AASB10, 11 and 12:
Details of associates and joint venture entities
30 June 2012 30 June 2011 30 June 2012 30 June 2011
% % $'000 $'000
Abacus Aspley Village Trust 33 33 515 (9,631)
Abacus Colemans Road Trust 50 50 151 575
Abacus Wodonga Land Fund 15 15 - (1,195)
Fordtrans Pty Ltd (Virginia Park) 50 50 4,543 4,077
Hampton Residential Retirement Trust 50 50 (138) 1,241
Jigsaw Trust 50 50 2,069 505
Other investments 25 - 50 50 239 (1,982)
7,379 (6,410)
Ownership Interest Share of net profit/(loss)
The above equity accounted net profits and losses are predominantly due to fair value movements in the respective entities inwhich the Group has co-invested.
For
per
sona
l use
onl
y

Abacus Property Group Appendix 4E
3
Distribution Reinvestment Plan (DRP) The Abacus Property Group DRP allows securityholders to reinvest their distributions into APG securities at a discount to the market price. Information on the terms of the DRP is available from our website www.abacusproperty.com.au.
Securityholders wishing to participate in the DRP may lodge their election notice at any time. The record date for determining entitlements to each distribution is also the record date for participation in the DRP for that distribution.
For
per
sona
l use
onl
y

Abacus Property Group ABN 31 080 604 619
Annual Financial Report For the year ended 30 June 2012
For
per
sona
l use
onl
y

ABACUS PROPERTY GROUP
1
ANNUAL FINANCIAL REPORT 30 June 2012
Directory
Abacus Group Holdings Limited Directors of Responsible Entities and ABN: 31 080 604 619 Abacus Group Holdings Limited: John Thame, Chairman Abacus Group Projects Limited Frank Wolf, Managing Director ABN: 11 104 066 104 William Bartlett David Bastian Abacus Storage Operations Limited Malcolm Irving ABN: 37 112 457 075 Myra Salkinder Abacus Funds Management Limited Company Secretary: ABN: 66 007 415 590 Ellis Varejes Abacus Storage Funds Management Limited Auditor (Financial and Compliance Plan): ABN: 41 109 324 834 Ernst & Young Ernst & Young Centre Registered Office 680 George Street Level 34, Australia Square SYDNEY NSW 2000 264-278 George Street SYDNEY NSW 2000 Share Registry: Tel: (02) 9253 8600 Boardroom Pty Ltd Fax: (02) 9253 8616 Level 7, 207 Kent St Website: www.abacusproperty.com.au SYDNEY NSW 2000 Tel: 1300 737 760 Custodian: Fax: 1300 653 459 Perpetual Trustee Company Limited Level 12 Angel Place 123 Pitt Street SYDNEY NSW 2000
CONTENTS DIRECTORS’ REPORT 2
AUDITORS INDEPENDENCE DECLARATION 23
CONSOLIDATED INCOME STATEMENT 24
CONSOLIDATED STATEMENT OF OTHER COMPREHENSIVE INCOME 25
CONSOLIDATED STATEMENT OF FINANCIAL POSITION 26
CONSOLIDATED STATEMENT OF CHANGES IN EQUITY 28
CONSOLIDATED STATEMENT OF CASH FLOW 29
NOTES TO THE FINANCIAL STATEMENTS 30
DIRECTORS’ DECLARATION 115
INDEPENDENT AUDIT REPORT 116
It is recommended that this Annual Financial Report should be read in conjunction with the Annual Financial Report of Abacus Trust, Abacus Group Projects Limited, Abacus Income Trust, Abacus Storage Property Trust and Abacus Storage Operations Limited as at 30 June 2012. It is also recommended that the report be considered together with any public announcements made by the Abacus Property Group in accordance with its continuous disclosure obligations arising under the Corporations Act 2001.
For
per
sona
l use
onl
y
ABACUS PROPERTY GROUP
2
DIRECTORS’ REPORT 30 June 2012
The Directors present their report for the year ended 30 June 2012.
PRINCIPAL ACTIVITIES
Abacus Property Group operates predominantly in Australia and its principal activities during the course of the year ended 30 June 2012 included:
• investment in commercial, retail and industrial properties;
• investment in self-storage facilities:
• participation in property ventures and developments; and
• property funds management.
ABP GROUP STRUCTURE (Listed entities)
On 24 February 2012 securityholders in both ABP Group (listed group) and Abacus Storage Fund (“ASF”), an unlisted fund managed by Abacus Storage Funds Management Limited as responsible entity agreed to merge the two groups effective 6 March 2012. The merger resulted in the shares in Abacus Storage Operations Limited (“ASOL”) and the units in Abacus Storage Property Trust (“ASPT”) being stapled to the shares in Abacus Group Holdings Limited (“AGHL”) and Abacus Group Projects Limited (“AGPL”) and to the units in Abacus Trust (“AT”) and Abacus Income Trust (“AIT”). The resulting stapled security is listed on the Australian Securities Exchange (ASX: ABP).
The ABP Group is now comprised of AGHL, AT, AGPL, AIT, ASOL and ASPT. Shares in AGHL, AGPL and ASOL and units in AT, AIT and ASPT have been stapled together. An ABP security comprises one share in AGHL, one unit in AT, one share in AGPL, one unit in AIT one share in ASOL and one unit in ASPT. A transfer, issue or reorganisation of a share or unit in any of the component parts requires while they continue to be stapled, a corresponding transfer, issue or reorganisation of a share or unit in each of the other component parts.
AGHL, AGPL and ASOL are companies incorporated and domiciled in Australia. AT, AIT and ASPT are Australian registered managed investment schemes. Abacus Funds Management Limited (“AFML”) is the Responsible Entity of AT and AIT and Abacus Storage Funds Management Limited (“ASFML”) is the Responsible Entity of ASPT. Both AFML and ASFML are incorporated and domiciled in Australia and are wholly-owned subsidiaries of AGHL.
ABACUS PROPERTY GROUP CONSOLIDATION
During the year the Directors adopted AASB10 – Consolidated Statements, AASB11 – Joint Arrangements and AASB12 – Disclosure of Interests in Other Entities. The application of AASB10 has led to the consolidation of Abacus Diversified Income Fund II, Abacus Hospitality Fund, Abacus Storage Fund and Abacus Miller Street Holding Trust by the ABP Group. This is due to the combination of ABP’s role as responsible entity, variable returns arising from its collective equity and loan investments in these funds and certain guarantees. The standards are applied retrospectively as at 1 July 2010 and the comparative balances have been adjusted accordingly. The total impact of consolidating the funds was a net reduction of $93.5 million to the 1 July 2010 retained earnings (see note 2 of the financial statements).
AGHL has been identified as the parent entity of the group referred to as the Abacus Property Group (“APG” or the “Group”). The consolidated financial reports of the Group for the year ended 30 June 2012 comprise the consolidated financial reports of AGHL and its controlled entities, AT and its controlled entities, AGPL and its controlled entities, AIT and its controlled entities, ASOL and its controlled entities, ASPT and its controlled entity, Abacus Diversified Income Fund II and its controlled entities, Abacus Hospitality Fund and its controlled entities, Abacus Storage Fund and its controlled entities (until the date of merger) and Abacus Miller Street Holding Trust and its controlled entity. F
or p
erso
nal u
se o
nly

ABACUS PROPERTY GROUP
3
DIRECTORS’ REPORT 30 June 2012
REVIEW AND RESULTS OF OPERATIONS
The Group earned a net profit attributable to members of $8.47 million for the year ended 30 June 2012 (2011: $28.59 million). This profit has been calculated in accordance with Australian Accounting Standards and includes certain significant items that need adjustment to enable securityholders to obtain an understanding of the ABP Group’s underlying profit of $76.8 million (2011: $72.2 million).
The Underlying Profit reflects the statutory profit as adjusted in order to present a figure which reflects the Directors’ assessment of the result for the ongoing business activities of the ABP Group, in accordance with the AICD / Finsia principles for reporting Underlying Profit. The following table is unaudited:
2012 2011$'000 $'000
Consolidated statutory net profit after tax attributable to members of the Group 8,470 28,587 less: consolidated profits/(losses) relating to Abacus Hospitality Fund, Abacus Storage FundAbacus Diversified Income Fund II and Abacus Miller Street Holding Trust (includes a netloss in fair value of derivatives of $19.1 million) (16,033) 11,237
Net profit attributable to ABP securityholders 24,503 17,350
Certain significant items:Net change in fair value of investment properties held at balance date 4,958 6,158 Net loss in fair value of investments and financial instruments held at balance date 1,908 16,285 Net loss in fair value of derivatives 35,205 8,458 Net change in fair value of property, plant and equipment, inventory and investment properties included in equity accounted investments 4,707 7,900 Costs relating to the merger and restructuring of managed funds 5,564 16,000
Underlying profit attributable to ABP securityholders 76,845 72,151
2012 2011Basic earnings per security (cents) 2.11 7.68Basic underlying earnings per security (cents) 19.17 19.38 Distribution per security (cents - including proposed distribution) 16.50 16.50Weighted average securities on issue (million) 400.9 372.3
The reduction in the net profit after tax attributable to members of the ABP Group was principally caused by the falling $A interest rates during the year which at reporting date yielded a fair value loss of $35.2 million on the interest rate swaps ABP uses to fix the cost of its borrowings, managed interest cover covenants and align these borrowings with the net revenue earned by the property portfolio. The fair value loss that the Group incurred, including the managed funds consolidated following the adoption of AASB10, on interest rate swaps used to fix the cost of borrowings was $54.3 million (ABP Group $35.2 million and managed funds $19.1 million).
The ABP Group’s gearing, which includes debt funding the ASF self storage portfolio, increased during the year to 28.6% (2011: 25.8%) which reflects the inclusion of the ASF borrowings. The impact of both year-end fair value adjustments and the Group’s performance on its financial condition were as follows:
2012 2011Total Assets ($ million) 2,106.8 2,120.5 Gearing (%) ^ 28.6 25.8 Net Assets* ($ million) 1,056.9 993.7 Net Tangible Assets* ($ million) 1,016.1 951.4 NTA per security ($) 2.34 2.51 Securities on issue (million) 434.9 378.5 *excluding external non-controlling interests of $51.0 million (2011 $146.7 million)^ABP Group
For
per
sona
l use
onl
y

ABACUS PROPERTY GROUP
4
DIRECTORS’ REPORT 30 June 2012
REVIEW AND RESULTS OF OPERATIONS (continued)
Business activities which contributed to the ABP Group’s operating performance and financial condition for the financial year were:
Property
As at 30 June 2012, the Group had an interest in the following properties:
$’000 No. of properties
ABP Group (listed entities) including 44 self storage properties* 1,118,708 88
Abacus Hospitality Fund^ 156,221 5
Abacus Diversified Income Fund II^ 178,265 24
Abacus Miller Street Holding Trust^ 62,800 1
*Owned by ABP securityholders ^Consolidated per AASB10
Reflecting the stabilisation of market values, the Directors during the year approved a revised valuation policy for the Group that requires all assets to be independently valued at least every two years (previously annually).
The ABP Group investment property portfolio was revalued during the year ended 30 June 2012, which resulted in a net full year devaluation charge of $4.9 million (2011: $6.2 million).
During the year the Group acquired an interest in the following properties:
309 George Street, Sydney (25% indirect ownership) $19m
484 St Kilda Road, Melbourne (25% indirect ownership) $18m
Six properties including Epping Office Park in suburban Sydney were sold by the Group during the year for $97.1 million which realised a gross profit of $10.2 million.
The increase in rental income reflects a full year of income for the properties acquired during the course of the previous year.
Storage
As noted above the Group has 44 self storage properties located on the east coast of Australia and New Zealand. The properties are managed by Storage King.
Revenue earned from storage activities since the merger on 6 March 2012 with the ABP Group was $16.9 million and its contribution to profit before fair value adjustments and finance costs for the same period was $9.6 million.
Trading was consistent during the year with growth in storage rental income driven principally by increased average rental yield across the portfolio. New areas have been added to the portfolio comprising additional units acquired at Lane Cove and construction of a new building at Kambah, ACT
Property Ventures
Total property venture assets at 30 June 2012 were $255.1 million (2011: $270.0 million).
Revenue earned from lending and development activities totalled $26.7 million for the year (2011: $15.1 million) and its contribution before fair value adjustments was $21.2 million (2011: 11.0 million)
The joint venture investments are predominantly with experienced property investors and developers in New South Wales and Victoria. These joint ventures enable the Group to participate in a range of property-related opportunities with participants who have local knowledge and specialist property expertise.
For
per
sona
l use
onl
y

ABACUS PROPERTY GROUP
5
DIRECTORS’ REPORT 30 June 2012
REVIEW AND RESULTS OF OPERATIONS (continued)
Funds Management
The strategic review of the unlisted retail funds announced in August 2011 has been completed and the outcomes were as follows:
- Abacus Storage Fund – the fund merged with the ABP Group;
- Abacus Hospitality Fund – securityholders in general meeting in June 2012 approved the continuation of the managed asset sale strategy;
- Abacus Diversified Income Fund II – continue to actively manage the Fund’s property portfolio;
- Abacus Miller Street Fund – unitholders were advised in May 2012 that a sale of the Fund’s property in North Sydney would be in their best interests; and
- Abacus Wodonga Land – the fund’s bank debt was refinanced for another three years and it was decided to restructure the fees and interest payable by the Fund to improve its capital stability.
SIGNIFICANT CHANGES IN THE STATE OF AFFAIRS
As previously noted the ABP Group and ASF merged on 6 March 2012.
In February 2012 securityholders approved the reallocation of $110 million of capital between the different entities within the ABP Group ($66 million of capital from AT and $44 million of capital from AIT was reallocated to AGHL - $100 million and AGPL - $10 million). The reallocation of capital had no impact on the reported profit of the ABP Group and was undertaken to provide further capital to the companies to support their activities and to reduce their borrowings to more appropriate levels.
The contributed equity of the Group increased $92.2 million to $1,232.0 million compared to $1,139.8 million at 30 June 2011 due to the merger of the ABP Group and ASF and securityholder participation in the distribution reinvestment plan.
Total equity decreased by 2.8% to $1,107.9 million at 30 June 2012 compared to $1,140.4 million at 30 June 2011 principally as a result of adverse interest rate swap mark to market movements.
In December 2011, the ABP Group re-financed its $400 million syndicated bank debt facility that was due to expire in August 2013 with a new tranched $200 million three year and $200 million four year facility with new maturity dates of December 2014 and December 2015, respectively. This materially extended the term of this core banking facility from the previous 2012/2013 refinancing requirements.
The ABP Group also increased its working capital bank debt facility limit with ANZ Bank from $80 million to $100 million. The maturity date of the ABP Group $70 million bilateral facility with ANZ Bank was extended from December 2012 to September 2014.
In April 2012 the ABP Group refinanced its $190 million club bank debt facility (maturing August 2013) over its storage assets with a new tranched $95 million three year and $95 million four year facility maturity dates of April 2015 and April 2016, respectively.
ADIFII renewed its existing $54 million ANZ facility, which had an August 2012 maturity, to September 2014 and Abacus Miller Street Fund extended the term of its ANZ facility to September 2013.
At 30 June 2012, existing bank loan facilities of the ABP Group totalled $789.9 million, of which $567.5 million was drawn. Approximately 97% (2011: 58%**) of bank debt drawn was subject to fixed rate hedges with a weighted average term to maturity of 3 years (2011: 4 years**). At 30 June 2012, 25% of the 97% fixed rate hedge cover related to legacy ASF hedges. Hedge cover as a percentage of available facilities at 30 June 2012 is 69.7% (2011: 41.1%**).
ABP’s weighted average interest rate as at 30 June 2012 was 7.27% (2011: 7.81%**). Line fees on undrawn facilities contributed to 0.39% of the weighted average interest rate at 30 June 2012 (2011: 0.87%**). ABP’s weighted average interest rate excluding the undrawn facilities line fees as at 30 June 2012 was 6.87% (2011: 6.94%**). ** Excludes ASF which merged with ABP Group on 6 March 2012.
For
per
sona
l use
onl
y
ABACUS PROPERTY GROUP
6
DIRECTORS’ REPORT 30 June 2012
DISTRIBUTIONS
ABP Group distributions in respect of the year ended 30 June 2012 were $67.8 million (2011: $61.8 million), which is equivalent to 16.5 cents per stapled security (2011: 16.5 cents). This distribution includes 8.25 cents ($35.9 million) that was paid on 15 August 2012. Further details on the distributions, including distributions by the funds consolidated following the adoption of AASB10 are set out in note 9 of the financial statements.
SIGNIFICANT EVENTS AFTER BALANCE DATE
Other than as disclosed in this report and to the knowledge of directors, there has been no other matter or circumstance that has arisen since the end of the financial year that has or may affect the Group’s operations in future financial years, the results of those operations or the Group’s state of affairs in future financial years.
LIKELY DEVELOPMENTS AND EXPECTED RESULTS
The Group will continue to pursue strategies that seek to improve total security holder returns during the coming year. In the opinion of the Directors, disclosure of any further information on future developments and results than is already disclosed in this report or the financial statements would be unreasonably prejudicial to the interests of the Group.
DIRECTORS AND SECRETARY
The Directors of AGHL, AFML, ASOL and AGPL in office during the financial year and until the date of this report are as follows. Directors were in office for this entire period unless otherwise stated.
John Thame Chairman (Non-executive)
Frank Wolf Managing Director
William Bartlett Non-executive Director (appointed to ASOL on 24 February 2012)
David Bastian Non-executive Director
Malcolm Irving Non-executive Director
Myra Salkinder Non-executive Director
The qualifications, experience and special responsibilities of the Directors and Company Secretary are as follows:
John Thame AIBF, FCPA Chairman (non-executive)
Mr Thame has over 30 years’ experience in the retail financial services industry in senior management positions. His 26-year career with Advance Bank included 10 years as Managing Director until the Bank’s merger with St George Bank Limited in 1997. Mr Thame was Chairman (2004 to 2008) and a director (1997 to 2008) of St George Bank Limited and St George Life Limited. He is also a director of Reckon Limited and The Village Building Co Limited (Group).
Mr Thame is Chairman of the Due Diligence Committee and a member of the Audit & Risk and Remuneration & Nomination Committees.
Frank Wolf OAM, PhD, BA (Hons) Managing Director
Dr Wolf has over 20 years’ experience in the property and financial services industries, including involvement in retail, commercial, industrial and hospitality-related assets in Australia, New Zealand and the United States. Dr Wolf has been instrumental in over $2 billion worth of property related transactions, corporate acquisitions and divestments and has financed specialist property-based assets in retirement and hospitality sectors. He is also a director of HGL Limited, a diversified publicly listed investment company.
For
per
sona
l use
onl
y

ABACUS PROPERTY GROUP
7
DIRECTORS’ REPORT 30 June 2012
DIRECTORS AND SECRETARY (continued)
David Bastian CPA
Mr Bastian is a Non-Executive Director and has almost 40 years’ experience in the financial services industry. He was the Managing Director of the Group until September 2006, Managing Director of the Canberra Building Society for 20 years and an Executive Director of Godfrey Pembroke Financial Services Pty Limited for 7 years.
Mr Bastian is a member of the Due Diligence and Remuneration & Nomination Committees.
Malcolm Irving AM, FCPA, SF Fin, BCom, Hon DLitt
Mr Irving is a Non-Executive Director and has over 40 years’ experience in company management, including 12 years as Managing Director of CIBC Australia Limited. He is also a director of O’Connell Street Associates Pty Ltd and Macquarie University Hospital.
Mr Irving is Chairman of the Audit & Risk and Compliance Committees and a member of the Due Diligence and Remuneration & Nomination Committees.
William J Bartlett FCA, CPA, FCMA, CA(SA)
Mr Bartlett is a Non-Executive Director. As a partner at Ernst & Young for 23 years, he held the roles of Chairman of Worldwide Insurance Practice, National Director of Australian Financial Services Practice and Chairman of the Client Service Board. Mr Bartlett is a director of Suncorp Group Limited, GWA Limited, Reinsurance Group of America Inc and RGA Reinsurance Company of Australia Limited. He is Chairman of the Cerebral Palsy Foundation of Australia.
Mr Bartlett is Chairman of the Remuneration & Nomination Committee and a member of the Due Diligence and Audit & Risk Committees.
Myra Salkinder MBA, BA
Mrs Salkinder is a Non-Executive Director and is a senior executive of the Kirsh Group. She has been integrally involved over many years with the continued expansion of the Kirsh Group’s property and other investments, both in South Africa and internationally. Mrs Salkinder is a director of various companies associated with the Kirsh Group worldwide.
Mrs Salkinder is a member of the Due Diligence and Audit & Risk Committees.
Ellis Varejes BCom, LLB Company Secretary and Chief Operating Officer
Mr Varejes has been the Company Secretary since September 2006. He has over 25 years’ experience as a corporate lawyer in private practice.
As at the date of this report, the relevant interests of the directors in the stapled securities of ABP Group were as follows:
Directors ABP securities held
J Thame 55,364
F Wolf 2,837,464
W Bartlett 22,806
D Bastian 545,000
M Irving 29,063
For
per
sona
l use
onl
y

ABACUS PROPERTY GROUP
8
DIRECTORS’ REPORT 30 June 2012
DIRECTORS AND SECRETARY (continued)
Directors’ Meetings
The number of meetings of directors (including meetings of committees of directors) of AGHL, AFML (the Responsible Entity of AT and AIT), AGPL, ASFML (the Responsible Entity of ASPT) and ASOL, held during the year and the number of meetings attended by each director were as follows:
Audit & Nomination & Risk Remuneration Board Committee Committee Held Attended Held Attended Held Attended
J Thame 18 18 4 4 5 5
F Wolf 18 18
W Bartlett 18 14 4 4 5 5
D Bastian 18 17 5 5
M Irving 18 18 4 4 5 5
M Salkinder 18 14 4 4
Indemnification and Insurance of Directors and Officers
The Group has paid an insurance premium in respect of a contract insuring all directors, full time executive officers and the secretary. The terms of this policy prohibit disclosure of the nature of the risks insured or the premium paid.
ENVIRONMENTAL REGULATION AND PERFORMANCE
The Group is subject to significant environmental regulation in respect of its property activities. Adequate systems are in place for the management of the Group’s environmental responsibilities and compliance with the various licence requirements and regulations. No material breaches of requirements or any environmental issues have been identified during the year. The Group is a core plus investor, not a builder of new buildings. The Group endeavours to choose sustainable options whenever that is a cost-effective outcome.
AUDITORS INDEPENDENCE DECLARATION
We have obtained an independence declaration from our auditor, Ernst & Young, and such declaration is shown on page 22.
NON-AUDIT SERVICES
The following non-audit services were provided by the Group’s auditor, Ernst & Young. The Directors are satisfied that the provision of non-audit services is compatible with the general standard of independence for auditors imposed by the Corporations Act 2001. The nature and scope of each type of non-audit service provided means that auditor independence was not compromised.
Ernst & Young received or are due to receive the following amounts for the provision of non-audit services:
Transactional advisory and other services $262,300
ROUNDING
The amounts contained in this report and in the half-year financial report have been rounded to the nearest $1,000 (where rounding is applicable) under the option available to the group under ASIC Class Order 98/100. The group is an entity to which the Class Order applies.
For
per
sona
l use
onl
y

ABACUS PROPERTY GROUP
9
DIRECTORS’ REPORT 30 June 2012
REMUNERATION REPORT (audited)
This Remuneration Report outlines the director and executive remuneration arrangements of the Group in accordance with the requirements of the Corporations Act and Regulations. For the purposes of this report Key Management Personnel of the Group are defined as those persons having authority and responsibility for planning, directing and controlling the major activities of the Group, directly or indirectly, including any director (whether executive or otherwise) of the parent company, and includes the executives in the Group receiving the highest remuneration.
For the purposes of this report, the term executive encompasses the Managing Director and other senior executives of the Group.
Details of key management personnel (including the highest paid executives of the Group). (i) Non-executive Directors
J. Thame Chairman W. Bartlett Director D. Bastian Director M. Irving Director M. Salkinder Director
(ii) Executive Director
F. Wolf Managing Director (iii) Executives
R. de Aboitiz Chief Financial Officer C. Laird Director Property Ventures J. L’Estrange Director Property Ventures L. Lloyd Managing Director – Property Services P. Strain Director Property E. Varejes Chief Operating Officer
Remuneration at a glance
Base salaries
Base salaries paid to executives did not increase in the year ended 30 June 2012.
Short Term Incentives
Bonuses totalling $1,700,000 are payable to the executives of the Group for the year ended 30 June 2012 as compared with $1,235,500 paid in the previous year. The details of these bonuses are set out in table 1. Bonuses are generally payable only if the underlying net profit target is met. The Group target was exceeded in the current year. The amount of each bonus was determined by reference to the performance of the executive against key performance indicators (KPIs) and other aspects of the executive’s performance considered relevant in the context of the assessment.
Long Term Incentives
Global events impacting on Australia have had the effect that all long term incentives issued under the Group’s Security Appreciation Rights Plan would not deliver value but would nevertheless have a cost to the Group. Accordingly, all rights issued under the plan were cancelled pending the finalisation of changes to the plan that will be introduced in the year ending 30 June 2013. These proposed changes are being discussed with the Group’s independent remuneration consultant and proxy advisers.
For
per
sona
l use
onl
y

ABACUS PROPERTY GROUP
10
DIRECTORS’ REPORT 30 June 2012
REMUNERATION REPORT (audited) (continued)
Board oversight of remuneration
Remuneration & Nomination Committee
The Remuneration & Nomination Committee of the Board of Directors is responsible for making recommendations to the Board on the remuneration arrangements for the non-executive directors and executives.
The Committee must comprise at least three directors with a majority of independent members. The members of the Committee during the year were:
W. Bartlett – Chairman (independent non-executive)
D. Bastian – (independent non-executive)
M. Irving – (independent non-executive)
J. Thame – Ex-officio member (independent non-executive)
Under its charter the Committee must meet at least two times during a year. The Committee met four during the year and the attendance records are set out in the Directors’ Report. The Committee’s charter can be downloaded from the Corporate Governance section of the Group’s website (www.abacusproperty.com.au).
The Committee assesses the appropriateness of the nature and amount of remuneration of non-executive directors and executives on a periodic basis by reference to relevant employment market conditions with the overall objective of ensuring maximum stakeholder benefit from the retention of a quality performing Board and executive team.
Remuneration policy
The performance of the Group depends upon the quality of its directors and executives. To prosper, the Group must attract, motivate and retain highly skilled directors and executives.
The Group’s policy, which supports the achievement of the Group’s overall objective of producing superior performance and growth, is market competitive and designed to reward individual performance and closely align the interests of the executives to those of securityholders through the use of short-term and long-term incentives. To this end, the Group embodies the following principles in its remuneration framework:
• provide competitive rewards assessed against market rates to attract and retain high calibre executives;
• link executive rewards to the Group’s performance; • have a reasonable portion of executive remuneration at risk; and • establish appropriate performance hurdles for the variable components of executive remuneration.
The executives’ remuneration consists of the following key elements: • Fixed remuneration • Variable remuneration
o Short term incentive o Long term incentive
The fixed remuneration component includes base salary, statutory superannuation and non monetary benefits (car parking and the applicable fringe benefits tax). The variable remuneration component includes short term and long term incentives.
The Group aims to ensure that the split of fixed and variable remuneration for executives is appropriate for the type of business that the Group operates, namely a cyclical, mature business which seeks to provide stable income earnings with a high level of distribution to securityholders. This has generally resulted in a higher proportion of fixed remuneration for executives compared to other A-REITs and a lower proportion of variable remuneration. Fixed remuneration for the senior executives did not increase in the year ended 30 June 2012.
For
per
sona
l use
onl
y

ABACUS PROPERTY GROUP
11
DIRECTORS’ REPORT 30 June 2012
REMUNERATION REPORT (audited) (continued)
Security Trading policy
The Group has a security trading policy in place for directors and employees. The policy can be downloaded from the Corporate Governance section of the Group’s website. Trading in the Group’s securities is only permitted within the six week periods commencing on the second trading day after the half-year and full-year results are announced and after the Annual General Meeting. The Chairman may approve trading windows at other times of the year. Trading is not permitted at any time if directors and employees are in receipt of inside information.
Remuneration structure
In accordance with corporate governance best practice, the separate structure of non-executive director and executive remuneration is as follows.
Non-executive director remuneration
Objective
The Board seeks to set aggregate remuneration at a level that enables the Group to attract, motivate and retain directors of the highest calibre, while incurring a cost that is market competitive.
Structure
The Group’s constituent documents and the ASX Listing Rules specify that the aggregate remuneration of non-executive directors must be determined from time to time by securityholders. The last determination was at the annual general meeting held on 12 November 2010 when securityholders approved an aggregate remuneration limit of $800,000 per year. This amount represents a limit on non-executive directors’ total fees, and does not represent the actual fees paid to non-executive directors which are set out in Table 1. The Board continued on its process to review Board’s composition and in October 2011 announced that Mr David Bastian would retire as a director in November 2012. This will reduce the number of directors to five, the majority of which will be independent. The Board believes that it will then have a sufficient complement of experienced directors to manage the Group from that time.
The aggregate remuneration limit and the fee structure are reviewed annually and fees were increased effective from October 2011. The previous increase was in May 2009. The increase in fees took into account advice from the Board’s independent consultants at the time, Deloitte Touche Tohmatsu, and a comparison of the fees paid to non-executive directors of other comparable A-REITs. Guerdon Associates now act as the Group’s independent consultants.
Fees payable, inclusive of superannuation, to non-executive directors are as follows:
Board/Committee Role Fee Board Chairman $191,000 Board Member $71,000 Audit & Risk Committee Chairman $20,000 Audit & Risk Committee Member $10,000 Compliance Committee Chairman $10,000 Due Diligence Committee Chairman $15,000 Due Diligence Committee Member $5,000 Remuneration & Nomination Committee Chairman $12,000 Remuneration & Nomination Committee Member $8,000 Abacus Storage Funds Management Limited Board Member $9,000
The payment of additional fees for serving on a Board committee or on the Board of Abacus Storage Funds Management Limited recognises the additional time commitment required by directors who serve in those capacities.
The non-executive directors do not receive retirement benefits. Nor do they participate in any incentive programs. The remuneration of non-executive directors for the years ended 30 June 2012 and 2011 is detailed in Table 1 of this report.
For
per
sona
l use
onl
y

ABACUS PROPERTY GROUP
12
DIRECTORS’ REPORT 30 June 2012
REMUNERATION REPORT (audited) (continued)
Executive remuneration
Objective
The Group aims to reward executives with a level and mix of remuneration commensurate with their position and responsibilities within the Group so as to:
• reward executives for Group, business unit and individual performance against targets set by reference to appropriate benchmarks;
• align the interests of executives with those of securityholders; and • ensure remuneration is competitive by market standards.
The Group’s key gateway financial measure for variable remuneration is underlying profit, which the Board believes is the appropriate way to ensure that variable remuneration is aligned with the interests of securityholders. The Group does not issue market guidance, but the gateway has been determined by the Board as appropriately challenging.
Structure
In determining the level and make-up of executive remuneration, the Remuneration & Nomination Committee used independent benchmarking information for the property industry generally and A-REITs in particular.
The Managing Director has a contract of employment. Details of this contract are provided below.
Executive remuneration consists of the following key elements:
• fixed remuneration (base salary, superannuation and non-monetary benefits). • variable remuneration
o short term incentives (STIs); and o long term incentives (LTIs).
The proportion of fixed remuneration and variable remuneration (STIs and LTIs) for each executive is generally in the following ratio:
Fixed – 60%
STIs – 20%
LTIs – 20%
The Group has a 70:30 investment strategy principally ensuring that 70% of its balance sheet exposure is to directly held core plus property, providing a sustainable recurring income stream. The Group’s investment philosophy is to provide investors with stable returns from sound rental income and improvement of asset values resulting from diligent asset management of core plus assets. The LTI award strategy is consequently designed to drive sustainable underlying profit and cash receipts that cover the distribution level implicit in the ABP security price. It follows that the STIs should generally be shadowed with an equal LTI grant.
For the year ended 30 June 2012 the Board determined that within the context of providing market competitive levels of remuneration:
(a) executives have an appropriate portion of their total remuneration at risk by linking it to the performance of the business and their own contributions to that performance; and
(b) executive remuneration be delivered with the proportion of fixed to potential maximum variable pay being, with exceptions for outstanding personal achievement, in the ratio of approximately 60:40.
The Board considers that this approach should discourage excessive risk taking. These arrangements apply to those executives who are invited to participate in the Group’s incentive plan. Participation is limited to those executives whose roles have the potential to affect the long-term value of the Group. Market practice dictates that a significant portion of the remuneration of these executives should be linked to long-term incentives.
For
per
sona
l use
onl
y

ABACUS PROPERTY GROUP
13
DIRECTORS’ REPORT 30 June 2012
REMUNERATION REPORT (audited) (continued)
Structure (continued)
Both STIs and LTIs are offered to executives. STIs comprise cash bonuses. LTIs have been synthetic equity (comparable to cash-settled options) that generally have a vesting period of approximately three years. Following completion of the review of variable remuneration, the current LTI plan will be modified so as to deliver a greater level of alignment with securityholders and perceived value to executives.
The table below sets out the structure of the Group’s executive remuneration arrangements:
Remuneration component Method Purpose Link to performance
Fixed remuneration Paid in cash - comprises base salary, superannuation contributions and other benefits.
Set with reference to role, market, experience and skill-set.
No direct link to performance. Periodic increases are linked to market movements, changes in roles and responsibilities, and to performance.
STI component Paid in cash as a bonus in September .
Rewards executives for their contribution to achievement of Group and business outcomes, as well as individual key performance indicators (KPIs).
Underlying profit is a key financial metric for availability of a bonus. Individual performance is then tested against KPIs, key effectiveness indicators and other internal financial and performance measures.
LTI component
(Issues of rights in the years ended 30 June 2011 and 2012 were cancelled in June 2012)
Awards have been made in the form of security appreciation rights.
Intended to reward executives for their contribution to the creation of securityholder value over the longer term.
Directly linked to the increase in the Group’s security price over the 3 year vesting period.
Fixed Remuneration
Objective
Fixed remuneration is reviewed annually by the Remuneration & Nomination Committee. The process consists of a review of Group, business unit and individual performance. The remuneration for each executive is then assessed also by reference to market rates based on reliable benchmarking information and, where appropriate, external advice from the Group’s remuneration consultant.
Base Salary
Base salary is set by reference to the executive’s position, performance and experience. In order to attract, motivate and retain executives of the highest quality the Group aims to set competitive rates of base salary. Base salary levels are benchmarked periodically and are reviewed on an annual basis having regard to performance, external market forces and promotion. There were no increases in base pay for executives for the year ended 30 June 2012.
The fixed remuneration component of the Group’s Managing Director and the most highly remunerated executives is detailed in Table 1.
Managing Director’s remuneration
In determining the Managing Director’s remuneration the Board considered independent benchmarking information for the property industry as well as data from the general market (general listed industry companies of comparable size and, within that, A-REITs of comparable size) to determine an appropriate market-competitive level of pay, his personal performance and his value to the Group. The board also evaluated his performance against agreed strategic goals and other performance metrics. The Group considers that this approach works well in achieving its performance and remuneration objectives.
For
per
sona
l use
onl
y

ABACUS PROPERTY GROUP
14
DIRECTORS’ REPORT 30 June 2012
REMUNERATION REPORT (audited) (continued)
Fixed Remuneration (continued) The Group’s ability to operate successfully in a period of economic uncertainty, to attract third party capital from substantial overseas groups and to acquire new flagship assets is evidence of the success of the remuneration approach. The Abacus Property Group merged with Abacus Storage Fund and the strategic review of the managed funds was completed.
The Managing Director contributed significantly to the achievement of these key outcomes, and this is consequently reflected in his remuneration.
Variable Remuneration – Short Term Incentive (STI)
Objective
The objective of the STI program is to link the achievement of the Group’s operational targets with the remuneration received by the executives charged with meeting those targets.
Structure
The STI plan is designed to link financial rewards with improving the underlying financial strength of the business.
• STI pool – available for short-term incentive awards is linked directly to achievement of underlying net profit target for the assessment year.
• KPIs – the performance measures that determine individual awards under the short-term incentive plan represent the contributions to be made by executives to the Group’s financial and operating performance.
Securityholders expect that the Board consider the financial performance of the business when forming decisions about whether to pay a bonus or not and, if so, the size of bonuses. The Board has established a process to manage the assessment and payment of STI entitlements through KPIs and key effectiveness indicators. The process is set out as follows:
Beginning of the year Set the plan parameters
• Underlying profit* target for coming year
• KPIs for each participant • Maximum STIs payable for
each participant • Determine maximum STI pool
size based on the sum of individual theoretical maximums
Year-end Measure Group financial performance
• Is underlying profit target met or exceeded?
• If no, a bonus will not be generally available
• If yes, gateway is passed
After year-end Distribute bonus
• Assess individual performance against KPIs • STIs paid in cash
For
per
sona
l use
onl
y

ABACUS PROPERTY GROUP
15
DIRECTORS’ REPORT 30 June 2012
REMUNERATION REPORT (audited) (continued)
Variable Remuneration – Short Term Incentive (STI) (continued)
Structure (continued)
*The Board has compared the Group’s performance against several financial performance measures over annual periods to determine the strength of the relationship between the measures and security-holder value creation (measured by total security-holder return) and hence the most appropriate measure to determine entitlements to STIs. Based on this analysis the Board has adopted underlying net profit as the measure. Underlying net profit reflects the statutory profit as adjusted in order to present a figure that reflects the Directors’ assessment of the result for the ongoing business activities of the Group, in accordance with the AICD/Finsia principles for reporting underlying profit. The underlying profit is not audited.
For each relevant year the Board will specify an underlying profit target that operates as a gateway that must be passed if bonuses are to be generally payable. The Board retains a discretion, based on its view of the circumstances at the time, to adjust the pool size.
If the underlying net profit target has been missed by a small amount, the Board may reduce but not eliminate the pool if it determines the circumstances warrant such action. If performance has been exceptionally strong the Board may increase the total pool size to provide additional bonuses reflecting above target performance. Where the financial gateway has not been achieved and the Board determines that no bonus pool will generally be available, it retains the discretion to pay bonuses to selected individuals to reward them for their individual performance.
If an executive is no longer employed at the time when the Group pays STIs for any relevant year then that executive will generally not be entitled to be paid their STI bonus if the relevant executive resigned for any reason or if their employment was terminated with cause.
Key Performance Indicators
Where STIs are to be paid it is necessary to determine how STI entitlements will be quantified for participating executives.
STI payments made to each executive depend on the extent to which KPIs set at the beginning of the financial year are met. Account is also taken of qualitative indicators of effectiveness, performance and behaviour. They are the primary tools the Board uses as a means of determining performance against expectations in order to distribute STIs where the financial performance gateway specified by the Board has been achieved.
Performance measures Proportion of STI award measure applies to Financial measure:
• Contribution to Group underlying profit 20-40% (dependant on role)
Non-financial measures: • Quality of analysis and recommendations • reporting and financial requirements • Tax and compliance requirements • Transaction and project management • Key growth activities • Risk management • Asset value creation • Leadership, staff management, teambuilding and
succession • Other performance measures focused on achieving
business imperatives
60-80%
These measures were chosen as they represent the key drivers for the short-term success of the business and provide a framework for long term securityholder value.
The Board is mindful of the competing needs for the Group to:
• maintain a robust framework by which performance expectations are set and measured; and • retain its flexibility and entrepreneurialism as an organisation.
The Board has the discretion to consider each executive’s total contribution to the Group in addition to the specific KPIs selected for the relevant year.
For
per
sona
l use
onl
y

ABACUS PROPERTY GROUP
16
DIRECTORS’ REPORT 30 June 2012
REMUNERATION REPORT (audited) (continued)
Key Performance Indicators (continued)
The target levels of performance set by the Board are challenging, and payment of 100% of STI opportunity to an executive requires exceptional performance.
The payment of STIs to executives is subject to approval by the Remuneration and Nomination Committee. The Committee considers the performance of the executive against the KPIs and approves the amount, if any, of the STI to be paid.
For the 2012 financial year an STI cash bonus of $1,700,000 has been accrued and will be paid in September 2012.
For the 2011 financial year, 100% of the STI cash bonus of $1,235,500 accrued in that year vested and was paid to executives in the 2012 financial year. There were no forfeitures.
Variable Remuneration – Long Term Incentive (LTI)
Selected executives are invited by the Board to participate in the LTI plan which rewards improved Group performance and returns to securityholders. Awards under the plan are linked directly to the Group’s security price and executives will not benefit under the plan unless the security price improves over the relevant vesting period.
Objective
The objective of the LTI plan is to reward executives in a manner that aligns remuneration with the creation of securityholder wealth. LTI grants are made only to executives who are able to influence the generation of securityholder wealth and consequently have the potential to have an impact on the Group’s performance.
LTI Security Appreciation Rights Plan (SARs)
The Security Appreciation Rights (SARs) plan was designed to align the interests of executives with those of securityholders by providing for a significant portion of the remuneration of participating executives to be linked to the long-term price performance of the Group’s securities.
The SARs plan is an LTI plan under which:
• Eligibility to participate is based on the performance assessment completed in determining STI awards. • Key executives may be allocated a number of SARs in any year as part of their annual remuneration
package. The number of SARs allocated is determined by reference to: o the target LTI portion of each participant’s annual remuneration package; and o an adjustment factor (up or down) based on the annual STI performance assessment for the prior
year and other relevant factors taken into account by the Board in its discretion. • Each SAR is equivalent to the positive change in market value of one Group security over the vesting
period. • SARs vest at the end of a three-year period provided the executive remains employed by the Group (or
otherwise at the Board’s discretion) • The Board will calculate the difference between the 5-day volume weighted average price (VWAP) of
Abacus securities on the last day of the vesting period (generally 30 June in the vesting year) less the 5-day VWAP of Group securities as at the day before the commencement of the vesting period (generally 1 July of the grant year). If the difference is positive, then the difference will be multiplied by the number of SARs allocated to the relevant executive that have vested. An amount equal to the product will be paid to the relevant executive.
• Payment entitlements will be subject to PAYG tax withholding and will be made as soon as practicable following the completion of the vesting period.
The Board retains the discretion to allocate SARs in excess of the target LTI amount in cases of exceptional performance.
For
per
sona
l use
onl
y

ABACUS PROPERTY GROUP
17
DIRECTORS’ REPORT 30 June 2012
REMUNERATION REPORT (audited) (continued)
LTI Security Appreciation Rights Plan (continued)
Security Appreciation Rights Plan
The plan was designed to expose executives to fluctuations in the security price throughout the vesting period and directly rewards them for the increase in the Group’s security price over that period. If the Group’s security price does not increase over the vesting period for an award of SARs, executives are not entitled to any payment under the plan for that award.
The Group’s security price was chosen as the key measure for the LTI on the basis that it:
• reflects the market’s assessment of the success or failure of management over the long term; and • is a comprehensive single objective metric that reflects the market’s assessment of all aspects of the
Group’s financial performance.
SARs payouts are cash bonuses, the size of which is determined by reference to the security price.
Each SAR payout is subject to:
• income tax at the recipient’s marginal income tax rate in the year in which the bonus is paid; and • PAYG
in the same manner as other cash remuneration payments.
All of the SARs have been cancelled for the reasons previously stated in this report. The Board anticipates modifications to the LTI plan that should deliver perceived value to executives and hence be sufficiently incentivising so as to justify the cost of providing the LTI benefit. Executives will not be compensated for the cancellation of SARs issued to them in the financial years ended 30 June 2011 and 2012. The details of the SARs issued and cancelled during the year were as follows:
Opening Balance
New issue during the year Cancelled
Balance at 30 June 2012
Potential value of cancelled
SARs
Director
Frank Wolf 730,769 2,857,143 (3,587,912) - $ 875,000
Executives
Ellis Varejes 269,231 1,071,429 (1,340,660) - $ 325,000
John L'Estrange 153,846 714,286 (868,132) - $ 200,000
Cameron Laird 153,846 714,286 (868,132) - $ 200,000
Rod de Aboitiz 153,846 535,714 (689,560) - $ 175,000
Len Lloyd 230,769 714,286 (945,055) - $ 250,000
Peter Strain 230,769 1,302,198 (1,302,198) - $ 300,000
For
per
sona
l use
onl
y

ABACUS PROPERTY GROUP
18
DIRECTORS’ REPORT 30 June 2012
REMUNERATION REPORT (audited) (continued)
Link between remuneration policy and the Group’s performance
The Group’s performance is regularly compared with its peers in the S&P/ASX 300 A-REIT. This peer group reflects the Group’s competitors for capital transactions and talent. As previously discussed, executives are eligible to receive an STI and participate in the LTI plan. Both STIs and LTIs are risk-related components of total remuneration as payment entitlements are dependent on performance. The Group’s objective is for remuneration policy to encourage business strategy and implementation that achieves growth in total securityholder returns and favourable peer comparison.
Accordingly, the size of the STI is directly related to Group performance and a range of key measures that impact on shareholder value.
The value of SARs that will be issued following the modification of the LTI plan will be directly related to the Group’s security price.
The Group’s performance in comparison with the S&P/ASX 300 A-REIT is set out in the following graph:
The Group’s performance for the past five years is as follows:
2008 2009 2010 2011* 2012
Underlying earnings per security (cents) 13.98 8.30 3.90 19.38 19.17
Distributions paid and proposed (cents) 13.50 7.75 3.15 16.50 16.50Closing security price (30 June) $1.15 $0.37 $0.41 $2.31 $2.04
Net tangible assets per security** $1.37 $0.62 $0.58 $2.51 $2.34Weighted average securities on issue 650.9m 867.5m 1,662.5m 372.3m 400.9m
* The Group’s securities were consolidated on a 5:1 basis on 29 November 2010. ** Net tangible assets per security includes the impact of the fair value movements on the interest rate swaps. The fair value loss in 2012 was $35.2 million.
For
per
sona
l use
onl
y

ABACUS PROPERTY GROUP
19
DIRECTORS’ REPORT 30 June 2012
REMUNERATION REPORT (audited) (continued)
Employment contracts
Managing Director
The Managing Director, Dr Wolf, is employed under a rolling contract. The current employment contract commenced on 10 October 2002. Under the terms of the contract:
• Dr Wolf receives a base salary that is reviewed annually;
• he is eligible to participate in the LTI plans that are made available and to receive STI payments;
• Dr Wolf may resign from his position and thus terminate this contract by giving 6 months written notice; and
• the Group may terminate this employment agreement by providing 12 months written notice or providing payment in lieu of notice (based on the fixed component of Dr Wolf’s remuneration).
Other Executives
The other executives are employed on an ongoing basis under letter agreements until (generally) one month’s notice is given by either party. The Group may terminate an executive’s service at any time without notice if serious misconduct has occurred. Where termination with cause occurs the executive is only entitled to remuneration up to the date of termination. Deferred STI and LTI awards vest according to the plan rules.
For
per
sona
l use
onl
y

ABACUS PROPERTY GROUP
20
Table 1: Remuneration of Key Management Personnel
2012 Short-term benefits Long-term Security-based Total%
Performance benefits Payment related
Salary & fees Cash bonusNon-monetary
benefits
Total cash payments and short
term benefits Superannuation
Retirement benefits
Long service
leave*Appreciation
rightsNon-executive directorsJ Thame - Chairman 182,225 - - 182,225 15,775 - - - 198,000 - W Bartlett 90,138 - - 90,138 8,112 - - - 98,250 - D Bastian 42,250 - - 42,250 50,000 - - - 92,250 - M Irving 126,750 - - 126,750 - - - - 126,750 - M Salkinder 86,009 - - 86,009 7,741 - - - 93,750 Sub-total non-executive directors 527,372 - - 527,372 81,628 - - - 609,000 -
Executive DirectorsF Wolf - Managing Director 1,150,000 750,000 5,150 1,905,150 50,000 - 19,683 - 1,974,833 38%
Other key management personnelR de Aboitiz - Chief Financial Off icer 474,225 150,000 - 624,225 15,775 - 47,087 - 687,087 22%C Laird - Director Property Ventures 409,225 150,000 2,997 562,222 15,775 - - - 577,997 26%J L'Estrange - Director Property Ventures 411,225 200,000 5,150 616,375 33,775 - 6,475 - 656,625 30%L Lloyd - Managing Director, Property Services 350,000 125,000 - 475,000 50,000 - 6,335 - 531,335 24%P Strain - Director Property 375,000 150,000 5,150 530,150 50,000 - 6,714 - 586,864 26%E Varejes - Chief Operating Officer 459,223 175,000 5,150 639,373 40,777 - 8,012 - 688,162 25%Sub-total executive KMP 3,628,898 1,700,000 23,597 5,352,495 256,102 - 94,306 - 5,702,903 Total 4,156,270 1,700,000 23,597 5,879,867 337,730 - 94,306 - 6,311,903
Post employment
Details of the security appreciation rights cancelled during the year are set out on page 10
*Accrued but not presently entitled
For
per
sona
l use
onl
y

ABACUS PROPERTY GROUP
21
Table 1: Remuneration of Key Management Personnel (continued)
2011 Short-term benefits Long-term Security-based Total%
Performance benefits Payment related
Salary & fees Cash bonusNon-monetary
benefits
Total cash payments and short
term benefits Superannuation
Retirement benefits
Long service
leave*Appreciation
rightsNon-executive directorsJ Thame - Chairman 176,801 - - 176,801 15,199 - - - 192,000 - W Bartlett 79,817 - - 79,817 7,183 - - - 87,000 - D Bastian 40,000 - - 40,000 50,000 - - - 90,000 - D Bluth (retired 12 November 2010) - - - - 30,800 - - - 30,800 - M Irving 108,000 - - 108,000 - - - - 108,000 - M Salkinder (appointed 12 April 2011) 18,207 - - 18,207 1,639 - - - 19,846 Sub-total non-executive directors 422,825 - - 422,825 104,821 - - - 527,646 -
Executive DirectorsF Wolf - Managing Director 1,150,000 500,000 5,135 1,655,135 50,000 - 19,634 20,339 1,745,108 30%
Other key management personnelR de Aboitiz - Chief Financial Off icer 474,801 100,000 - 574,801 15,199 - - 4,282 594,282 18%T Hardw ick - Director Funds Management^ 7,266 - - 7,266 1,389 189,808 - - 198,463 - C Laird - Director Property Ventures 409,801 118,500 - 528,301 15,199 - - 4,282 547,782 22%J L'Estrange - Director Property Ventures 411,801 74,000 5,135 490,936 33,199 - 7,605 4,282 536,022 15%L Lloyd - Managing Director, Property Services* 350,000 147,000 - 497,000 50,000 - 12,447 6,423 565,870 27%P Strain - Director Property 375,000 147,500 5,135 527,635 50,000 - 10,113 6,423 594,171 26%E Varejes - Chief Operating Officer 472,100 148,500 5,135 625,735 27,900 - 45,570 7,493 706,698 22%Sub-total executive KMP 3,650,769 1,235,500 20,540 4,906,809 242,886 189,808 95,369 53,524 5,488,396 Total 4,073,594 1,235,500 20,540 5,329,634 347,707 189,808 95,369 53,524 6,016,042
Post employment
* L Lloyd retired as a director of Abacus Group Holdings Limited, Abacus Group Projects Limited and Abacus Funds Management Limited on 12 November 2010 but continues to perform his executive duties. ^ T Hardwick resigned in October 2010. *Accrued but not presently entitled
For
per
sona
l use
onl
y
ABACUS PROPERTY GROUP
22
DIRECTORS’ REPORT 30 June 2012
Signed in accordance with a resolution of the directors. Abacus Group Holdings Limited (ABN 31 080 604 619)
John Thame Frank Wolf Chairman Managing Director Sydney, 28 August 2012
For
per
sona
l use
onl
y

For
per
sona
l use
onl
y

ABACUS PROPERTY GROUP
24
CONSOLIDATED INCOME STATEMENT YEAR ENDED 30 JUNE 2012
2012 2011restated*
Notes $'000 $'000REVENUERental income 101,506 96,795 Storage income 47,093 41,872 Hotel income 52,011 52,411 Finance income 6(a) 28,997 22,569 Funds management income 6(b) 6,509 4,550 Sale of inventory - 78,000 Total Revenue 236,116 296,197 Net change in fair value of investment properties derecognised 9,456 1,955 Net change in fair value of investments and financial instruments derecognised 6(c) (132) 4,761 Share of profit / (loss) from equity accounted investments 17(b) 7,379 (6,021)Other 686 2,679 Total Revenue and Other Income 253,505 299,571
Property expenses and outgoings (18,123) (14,967)Storage expenses (16,410) (14,461)Hotel expenses (40,010) (40,227)Depreciation, amortisation and impairment expense 7(a) (7,800) (8,182)Cost of inventory sales - (63,094)Net change in fair value of derivatives (54,315) (1,825)Net change in fair value of investment properties and property, plant & equipment held at balance date (2,235) 8,096 Net change in fair value of investments held at balance date 7(b) (1,244) (15,679)Finance costs 7(c) (73,043) (66,878)Impairment charges - related parties 17(a) (3,507) - Administrative and other expenses 7(d) (26,318) (27,686)PROFIT BEFORE TAX 10,500 54,668
Income tax expense 8(a) (2,474) (3,467)NET PROFIT AFTER TAX 8,026 51,201
PROFIT ATTRIBUTABLE TO:Equity holders of the parent entity (AGHL) 450 33,841 Equity holders of other stapled entitiesAT members 6,507 (8,804)AGPL members 208 (5,997)AIT members 1,964 9,547 ASPT members# (11,071) - ASOL members# 10,412 - Stapled security holders 8,470 28,587 Net profit / (loss) attributable to external non-controlling interests (444) 22,614 NET PROFIT 8,026 51,201
Basic and diluted earnings per stapled security (cents) 10 2.11 7.68
* Certain numbers shown here do not correspond to the 2011 financial statements as they reflect required adjustments resulting from the adoption of AASB10 as set out in note 2.
# Contribution since date of merger on 6 March 2012.
For
per
sona
l use
onl
y

ABACUS PROPERTY GROUP
25
CONSOLIDATED STATEMENT OF OTHER COMPREHENSIVE INCOME YEAR ENDED 30 JUNE 2012
2012 2011Restated*
$'000 $'000
NET PROFIT AFTER TAX 8,026 51,201
OTHER COMPREHENSIVE INCOMERevaluation of assets, net of tax 3,957 (1,071)Foreign exchange translation adjustments, net of tax 3,782 (289)TOTAL COMPREHENSIVE INCOME FOR THE YEAR 15,765 49,841
Total comprehensive income attributable to:Members of the APG Group 9,808 29,160 External non-controlling interests 5,957 20,681 TOTAL COMPREHENSIVE INCOME FOR THE YEAR 15,765 49,841
Total comprehensive income / (loss) attributable to members of the Group analysed by amounts attributable to:AGHL members 1,788 34,409 AT members 6,507 (8,804)AGPL members 208 (5,991)AIT members 1,964 9,547 ASPT members (11,071) - ASOL members 10,412 - TO MEMBERS OF THE GROUP 9,808 29,161
*Certain numbers shown here do not correspond to the 2011 financial statements as they reflect required adjustments resulting from the adoption of AASB10 as set out in note 2.
For
per
sona
l use
onl
y

ABACUS PROPERTY GROUP
26
CONSOLIDATED STATEMENT OF FINANCIAL POSITION AS AT 30 JUNE 2012
30 Jun 2012 30 Jun 2011 1 Jul 2010restated* restated*
Notes $'000 $'000 $'000CURRENT ASSETSCash and cash equivalents 11 54,129 64,648 37,783 Trade and other receivables 12(a) 11,918 15,584 14,996 Property, plant and equipment - - 20,901 Investment properties held for sale 16 190,821 91,131 91,327 Inventory 15(a) 26,479 23,382 1,899 Property loans 13(a) 19,098 19,324 63,357 Other financial assets 13(b) 8,053 959 2,189 Other 3,004 4,114 3,543 TOTAL CURRENT ASSETS 313,502 219,142 235,995
NON-CURRENT ASSETSInvestment properties 16 1,181,203 1,338,130 1,199,464 Inventory 15(b) 100,974 57,595 89,648 Property loans 13(c) 154,758 153,893 138,148 Other financial assets 13(d) 24,489 32,177 53,881 Property, plant and equipment 14 154,065 163,238 159,279 Equity accounted investments 17 121,833 99,195 102,028 Deferred tax assets 8(c) 16,320 15,978 16,897 Intangible assets and goodwill 18 33,461 35,173 35,173 Trade and other receivables 12(b) 6,212 6,000 - TOTAL NON-CURRENT ASSETS 1,793,315 1,901,379 1,794,518
TOTAL ASSETS 2,106,817 2,120,521 2,030,513
CURRENT LIABILITIESTrade and other payables 19(a) 30,426 30,509 32,424 Interest-bearing loans and borrowings 20 29,950 47,366 230,790 Income tax payable 636 566 - Other 4,516 3,567 3,186 TOTAL CURRENT LIABILITIES 65,528 82,008 266,400
NON-CURRENT LIABILITIESTrade and other payables 19(b) 12,725 13,575 4,065 Interest-bearing loans and borrowings 20 772,260 791,868 540,987 Derivatives at fair value 79,752 28,644 44,855 Deferred tax liabilities 8(c) 10,183 8,800 7,203 Other financial liabilities 30 56,250 49,902 36,789 Other 2,227 5,314 1,866
933,397 898,103 635,765
TOTAL LIABILITIES 998,925 980,111 902,165
NET ASSETS 1,107,892 1,140,410 1,128,348
TOTAL EQUITY 1,107,892 1,140,410 1,128,348
TOTAL NON-CURRENT LIABILITIES
*Certain amounts shown here do not correspond to the 2011 financial statements as they reflect required adjustments resulting from the adoption of AASB10 as set out in note 2.
For
per
sona
l use
onl
y

ABACUS PROPERTY GROUP
27
CONSOLIDATED STATEMENT OF FINANCIAL POSITION (continued) AS AT 30 JUNE 2012
30 Jun 2012 30 Jun 2011 1 Jul 2010restated* restated*
Notes $'000 $'000 $'000Equity attributable to members of AGHL:Contributed equity 157,386 50,270 48,440 Reserves 6,050 2,405 1,839 Accumulated losses (47,337) (46,275) (80,362)
Total equity attributable to members of AGHL: 116,099 6,400 (30,083)
Equity attributable to unitholders of AT:Contributed equity 783,358 860,983 837,064 Accumulated losses (137,593) (104,494) (58,057)Total equity attributable to unitholders of AT: 645,765 756,489 779,007
Equity attributable to members of AGPL:Contributed equity 20,415 9,657 9,459 Reserves (78) (78) (85)Accumulated losses (17,529) (17,737) (11,740)Total equity attributable to members of AGPL: 2,808 (8,158) (2,366)
Equity attributable to unitholders of AIT:Contributed equity 170,620 218,914 212,031 Accumulated losses (566) 20,095 33,349 Total equity attributable to unitholders of AIT: 170,054 239,009 245,380
Equity attributable to members of ASPT:Contributed equity 87,461 - - Reserves (2,322) - - Retained earnings 8,790 - - Total equity attributable to members of ASPT: 93,929 - -
Equity attributable to members of ASOL:Contributed equity 12,754 - - Reserves 13 - - Retained earnings 15,501 - - Total equity attributable to members of ASOL: 28,268 - -
Equity attributable to external non-controlling interest:Contributed equity 67,295 135,713 135,145 Reserves 5,424 (978) 955 Accumulated losses (21,750) 11,935 310
Total equity attributable to external non-controlling interest: 50,969 146,670 136,410
TOTAL EQUITY 1,107,892 1,140,410 1,128,348
Contributed equity 23 1,231,994 1,139,824 1,106,994 Reserves 3,663 2,327 1,754 Accumulated losses (178,734) (148,411) (116,810)Total stapled security holders' interest in equity 1,056,923 993,740 991,938 Total external non-controlling interest 50,969 146,670 136,410 TOTAL EQUITY 1,107,892 1,140,410 1,128,348
* Certain amounts shown here do not correspond to the 2011 financial statements as they reflect required adjustments resulting from the adoption of AASB 10 as set out in note 2.
For
per
sona
l use
onl
y

ABACUS PROPERTY GROUP
28
CONSOLIDATED STATEMENT OF CHANGES IN EQUITY YEAR ENDED 30 JUNE 2012
ExternalAsset Foreign Employee Non-
Issued revaluation currency equity Retained controlling Totalcapital reserve translation benefits earnings interest Equity
CONSOLIDATED $'000 $'000 $'000 $'000 $'000 $'000 $'000
At 1 July 2011* 1,139,824 1,021 (4,142) 5,448 (148,411) 146,670 1,140,410 Other comprehensive income - (409) 1,745 - - 6,403 7,739 Net income for the year - - - - 8,470 (444) 8,026 Total comprehensive income for the year - (409) 1,745 - 8,470 5,959 15,765 Equity raisings^ 56,528 - - - - - 56,528 Return of capital^ (61,873) - - - - - (61,873)Distribution reinvestment plan 36,189 - - - - - 36,189 Issue costs (2,168) - - - - - (2,168)Acq. of non-controlling interest - - - - - (1,754) (1,754)Merger of ASOL / ASPT 63,494 - - - 24,387 (87,881) - Distribution to security holders - - - - (63,180) (12,025) (75,205)At 30 June 2012 1,231,994 612 (2,397) 5,448 (178,734) 50,969 1,107,892
Attributable to the stapled security holder
^Capital was returned to securityholders that was applied to the issue of securities as part of the merger between the ABP Group and ASF (Note 27)
ExternalAsset Foreign Employee Non-
Issued revaluation currency equity Retained controlling Totalcapital reserve translation benefits earnings interest Equity
CONSOLIDATED $'000 $'000 $'000 $'000 $'000 $'000 $'000
At 1 July 2010 (pre AASB10) 1,110,517 342 (3,975) 5,448 (23,262) 13,799 1,102,869 Application of AASB 10 (3,523) 297 (358) - (93,547) 122,610 25,479 At 1 July 2010 (post AASB10) 1,106,994 639 (4,333) 5,448 (116,809) 136,409 1,128,348 Other comprehensive income - 382 191 - - (1,933) (1,360)Net income for the year - - - - 28,587 22,614 51,201 Total comprehensive income for the year - 382 191 - 28,587 20,681 49,841 Equity raisings - - - - - - - Distribution reinvestment plan 32,779 - - - - - 32,779 Issue costs 51 - - - - - 51 Movement in equity interest - - - - (95) 95 - Distribution to security holders - - - - (60,094) (10,515) (70,609)At 30 June 2011* 1,139,824 1,021 (4,142) 5,448 (148,411) 146,670 1,140,410
Attributable to the stapled security holder
* Certain amounts shown here do not correspond to the 2011 financial statements as they reflect required adjustments resulting from the adoption of AASB10 as set out in note 2.
For
per
sona
l use
onl
y

ABACUS PROPERTY GROUP
29
CONSOLIDATED STATEMENT OF CASH FLOW YEAR ENDED 30 JUNE 2012
2012 2011Restated*
Notes $'000 $'000CASH FLOWS FROM OPERATING ACTIVITIESIncome receipts 258,618 307,041 Interest received 3,657 2,589 Distributions received 1,015 1,328 Income tax paid (1,353) (229)Finance costs paid (60,735) (62,522)Operating payments (114,952) (102,048)
NET CASH FLOWS FROM OPERATING ACTIVITIES 11 86,250 146,159
CASH FLOWS FROM INVESTING ACTIVITIESPayments for investments and funds advanced (91,909) (74,414)Proceeds from sale and settlement of investments and funds repaid 27,208 50,066 Purchase of property, plant and equipment (1,230) (3,404)Proceeds from sale of property, plant and equipment 15,512 13,251 Purchase of investment properties (24,382) (175,932)Disposal of investment properties 96,079 38,003 Payment for other investments (5,138) (3,180)
NET CASH FLOWS FROM / (USED IN) INVESTING ACTIVITIES 16,140 (155,610)
CASH FLOWS FROM FINANCING ACTIVITIESProceeds from issue of stapled securities 62,901 13,209 Return of capital (61,873) - Payment of issue / finance costs (6,223) (8,139)Repayment of borrowings (242,345) (342,650)Proceeds from borrowings 174,954 415,965 Distributions paid (40,338) (41,414)
NET CASH FLOWS FROM / (USED IN) FINANCING ACTIVITIES (112,924) 36,971
NET INCREASE/(DECREASE) IN CASH AND CASH EQUIVALENTS (10,534) 27,520 Net foreign exchange differences 15 (155)Cash and cash equivalents at beginning of year 64,648 37,283
CASH AND CASH EQUIVALENTS AT END OF YEAR 11 54,129 64,648
* Certain amounts shown here do not correspond to the 2011 financial statements as they reflect required adjustments resulting from the adoption of AASB10 as set out in note 2.
For
per
sona
l use
onl
y

ABACUS PROPERTY GROUP
30
NOTES TO THE FINANCIAL STATEMENTS 30 JUNE 2012
1. CORPORATE INFORMATION
Abacus Property Group (“APG” or the “Group”) is comprised of Abacus Group Holdings Limited (“AGHL”) (the nominated parent entity), Abacus Trust (“AT”), Abacus Group Projects Limited (“AGPL”), Abacus Income Trust (“AIT”), Abacus Storage Property Trust (“ASPT”) and Abacus Storage Operations Limited (“ASOL”). Shares in AGHL, AGPL and ASOL and units in AT, AIT and ASPT have been stapled together so that neither can be dealt with without the other. The securities trade as one security on the Australian Securities Exchange (the “ASX”) under the code ABP. The units in ASPT and the shares in ASOL were stapled to the Group in March 2012.
The financial report of the Group for the year ended 30 June 2012 was authorised for issue in accordance with a resolution of the directors on 28 August 2012.
The nature of the operations and principal activities of the Group are described in the Directors’ report.
2. SUMMARY OF SIGNIFICANT ACCOUNTING POLICIES
(a) Basis of Preparation
The financial report is a general-purpose financial report, which has been prepared in accordance with the requirements of the Corporations Act 2001 and Australian Accounting Standards. The financial report has also been prepared on a historical cost basis, except for investment properties and derivative financial instruments which have been measured at fair value, interests in joint ventures and associates which are accounted for using the equity method, and certain investments and financial assets measured at fair value. The financial report is presented in Australian dollars and all values are rounded to the nearest thousand dollars ($'000) unless otherwise stated under the option available to the Group under ASIC Class Order 98/100. The Group is an entity to which the class order applies.
(b) Statement of Compliance
The financial report complies with Australian Accounting Standards and International Financial Reporting Standards (IFRS), as issued by the AASB and IASB respectively.
(c) New accounting standards and interpretations
(i) Changes in accounting policy and disclosures
The accounting policies adopted are consistent with those of the previous financial year except as follows:
The Group has adopted the following new and amended Australian Accounting Standards and AASB interpretations as of 1 July 2011. Adoption of these standards and interpretations did not have any effect on the financial position or performance of the Group.
- AASB 124 Related Party Transactions - The AASB issued an amendment to AASB 124 that clarifies the definitions of a related party. The new definitions emphasise a symmetrical view of related party relationships and clarifies the circumstances in which persons and key management personnel affect related party relationships of an entity. In addition, the amendment introduces an exemption from the general related party disclosure requirements for transactions with government as the reporting entity. The adoption of the amendment did not have any impact on the financial position or performance of the Group.
- AASB 132 Financial Instruments: Presentation – The AASB issued an amendment that alters the definition of a financial liability in AASB132 to enable entities to classify rights issues and certain options or warrants as equity instruments. The amendment is applicable if the rights are given pro rata to all of the existing owners of the same class of an entity’s non-derivative equity instruments, to acquire a fixed number of the entity’s own equity instruments for a fixed amount in any currency. The amendment has had no effect on the financial position or performance of the Group.
- AASB Int 14 Prepayments of a Minimum Funding Requirement – The amendment has had no effect on the financial position or performance of the Group
For
per
sona
l use
onl
y
ABACUS PROPERTY GROUP
31
NOTES TO THE FINANCIAL STATEMENTS 30 JUNE 2012
2. SUMMARY OF SIGNIFICANT ACCOUNTING POLICIES (continued)
(c) New accounting standards and interpretations (continued)
(i) Changes in accounting policy and disclosures (continued)
Improvements to AASBs
In May 2010, the AASB issued its third omnibus of amendments to its standards, primarily with a view to removing inconsistencies and clarifying working. These are separate transitional provisions for each standard. The adoption of the following amendments resulted in changes to accounting policies, but no impact on the financial position or performance of the Group.
- AASB7 Financial Instruments – Disclosures: The amendment was intended to simplify the disclosures provided by reducing the volume of disclosures around collateral held and improving disclosures by requiring qualitative information to put the quantitative information in context. The Group reflects the revised disclosure requirements in Note 22.
Other amendments resulting from improvements to AASBs to the following standards did not have any impact on the accounting policies, financial position or performance of the Group:
- AASB 3 Business Combinations
- AASB 101 Presentation of Financial Statements
- AASB 127 Separate Financial Statements
- AASB 134 Interim Financial Statements
The following interpretation and amendments to interpretations did not have any impact on the accounting policies, financial position or performance of the Group:
- AASB Int 13 Customer Loyalty Programmes
- AASB Int 19 Extinguishing Financial Liabilities with Equity Instruments
During the year the Group has also adopted the following standards, together with the consequential amendments as at 1 July 2011.
AASB 10 Consolidated Financial Statements: establishes a new control model that applies to all entities. It replaces parts of AASB 127 Consolidated and Separate Financial Statements dealing with the accounting for consolidated financial statements and UIG-112 Consolidation – Special Purpose Entities.
The new control model broadens the situations when an entity is considered to be controlled by another entity and includes new guidance for applying the model to specific situations, including when acting as a manager may give control, the impact of potential voting rights and when holding less than a majority voting rights may give control.
Consequential amendments were also made to other standards via AASB 2011-7 and amendments to AASB 127.
AASB 11 Joint Arrangements: replaces AASB 131 Interests in Joint Ventures and UIG-113 Jointly controlled Entities – Non-monetary Contributions by Ventures. AASB 11 uses the principle of control in AASB 10 to define joint control, and therefore the determination of whether joint control exists may change. In addition it removes the option to account for jointly controlled entities (JCEs) using proportionate consolidation. Instead, accounting for a joint arrangement is dependent on the nature of the rights and obligations arising from the arrangement. Joint operations that give the parties a right to the underlying assets and obligations themselves is accounted for by recognising the share of those assets and obligations. Joint ventures that give the parties a right to the net assets is accounted for using the equity method.
Consequential amendments were also made to other standards via AASB 2011-7 and amendments to AASB 128.
For
per
sona
l use
onl
y

ABACUS PROPERTY GROUP
32
NOTES TO THE FINANCIAL STATEMENTS 30 JUNE 2012
2. SUMMARY OF SIGNIFICANT ACCOUNTING POLICIES (continued)
(c) New accounting standards and interpretations (continued)
(i) Changes in accounting policy and disclosures (continued)
AASB 12 Disclosure of Interests in Other Entities: includes all disclosures relating to an entity’s interests in subsidiaries, joint arrangements, associates and structures entities. New disclosures have been introduced about the judgements made by management to determine whether control exists, and to require summarised information about certain joint arrangements, associates and structured entities and subsidiaries with non controlling interests.
The Group has applied the above standards retrospectively as at 1 July 2010 and the comparative balances have been adjusted accordingly.
The impact of the adoption of these standards are summarised below:
AASB10 Consolidated Financial Statements: adoption has resulted in the consolidation of Abacus Hospitality Fund, Abacus Storage Fund, Abacus Diversified Income Fund II and Abacus Miller Street Holding Trust. This is due to the combination of APG’s role as responsible entity, variable returns arising from its collective equity and loan investments in these funds and certain guarantees. The total impact of consolidating the funds was a net reduction of $93.5 million to the Group’s 1 July 2010 retained earnings made up as follows:
• Abacus Hospitality Fund (“AHF”): the consolidation of AHF results in the effective settlement of the Abacus working capital loan to AHF at its fair value at the deemed control date rather than its anticipated recoverable value based on a 2016 maturity date. This resulted in a $47.1 million reduction to the Group’s 1 July 2010 retained earnings.
• Abacus Storage Fund (“ASF”): the consolidation of ASF resulted in a $1.7 million increase to the Group’s 1 July 2010 retained earnings.
• Abacus Diversified Income Fund II (“ADIFII”): The consolidation of ADIFII results in the recognition of ADIFII’s issued units as a liability as a result of the capital guarantee and is measured at the current value of the capital and yield guarantee amounts rather than the estimated liability under the guarantees in 2013 and 2016. This resulted in a $48.4 million reduction to the Group’s 1 July 2010 retained earnings.
• Abacus Miller Street Holding Trust (“AMSHT”): the consolidation of AMSHT will result in a $0.3m increase to the Group’s 1 July 2010 retained earnings.
For
per
sona
l use
onl
y

ABACUS PROPERTY GROUP
33
NOTES TO THE FINANCIAL STATEMENTS 30 JUNE 2012
2. SUMMARY OF SIGNIFICANT ACCOUNTING POLICIES (continued)
(c) New accounting standards and interpretations (continued)
(i) Changes in accounting policy and disclosures (continued)
As a result of the accounting policy change, the following consolidation adjustments were made to the financial statements:
As of 1 July 2010 (statement of financial position)
Increase in cash and cash equivalents of $16.0 million Increase in trade and other receivables of $1.2 million Increase in inventory of $0.5 million Decrease in property loans of $210.7 million Increase in other assets of $1.6 million Increase in investment properties of $581.7 million Increase in other financial assets of $6.8 million Increase in property, plant and equipment of $150.0 million Decrease in equity accounted investment of $25.7 million Increase in deferred tax assets of $3.7 million Increase in trade and other payables of $19.4 million Increase in interest bearing loans and borrowings of $422.1 million Increase in derivatives at fair value of $14.5 million Increase in deferred tax liabilities of $6.9 million Increase in other financial liabilities of $36.8 million Reduction in issued capital (recognition of issue costs) of $3.5 million Increase in asset revaluation reserve of $0.3 million Decrease in foreign currency translation reserve of $0.4 million Increase in accumulated losses of $93.5 million Increase in non-controlling interests in equity of $122.6 million
As of and for the year ended 30 June 2011 (income statement, statement of other comprehensive income, statement of cash flow)
Increase in property / storage / hotel income of $116.8 million Decrease in finance income of $0.7 million Decrease in funds management income of $15.9 million Increase in net change in fair value of derivatives of $6.6 million Increase in net change in fair value of investment properties derecognised of $0.7 million Increase in net change in fair value of investments and financial instruments derecognised of $1.7 million Decrease in share of loss from equity accounted investments of $2.6 million Decrease in other revenue of $1.5 million Increase in property / storage / hotel expenses and outgoings of $56.1 million Increase in depreciation, amortisation and impairment expense of $5.1 million Increase in net change in fair value of investment properties held at balance date of $14.3 million Net change in fair value of investments held at balance date of $1.0 million Increase in finance costs of $33.0 million Increase in administrative and other expenses of $10.3 million Increase in income tax expense of $2.9 million Net increase in profit after tax of $33.4 million Net increase in comprehensive income of $30.8 million Net decrease in cash from operating activities of $23.7 million Net increase in cash used in investing activities of $12.5 million Net increase in cash from financing activities of $32.4 million
For
per
sona
l use
onl
y

ABACUS PROPERTY GROUP
34
NOTES TO THE FINANCIAL STATEMENTS 30 JUNE 2012
2. SUMMARY OF SIGNIFICANT ACCOUNTING POLICIES (continued)
(c) New accounting standards and interpretations (continued)
(i) Changes in accounting policy and disclosures (continued)
As of 30 June 2011 (statement of financial position)
Increase in cash and cash equivalents of $19.1 million Increase in trade and trade receivables of $2.8 million Increase in inventory of $0.5 million Decrease in property loans of $167.9 million Increase in other assets of $0.9 million Increase in investment properties of $585.0 million Decrease in other financial assets of $40.8 million Increase in property, plant and equipment of $143.9 million Decrease in equity accounted investments of $28.1 million Increase in deferred tax assets of $4.0 million Increase in trade and other payables of $17.1 million Increase in interest bearing loans and borrowings of $392.7 million Increase in income tax payable of $0.6 million Increase in other liabilities of $1.5 million Increase in derivatives at fair value of $1.3 million Increase in other financial liabilities of $49.9 million Reduction in issued capital (recognition of issue costs) of $3.4 million Increase in asset revaluation reserve of $0.1 million Decrease in foreign currency translation reserve of $0.5 million Increase in accumulated losses $82.1 million Increase in non-controlling interests in equity of $132.9 million
Additional qualitative and quantitative disclosures have been added with respect to subsidiaries with material non-controlling interest. Refer to note 25.
AASB 11 Joint Arrangements: adoption has had no impact in the Group’s method of accounting for its joint arrangements. The adoption of AASB 12 has resulted in the Group disclosing the summarised financial information of material investments in joint arrangements. Prior to adoption of AASB12, the Group’s share of summarised financial information was disclosed.
AASB 12 Disclosure of Interests in Other Entities: adoption has resulted in the Group disclosing the summarised financial information of material investments in joint arrangements. Prior to adoption of AASB12, the Group’s share of summarised financial information was disclosed.
(ii) Accounting Standards and Interpretations issued but not yet effective.
Australian Accounting Standards and Interpretations that have recently been issued or amended but are not yet effective have not been adopted by the Group for the annual reporting period ended 30 June 2012. These are outlined in the table below.
For
per
sona
l use
onl
y

ABACUS PROPERTY GROUP
35
NOTES TO THE FINANCIAL STATEMENTS 30 JUNE 2012
2. SUMMARY OF SIGNIFICANT ACCOUNTING POLICIES (continued)
(c) New accounting standards and interpretations (continued)
Reference Summary Application date of
standard*
Impact on Group financial report Application date for Group*
AASB 2010-8 These amendments address the determination of deferred tax on investment property measured at fair value and introduce a rebuttable presumption that deferred tax on the basis that the carrying amount will be recoverable through sale. The amendments also incorporate SIC-21 Income Taxes – Recovery of Revalued Non-depreciable Assets into AASB 112.
1 January 2012
This revision will not have a material impact on the Group’s financial statements and the way it currently discloses deferred tax assets and liabilities.
1 July 2012
AASB 9 AASB 9 includes requirements for the classification and measurement of financial assets. It was further amended by AASB 2010-7 to reflect amendments to the accounting for financial liabilities. These requirements improve and simplify the approach for classification and measurement of financial assets compared with the requirements of AASB 139. The main changes are described below. (a) Financial assets that are debt instruments
will be classified based on (1) the objective of the entity’s business model for managing the financial assets; (2) the characteristics of the contractual cash flows.
(b) Allows an irrevocable election on initial recognition to present gains and losses on investments in equity instruments that are not held for trading in other comprehensive income. Dividends in respect of these investments that are a return on investment can be recognised in profit or loss and there is no impairment or recycling on disposal of the instrument.
(c) Financial assets can be designated and measured at fair value through profit or loss at initial recognition if doing so eliminates or significantly reduces a measurement or recognition inconsistency that would arise from measuring assets or liabilities, or recognising the gains and losses on them, on different bases.
(d) Where the fair value option is used for financial liabilities the change in fair value is to be accounted for as follows: - The change attributable to changes in
credit risk are presented in other comprehensive income (OCI)
- The remaining change is presented in profit or loss.
Consequential amendments were also made to other standards as a result of AASB 9, introduced by AASB 2009-11 and superseded by AASB 2010-7 and 2010-10.
1 January 2015
The Group will review the classification of its existing financial assets and liabilities in line with the standard, such as secured and related party loans, options and derivatives. The tests above with respect to any potential reclassification of financial assets with variable cash flows will depend on the facts applicable at transition date and cannot be reasonably estimated at this time.
1 July 2015
For
per
sona
l use
onl
y

ABACUS PROPERTY GROUP
36
NOTES TO THE FINANCIAL STATEMENTS 30 JUNE 2012
2. SUMMARY OF SIGNIFICANT ACCOUNTING POLICIES (continued)
(c) New accounting standards and interpretations (continued) Reference Summary Application
date of standard*
Impact on Group financial report Application date for Group*
AASB 13 AASB 13 establishes a single source of guidance for determining the fair value of assets and liabilities. AASB 13 does not change when an entity is required to use fair value, but rather, provides guidance on how to determine fair value when fair value is required or permitted. Application of this definition may result in different fair values being determined for the relevant assets. AASB 13 also expands the disclosure requirements for all assets or liabilities carried at fair value. This includes information about the assumptions made and the qualitative impact of those assumptions on the fair value determined. Consequential amendments were also made to other standards via AASB 2011-8.
1 January 2013
The Group will review the assets and liabilities requiring measurement at fair value. There will be no material financial impact on the Group however the Group may be required to increase its level of disclosure.
1 July 2013
AASB 119
The main change introduced by this standard is to revise the accounting for defined benefit plans. The amendment removes the options for accounting for the liability, and requires that the liabilities arising from such plans is recognised in full with actuarial gains and losses being recognised in other comprehensive income. It also revised the method of calculating the return on plan assets. The revised standard changes the definition of short-term employee benefits. The distinction between short-term and other long-term employee benefits is now based on whether the benefits are expected to be settled wholly within 12 months after the reporting date. Consequential amendments were also made to other standards via AASB 2011-10.
1 January 2013
This revision will have no impact on how the Group measures its employee benefits.
1 July 2013
Annual Improvements 2009-2011 Cycle
This standard sets out amendments to IFRSs and the related bases for conclusions and guidance made during the International Accounting Standards Boards Annual Improvements process. These amendments have not yet been adopted by the AASB. The following items are addressed by this standard: IFRS 1 First-time Adoption of International Reporting Standards • Repeated application of IFRS 1 • Borrowing costs IAS 1 Presentation of Financial Statements • Clarification of the requirements for
comparative information IAS 16 Property, Plant and Equipment • Classification of servicing equipment IAS 32 Financial Instruments: Presentation • Tax effect of distribution to holders of equity
instruments IAS 34 Interim Financial Reporting • Interim financial reporting and segment
information for total assets and liabilities
1 January 2013
The Group will review any amendments to the Standards when adopted by the AASB.
1 July 2013
For
per
sona
l use
onl
y

ABACUS PROPERTY GROUP
37
NOTES TO THE FINANCIAL STATEMENTS 30 JUNE 2012
2. SUMMARY OF SIGNIFICANT ACCOUNTING POLICIES (continued)
(c) New accounting standards and interpretations (continued) Reference Summary Application
date of standard*
Impact on Group financial report Application date for Group*
AASB 1053 Application of Tiers of Australian Accounting Standards
This Standard establishes a differential financial reporting framework consisting of two Tiers of reporting requirements for preparing general purpose financial statements: (a) Tier 1: Australian Accounting Standards (b) Tier 2: Australian Accounting Standards –
Reduced Disclosure Requirements Tier 2 comprises the recognition, measurement and presentation requirements of Tier 1 and substantially reduced disclosures corresponding to those requirements. The following entities apply Tier 1 requirements in preparing general purpose financial statements: (a) For-profit entities in the private sector that
have public accountability (as defined in this Standard)
(b) The Australian Government and State, Territory and Local Governments
The following entities apply either Tier 2 or Tier 1 requirements in preparing general purpose financial statements: (a) For-profit private sector entities that do not
have public accountability (b) All not-for-profit private sector entities (c) Public sector entities other than the
Australian Government and State, Territory and Local Governments
1 July 2013 The Group is required to report under the Tier 1 requirement as a for-profit entity in the private sector that has public accountability. There will be no impact to the reporting requirements of the Group.
1 July 2013
*designates the beginning of the applicable annual reporting period AASB 2011-3, AASB 2011-4, AASB 2011-9, and Interpretation 20 will have no application to the Group.
For
per
sona
l use
onl
y

ABACUS PROPERTY GROUP
38
NOTES TO THE FINANCIAL STATEMENTS 30 JUNE 2012
2. SUMMARY OF SIGNIFICANT ACCOUNTING POLICIES (continued)
(d) Basis of consolidation
The consolidated financial statements comprise the financial statements of AGHL and its subsidiaries, AT and its subsidiaries, AGPL and its subsidiaries, AIT and its subsidiaries, ASPT and its subsidiaries and ASOL and its subsidiaries collectively referred to as the Group.
Subsidiaries are all those entities over which the Group has power over the investee such that the Group is able to direct the relevant activities, has exposure or rights to variable returns from its involvement with the investee and has the ability to use its power over the investee to affect the amount of the investor’s returns.
The adoption of AASB 10 has led to the consolidation of Abacus Hospitality Fund, Abacus Storage Fund (until merger in March 2012), Abacus Diversified Income Fund II and Abacus Miller Street Holding Trust. This is due to the combination of the Group’s role as responsible entity and its exposure to available returns arising from its collective equity and loan investments in these funds and certain guarantees.
The financial statements of subsidiaries are prepared for the same reporting period as the parent company, using consistent accounting policies with adjustments made to bring into line any dissimilar accounting policies that may exist.
All intercompany balances and transactions, including unrealised profits from intra-group transactions, have been eliminated in full and subsidiaries are consolidated from the date on which control is transferred to the Group and cease to be consolidated from the date on which control is transferred out of the Group. Where there is a loss of control of a subsidiary, the consolidated financial statements include the results for the part of the reporting period during which the Group has control.
The acquisition of subsidiaries is accounted for using the purchase method of accounting. The purchase method of accounting involves allocating the cost of the business combination to the fair value of the assets acquired and the liabilities and contingent liabilities assumed at the date of acquisition.
Non-controlling interests are allocated their share of net profit after tax in the consolidated income statement and are presented within equity in the consolidated statement of financial position, separately from the equity of the owners of the parent.
Non-controlling interests represent those equity interests in Abacus Hospitality Fund, Abacus Miller Street Holding Trust, Abacus Jigsaw Trust and Abacus Independent Retail Property Trust (and Abacus Storage Fund until the date of merger being 6 March 2012) that are not held by the Group and are presented separately in the income statement and within equity in the consolidated statement of financial postion.
(e) Foreign currency translation
Functional and presentation currency
Both the functional and presentation currency of the Group are in Australian dollars. Each entity in the Group determines its own functional currency and items are included in the financial statements of each entity are measured using that functional currency.
Transactions and balances
Transactions in foreign currencies are initially recorded in the functional currency by applying the exchange rates ruling at the date of the transaction. Monetary assets and liabilities denominated in foreign currencies are retranslated at the rate of exchange ruling at the balance sheet date.
All exchange differences in the consolidated financial report are taken to profit or loss with the exception of differences on foreign currency borrowings on translation of foreign operations that provide a hedge against a net investment in a foreign operation. These are taken directly to equity until the disposal of the net investment, at which time they are recognised in profit or loss. On disposal of a foreign operation, the cumulative amount recognised in equity relating to that particular foreign operation is recognised in profit or loss. Tax charges and credits attributable to exchange differences on those borrowings are also recognised in equity.
Non-monetary items that are measured in terms of historical cost in a foreign currency are translated using the exchange rate as at the date of the initial transaction. Non-monetary items measured at fair value in a foreign currency are translated using the exchange rates at the date when the fair value was determined.
For
per
sona
l use
onl
y

ABACUS PROPERTY GROUP
39
NOTES TO THE FINANCIAL STATEMENTS 30 JUNE 2012
2. SUMMARY OF SIGNIFICANT ACCOUNTING POLICIES (continued)
(e) Foreign currency translation (continued)
At reporting date the assets and liabilities of these entities are translated into the presentation currency of the Group at the rate of exchange prevailing at balance date and the financial performance is translated at the average exchange rate prevailing during the reporting period. The exchange differences arising on translation are taken directly to the foreign currency translation reserve in equity.
(f) Revenue recognition
Revenue is recognised and measured at the fair value of the consideration received or receivable to the extent it is probable that the economic benefits will flow to the Group and the revenue can be reliably measured. The following specific recognition criteria must also be met before revenue is recognised:
Rental and Storage income
Rental income from investment properties is accounted for on a straight-line basis over the lease term.
Contingent rental income is recognised as income in the periods in which it is earned. Lease incentives granted are recognised as an integral part of the total rental income.
Hotel Income
Revenue from rooms is recognised and accrued on the provision of rooms or on the date of which rooms are to be provided in accordance with the terms and conditions of the bookings. Advance deposits from customers received are not recognised as revenue until such time when the rooms have been provided or when the customers forfeit the deposits due to failure of attendance.
Finance Income
Revenue is recognised as interest accrues using the effective interest method. This is a method of calculating the
amortised cost of a financial asset and allocating the interest income over the relevant period using the effective interest rate, which is the rate that exactly discounts estimated future cash receipts through the expected life of the financial asset to the net carrying amount of the financial asset.
Income from the sale of joint venture profit share rights is recognised when the Group enters into arrangements with other parties which result in the Group receiving consideration for the sale of its right to receive a profit share from the joint venture
Dividends and distributions
Revenue is recognised when the Group’s right to receive the payment is established.
Net change in fair value of investments and financial instruments derecognised during the year
Revenue from sale of investments is recognised on settlement when the significant risks and rewards of the ownership of the investments have been transferred to the buyer. Risks and rewards are generally considered to have passed to the buyer at the time of settlement of the sale. Financial instruments are derecognised when the right to receive or pay cash flows from the financial derivative has expired or when the entity transfers substantially all the risks and rewards of the financial derivative through termination. Gains or losses due to derecognition are recognised in the statement of comprehensive income.
Net change in fair value of investments held at balance date
Changes in net market value of investments are recognised as revenue or expense in determining the net profit for the period.
Property development sales
Revenue from property development sales is recognised when the significant risks, rewards of ownership and effective control has been transferred to the purchaser which has been determined to occur upon settlement and after contractual duties are completed.
No revenue is recognised if there are significant uncertainties regarding recovery of the consideration due, the costs incurred or to be incurred cannot be measured reliably, there is a risk of return or there is continuing management involvement to the degree usually associated with ownership.
For
per
sona
l use
onl
y

ABACUS PROPERTY GROUP
40
NOTES TO THE FINANCIAL STATEMENTS 30 JUNE 2012
2. SUMMARY OF SIGNIFICANT ACCOUNTING POLICIES (continued)
(g) Expenses
Expenses including rates, taxes and other outgoings, are brought to account on an accrual basis and any related payables are carried at cost.
(h) Cash and cash equivalents
Cash and cash equivalents in the balance sheet comprise cash at bank and in hand and short-term deposits with an original maturity of three months or less that are readily convertible to known amounts of cash which are subject to an insignificant risk of changes in value.
For the purposes of the Statement of Cash Flow, cash and cash equivalents consist of cash and cash equivalents as defined above.
(i) Trade and other receivables
Trade receivables, which generally have 30 day terms, are recognised at amortised cost, which in the case of the Group, is the original invoice amount less an allowance for any uncollectible amounts.
Collectibility of trade receivables is reviewed on an ongoing basis. An allowance for doubtful debts is raised when there is objective evidence that collection of the full amount is no longer probable. Bad debts are written off when identified.
(j) Derivative financial instruments and hedging
The Group utilises derivative financial instruments, both foreign exchange and interest rate swaps to manage the risk associated with foreign currency and interest rate fluctuations. Such derivative financial instruments are recognised at fair value.
The Group has set defined policies and implemented hedging policies to manage interest and exchange rate risks. Derivative instruments are transacted in line with these policies to achieve the economic outcomes in line with the Group’s treasury and hedging policy. They are not transacted for speculative purposes.
The Group does not employ hedge accounting and as such derivatives are recorded at fair value with gains or losses arising from the movement in fair values recorded in the income statement.
(k) Investments and other financial assets
All investments are initially recognised at cost, being the fair value of the consideration given.
Financial assets in the scope of AASB 139 Financial Instruments: Recognition and Measurement are classified as either financial assets at fair value through profit or loss, loans and receivables, held to maturity investments, or available-for-sale financial assets. The Group determines the classification of its financial assets after initial recognition and, when allowed and appropriate, re-evaluates this designation at each financial year-end. At 30 June 2012 the Group’s investments in listed and unlisted securities have been classified as financial assets at fair value through profit or loss and property loans are classified as loans and receivables.
Recognition and derecognition
Purchases and sales of financial assets that require delivery of assets within the time frame generally established by regulation or convention in the market place are recognised on the trade date i.e. the date that the Group commits to purchase the assets. Financial assets are derecognised when the right to receive cash flows from the financial assets have expired or been transferred.
After initial recognition, investments, which are classified as held for trading, are measured at fair value. Financial assets are classified as held for trading if they are acquired for the purpose of selling in the near term with the intention of making a profit. Gains or losses on investments held for trading are recognised in the income statement.
For investments that are actively traded in organised financial markets, fair value is determined by reference to the Australian Securities Exchange quoted market bid prices at the close of business on the balance sheet date.
For investments where there is no quoted market or unit price, fair value is determined by reference to the current market value of another instrument which is substantially the same or is calculated based on the expected cash flows of the underlying net asset base of the investment.
For
per
sona
l use
onl
y

ABACUS PROPERTY GROUP
41
NOTES TO THE FINANCIAL STATEMENTS 30 JUNE 2012
2. SUMMARY OF SIGNIFICANT ACCOUNTING POLICIES (continued)
(k) Investments and other financial assets (continued)
Financial assets at fair value through profit or loss
A financial asset or financial liability at fair value is designated by the entity at fair value through the profit and loss upon initial recognition. APG uses this designation where doing so results in more relevant information. This group of financial assets and liabilities are managed and their performance evaluated on a fair value basis, in accordance with APG’s documented risk management and investment strategy which outlines that these assets and liabilities are managed on a total rate of return basis, and information about the instruments is provided internally on that basis to the entity’s key management personnel and the Board.
APG enters into loans and receivables with associated options that provide for a variety of outcomes including repayment of principal and interest, satisfaction through obtaining interests in equity or property or combinations thereof. The fair value of the maximum exposure to credit risk in relation to these instruments was $27.9 million (2011: $27.4 million).
Loans and receivables
Loans and receivables are non-derivative financial assets with fixed or determinable payments that are not quoted in an active market. Such assets are carried at amortised cost using the effective interest method. Gains and losses are recognised in profit or loss when the loans and receivables are derecognised or impaired, as well as through the amortisation process.
Subsidiaries
Investment in subsidiaries are held at lower of cost or recoverable amount.
(l) Investment in associates
The Group’s investments in its associates are accounted for under the equity method of accounting in the consolidated financial statements. The associates are entities over which the Group has significant influence but not control and accordingly are neither subsidiaries nor joint ventures.
The investment in the associates is carried in the consolidated balance sheet at cost plus post-acquisition changes in the Group’s share of net assets of the associates, less any impairment in value. The Group’s share of its associates’ post-acquisition profits or losses is recognised in the income statement, and its share of post-acquisition movements in reserves is recognised in reserves. The cumulative post-acquisition movements are adjusted against the carrying amount of the investment.
When the Group’s share of losses in an associate equals or exceeds its interest in the associate, including any unsecured long-term receivable and loans, the Group does not recognise further losses, unless it has incurred obligations or made payments on behalf of the associate.
The reporting dates of the associates and the Group are identical and the associates’ accounting policies conform to those used by the Group for like transactions and events in similar circumstances.
Investments in associates held by the parent are held at lower of cost and recoverable amount in the parent’s financial statements.
(m) Interest in joint arrangements
The Group’s interest in joint venture entities is accounted for under the equity method of accounting in the consolidated financial statements. The investment in the joint venture entities is carried in the consolidated balance sheet at cost plus post-acquisition changes in the Group’s share of net assets of the joint ventures, less any impairment in value. The consolidated income statement reflects the Group’s share of the results of operations of the joint ventures.
Investments in joint ventures are held at lower of cost or recoverable amount in the investing entities.
The Group’s interest in joint operations that give the parties a right to the underlying assets and obligations themselves is accounted for by recognising the share of those assets and obligations.
For
per
sona
l use
onl
y
ABACUS PROPERTY GROUP
42
NOTES TO THE FINANCIAL STATEMENTS 30 JUNE 2012
2. SUMMARY OF SIGNIFICANT ACCOUNTING POLICIES (continued)
(n) Property, plant and equipment
Land and buildings are measured at fair value, based on periodic valuations by external independent valuers, less accumulated depreciation on buildings and less any impairment losses recognised after the date of the revaluation.
Plant and equipment is stated at historical cost less accumulated depreciation and any impairment losses.
Depreciation is calculated on a straight-line basis over the estimated useful life of the asset as follows:
Buildings – 40 years Buildings (Hotel) – 50 years
Plant and equipment – over 5 to 15 years Plant and equipment (Hotel) over 3 to 20 years
Impairment
The carrying values of property, plant and equipment are reviewed for impairment when events or changes in circumstances indicate the carrying value may not be recoverable. For an asset that does not generate largely independent cash inflows, the recoverable amount is determined for the cash-generating unit to which the asset belongs.
If any such indication exists and where the carrying values exceed the estimated recoverable amount, the assets or cash-generating units are written down to their recoverable amount.
The recoverable amount of property (including land and buildings), plant and equipment is the greater of fair value less costs to sell and value in use. In assessing value in use, the estimated future cash flows are discounted to their present value using a pre-tax discount rate that reflects current market assessments of the time value of money and the risks specific to the assets.
Impairment losses are recongised in the income statement.
Independent valuations are performed with sufficient regularity to ensure that the carrying amount does not differ materially from the asset’s fair value at the balance sheet date.
Revaluations of land and buildings
Any revaluation increment is credited to the asset revaluation reserve included in the equity section of the balance sheet except to the extent that it reverses a revaluation decrease of the same asset previously recognised in profit or loss, in which case the increase is recognised in profit or loss.
Any revaluation decrease is recognised in profit or loss except to the extent that it offsets a previous revaluation increase for the same asset in which case the decrease is debited directly to the asset revaluation reserve to the extent of the credit balance existing in the revaluation reserve for that asset.
Gains and losses on disposals are determined by comparing proceeds with the carrying amount. These are included in the income statement.
Any accumulated depreciation as at the revaluation date is eliminated against the gross carrying amounts of the assets and the net amounts are restated to the revalued amounts of the assets.
Disposal
An item of property, plant and equipment is derecognised upon disposal or when no future economic benefits are expected to arise from the continued use of the asset.
Any gain or loss arising on derecognition of the asset (calculated as the difference between the net disposal proceeds and the carrying amount of the asset) is included in the income statement in the year the asset is derecognised.
For
per
sona
l use
onl
y

ABACUS PROPERTY GROUP
43
NOTES TO THE FINANCIAL STATEMENTS 30 JUNE 2012
2. SUMMARY OF SIGNIFICANT ACCOUNTING POLICIES (continued)
(o) Investment properties
Investment properties are measured initially at cost, including transaction costs. The carrying amount includes the cost of replacing parts of an existing investment property at the time that the cost is incurred if the recognition criteria are met, and excludes the costs of day-to-day servicing of an investment property. Subsequent to initial recognition, investment properties are stated at fair value, which reflects market and property specific conditions at the balance sheet date. Gains or losses arising from changes in the fair values of investment properties are recognised in the income statement in the year in which they arise.
Investment properties are derecognised either when they have been disposed of or when the investment property is permanently withdrawn from use and no future economic benefit is expected from its disposal. Any gains or losses on the retirement or disposal of an investment property are recognised in the income statement in the year of retirement or disposal.
Investment properties under construction are carried at fair value after allowing for the remaining expected costs of completion plus an appropriate risk adjusted development margin.
Transfers are made to investment property when, and only when, there is a change in use, evidenced by commencement of an operating lease to another party or ending of construction or development. Transfers are made from investment property when, and only when, there is a change in use, evidenced by commencement of development with a view to sale.
For a transfer from investment property to inventories, the deemed cost of property for subsequent accounting is its fair value at the date of change in use. For a transfer from inventories to investment property, any difference between the fair value of the property at that date and its previous carrying amount is recognised in profit or loss. When the Group completes the construction or development of a “self-constructed investment property”, any difference between the fair value of the property at that date and its previous carrying amount is recognised in profit or loss.
Land and buildings are considered to have the function of an investment and are therefore regarded as a composite asset, the overall value of which is influenced by many factors, the most prominent being income yield, rather than diminution in value of the building content due to the passing of time. Accordingly, the buildings and all components thereof, including integral plant and equipment, are not depreciated.
Investment properties are independently valued on a staggered basis every two years unless the underlying financing requires a more frequent independent valuation cycle. In determining fair value, the capitalisation of net income method and the discounting of future cashflows to their present value have been used.
Lease incentives provided by the Group to lessees, and rental guarantees which may be received by the Group from third parties (arising from the acquisition of investment properties) are included in the measurement of fair value of investment property. Leasing costs are treated as separate assets and are amortised over the respective periods to which the lease incentives and rental guarantees apply, either using a straight-line basis, or a basis which is more representative of the pattern of benefits.
Under AASB 140, investment properties, including any plant and equipment, are not subject to depreciation. However, depreciation allowances in respect of certain buildings, plant and equipment are currently available to investors for taxation purposes.
For
per
sona
l use
onl
y

ABACUS PROPERTY GROUP
44
NOTES TO THE FINANCIAL STATEMENTS 30 JUNE 2012
2. SUMMARY OF SIGNIFICANT ACCOUNTING POLICIES (continued)
(p) Leases
The determination of whether an arrangement is or contains a lease is based on the substance of the arrangement and requires an assessment of whether the fulfilment of the arrangement is dependent on the use of a specific asset or assets and the arrangement conveys a right to use the asset.
Group as lessee
Operating lease payments are recognised as an expense in the income statement on a straight-line basis over the lease term. Lease incentives are recognised in the income statement as an integral part of the total lease expense.
Group as a lessor
Leases in which the Group retains substantially all the risks and benefits of ownership of the lease assets are classified as operating leases.
(q) Goodwill and Intangibles
Goodwill
Goodwill on acquisition is initially measured at cost being the excess of the cost of the business combination over the acquirer’s interest in the net fair value of the identifiable assets, liabilities and contingent liabilities. Following initial recognition, goodwill is measured at cost less any accumulated impairment losses and is not amortised. Goodwill is reviewed for impairment, annually or more frequently if events or changes in circumstances indicate that the carrying value may be impaired.
For the purpose of impairment testing, goodwill acquired in a business combination is, from the acquisition date, allocated to each of the Group’s cash-generating units, or groups of cash-generating units, that are expected to benefit from the synergies of the combination, irrespective of whether other assets or liabilities of the Group are assigned to those units or groups of units. Each unit or group of units to which the goodwill is so allocated:
• Represents the lowest level within the Group at which the goodwill is monitored for internal management purposes; and
• Is not larger than a segment based on either the Group’s primary or the Group’s secondary reporting format determined in accordance with AASB 8 Operating Segments.
Impairment is determined by assessing the recoverable amount of the cash-generating unit (group of cash-generating units), to which the goodwill relates. When the recoverable amount of the cash-generating unit (group of cash-generating units) is less that the carrying amount, an impairment loss is recognised. When goodwill forms part of a cash-generating unit (group of cash-generating units) and an operation within that unit is disposed of, the goodwill associated with the operation disposed of is included in the carrying amount of the operation when determining the gain or loss on disposal of the operation. Goodwill disposed of in this manner is measured based on the relative values of the operation disposed of and the portion of the cash-generating unit retained.
Impairment losses recognised for goodwill are not subsequently reversed.
Intangible assets
Intangible assets acquired separately or in a business combination are initially measured at cost. Following initial recognition, intangibles are carried at cost less accumulated amortisation and impairment losses.
Intangible assets created within the business are not capitalised and expenditure is charged against profits in the period in which the expenditure is incurred.
The useful lives of these intangible assets are assessed to be either finite or indefinite. Intangible assets with finite lives are amortised over the useful life and assessed for impairment whenever there is an indication that the intangible asset maybe impaired. The amortisation period and the amortisation method for an intangible asset with a finite life is reviewed at least each financial year-end. Changes in the expected useful life or the expected pattern of consumption of future economic benefit embodied in the asset are accounted for prospectively by changing the amortisation period or method, as appropriate, which is a change in an accounting estimate. The amortisation expense on intangible assets with finite lives is recognised in the income statement through the ‘depreciation and amortisation expense’ line item.
For
per
sona
l use
onl
y

ABACUS PROPERTY GROUP
45
NOTES TO THE FINANCIAL STATEMENTS 30 JUNE 2012
2. SUMMARY OF SIGNIFICANT ACCOUNTING POLICIES (continued)
(q) Goodwill and Intangibles (continued)
Intangible assets (continued)
Intangible assets with indefinite useful lives are tested for impairment annually either individually or at the cash generating unit level. Such intangibles are not amortised. The useful life of an intangible asset with an indefinite life is reviewed each reporting period to determine whether the indefinite life assessment continues to be supportable. If not, the change in the useful life assessment from indefinite to finite is accounted for as a change in an accounting estimate and is thus accounted for on a prospective basis.
(r) Impairment of non-financial assets other than goodwill
Intangible assets that have an indefinite useful life are not subject to amortisation and are tested annually for impairment, or more frequently if events or changes in circumstances indicate that they might be impaired. Other assets are tested for impairment whenever events or changes in circumstances indicate that the carrying amount may not be recoverable. An impairment loss is recognised for the amount by which the asset’s carrying amount exceeds its recoverable amount. Recoverable amount is the higher of an asset’s fair value less costs to sell and value in use. For the purposes of assessing impairment, assets are grouped at the lowest levels for which there are separately identifiable cash inflows that are largely independent of the cash inflows from other assets or groups of assets (cash-generating units). Non-financial assets other that goodwill that suffered an impairment are tested for possible reversal of the impairment whenever events or changes in circumstances indicate that the impairment may have reversed.
(s) Trade and other payables
Trade payables and other payables are carried at amortised cost. They represent liabilities for goods and services provided to the Group prior to the end of the financial year that are unpaid and arise when the Group becomes obliged to make future payments in respect of the purchase of these goods and services. The amounts are unsecured and are usually paid within 30 days of recognition.
(t) Provisions and employee leave benefits
Provisions are recognised when the Group has a present obligation (legal or constructive) as a result of a past event and it is probable that an outflow of resources embodying economic benefits will be required to settle the obligation and a reliable estimate can be made of the amount of the obligation.
Provisions are measured at the present value of management’s best estimate of the expenditure required to settle the present obligation at the balance sheet date. If the effect of the time value of money is material, provisions are discounted using a current pre-tax rate that reflects the time value of money and the risks specific to the liability. The increase in the provision resulting from the passage of time is recognised in finance costs.
Employee leave benefits
(i) Wages, salaries, annual leave and sick leave
Liabilities for wages and salaries, including non-monetary benefits, annual leave and accumulating sick leave expected to be settled within 12 months of the reporting date are recognised in respect of employees’ services up to the reporting date. They are measured at the amounts expected to be paid when the liabilities are settled. Liabilities for non-accumulating sick leave are recognised when the leave is taken and are measured at the rates paid or payable.
ii) Long service leave
The liability for long service leave is recognised and measured as the present value of expected future payments to be made in respect of services provided by employees up to the reporting date using the projected unit credit method. Consideration is given to expected future wage and salary levels, experience of employee departures, and periods of service. Expected future payments are discounted using market yields at the reporting date on national government bonds with terms to maturity and currencies that match, as closely as possible, the estimated future cash outflows.
For
per
sona
l use
onl
y
ABACUS PROPERTY GROUP
46
NOTES TO THE FINANCIAL STATEMENTS 30 JUNE 2012
2. SUMMARY OF SIGNIFICANT ACCOUNTING POLICIES (continued)
(u) Distributions and dividends
Trusts generally distribute their distributable assessable income to their unitholders. Such distributions are determined by reference to the taxable income of the respective trusts. Distributable income may include capital gains arising from the disposal of investments and tax-deferred income. Unrealised gains and losses on investments that are recognised as income are usually retained and are generally not assessable or distributable until realised. Capital losses are not distributed to security holders but are retained to be offset against any future realised capital gains.
A liability for dividend or distribution is recognised in the Balance Sheet if the dividend or distribution has been declared, determined or publicly recommended prior to balance date.
(v) Interest-bearing loans and borrowings
All loans and borrowings are initially recognised at cost, being the fair value of the consideration received net of transaction costs associated with the borrowing.
After initial recognition, interest-bearing loans and borrowings are subsequently measured at amortised cost using the effective interest method. Fees paid in the establishment of loan facilities that are yield related are included as part of the carrying amount of loans and borrowings.
Borrowings are classified as non-current liabilities where the Group has an unconditional right to defer settlement of the liability for at least 12 months after the balance sheet date.
Borrowing Costs
Borrowing costs are recognised as an expense when incurred unless they relate to a qualifying asset or to upfront borrowing establishment and arrangement costs, which are deferred and amortised as an expense over the life of the facility. A qualifying asset is an asset that generally takes more than 12 months to get ready for its intended use or sale. In these circumstances, the financing costs are capitalised into the cost of the asset. Where funds are borrowed by the Group for the acquisition or construction of a qualifying asset, the amount of the borrowing costs capitalised are those incurred in relation to the borrowing.
(w) Contributed equity
Issued and paid up capital is recognised at the fair value of the consideration received by the Group. Stapled securities are classified as equity. Incremental costs directly attributable to the issue of new
securities are shown
in equity as a deduction, net of tax, from the proceeds.
(x) Transfers to / (from) total equity
In respect of the Group, revaluation increments or decrements arising from changes in the fair value of investment properties and derivative financial instruments, unrealised gains and losses in the net value of investments, accrued income not yet assessable and expenses provided for or accrued not yet deductible, net capital losses and tax free or tax deferred amounts maybe transferred to equity and may not be included in the determination of distributable income.
(y) Non-current assets held for sale
Before classification as held for sale the measurement of the assets is updated. Upon classification as held for sale, assets are recognised at the lower of carrying amount and fair value less costs to sell with the exception of investment properties which are valued in accordance with 2(q).
Gains and losses from revaluations on initial classification and subsequent re-measurement are recognised in the income statement.
For
per
sona
l use
onl
y

ABACUS PROPERTY GROUP
47
NOTES TO THE FINANCIAL STATEMENTS 30 JUNE 2012
2. SUMMARY OF SIGNIFICANT ACCOUNTING POLICIES (continued)
(z) Inventories
Property Development
Inventories are stated at the lower of cost and net realisable value. Net realisable value is determined on the basis of sales in the ordinary course of business. Expenses of marketing, selling and distribution to customers are estimated and deducted to establish net realisable value. Where the net realisable value of inventory is less than cost, an impairment expense is recognised in the consolidated income statement. Reversals of previously recognised impairment charges are recognised in the consolidated income statement such that the inventory is always carried at the lower of cost and net realisable value. Cost includes the purchase consideration, development costs and holding costs such as borrowing costs, rates and taxes.
Hotel
Inventories are valued at the lower of cost and net realisable value.
Net realisable value is the estimated selling price in the ordinary course of business, less the estimated costs necessary to make the sale.
(za) Taxation
The Group comprises taxable and non-taxable entities. A liability for current and deferred tax and tax expense is only recognised in respect of taxable entities that are subject to income tax and potential capital gains tax as detailed below.
Trust income tax
Under current Australian income tax legislation AT, AIT, ASPT, AHT, ADIFII and AMSHT are not liable to Australian income tax provided security holders are presently entitled to the taxable income of the trusts and the trusts generally distribute their taxable income.
Company income tax
AGHL and its Australian resident wholly-owned subsidiaries, ASOL and its Australian resident wholly-owned subsidiaries and AHL and its Australian resident wholly-owned subsidiaries have formed separate tax consolidation groups. AGHL, ASOL and AHL have entered into tax funding agreements with their Australian resident wholly-owned subsidiaries, so that each subsidiary agrees to pay or receive its share of the allocated tax at the current tax rate.
The head tax entity and the controlled entities in each tax consolidated group continue to account for their own current and deferred tax amounts.
In addition to its own current and deferred tax amounts, the head tax entity also recognises the current tax liabilities (or assets) and the deferred tax assets arising from unused tax losses and unused tax credits assumed from controlled entities in the tax consolidated group.
Assets or liabilities arising under tax funding agreements with the tax consolidated entities are recognised as amounts receivable from or payable to other entities in the group.
Any difference between the amounts assumed and amounts receivable of payable under the tax funding agreements are recognised as a contribution to (or distribution from) wholly-owned tax consolidated entities.
Current tax assets and liabilities for the current and prior periods are measured at the amount expected to be recovered from or paid to the taxation authorities. The tax rates and tax laws used to compute the amount are those that are enacted or substantively enacted by the balance sheet date.
Deferred income tax assets are recognised for all deductible temporary differences, carry forward of unused tax assets and unused tax losses, to the extent that it is probable that taxable profit will be available against which the deductible temporary differences, and the carry-forward of unused tax assets and unused tax losses can be utilised, except:
For
per
sona
l use
onl
y

ABACUS PROPERTY GROUP
48
NOTES TO THE FINANCIAL STATEMENTS 30 JUNE 2012
2. SUMMARY OF SIGNIFICANT ACCOUNTING POLICIES (continued)
(za) Taxation (continued)
Company income tax (continued)
when the deferred income tax asset relating to the deductible temporary difference arises from the initial recognition of an asset or liability in a transaction that is not a business combination and, at the time of the transaction, affects neither the accounting profit nor taxable profit or loss; or
when the deductible temporary differences associated with investments in subsidiaries, associates and interests in joint ventures, deferred tax assets are only recognised to the extent that it is probable that the temporary differences will reverse in the foreseeable future and taxable profit will be available against which the temporary differences can be utilised.
The carrying amount of deferred income tax assets is reviewed at each balance sheet date and reduced to the extent that it is no longer probable that sufficient taxable profit will be available to allow all or part of the deferred income tax asset to be utilised.
Unrecognised deferred income tax assets are reassessed at each balance sheet date and are recognised to the extent that it has become probable that future taxable profit will allow the deferred tax asset to be recovered.
Deferred income tax is provided on all temporary differences at the balance sheet date between the tax bases of assets and liabilities and their carrying amounts for financial reporting purposes.
Deferred income tax liabilities are recognised for all taxable temporary differences, except:
when the deferred income tax liability arises from the initial recognition of an asset or liability in a transaction that is not a business combination and, at the time of the transaction, affects neither the accounting profit nor taxable profit or loss; or
when the taxable temporary differences associated with investments in subsidiaries, associates and interests in joint ventures, and the timing of the reversal of the temporary differences can be controlled and it is probable that the temporary differences will not reverse in the foreseeable future.
Deferred income tax assets and liabilities are measured at the tax rates that are expected to apply to the year when the asset is realised or the liability is settled, based on tax rates (and tax laws) that have been enacted or substantively enacted at the balance sheet date.
Income taxes relating to items recognised directly in equity are recognised in equity and not in the income statement.
Deferred tax assets and deferred tax liabilities are offset only if a legally enforceable right exists to set off current tax assets against current tax liabilities and the deferred tax assets and liabilities relate to the same taxable entity and the same taxation authority.
New Zealand
The trusts that operate in New Zealand (“NZ”) are treated as a company for NZ income tax purposes and are taxed at the corporate tax rate of 28% (2011: 30%). NZ income tax paid the Trusts can be claimed as foreign tax credits to offset against foreign income and distributable to security holders. NZ tax losses are carried forward provided the continuity test of ownership is satisfied. Interest expense from the Trusts are fully deductible subject to thin capitalisation considerations. Property revaluation gains or losses are to be excluded from taxable income, with no deferred tax implications as capital gains are not taxed in NZ.
Income derived by companies which are incorporated in Australia and registered in NZ as overseas companies is exempt from tax in Australia where the income has been taxed in NZ. This income is regarded as non-assessable non-exempt income. As such, income tax is calculated on the companies’ NZ taxable income and taxed at the NZ corporate rate of 28% (2011: 30%). F
or p
erso
nal u
se o
nly

ABACUS PROPERTY GROUP
49
NOTES TO THE FINANCIAL STATEMENTS 30 JUNE 2012
2. SUMMARY OF SIGNIFICANT ACCOUNTING POLICIES (continued)
(za) Taxation (continued)
Goods and services tax (GST)
Revenues, expenses and assets are recognised net of the amount of GST except when the GST incurred on a purchase of goods and services is not recoverable from the taxation authority, in which case the GST is recognised as part of the cost of acquisition of the asset or as part of the expense item as applicable; and receivables and payables are stated with the amount of GST included.
The net amount of GST recoverable from, or payable to, the taxation authority is included as part of receivables or payables in the balance sheet.
Cash flows are included in the Cash Flow Statement on a gross basis and the GST component of cash flows arising from investing and financing activities, which is recoverable from, or payable to, the taxation authority are classified as operating cash flows.
Commitments and contingencies are disclosed net of the amount of GST recoverable from, or payable to, the taxation authority.
(zb) Earnings per stapled security (EPSS)
Basic EPSS is calculated as net profit attributable to stapled security holders, adjusted to exclude costs of servicing equity (other than distributions) divided by the weighted average number of stapled securities on issue during the period under review.
Diluted EPSS is calculated as net profit attributable to stapled security holders, adjusted for: costs of servicing equity (other than distributions);
the after tax effect of dividends and interest associated with dilutive potential stapled securities that have been recognised as expenses; and
other non-discretionary changes in revenues or expenses during the period that would result from the dilution of potential stapled securities;
divided by the weighted average number of stapled securities and dilutive potential stapled securities, adjusted for any bonus element.
(zc) Security based payment plans
Executives of the Group may be granted share appreciation rights, which can only be settled in cash (cash-settled transactions). The cost of cash-settled transactions is initially measured at fair value at the grant date using a Monte Carlo Simulation based model, further details of which are given in Note 29. This fair value is expressed over the period until the vesting date with recognition of a corresponding liability. The liability is remeasured to fair value at each reporting date up to and including the settlement date.
For
per
sona
l use
onl
y

ABACUS PROPERTY GROUP
50
NOTES TO THE FINANCIAL STATEMENTS 30 JUNE 2012
3. FINANCIAL RISK MANAGEMENT
The risks arising from the use of the Group’s financial instruments are credit risk, liquidity risk and market risk (interest rate risk, price risk and foreign currency risk).
The Group’s financial risk management focuses on mitigating the unpredictability of the financial markets and its impact on the financial performance of the Group. The Board reviews and agrees policies for managing each of these risks, which are summarised below.
Primary responsibility for identification and control of financial risks rests with the Treasury Management Committee under the authority of the Board. The Board reviews and agrees policies for managing each of the risks identified below, including the setting of limits for trading in derivatives, hedging cover of interest rate risks and cash flow forecast projections.
The main purpose of the financial instruments used by the Group is to raise finance for the Group’s operations. The Group has various other financial assets and liabilities such as trade receivables and trade payables, which arise directly from its operations. The Group also enters into derivative transactions principally interest rate swaps. The purpose is to manage the interest rate exposure arising from the Group’s operations and its sources of finance.
Details of the significant accounting policies and methods adopted, including the criteria for recognition, the basis of measurement and the basis on which income and expenses are recognised, in respect of each class of financial asset, financial liability and equity instrument are disclosed in notes 2 and 4 to the financial statements.
(a) Credit Risk
Credit risk is the risk of financial loss to the Group if a customer or counterparty to a financial instrument fails to meet its contractual obligations, and arises principally from the Group’s receivables from customers, investment in securities and options, secured property loans and interest bearing loans and derivatives with banks.
The Group manages its exposure to risk by: - derivative counterparties and cash transactions are limited to high credit quality financial institutions; - policy which limits the amount of credit exposure to any one financial institution; - providing loans as an investment into joint ventures, associates, related parties and third parties where it is
satisfied with the underlying property exposure within that entity; - regularly monitoring loans and receivables balances on an ongoing basis; - regularly monitoring the performance of its associates, joint ventures, related parties and third parties on an
ongoing basis; and - obtaining collateral as security (where required or appropriate).
The Group’s credit risk is predominately driven by its Property Ventures business which provides loans to third parties, those using the funds for property development and / or investment. The Group mitigates the exposure to this risk by evaluation of the application before acceptance. The analysis will specifically focus on:
- the Loan Valuation Ratio (LVR) at drawdown; - mortgage ranking; - background of the developer (borrower) including previous developments; - background of the owner (borrower) including previous investment track record; - that the terms and conditions of higher ranking mortgages are acceptable to the Group; - appropriate property insurances are in place with a copy provided to the Group; and - market analysis of the completed development being used to service drawdown.
The Group also mitigates this risk by ensuring adequate security is obtained and timely monitoring of the financial instrument to identify any potential adverse changes in the credit quality. F
or p
erso
nal u
se o
nly

ABACUS PROPERTY GROUP
51
NOTES TO THE FINANCIAL STATEMENTS 30 JUNE 2012
3. FINANCIAL RISK MANAGEMENT(continued)
(b) Liquidity risk
Prudent liquidity risk management implies maintaining sufficient cash and marketable securities, the availability of funding through an adequate and diverse amount of committed credit facilities, the ability to close out market positions and the flexibility to raise funds through the issue of new stapled securities or the distribution reinvestment plan.
The Group’s policy is to maintain an available loan facility with banks sufficient to meet expected operational expenses and to finance investment acquisitions for a period of 90 days, including the servicing of financial obligations. Current loan facilities are assessed and extended for a maximum period based on the Group’s expectations of future interest and market conditions.
As at 30 June 2012, the Group had undrawn committed facilities of $253.1 million and cash of $54.1 million which are adequate to cover short term funding requirements.
Further information regarding the Group’s debt profile is disclosed in Note 20.
(c) Refinancing Risk
Refinancing risk is the risk that unfavorable interest rate and credit market conditions result in an unacceptable increase in the Group’s credit margins and interest cost. Refinancing risk arises when the Group is required to obtain debt to fund existing and new debt positions.
The Group is exposed to refinancing risks arising from the availability of finance as well as the interest rates and credit margins at which financing is available. The Group manages this risk by spreading maturities of borrowings and interest rate swaps, diversification of lenders and reviewing potential transactions to understand the impact on the Group’s credit worthiness.
(d) Market Risk
Market risk is the risk that changes in market prices, such as foreign exchange rates, interest rates and equity prices will affect the Group’s income or the value of its holdings of financial instruments. The objective of market risk management is to manage and control market risk exposures within acceptable parameters, while optimising the return.
Foreign currency risk
The Group is exposed to currency risk on its investment in foreign operations, equity investments, investment in associates and property loans denominated in a currency other than the functional currency of Group entities. The currencies in which these transactions are conducted are primarily are denominated in NZD.
As a result the Group’s balance sheet can be affected by movements in the A$/NZ$ exchange rates.
Interest rate risk
APG’s exposure to the risk of changes in market interest rates relates primarily to APG’s long-term bank debt obligations which are based on floating interest rates. APG’s policy is to maintain a mix of floating exposure and fixed interest rate hedging with fixed rate cover highest in years 1 to 5.
Similar policies are employed for the funds consolidated by the Group (AHF, ADIF II and AMSHT).
The Group hedges to minimise interest rate risk by entering variable to fixed interest rate swaps which also helps deliver interest covenant compliance and positive carry (net rental income in excess of interest expense) on the property portfolio. Interest rate swaps have the economic effect of converting borrowings from variable rates to fixed rates. Under the interest rate swaps, the Group agrees to exchange, at specified intervals, the difference between fixed and variable rate interest amounts calculated by reference to the agreed notional principal amounts. At 30 June 2012, after taking into account the effect of interest rate swaps, approximately 93.4% of the Group’s drawn debt is subject to fixed rate hedges (2011: 67.8%). Hedge cover as a percentage of available facilities at 30 June 2012 is 69.9% (2011: 53.9%).
For
per
sona
l use
onl
y

ABACUS PROPERTY GROUP
52
NOTES TO THE FINANCIAL STATEMENTS 30 JUNE 2012
3. FINANCIAL RISK MANAGEMENT(continued)
(d) Market Risk (continued)
Fair value interest rate risk
As the Group holds interest rate swaps against its variable rate debt there is a risk that the economic value of a financial instrument will fluctuate because of changes in market interest rates. The level of swapped and fixed rate debt is disclosed in note 22.
(e) Other market price risk
The Group is exposed to equity securities price risk. The key risk variable is the quoted price of securities which is influenced by a range of factors, most of which are outside the control of the Group. Management of the Group monitors the securities in its investment portfolio based on market indices and published prices. Investments within the portfolio are managed on an individual basis and all buy / sell decisions are approved by the Managing Director and the Chief Financial Officer.
4. SIGNIFICANT ACCOUNTING JUDGMENTS, ESTIMATES AND ASSUMPTIONS
In applying the Group’s accounting policies management continually evaluates judgments, estimates and assumptions based on experience and other factors, including expectations of future events that may have an impact on the Group. All judgments, estimates and assumptions made are believed to be reasonable based on the most current set of circumstances available to management. Actual results may differ from the judgments, estimates and assumptions. Significant judgments, estimates and assumptions made by management in the preparation of these financial statements are outlined below:
(i) Significant accounting judgments
Operating lease commitments – Group as lessor
The Group has entered into commercial property leases on its investment property portfolio. The Group has determined that it retains all the significant risks and rewards of ownership of these properties and has thus classified the leases as operating leases.
Recovery of deferred tax assets
Deferred tax assets are recognised for deductible temporary differences and tax losses on revenue account as management considers that it is probable that future taxable profits will be available to utilise those temporary differences and tax losses.
Classification of and valuation of investments
The Group has decided to classify investments in listed and unlisted securities as ‘held for trading’ investments and movements in fair value are recognised directly in profit or loss. The fair value of listed securities has been determined by reference to published price quotations in an active market. The fair value of unlisted securities has been determined by reference to the net assets of the entity and available redemption facilities.
Impairment of property loans and financial assets
The Group assesses impairment of all assets at each reporting date by evaluating conditions specific to the Group and to the particular asset that may lead to impairment. If an impairment trigger exists the recoverable amount of the asset is determined. For property loans and interim funding to related funds this involves value in use calculations, which incorporate a number of key estimates and assumptions around cashflows and fair value of underlying investment properties held by the borrower and expected timing of cashflows from equity raisings of related funds.
Accounting policy – financial assets and liabilities at fair value through profit and loss
A financial asset or financial liability is designated by the entity as being at fair value through profit or loss upon initial recognition. APG uses this designation where doing so results in more relevant information, because it is a group of financial assets and liabilities which is managed and its performance is evaluated on a fair value basis, in accordance with APG’s documented risk management and investment strategy, and information about the instruments is provided internally on that basis to the entity’s key management personnel and the Board.
For
per
sona
l use
onl
y

ABACUS PROPERTY GROUP
53
NOTES TO THE FINANCIAL STATEMENTS 30 JUNE 2012
4. SIGNIFICANT ACCOUNTING JUDGMENTS, ESTIMATES AND ASSUMPTIONS (continued)
(i) Significant accounting judgments (continued)
Control and significant influence
In determining whether the Group has control over an entity, the Group assess its exposure or rights to variable returns from its involvement with the entity and whether it has the ability to affect those returns through its power over the investee. The Group may have significant influence over an entity when it has the power to participate in the financial and operating policies decisions of the entity but is not in control or joint control of those policies.
(ii) Significant accounting estimates and assumptions
Impairment of goodwill and intangibles with indefinite useful lives
The Group determines whether goodwill and intangibles with indefinite useful lives are impaired at least on an annual basis. This requires an estimation of the recoverable amount of the cash-generating units to which the goodwill and intangibles with indefinite useful lives are allocated. For goodwill this involves value in use calculations which incorporate a number of key estimates and assumptions around cash flows and fair value of investment properties upon which these determine the revenue / cash flows. The assumptions used in the estimations of the recoverable amount and the carrying amount of goodwill and intangibles with indefinite useful lives are discussed in note 18.
Fair value of derivatives
The fair value of derivatives is determined using closing quoted market prices (where there is an active market) or a suitable pricing model based on discounted cash flow analysis using assumptions supported by observable market rates. Where the derivatives are not quoted in an active market their fair value has been determined using (where available) quoted market inputs and other data relevant to assessing the value of the financial instrument, including financial guarantees granted by the Group, estimates of the probability of exercise.
Valuation of investment properties and property, plant and equipment held at fair value
The Group makes judgements in respect of the fair value of investment properties (note 2(o)). The fair value of these properties are reviewed regularly by management with reference to external independent property valuations and market conditions existing at reporting date, using generally accepted market practices. The assumptions underlying estimated fair values are those relating to the receipt of contractual rents, expected future market rentals, maintenance requirements, capitalisation rates and discount rates that reflect current market conditions and current or recent property investment prices. If there is any material change in these assumptions or regional, national or international economic conditions, the fair value of investment properties may differ and may need to be re-estimated.
Net realisable value of inventory
Inventories are carried at the lower of cost and net realisable value. Net realisable value is the estimated selling price in the ordinary course of business less the estimated costs of completion and selling expenses. The estimates take into consideration fluctuations of price or cost directly relating to events occurring after the end of the period to the extent that such events confirm conditions existing at the end of the period. The key assumptions that require the use of management judgment are reviewed half-yearly. If the net realisable value is less than the carrying value of inventory, an impairment loss is recognised in the income statement.
Fair value of financial assets
APG enters into loans and receivables with associated options that provide for a variety of outcomes including repayment of principal and interest, satisfaction through obtaining interests in equity or property or combinations thereof. At the end of the year, the fair value of the maximum exposure to credit risk in relation to these instruments was $27.9 million (2011: $27.4 million).
For
per
sona
l use
onl
y

ABACUS PROPERTY GROUP
54
NOTES TO THE FINANCIAL STATEMENTS 30 JUNE 2012
5. SEGMENT INFORMATION
The Group predominately operates in Australia. Following are the Group’s operating segments, which are regularly reviewed by the Chief Operating Decision Maker to make decisions about resources allocation and to assess performance:
(a) Property: the segment is responsible for the investment in and ownership of commercial, retail and industrial properties. This segment also includes the equity accounting of material co-investments in property entities not engaged in development and construction projects;
(b) Funds Management: the segment includes development, origination, co-investment and fund management revenues and expenses in addition to discharging the Group’s responsible entity obligations;
(c) Property Ventures: provides secured lending and related property financing solutions and is also responsible for the Group’s investment in joint venture and associates’ development and construction projects, which includes revenue from debt and equity investments in joint ventures and associates. This segment also is responsible for the Group’s investment in property securities; and
(d) Storage: the segment is responsible for the investment in and ownership of self-storage facilities. This segment commenced in March 2012 following the merger of the Abacus Storage Fund with the Abacus Property Group.
Segment result includes transactions between operating segments which are then eliminated.
AASB 10 - in application of the standard the Group has consolidated the Abacus Hospitality Fund, Abacus Storage Fund (until the merger in March 2012), Abacus Diversified Income Fund II and the Abacus Miller Street Trust. The performances of these entities which are operated as externally managed investment schemes are reviewed separately to that of the performance of the Group’s business segments.
For
per
sona
l use
onl
y

ABACUS PROPERTY GROUP
55
NOTES TO THE FINANCIAL STATEMENTS 30 JUNE 2012
5. SEGMENT INFORMATION (continued)
Funds Property Total Core Unallocated/Property Management Ventures Storage* Segments AHF ASF ADIFII AMSHT Eliminations Consolidated
Year ended 30 June 2012 $'000 $'000 $'000 $'000 $'000 $'000 $'000 $'000 $'000 $'000 $'000RevenueRental income 76,485 - - - 76,485 1,337 - 18,111 5,573 - 101,506 Storage income 1,864 - - 17,013 18,877 - 28,216 - - - 47,093 Hotel income 2,625 - - - 2,625 49,386 - - - - 52,011 Finance income 1,316 - 26,635 - 27,951 - - - - (1,316) 26,635 Funds mangement income - 19,503 - - 19,503 - - - - (12,994) 6,509 Net change in fair value of investment properties derecognised 9,869 - - - 9,869 - - (413) - - 9,456
Net change in fair value of investments and financial instruments derecognised - 560 - (50) 510 - - - - (642) (132)
Share of profit from equity accounted investments 4,806 2,069 82 - 6,957 - - - - 422 7,379
Other revenue 5 942 6 - 953 - 675 - - (942) 686 Other unallocated revenue 1,854 341 63 50 54 2,362 Total consolidated revenue 96,970 23,074 26,723 16,963 165,584 51,064 28,954 17,748 5,627 (15,472) 253,505
Property expenses and outgoings (16,237) - - - (16,237) (342) 14 (1,485) (826) 753 (18,123)Storage expenses (753) - - (5,815) (6,568) - (9,842) - - - (16,410)Hotel expenses (3,018) - - - (3,018) (36,992) - - - - (40,010)Depreciation, amortisation and impairment expense (2,835) - - (116) (2,951) (4,134) (140) (388) (187) - (7,800)
Administrative and other expenses (9,124) (4,915) (5,489) (1,467) (20,995) (1,723) (1,226) (360) (362) (1,652) (26,318)Segment result 65,003 18,159 21,234 9,565 115,815 7,873 17,760 15,515 4,252 (16,371) 144,844
Core Segments Non Core Segments
* commenced in March 2012 following the merger of Abacus Storage Fund with Abacus Property Group For
per
sona
l use
onl
y

ABACUS PROPERTY GROUP
56
NOTES TO THE FINANCIAL STATEMENTS 30 JUNE 2012
5. SEGMENT INFORMATION (continued)
Funds Property Total Core Unallocated/Property Management Ventures Storage Segments AHF ASF ADIFII AMSHT Eliminations Consolidated
Year ended 30 June 2012 $'000 $'000 $'000 $'000 $'000 $'000 $'000 $'000 $'000 $'000 $'000
Impairment charge - related party (3,507) - - - - - (3,507)Net change in fair value of investments and financial instruments held at balance date
(6,865) 4,317 1,603 9,750 423 (12,707) (3,479)
Net change in fair value of derivatives (35,205) (10,684) (2,998) (4,555) (873) - (54,315)Finance costs* (43,860) (11,308) (11,698) (12,653) (4,317) 10,793 (73,043)Profit / (loss) before tax 26,378 (9,802) 4,667 8,057 (515) (18,285) 10,500 Income tax benefit / (expense) (1,185) 8 (890) (407) - - (2,474)Net profit / (loss) for the period 25,193 (9,794) 3,777 7,650 (515) (18,285) 8,026 less non-controlling interest (690) 3,874 (3,098) - 358 - 444
24,503 (5,920) 679 7,650 (157) (18,285) 8,470
Core Segments Non Core Segments
Net profit / (loss) for the period attributable to members of the Group
For
per
sona
l use
onl
y

ABACUS PROPERTY GROUP
57
NOTES TO THE FINANCIAL STATEMENTS 30 JUNE 2012
5. SEGMENT INFORMATION (continued)
Funds Property Total Core Unallocated/Property Management Ventures Segments AHF ASF ADIFII AMSHT Eliminations Consolidated
Year ended 30 June 2011 $'000 $'000 $'000 $'000 $'000 $'000 $'000 $'000 $'000 $'000RevenueRental income 72,427 - - 72,427 1,284 (231) 17,440 5,875 - 96,795 Storage income 1,806 - - 1,806 - 40,066 - - - 41,872 Hotel income 5,831 - - 5,831 57,580 - - - (11,000) 52,411 Finance income 664 - 21,072 21,736 - - - - (1,313) 20,423 Funds mangement income 178 20,260 - 20,438 - - - - (15,888) 4,550 Sale of inventory 78,000 - - 78,000 - - - - - 78,000 Net change in fair value of investment properties derecognised 1,271 - - 1,271 71 613 - - - 1,955
Net change in fair value of investments and financial instruments derecognised 1,410 - 1,603 3,013 936 382 430 - - 4,761
Share of profit from equity accounted investments 5,496 (1,211) (7,698) (3,413) - - - - (2,608) (6,021)
Other revenue 3,916 243 - 4,159 (15) - - - (1,465) 2,679 Other unallocated revenue 1,527 619 2,146 Total consolidated revenue 170,999 19,292 14,977 206,795 59,856 40,830 17,870 5,875 (31,655) 299,571
Property expenses and outgoings (13,531) - - (13,531) (443) 965 (1,874) (814) 730 (14,967)Storage expenses (754) - - (754) - (13,707) - - - (14,461)Hotel expenses (5,034) - - (5,034) (35,193) - - - - (40,227)Depreciation, amortisation and impairment \expense (3,129) - - (3,129) (4,483) (271) (131) (168) - (8,182)
Cost of inventory sales (63,094) - - (63,094) - - - - - (63,094)Administrative and other expenses (9,257) (7,267) (3,976) (20,500) (1,733) (1,945) (741) (374) (528) (25,821)Unallocated expenses (1,525) - (1,525)Segment result 76,200 12,025 11,001 99,228 18,004 25,872 15,124 4,519 (31,453) 131,294
Core Segments Non Core Segments
For
per
sona
l use
onl
y

ABACUS PROPERTY GROUP
58
NOTES TO THE FINANCIAL STATEMENTS 30 JUNE 2012
5. SEGMENT INFORMATION (continued)
Funds Property Total Core Unallocated/Property Management Ventures Segments AHF ASF ADIFII AMSHT Eliminations Consolidated
Year ended 30 June 2011 $'000 $'000 $'000 $'000 $'000 $'000 $'000 $'000 $'000 $'000
Impairment charge - related party (16,000) - - - - 16,000 - Net change in fair value of investments and financial instruments held at balance date (22,443) 335 16,477 (3,124) 973 199 (7,583)Net change in fair value of derivatives (8,458) 254 (1,341) 1,322 398 6,000 (1,825)Finance costs (33,912) (10,555) (17,309) (14,657) (4,302) 13,517 (67,218)Profit / (loss) before tax 18,415 8,038 23,699 (1,335) 1,588 4,263 54,668 Income tax (expense) / benefit (571) 733 (3,327) (302) - - (3,467)Net profit / (loss) for the period 17,844 8,771 20,372 (1,637) 1,588 4,263 51,201 less non-controlling interest (494) (6,577) (15,605) - (1,156) 1,218 (22,614)Net profit / (loss) for the period attributable to members of the Group 17,350 2,194 4,767 (1,637) 432 5,481 28,587
Core Segments Non Core Segments
For
per
sona
l use
onl
y

ABACUS PROPERTY GROUP
59
NOTES TO THE FINANCIAL STATEMENTS 30 JUNE 2012
5. SEGMENT INFORMATION (continued)
Funds Property Total CoreProperty Management Ventures Storage Segments Unallocated AHF ADIFII AMSHT Eliminations Consolidated
Year ended 30 June 2012 $'000 $'000 $'000 $'000 $'000 $'000 $'000 $'000 $'000 $'000 $'000Current assetsCash and cash equivalents - - - - - 43,115 9,990 226 798 - 54,129 Trade and other receivables - - - - - 7,959 3,237 1,058 (336) - 11,918 Investment properties held for sale 106,951 - - - 106,951 - 13,250 7,820 62,800 - 190,821 Inventory 26,045 - - - 26,045 - 434 - - - 26,479 Property loans - - 19,098 - 19,098 - - - - - 19,098 Other financial assets - - 169 - 169 - - 7,884 - - 8,053 Other - - - - - 2,267 415 219 103 - 3,004 Total current assets 132,996 - 19,267 - 152,263 53,341 27,326 17,207 63,365 - 313,502
Non-current assetsInvestment properties 671,992 - - 338,766 1,010,758 - - 170,445 - - 1,181,203 Inventory 25,310 - 75,664 - 100,974 - - - - - 100,974 Property, plant and equipment 4,889 - - 720 5,609 - 148,456 - - - 154,065 Property loans 19,035 148,669 121,298 - 289,002 - - - - (134,244) 154,758 Other financial assets - 48,000 24,671 - 72,671 - - - - (48,182) 24,489 Equity accounted investments 111,340 9,784 8,034 - 129,158 - - - - (7,325) 121,833 Deferred tax assets - - - - - 12,569 3,734 17 - - 16,320 Intangible assets and goodwill 1,000 - - - 1,000 32,461 - - - - 33,461 Trade and other receivables - - 6,212 - 6,212 - - - - - 6,212 Total non-current assets 833,566 206,453 235,879 339,486 1,615,384 45,030 152,190 170,462 - (189,751) 1,793,315
Total assets 966,562 206,453 255,146 339,486 1,767,647 98,371 179,516 187,669 63,365 (189,751) 2,106,817
Core Segments Non Core Segments
For
per
sona
l use
onl
y

ABACUS PROPERTY GROUP
60
NOTES TO THE FINANCIAL STATEMENTS 30 JUNE 2012
5. SEGMENT INFORMATION (continued)
Funds Property Total CoreProperty Management Ventures Storage Segments Unallocated AHF ADIFII AMSHT Eliminations Consolidated
Year ended 30 June 2012 $'000 $'000 $'000 $'000 $'000 $'000 $'000 $'000 $'000 $'000 $'000Current liabilitiesTrade and other payables 7,372 3,324 4,432 4,881 20,009 - 6,895 2,694 828 - 30,426 Interest-bearing loans and borrowings - - - - - 29,950 - - - - 29,950 Income tax payable - - - - - 604 - 32 - - 636 Other 1,353 398 530 530 2,811 - 566 1,139 - - 4,516 Total current liabilities 8,725 3,722 4,962 5,411 22,820 30,554 7,461 3,865 828 - 65,528
Non-current liabilitiesTrade and other payables 2,600 - 10,125 - 12,725 - - - - - 12,725 Interest-bearing loans and borrowings - - - - - 560,330 166,969 170,190 53,016 (178,245) 772,260 Derivatives at fair value - - - - - 53,286 16,709 7,914 1,843 - 79,752 Deferred tax liabilities - - - - - 5,229 229 4,725 - - 10,183 Other financial liabilities - 10,000 - - 10,000 - - - - 46,250 56,250 Other 544 181 242 242 1,209 - 1,018 - - 2,227 Total non-current liabilities 3,144 10,181 10,367 242 23,934 618,845 184,925 182,829 54,859 (131,995) 933,397
Total liabilities 11,869 13,903 15,329 5,653 46,754 649,399 192,386 186,694 55,687 (131,995) 998,925
Net assets 954,693 192,550 239,817 333,833 1,720,893 (551,028) (12,870) 975 7,678 (57,756) 1,107,892
Core Segments Non Core Segments
For
per
sona
l use
onl
y

ABACUS PROPERTY GROUP
61
NOTES TO THE FINANCIAL STATEMENTS 30 JUNE 2012
5. SEGMENT INFORMATION (continued)
Funds Property Total CoreProperty Management Ventures Segments Unallocated AHF ASF ADIFII AMSHT Eliminations Consolidated
Year ended 30 Jun 2011 $'000 $'000 $'000 $'000 $'000 $'000 $'000 $'000 $'000 $'000 $'000Current assetsCash and cash equivalents - - - - 47,106 9,407 3,982 1,866 2,287 - 64,648 Trade and other receivables - - - - 11,157 2,099 2,175 272 122 (241) 15,584 Investment properties held for sale 91,131 - - 91,131 - - - - - - 91,131 Inventory 22,882 - - 22,882 - 500 - - - - 23,382 Property loans - - 19,324 19,324 - - - - - - 19,324 Other financial assets - - 959 959 - - - - - - 959 Other - - - - 3,260 279 233 248 94 - 4,114 Total current assets 114,013 - 20,283 134,296 61,523 12,285 6,390 2,386 2,503 (241) 219,142
Non-current assetsInvestment properties 753,127 - - 753,127 - 12,500 331,133 178,570 62,800 - 1,338,130 Inventory 23,107 - 34,488 57,595 - - - - - - 57,595 Property, plant and equipment 19,341 - - 19,341 - 143,087 810 - - - 163,238 Property loans 20,757 149,466 151,614 321,837 - - - - - (167,944) 153,893 Other financial assets - 48,000 24,976 72,976 - - - 7,381 - (48,180) 32,177 Equity accounted investments 67,101 27,528 32,658 127,287 - - - - - (28,092) 99,195 Deferred tax assets - - - - 12,481 3,319 170 - 8 - 15,978 Intangible assets and goodwill 2,712 - - 2,712 32,461 - - - - - 35,173 Trade and other receivables - - 6,000 6,000 - - - - - - 6,000 Total non-current assets 886,145 224,994 249,736 1,360,875 44,942 158,906 332,113 185,951 62,808 (244,216) 1,901,379
Total assets 1,000,158 224,994 270,019 1,495,171 106,465 171,191 338,503 188,337 65,311 (244,457) 2,120,521
Core Segments Non Core Segments
For
per
sona
l use
onl
y

ABACUS PROPERTY GROUP
62
NOTES TO THE FINANCIAL STATEMENTS 30 JUNE 2012
5. SEGMENT INFORMATION (continued)
Funds Property Total CoreProperty Management Ventures Segments Unallocated AHF ASF ADIFII AMSHT Eliminations Consolidated
Year ended 30 Jun 2011 $'000 $'000 $'000 $'000 $'000 $'000 $'000 $'000 $'000 $'000 $'000Current liabilitiesTrade and other payables 4,106 5,955 3,403 13,464 - 6,534 7,474 2,669 610 (242) 30,509 Interest-bearing loans and borrowings - - - - 13,450 - - - 33,916 - 47,366 Income tax payable - - - - - - 424 142 - - 566 Other 411 198 113 722 2,289 556 - - - - 3,567 Total current liabilities 4,517 6,153 3,516 14,186 15,739 7,090 7,898 2,811 34,526 (242) 82,008
Non-current liabilitiesTrade and other payables 3,567 - 10,008 13,575 - - - - - - 13,575 Interest-bearing loans and borrowings - - - - 433,115 162,944 209,658 186,337 20,757 (220,943) 791,868 Derivatives at fair value - - - - 17,360 6,024 931 3,359 970 - 28,644 Deferred tax liabilities - - - - - 331 3,991 4,478 - - 8,800 Other financial liabilities - 10,000 - 10,000 - - - - - 39,902 49,902 Other 3,770 366 210 4,346 - 968 - - - - 5,314 Total non-current liabilities 7,337 10,366 10,218 27,921 450,475 170,267 214,580 194,174 21,727 (181,041) 898,103
Total liabilities 11,854 16,519 13,734 42,107 466,214 177,357 222,478 196,985 56,253 (181,283) 980,111
Net assets 988,304 208,475 256,285 1,453,064 (359,749) (6,166) 116,025 (8,648) 9,058 (63,174) 1,140,410
Non Core SegmentsCore Segments
For
per
sona
l use
onl
y

ABACUS PROPERTY GROUP
63
NOTES TO THE FINANCIAL STATEMENTS 30 JUNE 2012
6. REVENUE
2012 2011$'000 $'000
(a) Finance incomeInterest and fee income on secured loans 15,635 20,423 Sale of joint venture profit share rights 11,000 - Bank interest 2,362 2,146 Total finance income 28,997 22,569
(b) Funds Management IncomeAsset / property management fees 3,002 1,619 Interest on loans to funds management entities 3,507 2,931 Total funds management income 6,509 4,550
(c) Net change in fair value of investments and financial instruments derecognisedNet change in fair value of financial instruments derecognised (50) 3,770 Net change in fair value of other investments derecognised (82) 991
Total net change in fair value of investments and financial instruments derecognised (132) 4,761
For
per
sona
l use
onl
y

ABACUS PROPERTY GROUP
64
NOTES TO THE FINANCIAL STATEMENTS 30 JUNE 2012
7. EXPENSES
2012 2011$'000 $'000
(a) Depreciation, amortisation and impairment expenseDepreciation of property, plant and equipment 4,701 5,351 Net loss on property, plant and equipment remeasured at fair value 688 1,028 Amortisation of software 27 23 Impairment of intangible assets 12 - Amortisation - leasing costs 2,372 1,780 Total depreciation, amortisation and impairment expense 7,800 8,182
(b) Net change in fair value of investments held at balance dateNet change in fair value of property securities held at balance date 280 86 Net change in fair value of options held at balance date (503) 15,593 Net change in fair value of other investments held at balance date 1,467 - Total change in fair value of investments held at balance date 1,244 15,679
(c) Finance costsInterest on loans 66,229 61,495 Amortisation of finance costs 4,756 5,383 Finance costs incurred in the merger with Abacus Storage Fund 2,058 - Total finance costs 73,043 66,878
(d) Administrative and other expensesWages and salaries 11,363 11,630 Contributions to defined contribution plans 753 1,012 Other expenses 14,202 14,704 Total administrative and other expenses 26,318 27,346
For
per
sona
l use
onl
y

ABACUS PROPERTY GROUP
65
NOTES TO THE FINANCIAL STATEMENTS 30 JUNE 2012
8. INCOME TAX
2012 2011$'000 $'000
(a) Income tax expenseThe major components of income tax expense are:Income StatementCurrent income tax
Current income tax charge 1,831 3,130 Adjustments in respect of current income tax of previous years (123) (1,061)
Deferred income taxMovement in depreciable assets tax depreciation 201 (187) Relating to origination and reversal of temporary differences 565 1,585
Income tax expense reported in the income statement 2,474 3,467
(b) Numerical reconciliation between aggregate tax expenserecognised in the income statement and tax expensecalculated per the statutory income tax rate
A reconciliation between tax expense and the product ofaccounting profit before income tax multiplied by theGroup's applicable income tax rate is as follows:
Profit before income tax expense 10,500 54,668
Prima facie income tax expense calculated at 30% 2,743 16,400 Prima facie income tax expense calculated at 28% 380 - Less prima facie income tax expense on profit from Trusts (1,541) (12,595) Prima Facie income tax of entities subject to income tax 1,582 3,805
Entertainment 21 18 Foreign exchange translation adjustments (51) - Impairment of property, plant and equipment - 311 Adjustment of prior year tax applied (123) (1,061) Derecognition of deferred tax assets 857 (69) Other items (net) 188 463
Income tax expense 2,474 3,467
Income tax expense reported in the consolidated income statement 2,474 3,467
The Group has capital tax losses for which no deferred tax asset is recognised on the balance sheet of gross $6.82 million (2011: $6.46 million), which are available indefinitely for offset against future gains subject to continuing to meet relevant statutory tests.
For
per
sona
l use
onl
y

ABACUS PROPERTY GROUP
66
NOTES TO THE FINANCIAL STATEMENTS 30 JUNE 2012
8. INCOME TAX (continued)
2012 2011$'000 $'000
(c) Recognised deferred tax assets and liabilitiesDeferred income tax at 30 June 2012 relates to the following:
Deferred tax liabilitiesRevaluation of investment properties at fair value 7,317 6,506 Revaluation of financial instruments at fair value 2,123 1,972 Revaulation of property,plant and equipment 229 - Reset of tax cost bases 1,048 1,048 Other 871 1,052 Gross deferred income tax liabilities 11,588 10,578
Set off of deferred tax assets (1,405) (1,778) Net deferred income tax liabilities 10,183 8,800
Deferred tax assetsRevaluation of financial instruments at fair value 5,355 4,773 Provisions - other 5,387 5,543 Provisions - employee entitlements 1,028 941 Losses available for offset against future taxable income 5,791 6,066 Other 164 426 Gross deferred income tax assets 17,725 17,749
Set off of deferred tax assets (1,405) (1,771) Net deferred income tax assets 16,320 15,978
Unrecognised temporary differences
At 30 June 2012, the Group has unrecognised deferred tax assets on capital account in relation to the fair value of investments ($0.9 million gross) and fair value of investment properties ($3.8 million gross) (2011: $6.0 million).
Tax consolidation
AGHL and its 100% owned Australian resident subsidiaries, ASOL and its 100% owned Australian resident subsidiaries and AHL and its 100% owned Australian resident subsidiaries have formed separate tax consolidated groups. AGHL, ASOL and AHL are the head entity of their respective tax consolidated groups. The head entity and the controlled entities in the tax consolidated group continue to account for their own current and deferred tax amounts. The current and deferred tax amounts are measured in a manner that is consistent with the broad principles in AASB 112 Income Taxes. The nature of the tax funding agreement is discussed further below.
Nature of the tax funding agreement
Members of the respective tax consolidated groups have entered into tax funding agreements. The tax funding agreements require payments to/from the head entity to be recognised via an inter-entity receivable (payable) which is at call. To the extent that there is a difference between the amount allocated under the tax funding agreement and the allocation under UIG 1052, the head entity accounts for these as equity transactions.
The amounts receivable or payable under the tax funding agreements are due upon receipt of the funding advice from the head entity, which is issued as soon as practicable after the end of each financial year. The head entity may also require payment of interim funding amounts to assist with its obligations to pay tax instalments.
For
per
sona
l use
onl
y

ABACUS PROPERTY GROUP
67
NOTES TO THE FINANCIAL STATEMENTS 30 JUNE 2012
9. DISTRIBUTIONS PAID AND PROPOSED
2012 2011ABP Group $'000 $'000(a) Distributions paid during the year
June 2011 half: 8.25 cents per stapled security (2010: 8.25 cents) 31,217 29,842
December 2011 half: 8.25 cents per stapled security (2010: 8.25 cents) 31,963 30,592 63,180 60,434
(b) Distributions proposed and not recognised as a liability*June 2012 half: 8.25 cents per stapled security (2011: 8.25 cents) 35,886 31,225
Distributions were paid from Abacus Trust and Abacus Income Trust (which do not pay tax provided they distribute all their taxable income) hence, there were no franking credits attached.
*The final distribution of 8.25 cents per stapled security was declared on 2 July 2012. The distribution being paid on or about 15 August 2012 will be approximately $35.9 million. No provision for the distribution has been recognised in the balance sheet at 30 June 2012 as the distribution had not been declared by the end of the year.
2012 2011Abacus Hospitality Fund $'000 $'000(a) Distributions paid during the year
June 2011 quarter: 1.125 cents per security (2010: 2.0625 cents) 551 1,011 September 2011 quarter: 1.125 cents per security (2010: 2.0625 cents) 551 1,011 December 2011 quarter: 1.125 cents per security (2010: 2.625 cents) 551 1,011 March 2012 quarter: 1.125 cents per security (2011: 1.125 cents) 551 553
2,204 3,586
(b) Distributions proposed and recognised as a liabilityJune 2012 quarter: 1.125 cents per stapled security (2011: 1.125 cents) 551 533
2012 2011Abacus Storage Fund (pre merger) $'000 $'000(a) Distributions paid during the year
June 2011 quarter: 2.1875 cents per security (2010: 2.1875 cents) 1,909 1,907 September 2011 quarter: 2.1875 cents per security (2010: 2.1875 cents) 1,910 1,907 December 2011 quarter: 2.1875 cents per security (2010: 2.1875 cents) 1,910 1,908 March 2012 quarter: Nil (2011: 2.1875 cents) - 1,909
5,729 7,631
(b) Distributions proposed and recognised as a liabilityJune 2012 quarter: Nil (2011: 2.1875 cents) - 1,909
(c) Dividends paid during the yearFebruary 2012: 8.7 cents per share* (2011: Nil) 6,080 -
* A merger capital distribution of 5.3 cents was also paid by Abacus Storage Property Trust.
For
per
sona
l use
onl
y

ABACUS PROPERTY GROUP
68
NOTES TO THE FINANCIAL STATEMENTS 30 JUNE 2012
9. DISTRIBUTIONS PAID AND PROPOSED (continued)
2012 2011Abacus Diversified Income Fund II $'000 $'000(a) Distributions paid during the yearFinal distriubtion for financial year 30 June 2011: rate as per unit class
Class A units 2.125 cents per unit (2010: 2.125 cents) 233 654 Class B units 2.250 cents per unit (2010: 2.125 cents) 562 110 Class C units 1.668 cents per unit (2010: 1.500 cents) 268 9
1,063 773
September 2011: rate as per unit classClass A units 0.75 cents per unit (2010: 2.125 cents) 80 650 Class B units 2.331 cents per unit (2010: 2.125 cents) 590 113 Class C units 1.748 cents per unit (2010: 1.545 cents) 374 54
December 2011: rate as per unit classClass A units 0.75 cents per unit (2010: 2.125 cents) 80 370 Class B units 2.331 cents per unit (2010: 2.125 cents) 590 394 Class C units 1.748 cents per unit (2010: 1.545 cents) 434 110
March 2012: rate as per unit classClass A units 0.75 cents per unit (2011: 2.125 cents) 80 338 Class B units 2.331 cents per unit (2011: 2.250 cents) 590 447 Class C units 1.748 cents per unit (2011: 1.688 cents) 469 186
3,287 2,662
(b) Distributions proposed and recognised as a liabilityFinal distribution payable for the June 2012 quarter: rate as per unit class
Class A units 0.75 cents per unit (2011: 2.125 cents) 80 235 Class B units 2.331 cents per unit (2011: 2.250 cents) 590 564 Class C units 1.748 cents per unit (2011: 1.688 cents) 469 269
1,139 1,068
2012 2011Abacus Miller Street Holding Trust $'000 $'000(a) Distributions paid during the year
September 2011 quarter: 1.125 cents per unit (2010: Nil) 214 - December 2011 quarter: 1.125 cents per unit (2010: Nil) 214 - March 2012 quarter: 1.125 cents per unit (2011: Nil) 214 -
642 -
(b) Distributions proposed and recognised as a liabilityJune 2012 quarter: 1.125 cents per unit (2011: Nil) 214 -
For
per
sona
l use
onl
y

ABACUS PROPERTY GROUP
69
NOTES TO THE FINANCIAL STATEMENTS 30 JUNE 2012
9. DISTRIBUTIONS PAID AND PROPOSED (continued)
2012 2011ABP Group $'000 $'000(c) Franking credit balanceThe amount of franking credits available for the subsequent financial year are:Franking account balance as at the beginning of the financial year at 30% (2011: 30%) 10,396 10,396 Merger of Abacus Storage Operations Limited 1,693 -
12,089 10,396
10. EARNINGS PER STAPLED SECURITY
2012 2011$'000 $'000
Basic and diluted earnings per stapled security (cents) 2.11 7.68
Reconciliation of earnings used in calculating earnings per stapled security
Basic and diluted earnings per stapled securityNet profit 8,470 28,587
Weighted average number of shares:Weighted average number of stapled securities for basic earning per security 400,921 372,327
For
per
sona
l use
onl
y

ABACUS PROPERTY GROUP
70
NOTES TO THE FINANCIAL STATEMENTS 30 JUNE 2012
11. CASH AND CASH EQUIVALENTS
2012 2011$'000 $'000
Reconciliation to Cash Flow StatementFor the purposes of the Cash Flow Statement, cash and cash equivalents comprise the following at 30 June 2012:
Cash at bank and in hand (i) 54,129 64,648
(i) Cash at bank earns interest at floating rates. The carrying accounts of cash and cash equivalents represent fair value.
(a) Reconciliation of net profit after tax to net cash flows from operations
Net profit 8,026 51,541 Adjustments for:Depreciation and amortisation of non-current assets 7,800 8,182 Provision for doubtful debts 348 5,000 Diminution of inventory 1,500 - Restructuring charge - related parties 3,507 - Net change in fair value of derivatives 54,315 1,825 Net change in fair value of investment properties held at balance date 2,235 (8,096) Net change in fair value of investments held at balance date 1,244 15,679 Net change in fair value of investment properties derecognised (9,456) (1,955) Net change in fair value of investments and financial instruments derecognised (132) (4,761) Increase/(decrease) in payables (2,518) 50,843 Decrease/(increase) in receivables and other assets 19,381 27,901 Net cash from operating activities 86,250 146,159
(b) Disclosure of financing facilities
Refer to note 20d.
(c) Disclosure of non-cash financing activities
Non-cash financing activities include capital raised pursuant to APG’s distribution reinvestment plan. During the year 18.9 million stapled securities were issued with a cash equivalent of $36.2 million.
For
per
sona
l use
onl
y

ABACUS PROPERTY GROUP
71
NOTES TO THE FINANCIAL STATEMENTS 30 JUNE 2012
12. TRADE AND OTHER RECEIVABLES
2012 2011$'000 $'000
(a) CurrentTrade debtors 935 3,471 Other debtors 13,549 13,129 Gross receivables 14,484 16,600
Less provision for doubtful debts (2,566) (1,017) Net current receivables 11,918 15,583
Other debtors 6,212 6,000 Non-current receivables 6,212 6,000
(b) Non-current
13. PROPERTY LOANS AND OTHER FINANCIAL ASSETS
2012 2011$'000 $'000
(a) Current property loansSecured loans - amortised cost (i) 17,713 17,794 Interest receivable on secured loans - amortised cost 1,385 1,530
19,098 19,324
(b) Current other financial assetsInvestments in securities - listed - fair value 168 959 Other financial assets - fair value (ii) 7,885 -
8,053 959
(c) Non-current property loansSecured loans - amortised cost (i) 137,938 129,797 Interest receivable on secured loans - amortised cost 16,820 24,096
154,758 153,893
(d) Non-current other financial assetsInvestments in securities - unlisted - fair value 4,489 4,796 Other financial assets - fair value (ii) 20,000 27,381
24,489 32,177
(i) Mortgages are secured by real property assets. The current facilities are scheduled to mature and are expected to be realised on or before 30 June 2013 and the non-current facilities will mature between 1 July 2013 and 24 December 2018. An amount of $33.1 million (30 June 2011: $31.8 million) is a loan to Abacus Wodonga Land Fund, a related party.
(ii) Abacus enters into loans and receivables with associated options that provide for a variety of outcomes including repayment of principal and interest, satisfaction through obtaining interests in equity or property or combinations thereof. At the end of the period, the maximum exposure to credit risk in relation to these instruments was $27.9 million (30 June 2011 $27.4 million).
For
per
sona
l use
onl
y

ABACUS PROPERTY GROUP
72
NOTES TO THE FINANCIAL STATEMENTS 30 JUNE 2012
14. PROPERTY, PLANT AND EQUIPMENT
2012 2011$'000 $'000
Land and buildingsAt 1 July, net of accumulated depreciation 144,999 161,709 Additions 205 561 Disposals (13,663) (9,688) Revaluations 7,452 (3,275) Effect of movements in foreign exchange 444 (2,034) Depreciation charge for the year (1,025) (2,274) At 30 June, net of accumulated depreciation 138,412 144,999 Fair value 150,653 156,237 Accumulated depreciation (12,241) (11,238) Net carrying amount at end of year 138,412 144,999
Plant and equipmentAt 1 July, net of accumulated depreciation 18,239 18,471 Additions 1,371 3,129 Disposals (298) (108) Effect of movements in foreign exchange 47 (154) Depreciation charge for the year (3,706) (3,099) At 30 June, net of accumulated depreciation 15,653 18,239
Fair value 36,689 35,970 Accumulated depreciation (21,036) (17,731) Net carrying amount at end of year 15,653 18,239
Total 154,065 163,238
2012 2011$'000 $'000
Property, plant and equipmentHotel properties(1) 152,155 149,330 Budget lodge / hostel accommodation - 12,028 Storage properties 1,823 1,747 Office Equipment / furniture and fittings 87 133 Total property, plant and equipment 154,065 163,238
The property, plant and equipment are carried at the directors’ determination of fair value and are based on independent valuations. The determination of fair value includes reference to the original acquisition cost together with capital expenditure since acquisition and either the latest full independent valuation, latest independent update or directors’ valuation. Total acquisition costs include incidental costs of acquisition such as property taxes on acquisition, legal and professional fees and other acquisition related costs.
The independent and directors’ valuations are based on common valuation methodologies including capitalisation and discounted cash flow approaches, which have regard to recent market sales evidence. Accordingly, the directors’ valuations at 30 Jun 2012 have regard to market sales evidence in adopting a market valuation for each property including the key assumptions outlined. (1) Includes pub properties but excludes the value of licences that are accounted for separately as intangibles.
For
per
sona
l use
onl
y
ABACUS PROPERTY GROUP
73
NOTES TO THE FINANCIAL STATEMENTS 30 JUNE 2012
14. PROPERTY, PLANT AND EQUIPMENT (continued)
The key underlying assumptions, on a portfolio basis, contained within the independent and directors’ valuations above for the Hotel properties are as follows:
• A weighted average capitalisation rate for the hotel properties is 9.33% (2011: 8.90%) • The current weighted average occupancy rate for the hotel properties is 72% (2011: 71.3%)
The independent and directors’ valuations are based on common valuation methodologies including capitalisation and discounted cash flow approaches, which have regard to recent market sales evidence. Accordingly, the directors’ valuations at 30 June 2012 have regards to market sales evidence in adopting a market valuation for each property including the key assumptions outlined.
15. INVENTORY
2012 2011$'000 $'000
(a) CurrentHotel supplies 479 600 Projects - purchase consideration 26,000 22,782 - other costs (including finance costs) - -
26,479 23,382
(b) Non-currentProjects - purchase consideration 81,246 44,048 - development costs 11,821 6,842 - other costs (including finance costs) 9,407 6,705 - diminution (1,500) -
100,974 57,595
Total inventories 127,453 80,977 Inventories are held at the lower of cost and net realisable value.
Other costs as described in note 2(z).
For
per
sona
l use
onl
y

ABACUS PROPERTY GROUP
74
NOTES TO THE FINANCIAL STATEMENTS 30 JUNE 2012
16. INVESTMENT PROPERTIES
2012 2011$'000 $'000
Investment properties held for saleRetail 23,801 62,769 Commercial 144,550 - Industrial 9,220 26,840 Other 13,250 1,522 Total investment properties held for sale 190,821 91,131
2012 2011$'000 $'000
Investment propertiesRetail 296,507 285,686 Commercial 310,395 497,143 Industrial 198,740 177,019 Storage 357,761 347,983 Other 17,800 30,299 Total investment properties 1,181,203 1,338,130
Total investment properties including held for sale 1,372,024 1,429,261
The current investment properties represent 11 properties which are either subject to a sales contract or an active sales campaign. All properties are expected to be sold by 30 June 2013.
Reconciliation
A reconciliation of the carrying amount of investment properties excluding properties held for sale at the beginning and end of the year is as follows:
2012 2011$'000 $'000
Carrying amount at beginning of the financial year 1,338,130 1,194,459 Straight lining rental assets (167) (147)Additions and capital expenditure 35,152 213,959 Fair value adjustments for properties held at balance date (2,263) 9,678 Disposals (61,636) (15,970)Effect of movements in foreign exchange 368 (3,229)Properties transferred to held for sale (158,621) (28,746)Transfers 30,240 (31,874)Carrying amount at end of the financial year 1,181,203 1,338,130
Investment properties are carried at the Directors’ determination of fair value and are based on independent valuations. The determination of fair value includes reference to the original acquisition cost together with capital expenditure since acquisition and either the latest full independent valuation, latest independent update or directors’ valuation. Total acquisition costs include incidental costs of acquisition such as property taxes on acquisition, legal and professional fees and other acquisition related costs.
Reflecting the stabilisation of market values, the Directors during the year approved a revised valuation policy for the Group that requires all assets to be independently valued at least every two years (previously annually). The key underlying assumptions, on a portfolio basis, contained within the independent and director valuations above are as follows:
For
per
sona
l use
onl
y

ABACUS PROPERTY GROUP
75
NOTES TO THE FINANCIAL STATEMENTS 30 JUNE 2012
16. INVESTMENT PROPERTIES (continued)
Abacus Property Group*
• A weighted average capitalisation rate for each category is as follows;
Group – 8.69% (30 June 2011: 8.50%)
Retail – 8.18% (30 June 2011: 8.07%)
Commercial – 8.38% (30 June 2011: 8.56%)
Industrial – 9.78% (30 June 2011: 9.41%)
Storage – 9.18% (30 June 2011: 9.2%)
Other – 8.75% (30 June 2011: 8.76%)
• The current occupancy rate for the principal portfolio excluding development and self-storage assets is 94.3% (30 June 2011: 92.8%). The current occupancy rate for self-storage assets is 82.1%.
• A weighted average rent review for the 12 months to 30 June 2012 of 3.7% (30 June 2011: 3.0%).
During the year ended 30 June 2012, 62% of the number of properties in the portfolio was subject to external valuations, the remaining 38% was subject to internal valuation.
Abacus Diversified Income Fund II
• A weighted average capitalisation rate for each category is as follows;
Commercial – 9.34% (30 June 2011: 9.27%)
Industrial – 8.86% (30 June 2011: 8.75%)
• The current occupancy rate for the portfolio is 97% (30 June 2011: 94%)
• A weighted average rent review for the 12 months to 30 June 2012 of 4.08% (30 June 2011: 3.74%)
During the year ended 30 June 2012, 52% of the number of properties portfolio was subject to external valuations, the remaining 48% was subject to internal valuation.
Abacus Miller Street Holding Trust
• A capitalisation rate of 8.75% (30 June 2011: 8.25%)
• The current occupancy rate of the property is 98% (30 June 2011: 98%) which is not expected to materially change during the period relevant to the valuation based on a conservative 50% tenant retention rate
• A weighted average rent review for the 12 months to 30 June 2012 of 4.0% (30 June 2011: 4.0%)
The property was internally valued as at 30 June 2012.
The independent and director valuations are based on common valuation methodologies including capitalisation and discounted cash flow approaches, which have regard to recent market sales evidence. Accordingly, the directors’ valuations at 30 June 2012 have regard to market sales evidence in adopting a market valuation for each property including the key assumptions outlined.
The majority of the investment properties are used as security for secured bank debt.
* Excludes Abacus Hospitality Fund, Abacus Diversified Income Fund II and Abacus Miller Street Holding Trust
For
per
sona
l use
onl
y

ABACUS PROPERTY GROUP
76
NOTES TO THE FINANCIAL STATEMENTS 30 JUNE 2012
17. INVESTMENTS ACCOUNTED FOR USING THE EQUITY METHOD
2012 2011Note $'000 $'000
Investment in associates 17(i) - - Investment in joint ventures 17(ii) 121,833 99,195
121,833 99,195
(a) Details of Associates and Joint Ventures
(i) Associates
30 Jun 30 Jun 30 Jun 30 Jun2012 2011 2012 2011
Principal Activity % % $'000 $'000Abacus Wodonga Land Fund(1) Land subdivision 15 15 - -
- -
(ii) Joint Ventures
30 Jun 30 Jun 30 Jun 30 Jun2012 2011 2012 2011
Principal Activity % % $'000 $'000309 George St JV Trust Property investment 25 - 11,478 - Abacus Aspley Village Trust Property investment 33 33 10,459 9,944 Abacus Rosebery Property Trust Property development 50 50 1,284 1,900 Abwill 350 George St Trust Property development 50 50 6,842 6,862 Australian Aggregation Head Trust Property investment 25 25 14,241 4,962 Birkenhead Point Marina Pty Ltd(2) Marina operator 50 50 583 248 Fordtrans Pty Ltd (Virginia Park) Property investment 50 50 60,412 57,524 Hampton Residential Retirement Trust Property development 50 50 4,519 4,657 Jigsaw Trust Childcare operator 50 50 9,784 9,013 Pakenham Valley Unit Trust Land subdivision 50 50 21 150 The Abacus Colemans Road Trust Property development 50 50 1,672 1,717 The Mount Druitt Unit Trust Property investment 50 50 538 452 The Tulip Unit Trust Property development 50 50 - 1,766
121,833 99,195
ownership interest carrying value
(1) Abacus Funds Management Limited acts as the Responsible Entity of the Fund (2) Operates the marina adjacent to the Birkenhead Point Shopping Centre in Drummoyne NSW.
(iii) Related parties There were no impairment losses or contingent liabilities relating to the investment in the associates and joint ventures other than the debt forgiveness on the loan facility owed by Abacus Wodonga Land Fund ($3.5 million). The Group also incurred non-recurring costs of $2.1 million as a result of the merger with ASF.
(b) Extract from associates and joint ventures’ profit & loss statements
2012 2011$'000 $'000
Revenue 73,781 144,051 Expenses (56,880) (162,581)Net profit / (loss) 16,901 (18,530)
Share of net profit / (loss) 7,379 (6,021)
For
per
sona
l use
onl
y

ABACUS PROPERTY GROUP
77
NOTES TO THE FINANCIAL STATEMENTS 30 JUNE 2012
17. INVESTMENTS ACCOUNTED FOR USING THE EQUITY METHOD (continued)
(c) Extract from associates and joint ventures’ balance sheets
2012 2011$'000 $'000
Current assets 48,492 42,662 Non-current assets 524,846 387,664
573,338 430,326 Current liabilities (18,485) (29,872)Non-current liabilities (239,282) (160,286)
(257,767) (190,158)
Net assets 315,571 240,168
Share of net assets 121,833 99,195
Material investments in joint ventures follows.
Fordtrans Pty Ltd (Virginia Park) (“VP”)
The Group has a 50% interest in the ownership and voting rights of Fordtrans Pty Ltd. VP’s principal place of business is in Bentleigh East, Victoria.
VP owns a sizeable Business Park providing a mixture of industrial and office buildings as well as supporting facilities including gymnasium, swim centre, child care centre, children’s play centre, cafe, yoga centre and martial arts centre. The site has recently been enhanced following the purchase of a neighbouring site by the Group that offers expansion potential and residential opportunity.
The Group jointly controls the venture with the other partner under the terms of Unitholders Agreement and requires unanimous consent for all major decisions over the relevant activities.
The Group’s share of income (including distributions) for the year ended 30 June 2012 was $4.54 million (30 June 2011: $4.08 million).
Summarised Financial Information
Summarised financial information in respect of VP is as follows:
2012 2011$'000 $'000
Cash & cash equivalents 1,134 865 Other current assets 11,233 6,705 Total current assets 12,367 7,570 Total non-current assets 176,286 186,506 Total assets 188,653 194,076
Other current liabilities 3,377 1,149 Total current liabilities 3,377 1,149
Non-current financial liabilties 64,389 64,389 Total non-current liabilities 64,389 64,389
Total liabilities 67,766 65,538
Net assets 120,887 128,538
For
per
sona
l use
onl
y

ABACUS PROPERTY GROUP
78
NOTES TO THE FINANCIAL STATEMENTS 30 JUNE 2012
17. INVESTMENTS ACCOUNTED FOR USING THE EQUITY METHOD (continued)
Fordtrans Pty Ltd (Virginia Park) (“VP”) (continued)
Summarised Statement of Comprehensive Income
2012 2011$'000 $'000
Revenue 15,559 14,767 Interest income 2,416 2,903 Interest expense (4,026) (4,281)Profit before tax 8,853 7,297 Income tax expense - - Total comprehensive income 8,853 7,297
18. INTANGIBLE ASSETS AND GOODWILL
2012 2011$'000 $'000
GoodwillBalance at 1 July 32,461 32,461 Balance at 30 June 32,461 32,461 Licences and entitlementsAt 1 July, net of accumulated amortisation 2,712 2,712 Disposal (1,700) - Impairment (12) - At 30 June, net of accumulated amortisation 1,000 2,712
Total goodwill and intangibles 33,461 35,173
Description of the Group’s intangible assets and goodwill
Goodwill
After initial recognition, goodwill acquired in a business combination is measured at cost less any accumulated impairment losses. Goodwill is not amortised but is subject to impairment testing on an annual basis or whenever there is an indication of impairment.
Licences and entitlements
Licences and entitlements represent intangible assets acquired through the acquisition of certain hotel assets. Licences and entitlements essentially relate to gaming and liquor licence rights attaching to the hotel assets. These intangible assets have been determined to have indefinite useful lives and the cost model is utilised for their measurement. These licences and entitlements have been granted for an indefinite period by the relevant government department. This supports the Group’s assertion that these assets have an indefinite useful life. As these licences and entitlements are an integral part of owning a hotel asset, they are subjected to impairment testing on an annual basis or whenever there is an indication of impairment as part of the annual property valuation and review process of the hotels as a going concern. F
or p
erso
nal u
se o
nly

ABACUS PROPERTY GROUP
79
NOTES TO THE FINANCIAL STATEMENTS 30 JUNE 2012
18. INTANGIBLE ASSETS AND GOODWILL (continued)
Impairment tests for goodwill and intangibles with indefinite useful lives
(i) Description of the cash generating units and the other relevant information
Goodwill acquired through business combinations and licences and entitlements have been allocated to two individual cash generating units, each of which is a reportable segment, for impairment testing as follows:
• Funds Management - property / asset management business • Property - or specifically the hotel assets
Funds Management The recoverable amount of the Funds Management unit has been determined based on a value in use calculation using cash flow projections as at 30 June 2012 covering a five-year period.
A post tax discount rate of 9.49% (2011: 9.49%) and a terminal growth rate of 3% (2011: 3%) has been applied to the cash flow projections.
Property
The recoverable amount of the indefinite life intangible assets have been determined based on the independent and directors’ valuations of the hotels on a going concern basis. Common valuation methodologies including capitalisation and discounted cash flow approaches are used, with assumptions reference to recent market sales evidence. Accordingly, the directors’ valuations at 30 June 2012 have regards to market sales evidence in adopting a market valuation for each property including the key assumptions outlined.
(ii) Carrying amounts of goodwill, management rights, licences and entitlements allocated to each of the cash generating units
The carrying amounts of goodwill, management rights, licences and entitlements are allocated to Funds Management and Property as follows:
2012 2011 2012 2011 2012 2011$'000 $'000 $'000 $'000 $'000 $'000
Goodwill 32,394 32,394 67 67 32,461 32,461
Management rights, licences and entitlements - - 1,000 2,712 1,000 2,712
TotalFunds Management Property
(iii) Key assumptions used in valuation calculations
Funds Management Goodwill
The calculation of value in use is most sensitive to the following assumptions:
a. Fee income
b. Discount rates
c. Property values of the funds/properties under management
Fee income – fee income is based on actual income in the year preceding the start of the budget period and actual funds under management.
Discount rates – discount rates reflect management’s estimate of the time value of money and the risks specific to each unit that are not reflected in the cash flows.
Property values – property values are based on the fair value of properties which are valued on a staggered two year basis by independent valuers. F
or p
erso
nal u
se o
nly

ABACUS PROPERTY GROUP
80
NOTES TO THE FINANCIAL STATEMENTS 30 JUNE 2012
18. INTANGIBLE ASSETS AND GOODWILL (continued)
(iii) Key assumptions used in valuation calculations (continued)
Hotel Intangible Assets
The calculation of the hotel valuations is most sensitive to the following assumptions:
a. Hotel income
b. Discount rates and capitalisation rates with reference to market sales evidence
c. Other value adding or potential attributes of the hotel asset
Hotel income – hotel income is based on actual income in the year preceding the start of the budget period, adjusted based on industry norms for valuation purposes.
Discount rates and capitalisation rates – these rates reflect the independent valuers’ and management’s estimate of the time value of money and the risks specific to each unit that are not reflected in the cash flows, with reference to recent market sales evidence. The weighted average capitalisation rate used for the hotel valuation at June 2012 was 12.5% (2011: 11.65%).
Other value adding or potential attributes – unique features of individual hotel assets that will add or have the potential to add value to the property in determining the total fair value of the hotel.
(iv) Sensitivity to changes in assumptions
Significant and prolonged property value falls and market influences which could increase discount rates could cause goodwill to be impaired in the future, however, the goodwill valuation as at 30 June 2012 has significant head room thus changes in the assumptions such as discount rate and revenue assumptions would not cause any significant impairment.
Intangibles have been impaired on the basis that they now represent recoverable amount. A decrease in hotel income or increase in discount rate have already been taken into consideration in the sensitivity of market factors as part of the external valuation.
19. TRADE AND OTHER PAYABLES
2012 2011$'000 $'000
(a) CurrentTrade creditors 962 3,308 Other creditors 13,028 17,556 Rental guarantee 900 900 Goods and services tax 6,907 2,009 Accrued expenses 8,629 6,736
30,426 30,509
(b) Non-currentUnearned revenue 10,125 10,008 Rental guarantee 2,600 3,567
12,725 13,575 .
For
per
sona
l use
onl
y

ABACUS PROPERTY GROUP
81
NOTES TO THE FINANCIAL STATEMENTS 30 JUNE 2012
20. INTEREST BEARING LOANS AND BORROWINGS
2012 2011$'000 $'000
Abacus Property Group*CurrentBank loans - A$ 29,950 13,450
29,950 13,450
Abacus Miller Street Holding TrustCurrentBank loans - A$ - 34,000 Less: Unamortised borrowing costs - (84)
- 33,916
(a) Total current 29,950 47,366
Abacus Property Group*Non-currentBank loans - A$ 484,484 546,002 Other loans - A$ 29,354 18,680 Bank loans - A$ value of NZ$ denominated loan 53,038 52,301 Less: Unamortised borrowing costs (6,546) (7,790) 560,330 609,193
Abacus Hospitality FundNon-currentBank loans - A$ 49,240 49,240 Bank loans - A$ value of NZ$ denominated loan 20,020 19,739 Loans from other parties 25,267 23,339 Less: Unamortised borrowing costs (469) (606) 94,058 91,712
Abacus Diversified Income Fund IINon-currentBank loans - A$ 84,319 91,718 Less: Unamortised borrowing costs (427) (755) 83,892 90,963
Abacus Miller Street Holding TrustNon-currentBank loans - A$ 34,000 - Less: Unamortised borrowing costs (20) - 33,980 -
(b) Total non-current 772,260 791,868
*Excludes Abacus Hospitality Fund, Abacus Diversified Income Fund II and Abacus Miller Street Holding Trust. The comparative balances include amounts attributable to Abacus Storage Fund of $176.1 million.
For
per
sona
l use
onl
y

ABACUS PROPERTY GROUP
82
NOTES TO THE FINANCIAL STATEMENTS 30 JUNE 2012
20. INTEREST BEARING LOANS AND BORROWINGS (continued)
2012 2011$'000 $'000
(c) Maturity profile of current and non-current interest bearing loansDue within one year 29,950 47,450 Due between one and five years 779,722 742,072 Due after five years - 58,947
809,672 848,469
Abacus Property Group*
The Group maintains a range of interest-bearing loans and borrowings. The sources of funding are spread over a number of counterparties and the terms of the instruments are negotiated to achieve a balance between capital availability and cost of debt.
Bank loans are $A denominated and are provided by several banks at interest rates which are set periodically on a floating basis. The loans are denominated in $A and $NZ and the term to maturity varies from August 2012 to April 2016. The bank loans are secured by charges over the investment properties, certain inventory and certain property, plant and equipment.
Approximately 97% (2011: 58%)** of bank debt drawn was subject to fixed rate hedges with a weighted average term to maturity of 3 years (2011: 4 years)**. At 30 June 2012, 25% of the 97% fixed rate hedge cover related to legacy ASF hedges. Hedge cover as a percentage of available facilities at 30 June 2012 is 69.7% (2011: 41.1%)**.
APG’s weighted average interest rate as at 30 June 2012 was 7.27% (2011: 7.81%**). Line fees on undrawn facilities contributed to 0.40% of the weighted average interest rate at 30 June 2012 (2011: 0.87%**). APG’s weighted average interest rate excluding the undrawn facilities line fees as at 30 June 2012 was 6.87% (2011: 6.94%**). * Excludes Abacus Hospitality Fund, Abacus Diversified Income Fund II and Abacus Miller Street Holding Trust
** Excludes Abacus Storage Fund which merged with Abacus Property Group on 6 March 2012.
Abacus Hospitality Fund
AHF’s $A and $NZ bank facility was refinanced in June 2011 and matures in June 2014. The facility is secured by a charge over AHF’s hotel assets and at 30 June 2012 approximately 62.0% (2011: 67.9%) of drawn bank debt facilities were subject to fixed rate hedges with a weighted average term to maturity of 5.1 years (2011: 5.6 years).
AHF’s weighted average interest rate as at 30 June 2012 was 8.1% (2011: 6.0%). Line fees on undrawn facilities contributed to 0.18% of the weighted average interest rate at 30 June 2012 (2011: 0.02%). AHF’s weighted average interest rate excluding the undrawn facilities line fees as at 30 June 2012 was 7.9% (2011: 5.98%).
For
per
sona
l use
onl
y

ABACUS PROPERTY GROUP
83
NOTES TO THE FINANCIAL STATEMENTS 30 JUNE 2012
20. INTEREST BEARING LOANS AND BORROWINGS (continued)
Abacus Diversified Income Fund II
ADIF II has financed its Australian investment property portfolio via two $A facilities provided by a two major Australian banks which mature in September 2013 and November 2014 respectively.
The facilities is secured by charges over ADIF II’s investment properties and at 30 June 2012 approximately 93.1% (2011: 85.6%) of drawn bank debt facilities were subject to fixed rate hedges with a weighted average term to maturity of 3.8 years (2011: 1.4 years).
ADIF II’s weighted average interest rate as at 30 June 2012 was 8.85% (2011: 8.93%). Line fees on undrawn facilities contributed to 0.20% of the weighted average interest rate at 30 June 2012 (2011: 0.10%). ADIF II’s weighted average interest rate excluding the undrawn facilities line fees as at 30 June 2012 was 8.65% (2011: 8.83%).
Abacus Miller Street Holding Trust
The Miller Street investment property is financed by a major Australian bank secured against the Miller Street investment property. The facility expires September 2013. AMSHT has hedged 97.1% of its drawn debt (2011: 97.1%) and at reporting date AMSHT’s weighted average interest rate as at 30 June 2012 was 8.38% (2011: 8.60%). Line fees on undrawn facilities contributed to 0.02% of the weighted average interest rate at 30 June 2012 (2011: 0.00%). AMSHT’s weighted average interest rate excluding the undrawn facilities line fees as at 30 June 2012 was 8.36% (2011: 8.60%).
(d) Financing facilities available
At reporting date, the following financing facilities had been negotiated and were available:
2012 2011$'000 $'000
Abacus Property GroupTotal facilities - bank loans 789,950 797,907 Facilities used at reporting date - bank loans (567,472) (611,745)Facilities unused at reporting date - bank loans 222,478 186,162
Abacus Hospitality FundTotal facilities - bank loans 78,646 78,261 Facilities used at reporting date - bank loans (69,260) (68,979)Facilities unused at reporting date - bank loans 9,386 9,282
Abacus Diversified Income FundTotal facilities - bank loans 104,577 104,577 Facilities used at reporting date - bank loans (84,319) (91,719)Facilities unused at reporting date - bank loans 20,258 12,858
Abacus Miller Street Holding TrustTotal facilities - bank loans 35,000 34,000 Facilities used at reporting date - bank loans (34,000) (34,000)Facilities unused at reporting date - bank loans 1,000 -
For
per
sona
l use
onl
y

ABACUS PROPERTY GROUP
84
NOTES TO THE FINANCIAL STATEMENTS 30 JUNE 2012
20. INTEREST BEARING LOANS AND BORROWINGS
(e) Assets pledged as security
The carrying amounts of assets pledged as security for current and non-current interest bearing liabilities are:
2012 2011Note $'000 $'000
CurrentFirst mortgageInvestment properties held for sale 190,821 91,131 Total current assets pledged as security 190,821 91,131
Non-currentFirst mortgageFreehold land and buildings 5,609 19,325 Property, plant and equipment 148,456 143,897 Inventory 54,663 80,378 Investment properties 1,173,163 1,338,130 Total non-current assets pledged as security 1,381,891 1,581,730
Total assets pledged as security 1,572,712 1,672,861
(f) Defaults and breaches
During the current and prior years, there were no defaults or breaches on any of the loans.
For
per
sona
l use
onl
y

ABACUS PROPERTY GROUP
85
NOTES TO THE FINANCIAL STATEMENTS 30 JUNE 2012
21. PARENT ENTITY FINANCIAL INFORMATION
2012 2011$'000 $'000
Results of the parent entityProfit / (loss) for the year* (72,912) (1,163)Other comprehensive income - - Total comprehensive income / (expense) for the year (72,912) (1,163)
Financial position of the parent entity at year endCurrent assets 21,808 14,381 Total assets 155,723 176,138 Current liabilities 11,884 2,519 Total liabilities 35,539 88,970 Net assets 120,184 87,168
Total equity of the parent entity comprising of:Issued capital 160,673 54,745 Retained earnings (45,937) 26,975 Employee options reserve 5,448 5,448 Total equity 120,184 87,168
* Includes diminution of subsidiary of $98 million in 2012 which is eliminated in the consolidation of the Group’s results.
Parent entity contingencies
The parent entity has entered into the following agreement as at 30 June 2011 which is current as at 30 June 2012:
• Provide a corporate guarantee to the Bank to increase the amount of drawn funds available and to guarantee the payment of interest on a tranche. The maximum liability is approximately $6.8 million (2011: $4 million). No property security has been provided by the parent.
Parent entity capital commitments
There are no capital commitments of the parent entity as at 30 June 2012 (2011: Nil).
For
per
sona
l use
onl
y

ABACUS PROPERTY GROUP
86
NOTES TO THE FINANCIAL STATEMENTS 30 JUNE 2012
22. FINANCIAL INSTRUMENTS
(i) Credit Risk
Credit Risk Exposures
The Group’s maximum exposure to credit risk at the reporting date was:
2012 2011$'000 $'000
Receivables 18,130 21,583 Secured property loans 173,856 173,217 Other financial assets 32,542 33,136 Cash and cash equivalents 54,129 64,648
278,657 292,584
Carrying Amount
As at 30 June 2012, the Group had the following concentrations of credit risk:
Secured property loans: a loan which represents 36% of the portfolio covers three large projects at Riverlands, Camelia and Lewisham;
Other financial assets (fair value) is represented by 2 issuers (2011: 2 issuers)
Secured property loans
The following table illustrates grouping of the Group’s investment in secured loans. As noted in disclosure note 3, the Group mitigates the exposure to this risk by evaluation of the credit submission before acceptance, ensuring security is obtained and consistent and timely monitoring of the financial instrument to identify any potential adverse changes in the credit quality:
Total Original termExtended
term (1)Past due
term (2) Impaired (3)
30 June 2012 $'000 $'000 $'000 $'000 $'000
Loans 173,856 150,121 23,735 - - less: provisioning - - - - - Total 173,856 150,121 23,735 - -
Total Original termExtended
term (1)Past due
term (2) Impaired (3)
30 June 2011 $'000 $'000 $'000 $'000 $'000
Loans 173,217 145,593 14,119 13,505 - less: provisioning - - - - - Total 173,217 145,593 14,119 13,505 -
For
per
sona
l use
onl
y
ABACUS PROPERTY GROUP
87
NOTES TO THE FINANCIAL STATEMENTS 30 JUNE 2012
22. FINANCIAL INSTRUMENTS (continued)
(i) Credit Risk (continued)
Secured property loans and interim funding (continued)
1) Terms are extended typically in recognition of traditional project delays (e.g. weather, development approvals).
2) For loans with past due terms all are less than two years old and are expected to be recovered.
3) In considering the impairment of loans, the Group will undertake a market analysis of the secured property development which is used to service the loan and identify if a deficiency of security exists and the extent of that deficiency, if any. If there is an indicator of impairment, fair value calculations of expected future cashflows are determined and if there are any differences to the carrying value of the loan, an impairment is recognised.
Other financial assets of $32.5 million (2011: $32.2 million) include options totalling $27.9 million (2011: $27.4 million) which are both on original terms.
The movement in the allowance for impairment in respect of secured property loans and receivables during the year was as follows:
2012 2011$'000 $'000
Balance at 1 July 2011 - 2,200 Impairment loss recognised - - Impairment loss utilised - (2,200)Balance at 30 June 2012 - -
(ii) Liquidity Risk
The table below shows an analysis of the contractual maturities of key liabilities which forms part of the Group’s assessment of liquidity risk.
Abacus Property Group*
Carrying Amount
Contractual cash flows
1 Year or less
Over 1 year to 5 years
Over5 years
30 June 2012 $'000 $'000 $'000 $'000 $'000LiabilitiesTrade and other payables 32,735 32,735 20,010 12,725 - Interest bearing loans and borrowings incl derivatives# 643,566 724,007 82,846 635,311 5,850 Total liabilities 676,301 756,742 102,856 648,036 5,850
Carrying Amount
Contractual cash flows
1 Year or less
Over 1 year to 5 years
Over5 years
30 June 2011 $'000 $'000 $'000 $'000 $'000LiabilitiesTrade and other payables 30,972 30,972 17,397 13,575 - Interest bearing loans and borrowings incl derivatives# 473,925 548,841 50,021 496,635 2,185 Total liabilities 504,897 579,813 67,418 510,210 2,185
# Carrying amount includes fair value of derivative liabilities. Contractual cash flows includes contracted debt and net swap payments using prevailing forward rates
* Excludes Abacus Hospitality Fund, Abacus Diversified Income Fund II and Abacus Miller Street Holding Trust
For
per
sona
l use
onl
y

ABACUS PROPERTY GROUP
88
NOTES TO THE FINANCIAL STATEMENTS 30 JUNE 2012
22. FINANCIAL INSTRUMENTS (continued)
(ii) Liquidity Risk (continued)
Abacus Hospitality Fund
Carrying Amount
Contractual cash flows
1 Year or less
Over 1 year to 5 years
Over5 years
30 June 2012 $'000 $'000 $'000 $'000 $'000LiabilitiesTrade and other payables 6,895 6,895 6,895 - - Interest bearing loans and borrowings incl derivatives# 85,969 96,700 8,117 88,584 - Total liabilities 92,864 103,595 15,012 88,584 -
Carrying Amount
Contractual cash flows
1 Year or less
Over 1 year to 5 years
Over5 years
30 June 2011 $'000 $'000 $'000 $'000 $'000LiabilitiesTrade and other payables 7,628 7,628 7,628 - - Interest bearing loans and borrowings incl derivatives# 75,003 91,776 5,458 85,236 1,081 Total liabilities 82,631 99,404 13,086 85,236 1,081
# Carrying amount includes fair value of derivative liabilities. Contractual cash flows including contracted debt and net swap payments using prevailing forward rates
Abacus Diversified Income Fund
Carrying Amount
Contractual cash flows
1 Year or less
Over 1 year to 5 years
Over5 years
30 June 2012 $'000 $'000 $'000 $'000 $'000LiabilitiesTrade and other payables 2,724 2,724 2,724 - - Interest bearing loans and borrowings incl derivatives# 92,233 100,615 7,380 93,235 - Total liabilities 94,957 103,339 10,104 93,235 -
Carrying Amount
Contractual cash flows
1 Year or less
Over 1 year to 5 years
Over5 years
30 June 2011 $'000 $'000 $'000 $'000 $'000LiabilitiesTrade and other payables 1,742 1,742 1,580 162 - Interest bearing loans and borrowings incl derivatives# 95,078 107,038 8,148 98,890 - Total liabilities 96,820 108,780 9,728 99,052 -
# Carrying amount includes fair value of derivative liabilities. Contractual cash flows including contracted debt and net swap payments using prevailing forward rates F
or p
erso
nal u
se o
nly

ABACUS PROPERTY GROUP
89
NOTES TO THE FINANCIAL STATEMENTS 30 JUNE 2012
22. FINANCIAL INSTRUMENTS (continued)
(ii) Liquidity Risk (continued)
Abacus Miller Street Holding Trust
Carrying Amount
Contractual cash flows
1 Year or less
Over 1 year to 5 years
Over5 years
30 June 2012 $'000 $'000 $'000 $'000 $'000LiabilitiesTrade and other payables 828 828 828 - - Interest bearing loans and borrowings incl derivatives# 35,843 38,073 2,749 35,324 - Total liabilities 36,671 38,901 3,577 35,324 -
Carrying Amount
Contractual cash flows
1 Year or less
Over 1 year to 5 years
Over5 years
30 June 2011 $'000 $'000 $'000 $'000 $'000LiabilitiesTrade and other payables 610 610 610 - - Interest bearing loans and borrowings incl derivatives# 34,970 37,573 36,925 648 - Total liabilities 35,580 38,183 37,535 648 -
# Carrying amount includes fair value of derivative liabilities. Contractual cash flows including contracted debt and net swap payments using prevailing forward rates
For
per
sona
l use
onl
y

ABACUS PROPERTY GROUP
90
NOTES TO THE FINANCIAL STATEMENTS 30 JUNE 2012
22. FINANCIAL INSTRUMENTS (continued)
(iii) Currency Risk
The following table shows the Group’s investments denominated in a foreign currency.
2012 2011 2012 2011 2012 2011$'000 $'000 $'000 $'000 £'000 £'000
AssetsCash at bank 8,028 2,243 10,253 2,905 - - Investment in securities 4,026 3,889 - - 2,629 2,593 Total assets 12,054 6,132 10,253 2,905 2,629 2,593
LiabilitiesInterest bearing loans and borrowings 73,058 77,003 93,303 99,742 - - Total liabilities 73,058 77,003 93,303 99,742 - -
GBP AUD NZD
The Abacus Property Group and Abacus Hospitality Fund borrow loan funds in New Zealand dollars to substantially match the foreign currency property asset value exposure with a corresponding foreign currency liability and therefore expects to substantially mitigate the foreign currency risk on their New Zealand denominated asset values.
The following sensitivity is based on the foreign risk exposures in existence at the balance sheet date.
At 30 June 2012, had the Australian Dollar moved, as illustrated in the table below, with all other variables held consistent, post tax profit and equity would have been affected as follows:
Judgements of reasonably possible movements:
2012 2011 2012 2011$'000 $'000 $'000 $'000
AUD/GBP + 10% (366) (354) - - AUD/GBP - 10% 447 432 - - AUD/NZD + 10% (287) (24) - - AUD/NZD - 10% 351 29 - -
Post tax profit Higher/(Lower)
Equity Higher/(Lower)
For
per
sona
l use
onl
y
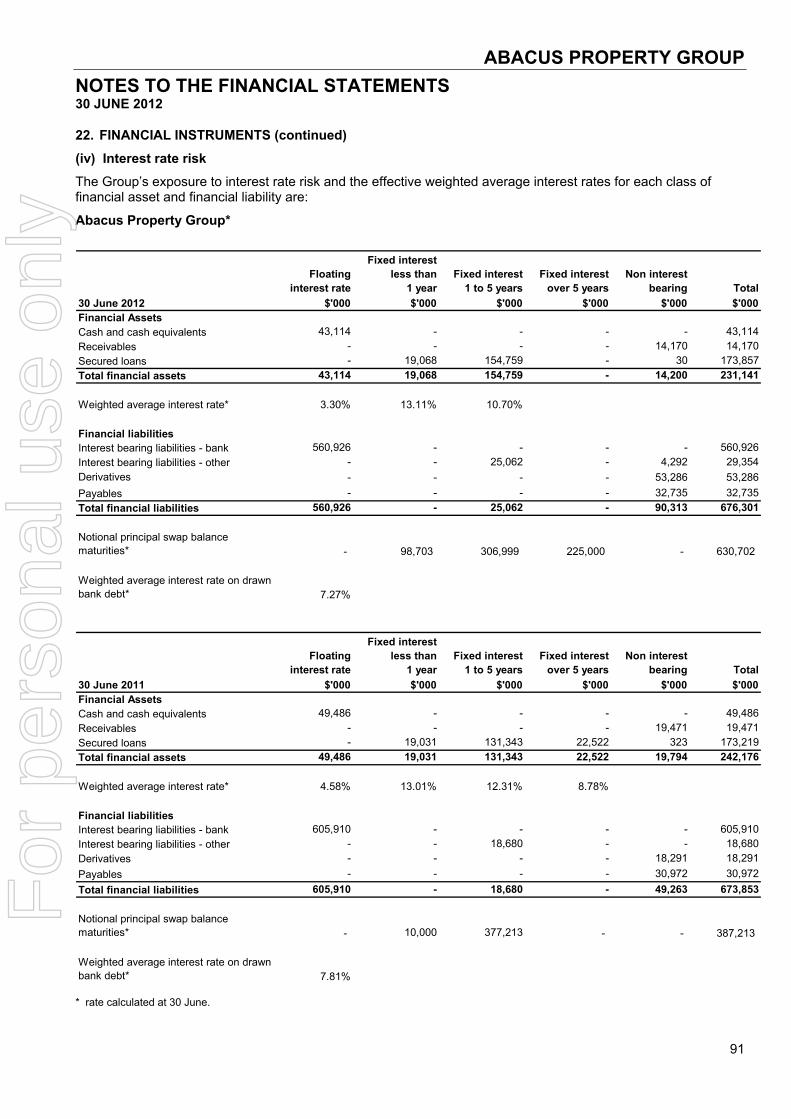
ABACUS PROPERTY GROUP
91
NOTES TO THE FINANCIAL STATEMENTS 30 JUNE 2012
22. FINANCIAL INSTRUMENTS (continued)
(iv) Interest rate risk
The Group’s exposure to interest rate risk and the effective weighted average interest rates for each class of financial asset and financial liability are:
Abacus Property Group*
Floating interest rate
Fixed interest less than
1 year Fixed interest
1 to 5 yearsFixed interest
over 5 yearsNon interest
bearing Total30 June 2012 $'000 $'000 $'000 $'000 $'000 $'000Financial AssetsCash and cash equivalents 43,114 - - - - 43,114 Receivables - - - - 14,170 14,170 Secured loans - 19,068 154,759 - 30 173,857 Total financial assets 43,114 19,068 154,759 - 14,200 231,141
Weighted average interest rate* 3.30% 13.11% 10.70%
Financial liabilitiesInterest bearing liabilities - bank 560,926 - - - - 560,926 Interest bearing liabilities - other - - 25,062 - 4,292 29,354 Derivatives - - - - 53,286 53,286 Payables - - - - 32,735 32,735 Total financial liabilities 560,926 - 25,062 - 90,313 676,301
Notional principal swap balance maturities* - 98,703 306,999 225,000 - 630,702
Weighted average interest rate on drawn bank debt* 7.27%
Floating interest rate
Fixed interest less than
1 year Fixed interest
1 to 5 yearsFixed interest
over 5 yearsNon interest
bearing Total30 June 2011 $'000 $'000 $'000 $'000 $'000 $'000Financial AssetsCash and cash equivalents 49,486 - - - - 49,486 Receivables - - - - 19,471 19,471 Secured loans - 19,031 131,343 22,522 323 173,219 Total financial assets 49,486 19,031 131,343 22,522 19,794 242,176
Weighted average interest rate* 4.58% 13.01% 12.31% 8.78%
Financial liabilitiesInterest bearing liabilities - bank 605,910 - - - - 605,910 Interest bearing liabilities - other - - 18,680 - - 18,680 Derivatives - - - - 18,291 18,291 Payables - - - - 30,972 30,972 Total financial liabilities 605,910 - 18,680 - 49,263 673,853
Notional principal swap balance maturities* - 10,000 377,213 - - 387,213
Weighted average interest rate on drawn bank debt* 7.81%
* rate calculated at 30 June.
For
per
sona
l use
onl
y

ABACUS PROPERTY GROUP
92
NOTES TO THE FINANCIAL STATEMENTS 30 JUNE 2012
22. FINANCIAL INSTRUMENTS (continued)
(iv) Interest rate risk (continued)
The Group’s exposure to interest rate risk and the effective weighted average interest rates for each class of financial asset and financial liability are:
Abacus Hospitality Fund
Floating interest rate
Fixed interest less than
1 year Fixed interest
1 to 5 yearsFixed interest
over 5 yearsNon interest
bearing Total30 June 2012 $'000 $'000 $'000 $'000 $'000 $'000Financial AssetsCash and cash equivalents 9,990 - - - - 9,990 Receivables - - - - 3,238 3,238 Total financial assets 9,990 - - - 3,238 13,228
Weighted average interest rate* 2.19%
Financial liabilitiesInterest bearing liabilities - bank 68,790 - - - - 68,790 Related party loans - 5,635 19,632 - - 25,267 Derivatives - - - - 16,709 16,709 Payables - - - - 6,895 6,895 Total financial liabilities 68,790 5,635 19,632 - 23,604 117,661
Notional principal swap balance maturities* - - 42,942 - - 42,942
Weighted average interest rate on drawn bank debt* 8.10%
Floating interest rate
Fixed interest less than
1 year Fixed interest
1 to 5 yearsFixed interest
over 5 yearsNon interest
bearing Total30 June 2011 $'000 $'000 $'000 $'000 $'000 $'000Financial AssetsCash and cash equivalents 9,407 - - - - 9,407 Receivables - - - - 3,192 3,192 Total financial assets 9,407 - - - 3,192 12,599
Weighted average interest rate* 3.55%
Financial liabilitiesInterest bearing liabilities - bank 68,372 - - - - 68,372 Related party loans - 3,705 19,635 - - 23,340 Derivatives - - - - 6,024 6,024 Payables - - - - 7,628 7,628 Total financial liabilities 68,372 3,705 19,635 - 13,652 105,364
Notional principal swap balance maturities* - - 46,803 - - 46,803
Weighted average interest rate on drawn bank debt* 6.00% * rate calculated at 30 June.
For
per
sona
l use
onl
y

ABACUS PROPERTY GROUP
93
NOTES TO THE FINANCIAL STATEMENTS 30 JUNE 2012
22. FINANCIAL INSTRUMENTS (continued)
(iv) Interest rate risk (continued)
Abacus Diversified Income Fund II
Floating interest rate
Fixed interest less than
1 year Fixed interest
1 to 5 yearsFixed interest
over 5 yearsNon interest
bearing Total30 June 2012 $'000 $'000 $'000 $'000 $'000 $'000Financial AssetsCash and cash equivalents 226 - - - - 226 Receivables - - - - 1,058 1,058 Total financial assets 226 - - - 1,058 1,284
Weighted average interest rate* 2.30%
Financial liabilitiesInterest bearing liabilities - bank 83,932 - - - - 83,932 Derivatives - - - - 7,914 7,914 Payables - - - - 2,724 2,724 Total financial liabilities 83,932 - - - 10,638 94,570
Notional principal swap balance maturities* - - 78,500 - - 78,500
Weighted average interest rate on drawn bank debt* 8.85%
Floating interest rate
Fixed interest less than
1 year Fixed interest
1 to 5 yearsFixed interest
over 5 yearsNon interest
bearing Total30 June 2011 $'000 $'000 $'000 $'000 $'000 $'000Financial AssetsCash and cash equivalents 1,866 - - - - 1,866 Receivables - - - - 272 272 Total financial assets 1,866 - - - 272 2,138
Weighted average interest rate* 4.05%
Financial liabilitiesInterest bearing liabilities - bank 91,014 - - - - 91,014 Derivatives - - - - 3,359 3,359 Payables - - - - 1,741 1,741 Total financial liabilities 91,014 - - - 5,100 96,114
Notional principal swap balance maturities* - - 78,500 - - 78,500
Weighted average interest rate on drawn bank debt* 8.93% * rate calculated at 30 June.
For
per
sona
l use
onl
y

ABACUS PROPERTY GROUP
94
NOTES TO THE FINANCIAL STATEMENTS 30 JUNE 2012
22. FINANCIAL INSTRUMENTS (continued)
(iv) Interest rate risk (continued)
Abacus Miller Street Holding Trust
Floating interest rate
Fixed interest less than
1 year Fixed interest
1 to 5 yearsFixed interest
over 5 yearsNon interest
bearing Total30 June 2012 $'000 $'000 $'000 $'000 $'000 $'000Financial AssetsCash and cash equivalents 799 - - - - 799 Receivables - - - - 9 9 Total financial assets 799 - - - 9 808
Weighted average interest rate* 2.30%
Financial liabilitiesInterest bearing liabilities - bank 34,000 - - - - 34,000 Derivatives - - - - 1,843 1,843 Payables - - - - 828 828 Total financial liabilities 34,000 - - - 2,671 36,671
Notional principal swap balance maturities* - - 33,000 - - 33,000
Weighted average interest rate on drawn bank debt* 8.38%
Floating interest rate
Fixed interest less than
1 year Fixed interest
1 to 5 yearsFixed interest
over 5 yearsNon interest
bearing Total30 June 2011 $'000 $'000 $'000 $'000 $'000 $'000Financial AssetsCash and cash equivalents 2,287 - - - - 2,287 Receivables - - - - 167 167 Total financial assets 2,287 - - - 167 2,454
Weighted average interest rate* 4.05%
Financial liabilitiesInterest bearing liabilities - bank 34,000 - - - - 34,000 Derivatives - - - - 970 970 Payables - - - - 610 610 Total financial liabilities 34,000 - - - 1,580 35,580
maturities* - 33,000 - - - 33,000
Weighted average interest rate on drawn bank debt* 8.60% * rate calculated at 30 June.
For
per
sona
l use
onl
y
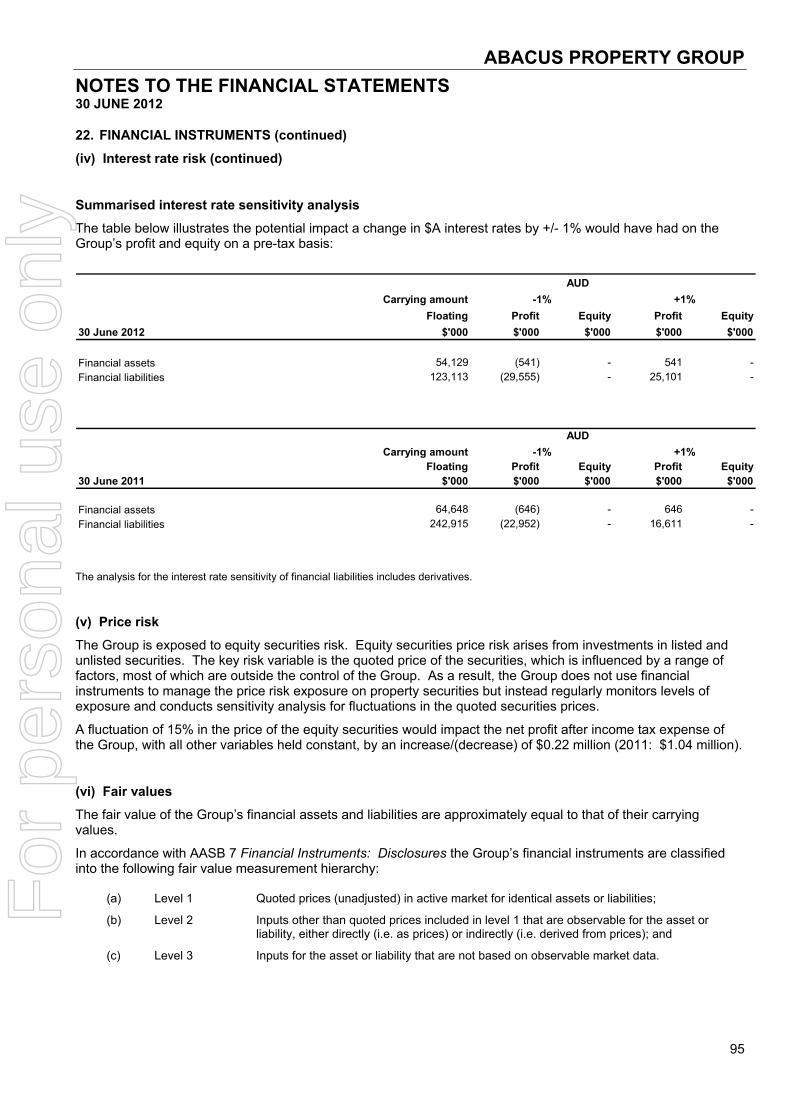
ABACUS PROPERTY GROUP
95
NOTES TO THE FINANCIAL STATEMENTS 30 JUNE 2012
22. FINANCIAL INSTRUMENTS (continued)
(iv) Interest rate risk (continued)
Summarised interest rate sensitivity analysis
The table below illustrates the potential impact a change in $A interest rates by +/- 1% would have had on the Group’s profit and equity on a pre-tax basis:
Floating Profit Equity Profit Equity30 June 2012 $'000 $'000 $'000 $'000 $'000
Financial assets 54,129 (541) - 541 - Financial liabilities 123,113 (29,555) - 25,101 -
Floating Profit Equity Profit Equity30 June 2011 $'000 $'000 $'000 $'000 $'000
Financial assets 64,648 (646) - 646 - Financial liabilities 242,915 (22,952) - 16,611 -
AUDCarrying amount -1% +1%
AUDCarrying amount -1% +1%
The analysis for the interest rate sensitivity of financial liabilities includes derivatives.
(v) Price risk
The Group is exposed to equity securities risk. Equity securities price risk arises from investments in listed and unlisted securities. The key risk variable is the quoted price of the securities, which is influenced by a range of factors, most of which are outside the control of the Group. As a result, the Group does not use financial instruments to manage the price risk exposure on property securities but instead regularly monitors levels of exposure and conducts sensitivity analysis for fluctuations in the quoted securities prices.
A fluctuation of 15% in the price of the equity securities would impact the net profit after income tax expense of the Group, with all other variables held constant, by an increase/(decrease) of $0.22 million (2011: $1.04 million).
(vi) Fair values
The fair value of the Group’s financial assets and liabilities are approximately equal to that of their carrying values.
In accordance with AASB 7 Financial Instruments: Disclosures the Group’s financial instruments are classified into the following fair value measurement hierarchy:
(a) Level 1 Quoted prices (unadjusted) in active market for identical assets or liabilities;
(b) Level 2 Inputs other than quoted prices included in level 1 that are observable for the asset or liability, either directly (i.e. as prices) or indirectly (i.e. derived from prices); and
(c) Level 3 Inputs for the asset or liability that are not based on observable market data.
For
per
sona
l use
onl
y

ABACUS PROPERTY GROUP
96
NOTES TO THE FINANCIAL STATEMENTS 30 JUNE 2012
22. FINANCIAL INSTRUMENTS (continued)
The following table presents the Group’s assets and liabilities measured and recognised at fair value at 30 June 2012.
Level 1 Level 2 Level 3 Total2012 2012 2012 2012
30 June 2012 $'000 $'000 $'000 $'000
CurrentInvestment in securities - listed 168 - - 168 Investment in options - - 7,885 7,885 Total current 168 - 7,885 8,053
Non-currentInvestment in securities - unlisted - - 4,490 4,490 Investment in options - - 20,000 20,000 Derivative liabilities - (79,752) - (79,752)Total non-current - (79,752) 24,490 (55,262)
Level 1 Level 2 Level 3 Total2011 2011 2011 2011
30 June 2011 $'000 $'000 $'000 $'000
CurrentInvestment in securities - listed 959 - - 959 Total current 959 - - 959
Non-currentInvestment in securities - unlisted - - 4,795 4,795 Investment in options - - 27,382 27,382 Derivative liabilities - (28,644) - (28,644)Total non-current - (28,644) 32,177 3,533 There were no transfers between Levels 1, 2 and 3 during the year.
For
per
sona
l use
onl
y

ABACUS PROPERTY GROUP
97
NOTES TO THE FINANCIAL STATEMENTS 30 JUNE 2012
22. FINANCIAL INSTRUMENTS (continued)
(vi) Fair values (continued)
The following table is a reconciliation of the movements in unlisted securities and options classified as Level 3 for the year ended 30 June 2012.
Unlisted securities Options Total
$'000 $'000 $'000
opening balance as at 30 June 2011 4,795 27,382 32,177
fair value movement through the income statement (50) 503 453 redemptions / conversions (255) - (255)closing balance as at 30 June 2012 4,490 27,885 32,375
Unlisted securities Options Total
$'000 $'000 $'000
opening balance as at 30 June 2010 11,485 42,303 53,788
fair value movement through the income statement (6,453) (8,984) (15,437)purchases / additions 93 63 156 redemptions (330) (6,000) (6,330)closing balance as at 30 June 2011 4,795 27,382 32,177
Determination of fair value
The fair value of listed securities is determined by reference to the quoted bid price of the entity at balance date. The fair value of unlisted securities is determined by reference to the net assets of the underlying entities.
The fair value of interest rate swaps is determined using a generally accepted pricing model on a discounted cash flow analysis using assumptions supported by observable market rates.
The fair value of the options is determined using generally accepted pricing models including Black-Scholes and adjusted for specific features of the options including share price, underlying net assets and property valuations and prevailing exchange rates.
Sensitivity of Level 3
The potential effect of using reasonable possible alternative assumptions based on a change in the property valuations by 5%, a change in the property capitalisation rate by 0.5% and a change in the unit price of securities of 10% would have the effect of reducing the fair value by up to $0.4 million (2011: $0.5 million) or increase the fair value by $8.2 million (2011: $4.9 million).
For
per
sona
l use
onl
y

ABACUS PROPERTY GROUP
98
NOTES TO THE FINANCIAL STATEMENTS 30 JUNE 2012
23. CONTRIBUTED EQUITY
2012 2011$'000 $'000
(a) Issued stapled securitiesStapled securities 1,271,794 1,172,136 Issue costs (39,800) (32,312)Total contributed equity 1,231,994 1,139,824
(b) Movement in stapled securities on issue
Number Value'000 $'000
At 30 June 2011 378,484 1,139,824 - distribution reinvestment plan 18,920 36,188 - merger of Abacus Storage Fund 37,579 63,468 - less transaction costs - (7,486)Securities on issue at 30 June 2012 434,983 1,231,994
Stapled securities
24. CAPITAL MANAGEMENT
Abacus Property Group*
The Group seeks to manage its capital requirements through a mix of debt and equity funding. It also ensures that Group entities comply with capital and distribution requirements of their constitutions and/or trust deeds, the capital requirements of relevant regulatory authorities and continue to operate as going concerns. The Group also protects its equity in assets by taking out insurance.
The Group assesses the adequacy of its capital requirements, cost of capital and gearing (i.e. debt/equity mix) as part of its broader strategic plan. In addition to tracking actual against budgeted performance, the Group reviews its capital structure to ensure sufficient funds and financing facilities, on a cost effective basis are available to implement the Group’s strategy that adequate financing facilities are maintained and distributions to members are made within the stated distribution guidance (i.e. paid out of underlying profits).
The Group actively manages its capital via the following strategies: issuing new stapled securities, activating its distribution reinvestment plan (presently active at 2.5% discount to VWAP but not underwritten), electing to have the dividend reinvestment plan underwritten, adjusting the amount of distributions paid to members, activating a security buyback program, divesting assets, active management of the Group’s fixed rate swaps, directly purchasing assets in managed funds and joint ventures, or (where practical) recalibrating the timing of transactions and capital expenditure so as to avoid a concentration of net cash outflows.
The Group manages the cash flow effect of interest rate risk by entering into interest rate swap agreements that are used to convert floating interest rate borrowings to fixed interest rates. Such interest rate swaps are entered into with the objective of hedging the risk of interest rate fluctuations in respect of underlying borrowings. Under the interest rate swaps, the Group agrees with other parties to exchange, at specified intervals (mainly quarterly), the difference between fixed contract rates and floating rate interest amounts calculated by reference to the agreed notional principal amounts.
Interest rate swap contracts have been recorded on the Statement of Financial Position at their fair value in accordance with AASB 139 Financial Instruments: Recognition and Measurement. The AIFRS documentation, designation and effectiveness requirements cannot be met in all circumstances, as a result derivatives do not qualify for hedge accounting and are recorded at fair value through the Statement of Income.
The change in fair value of derivatives this year has been a result of falling interest rates and volatility in interest rate curves. * Excludes Abacus Hospitality Fund, Abacus Diversified Income Fund II and Abacus Miller Street Holding Trust
For
per
sona
l use
onl
y

ABACUS PROPERTY GROUP
99
NOTES TO THE FINANCIAL STATEMENTS 30 JUNE 2012
24. CAPITAL MANAGEMENT (continued)
A summary of the Group’s key banking covenants are set out below:
Covenant Covenant Requirement Key Details
Nature of facilities Secured, non recourse 1 The Group has no unsecured facilities
ICR > 1.5 Net rental income / interest expense (on bank loans)
ICR Covenant for Storage Assets
≥ 1.5 Underlying EBITDA (ex fair value P&L / interest expense paid to banks for loans secured by self storage properties
Group ICR ≥ 2.0 2 Group EBITDA (ex fair value P&L and impairment to goodwill and intangibles) / total interest expense
Total Gearing ≤ 50% 2 Total liabilities (net of cash) / total tangible assets (net of cash)
LVR ≤ 55% to 67.5% 3 Drawn loan / bank accepted valuations
Gearing ratio on a look through basis
≤ 60% 4 ABP gearing plus gearing from proportional consolidation of equity accounted investments
1. There are no market capitalisation covenants. 2. Condition of the current $400m Syndicated facility, $100m Working Capital facility and the $70m Bilateral facility. 3. The 67.5% LVR for the new Working Capital Facility will step down to 65.0% from 1 July 2014. 4. Condition of the $100m Working Capital Facility and $400m Syndicated facility.
Consolidated Funds
The Capital Management approach and strategies employed by the Group are also deployed for the funds ABP manages and which are consolidated in these accounts – AHF, ADIF II and AMSHT (or the Consolidated Funds).
Points unique to the capital management of these respective funds are:
• The Consolidated Funds via their responsible entities comply with capital and distribution requirements of their constitutions and/or deeds, the capital requirements of relevant regulatory authorities and continue to operate as going concerns
• There is currently no DRP for any of the Funds.
A summary of banking covenants – by fund – is set out below:
Covenant AHF ADIF II AMSHT
Nature of facilities Secured, non recourse Secured, non recourse Secured, non recourse
LVR Covenant ≤ 55%1 ≤ 50% - 60%3 ≤ 57.5%3
ICR Covenant ≥ 1.5 2 > 1.54 > 1.54
1. Drawn loan less cash secured / bank accepted valuations 2. Underlying EBITDA (ex fair value P&L) / interest expense paid to banks 3. Drawn loan / bank accepted valuations 4. Net rental income / interest expense paid to banks
For
per
sona
l use
onl
y

ABACUS PROPERTY GROUP
100
NOTES TO THE FINANCIAL STATEMENTS 30 JUNE 2012
25. INTEREST IN SUBSIDIARIES
(a) Interest in subsidiaries with material non-controlling interest (“NCI”)
The Group has the following subsidiaries with material non-controlling interest:
Profit/(loss)Principal allocated to Accumulatedplace of % held by NCI NCI
Name of Entity business NCI $'000 $'00030 June 2012Abacus Hospitality Fund Australia 90 3,874 32,039 Abacus Storage Fund* Australia 80 (3,098) - Abacus Miller Street Holding Trust Australia 70 358 5,375
1,134 37,414
30 June 2011Abacus Hospitality Fund Australia 90 (6,557) 33,803 Abacus Storage Fund Australia 80 (15,605) 92,777 Abacus Miller Street Holding Trust Australia 70 (1,156) 6,335
(23,318) 132,915
The country of incorporation is the same as the principal place of business, unless stated otherwise. * The Abacus Storage Fund merged with the Abacus Property Group in March 2012. Therefore, the only profit and loss had material non-controlling interest for the period 1 July 2011 to 6 March 2012 with the statement of financial position being Nil.
Significant Restrictions
There are no significant restrictions.
(b) Summarised financial information about subsidiary with material NCI
Summarised statement of financial position
2012 2011Abacus Hospitality Fund $'000 $'000Current assets 27,326 12,285 Current liabilities (7,461) (7,090)Net current assets 19,865 5,195
Non-current assets 152,190 159,414 Non-current liabilities (184,925) (170,267)Net non-current assets (32,735) (10,853)
Net deficiency (12,870) (5,658)
For
per
sona
l use
onl
y

ABACUS PROPERTY GROUP
101
NOTES TO THE FINANCIAL STATEMENTS 30 JUNE 2012
25. INTEREST IN SUBSIDIARIES (continued)
(b) Summarised financial information about subsidiary with material NCI (continued)
2012 2011Abacus Miller Street Holding Trust $'000 $'000Current assets 63,365 2,503 Current liabilities (828) (34,526)Net current assets 62,537 (32,023)
Non-current assets - 62,808 Non-current liabilities (54,859) (21,727)Net non-current assets (54,859) 41,081
Net assets 7,678 9,058
Summarised statement of comprehensive income
2012 2011Abacus Hospitality Fund $'000 $'000Revenue 51,064 60,163 Profit / (loss) before income tax (9,802) 8,687 Income tax expense 8 733 Profit / (loss) after tax (9,794) 9,420 Other comprehensive income 4,789 (1,646)Total comprehensive income / (expense) (5,005) 7,774
2012 2011Abacus Storage Fund $'000 $'000Revenue 28,954 40,393 Profit / (loss) before income tax 4,667 23,262 Income tax expense (890) (3,327)Profit / (loss) after tax 3,777 19,935 Other comprehensive income 2,544 (554)Total comprehensive income 6,321 19,381
2012 2011Abacus Miller Street Holding Trust $'000 $'000Revenue 5,627 5,939 Loss before income tax (515) 1,652 Income tax expense - - Loss after tax (515) 1,652 Other comprehensive income - - Total comprehensive income / (expense) (515) 1,652
For
per
sona
l use
onl
y

ABACUS PROPERTY GROUP
102
NOTES TO THE FINANCIAL STATEMENTS 30 JUNE 2012
26. RELATED PARTY DISCLOSURES
(a) Subsidiaries
The consolidated financial statements include the financial statements of the following entities:
2012 2011Entity % %Abacus Group Holdings Limited and its subsidiariesAbacus (343 George St Sydney) Pty Ltd 100 100Abacus AAVT Pty Ltd 100 100Abacus Airways NZ Trust 100 100Abacus Castle Hill Trust 100 -Abacus CIH Pty Ltd 100 100Abacus Finance Pty Limited 100 100Abacus Forrest Lodge Trust 100 100Abacus Funds Management Limited 100 100Abacus Griffith Avenue Trust 100 100Abacus HP Operating Co Pty Ltd 100 100Abacus HP Trust 100 100Abacus Investment Pty Ltd 100 100Abacus Jigsaw Investments Pty Ltd 100 100Abacus Mariners Lodge Trust 100 100Abacus Mortgage Fund 100 100Abacus Mount Druitt Trust 100 100Abacus Musswellbrook Pty Ltd 100 100Abacus Nominee Services Pty Limited 100 100Abacus Nominees (No 5) Pty Limited 100 100Abacus Nominees (No 7) Pty Limited 100 100Abacus Nominees (No 9) Pty Limited 100 100Abacus Note Facilities Pty Ltd 100 100Abacus Pitt Street Property Trust 100 100Abacus Property Income Fund 100 100Abacus Property Services Pty Ltd 100 100Abacus SP Note Facility Pty Ltd 100 100Abacus Storage Funds Management Limited 100 100Abacus Unitel Pty Ltd 100 100Abacus Unitel Trust 100 100Amiga Pty Limited 100 100Bay Street Brighton Unit Trust 100 100Birkenhead Point Marina Pty Ltd 50 50Childcare Trust 2 100 100Clarendon Property Investments Pty Ltd 100 100Corporate Helpers Pty Ltd 100 100Main Street Pakenham Unit Trust 100 100
Abacus Group Projects Limited and its subsidiariesAbacus Property Pty Ltd 100 100Abacus Allara Street Trust 50 50Abacus Jigsaw Holdings Pty Limited 50 50Abacus Repository Trust 50 50Abacus Ventures Trust 51 51
equity interest
For
per
sona
l use
onl
y

ABACUS PROPERTY GROUP
103
NOTES TO THE FINANCIAL STATEMENTS 30 JUNE 2012
26. RELATED PARTY DISCLOSURES (continued)
(a) Subsidiaries (continued)
2012 2011Entity % %Abacus Trust and its subsidiaries:Abacus 1769 Hume Highway Trust 100 100Abacus Alderley Trust 100 100Abacus Alexandria Trust 100 100Abacus Ashfield Mall Property Trust 100 100Abacus Birkenhead Point Trust 100 100Abacus Campbell Property Trust 100 100Abacus Epping Park Property Trust 100 100Abacus Greenacre Trust 100 100Abacus Heitman Investment Trust 100 100Abacus Hurstville Trust 100 100Abacus Industrial Property Trust 100 100Abacus Lisarow Trust 100 100Abacus Liverpool Plaza Trust 100 100Abacus Macquarie Street Trust 100 100Abacus Moorabbin Trust 100 100Abacus Moore Street Trust 100 100Abacus Northshore Trust 1 25 25Abacus Northshore Trust 2 25 25Abacus North Sydney Car park Trust 100 100Abacus Premier Parking Trust 100 100Abacus Sanctuary Holdings Pty Limited 25 25Abacus Shopping Centre Trust 100 100Abacus Smeaton Grange Trust 100 100Abacus SP Fund 100 100Abacus Varsity Lakes Trust 100 100Abacus Virginia Trust 100 100Abacus Westpac House Trust 100 100Abacus 14 Martin Place Trust 100 100Abacus 171 Clarence Street Trust 100 100Abacus 309 George Street Trust
Abacus Income Trust and its subsidiaries:Abacus Campbellfield Trust 100 100Abacus Chermside Trust 100 100Abacus Eagle Farm Trust 100 100Abacus Independent Retail Property Trust 75 75Abacus Lennons Plaza Trust 100 100Abacus Mertz Apartments 100 100Abacus Retail Property Trust 100 100Abacus Stafford Trust 100 100Abacus Tamworth Retail Trust 100 100Abacus Wollongong Property Trust 100 100
equity interest
F
or p
erso
nal u
se o
nly

ABACUS PROPERTY GROUP
104
NOTES TO THE FINANCIAL STATEMENTS 30 JUNE 2012
26. RELATED PARTY DISCLOSURES (continued)
(a) Subsidiaries (continued)
2012 2011Entity % %Abacus Storage Operations Limited and its subsidiaries:Balmain Storage Pty Limited 100 100Abacus Storage (Bulleen and Greensborough) Pty Limited 100 100Abacus Storage NZ Operations Pty Limited 100 100Abacus Storage Solutions Pty Limited 100 100Abacus Storage Solutions NZ Pty Limited 100 100Abacus USI C Trust 100 100Abacus U Stow It A1 Trust 100 100Abacus U Stow It B1 Trust 100 100Abacus U Stow It A2 Trust 100 100Abacus U Stow It B2 Trust 100 100U Stow It Holdings Limited 100 100U Stow It Pty Limited
Abacus Storage Property Trust and its subsidiary:Abacus Storage NZ Property Trust 100 100
Abacus Diversified Income Fund II - -Abacus Hospitality Fund 10 10Abacus Miller Street Holding Trust 30 30
equity interest
Subsidiaries controlled by the Group with material non-controlling interest
Abacus Hospitality Fund: Based upon work undertaken by the Group in assessing the impact of AASB 10, the Group is deemed under the standard to have control of AHF based upon the aggregate impact of (a) the Group’s role as responsible entity of AHF and (b) the size and variable nature of returns arising from the Group’s loans to AHF (as the loans provided by the Group to AHF rank pari passu for downside but not on upside at fund wind up).
Abacus Diversified Income Fund II: Based upon work undertaken by the Group in assessing the impact of AASB 10, the Group is deemed under the new standard to have control of ADIFII based upon the aggregate impact of (a) the Group’s role as responsible entity of ADIFII (b) the size and variable nature of returns arising from the Group’s loans to ADIFII (as the Abacus Working Capital Facility provided by the Group to ADIFII ranks pari passu on downside, but not the upside, at wind up) and (c) the capital and income guarantees made by the Group to unitholders of ADIFII under the ADIFII offer documents.
Abacus Miller Street Holding Trust: Based upon work undertaken by the Group in assessing the impact of AASB 10, the Group is deemed under the new standard to have control of AMSHT a) the Group’s role as responsible entity of AMSHT and (b) the Group’s 30% direct interest in the fund and the relative dispersion of the remaining interests not held by the Group.
(b) Ultimate parent
AGHL has been designated as the parent entity of the Group.
(c) Key Management Personnel
Details of key management personnel are disclosed in Note 28(b).
For
per
sona
l use
onl
y

ABACUS PROPERTY GROUP
105
NOTES TO THE FINANCIAL STATEMENTS 30 JUNE 2012
26. RELATED PARTY DISCLOSURES (continued)
(d) Transactions with related parties
2012 2011$'000 $'000
Transactions with related parties other than associates and joint venturesRevenuesAsset management fees received / receivable - 42 Property management fees received / receivable 153 118 Interest revenue from related funds - 498
Transactions with associates and joint venturesRevenuesManagement fees received / receivable from joint ventures 1,394 480 Management fees received / receivable from associates 557 646 Distributions received / receivable from joint ventures 5,818 1,382 Interest revenue from associates 3,507 2,817 Interest revenue from joint ventures 1,122 2,965
Other transactionsLoan advanced to associates (8,186) (5,117)Loan repayments from associates 4,527 3,739 Loan advanced to joint ventures (134) (1,471)Loan repayments from joint ventures 2,860 2,889 Loan advanced from joint ventures 1,929 - Loan repayments to joint ventures - (1,299)Impairment charge - Abacus Wodonga Land Fund (3,507) -
Terms and conditions of transactions
Sales and fees to and purchases and fees charged from related parties are made in arm’s length transactions both at normal market prices and on normal commercial terms.
Outstanding balances at year-end are unsecured and settlement occurs in cash.
No provision for doubtful debts has been recognised or bad debts incurred with respect to amounts payable or receivable from related parties during the year.
For
per
sona
l use
onl
y
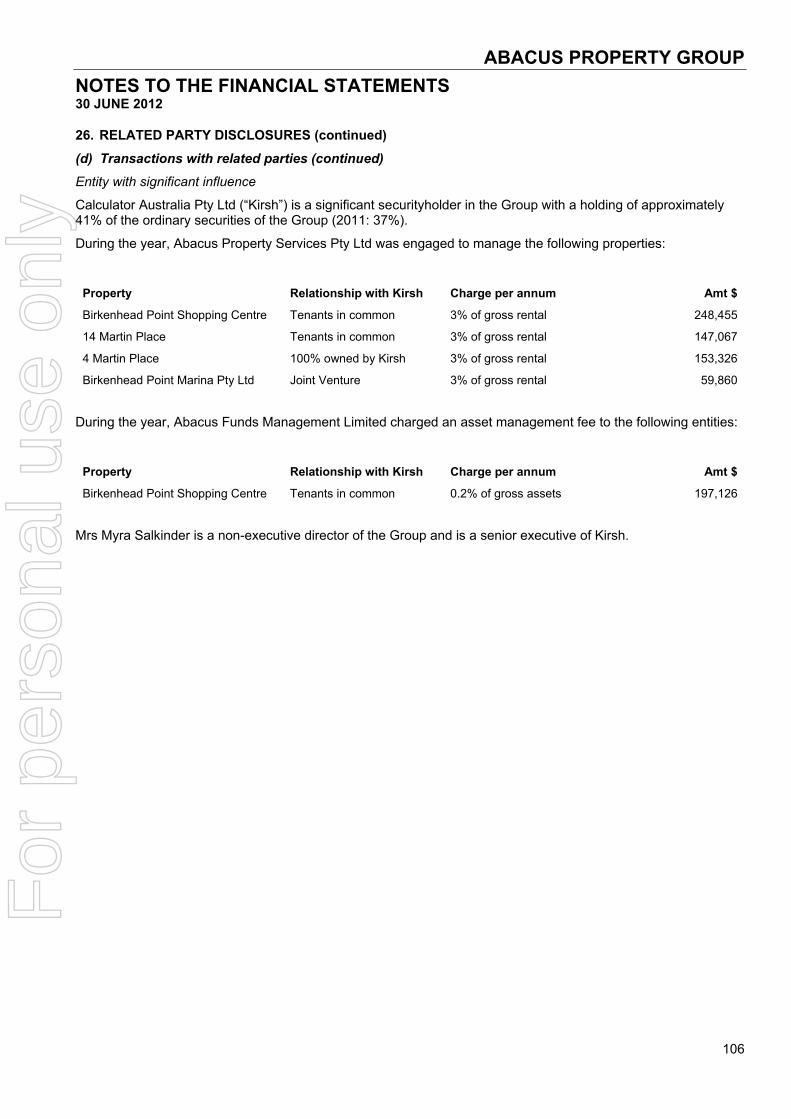
ABACUS PROPERTY GROUP
106
NOTES TO THE FINANCIAL STATEMENTS 30 JUNE 2012
26. RELATED PARTY DISCLOSURES (continued)
(d) Transactions with related parties (continued)
Entity with significant influence
Calculator Australia Pty Ltd (“Kirsh”) is a significant securityholder in the Group with a holding of approximately 41% of the ordinary securities of the Group (2011: 37%).
During the year, Abacus Property Services Pty Ltd was engaged to manage the following properties:
Property Relationship with Kirsh Charge per annum Amt $
Birkenhead Point Shopping Centre Tenants in common 3% of gross rental 248,455
14 Martin Place Tenants in common 3% of gross rental 147,067
4 Martin Place 100% owned by Kirsh 3% of gross rental 153,326
Birkenhead Point Marina Pty Ltd Joint Venture 3% of gross rental 59,860
During the year, Abacus Funds Management Limited charged an asset management fee to the following entities:
Property Relationship with Kirsh Charge per annum Amt $
Birkenhead Point Shopping Centre Tenants in common 0.2% of gross assets 197,126
Mrs Myra Salkinder is a non-executive director of the Group and is a senior executive of Kirsh.
For
per
sona
l use
onl
y

ABACUS PROPERTY GROUP
107
NOTES TO THE FINANCIAL STATEMENTS 30 JUNE 2012
27. MERGER OF ASF
On 24 February 2012 securityholders in both Abacus Property Group and Abacus Storage Fund (an unlisted fund managed by Abacus Storage Funds Management Limited as responsible entity) agreed to merge the two entities effective 6 March 2012. The merger resulted in the shares in Abacus Storage Operations Limited and the units in Abacus Storage Property Trust being stapled to the shares in Abacus Group Holdings Limited and Abacus Group Projects Limited and units in Abacus Trust and Abacus Income Trust under a stapled security listed on the Australian Securities Exchange.
The net assets of Abacus Storage Fund at the date of the merger are set out below:
$'000CURRENT ASSETSCash and cash equivalents 1,528 Trade and other receivables 688 Other 556 TOTAL CURRENT ASSETS 2,772
NON-CURRENT ASSETSInvestment properties 340,331 Property, plant and equipment 780 TOTAL NON-CURRENT ASSETS 341,111
TOTAL ASSETS 343,883
CURRENT LIABILITIESTrade and other payables 12,909 Derivatives at fair value 53 Income tax payable 170 TOTAL CURRENT LIABILITIES 13,132
NON-CURRENT LIABILITIESInterest-bearing loans and borrowings 220,154 Derivatives at fair value 3,879 Deferred tax liabilities 4,654
228,687
TOTAL LIABILITIES 241,819
NET ASSETS 102,064
TOTAL NON-CURRENT LIABILITIES
The net assets of Abacus Storage Fund had been already consolidated by Abacus Property Group following its adoption of AASB 10, 11 and 12 which was applied retrospectively as at 1 July 2010.
To facilitate the merger, a series of stapling distributions were made by Abacus Trust, Abacus Income Trust and Abacus Storage Property Trust to their respective unitholders. Abacus Trust paid a capital distribution of $22.6 million ($0.0585 cents per unit) to its unitholders and Abacus Income Trust paid a capital distribution of $15.1 million ($0.0390 cents per unit) to its unitholders on the implementation date which was then applied to acquire approximately 377.4 million units in Abacus Storage Property Trust and approximately 377.4 million shares in Abacus Storage Operations Limited on behalf of existing Abacus Trust and Abacus Income Trust unitholders. Abacus Storage Property Trust also paid a capital distribution of $18.8m ($0.50 cents per unit) to its unitholders on the implementation date which was then applied to acquire approximately 37.6 million units in Abacus Trust and Abacus Income Trust and approximately 37.6 million shares in Abacus Group Holdings Limited and Abacus Group Projects Limited on behalf of existing Abacus Storage Property Trust unitholders.
For
per
sona
l use
onl
y

ABACUS PROPERTY GROUP
108
NOTES TO THE FINANCIAL STATEMENTS 30 JUNE 2012
27. MERGER OF ASF (continued)
In addition approximately 17.4 million units in Abacus Storage Property Trust and shares in Abacus Storage Operations Limited were distributed to existing Abacus Trust and Abacus Income Trust unitholders. The result of making the distributions and subscription for shares and units in respective Group entities was that each of Abacus Trust, Abacus Income Trust, Abacus Storage Property Trust, Abacus Group Holdings Limited, Abacus Group Projects Limited and Abacus Storage Operations Limited had 424.3 million units or shares (as the case may be) on issue at 6 March 2012.
For
per
sona
l use
onl
y

ABACUS PROPERTY GROUP
109
NOTES TO THE FINANCIAL STATEMENTS 30 JUNE 2012
28. KEY MANAGEMENT PERSONNEL
(a) Compensation for Key Management Personnel
2012 2011$ $
Short-term employee benefits 5,879,867 5,329,634 Post-employment benefits 337,730 537,515 Other long-term benefits 94,306 95,369 Security-based payments - 53,524
6,311,903 6,016,042
(b) Security holdings of Key Management Personnel
Securities held in Abacus Property Group (number)
Balance Purchases/ Balance30 June 12 1 July 11 (sales) 30 June 12
DirectorsJ Thame 55,364 - 55,364 F Wolf 2,837,464 - 2,837,464 W Bartlett 22,806 - 22,806 D Bastian 900,000 (355,000) 545,000 M Irving 26,718 2,345 29,063
ExecutivesR de Aboitiz 3,939 29,486 33,425 L Lloyd 11,185 (11,185) - P Strain 32,590 24,987 57,577 E Varejes 61,975 13,439 75,414 Total 3,952,041 (295,928) 3,656,113
Balance Consolidation Retired Purchases/ Balance30 June 11 1 July 10 (sales) 30 June 11
DirectorsJ Thame 276,820 (221,456) - - 55,364 F Wolf 14,187,322 (11,349,858) - - 2,837,464 W Bartlett 114,032 (91,226) - - 22,806 D Bastian 5,500,000 (4,400,000) - (200,000) 900,000 D Bluth 342,302 (273,842) (71,266) 2,806 - M Irving 123,550 (98,840) - 2,008 26,718
ExecutivesR de Aboitiz 435,933 (348,746) - (83,248) 3,939 L Lloyd 55,925 (44,740) - - 11,185 P Strain 150,701 (120,561) - 2,450 32,590 E Varejes 309,875 (247,900) - - 61,975 Total 21,496,460 (17,197,169) (71,266) (275,984) 3,952,041
All equity transactions with key management personnel other than those arising from the exercise of remuneration options have been entered into under terms and conditions no more favourable than those the Group would have adopted if dealing at arm’s length.
(c) Loans to Key Management Personnel
There were no loans to individuals that exceeded $100,000 at any time in 2012 or in the prior year.
For
per
sona
l use
onl
y

ABACUS PROPERTY GROUP
110
NOTES TO THE FINANCIAL STATEMENTS 30 JUNE 2012
28. KEY MANAGEMENT PERSONNEL (continued)
(d) Other transactions and balances with Key Management Personnel and their related parties
During the financial year, transactions occur between the Group and Key Management Personnel which are within normal employee, customer or supplier relationship on terms and conditions no more favourable to than those with which it is reasonable to expect the entity would have adopted if dealing with Key Management Personnel or director-related entity at arm’s length in similar circumstances including, for example, performance of contracts of employment, the reimbursement of expenses and the payment of distributions on their stapled securities in the Group and on their investment in various Trusts managed by Abacus Funds Management Limited as Responsible Entity.
29. SECURITY BASED PAYMENTS
(a) Recognised security payment expenses
The expense recognised for employee services received during the year is as follows:
2012 2011$'000 $'000
Expense arising from cash-settled payment transactions - 83
The security-based payment are described below.
(b) Type of security-based payment plan
Security Appreciation Rights (SARs)
SARs issued under the Group’s long term incentive plan can only be settled in cash and vest at the end of the three-year period provided the executive remains employed by the Group (or otherwise at the Board’s discretion). The gain is calculated as the difference between the exercise price, being the security price at the beginning of the financial year in which the SARs are granted, and the Group’s security price at maturity. A SAR is assumed to be exercised on maturity if it is in the money, and the net gain is settled in cash.
(c) Summary of SARs granted
As set out in the remuneration report all of the SARs were cancelled during the year end and the following table illustrates movements in SARs:
2012 2011No. No.
Opening balance 2,976,923 - Granted during the year 12,785,714 2,976,923 Cancelled during the year (15,762,637) - Outstanding at the end of the year - 2,976,923
Exercisable at the end of the year - -
For
per
sona
l use
onl
y

ABACUS PROPERTY GROUP
111
NOTES TO THE FINANCIAL STATEMENTS 30 JUNE 2012
30. OTHER FINANCIAL LIABILITIES
Abacus Property Group*
The Group has provided the following guarantees to the ADIFII:
Unit Type Cash Distribution Yield Guarantee Capital Return Guarantee
Class A $1.00 8.5% pa until 30 June 2011 and based on the actual distributable cash of the Fund thereafter.
$1.00 per unit at 30 September 2013 if the net assets per Unit are less than $1.00 at 30 June 2013.
Class B $1.00 9% pa until 30 June 2011 and 9.0% pa plus indexation thereafter (indexed in line with inflation in each year after 1 July 2011).
$1.00 per Unit at Fund termination (effective on 30 June 2016).
Class C $0.75 9% until 30 June 2011 and 9% pa plus indexation thereafter (indexed in line with inflation in each year after 1 July 2011).
$0.75 per Unit at Fund termination (effective on 30 June 2016).
The Underwritten Distributions will be achieved by deferring the interest on the Working Capital Facility or by deferring any of the fees payable to the Group under the constitution of ADIFII (or a combination of these things) or in any other way the Group considers appropriate. Any interest or fee deferral or other funding support may be recovered if the actual cash distribution exceeds the cash required to meet the underwritten distribution at the expiration of the Fund term or on a winding up of the Fund.
The Underwritten Capital Return will apply to all ADIFII units on issue as at 1 July 2013 (Class A) or on or after 1 July 2016 (Class B and C). At the time the Group will make an offer to acquire each Class A unit for $1.00, or ensure that each holder of Class B units receives back their $1.00 initial capital and each holder of Class C units receives back their $0.75 initial capital. The Underwritten Capital returns can be satisfied at the Group’s discretion (Class A) through either a payment in cash or by the Group issuing stapled securities in APG to an equivalent value based on the 10 day volume weighted average price of APG’s stapled securities over the period ending on 30 June 2013 or prior to issuing stapled securities as applicable.
After 30 June 2016 the Group will, if required, set off all or part of the principal of the second secured Working Capital Facility loan provided to ADIFII in satisfaction of the Group’s obligations in respect of the Underwritten Capital Return in respect of the Class B and Class C units.
As a result of the consolidation of ADIFII under AASB10 the underwritten capital guarantee results in ADIFII’s units on issue being classified as a liability and at the end of the period the value was $56.3 million (30 June 2011: $49.9 million). The ADIFII distribution of $4.4 million (2011: $3.7 million) is included in other expenses in note 7(d).
The offer document for ADIFII was closed in December 2011 and no further equity will be raised. The actual guarantee exposure (if any) will be determined at the maturity date of the guarantee in 2013 (c20% of the total guarantee exposure) and between 1 July 2016 and 30 June 2017 (c80% of the total guarantee exposure).
* Excludes Abacus Hospitality Fund, Abacus Diversified Income Fund II and Abacus Miller Street Holding Trust
For
per
sona
l use
onl
y

ABACUS PROPERTY GROUP
112
NOTES TO THE FINANCIAL STATEMENTS 30 JUNE 2012
31. COMMITMENTS AND CONTINGENCIES
Abacus Property Group*
Operating lease commitments – Group as lessee
The Group has entered into a commercial lease on its offices. The lease has a term of three years with an option to renew for another three years.
Future minimum rentals payable under non-cancellable operating lease as at 30 June are as follows:
2012 2011$'000 $'000
Within one year 374 747 After one year but not more than five years - 374 More than five years - -
374 1,121
Operating lease commitments – Group as lessor
Future minimum rentals receivable under non-cancellable operating leases as at 30 June are as follows:
2012 2011$'000 $'000
Within one year 88,768 91,647 After one year but not more than five years 245,854 240,928 More than five years 108,106 112,062
442,728 444,637
These amounts do not include percentage rentals which may become receivable under certain leases on the basis of retail sales in excess of stipulated minimums and, in addition, do not include recovery of outgoings.
Capital and Other commitments
At 30 June 2012 the Group had numerous commitments and contingent liabilities which principally related to property acquisition settlements, loan facility guarantees for the Group's interest in the jointly controlled projects and funds management vehicles, commitments relating to property refurbishing costs and unused mortgage loan facilities to third parties.
Commitments planned and/or contracted at reporting date but not recognised as liabilities are as follows:
2012 2011$'000 $'000
Within one year - gross settlement of property acquisitions 7,375 24,005 - property refurbishment costs 12,605 5,123 - property development costs 13,417 9,900 - unused portion of loan facilities to outside parties 4,996 4,127
38,393 43,155
* Excludes Abacus Hospitality Fund, Abacus Diversified Income Fund II and Abacus Miller Street Holding Trust
For
per
sona
l use
onl
y

ABACUS PROPERTY GROUP
113
NOTES TO THE FINANCIAL STATEMENTS 30 JUNE 2012
31. COMMITMENTS AND CONTINGENCIES (continued)
Capital and Other commitments (continued)
In accordance with Group policy, the fair value of all guarantees are estimated each period and form part of the Group’s reported AIFRS results. There has been no other material change to any contingent liabilities or contingent assets.
2012 2011$'000 $'000
Contingent liabilities:Within one year - corporate guarantee 6,750 4,000 6,750 4,000
Abacus Diversified Income Fund II
Operating lease commitments – as lessor
Future minimum rentals receivable under non-cancellable operating leases as at 30 June are as follows:
2012 2011$'000 $'000
Within one year 14,168 12,246 After one year but not more than five years 40,714 47,844 More than five years 16,143 23,180
71,025 83,270
These amounts do not include percentage rentals which may become receivable under certain leases on the basis of retail sales in excess of stipulated minimums and, in addition, do not include recovery of outgoings.
Capital and Other commitments
2012 2011$'000 $'000
Within one year - property refurbishment costs 1,745 3,215
1,745 3,215
Abacus Miller Street Holding Trust
Operating lease commitments – as lessor
Future minimum rentals receivable under non-cancellable operating leases as at 30 June are as follows:
2012 2011$'000 $'000
Within one year 5,047 5,259 After one year but not more than five years 18,211 15,476 More than five years 3,818 9,290
27,076 30,025
These amounts do not include percentage rentals which may become receivable under certain leases on the basis of retail sales in excess of stipulated minimums and, in addition, do not include recovery of outgoings.
For
per
sona
l use
onl
y

ABACUS PROPERTY GROUP
114
NOTES TO THE FINANCIAL STATEMENTS 30 JUNE 2012
32. AUDITOR’S REMUNERATION
2012 2011Restated*
$ $
Amounts received or due and receivable by Ernst & Young Australia for: - an audit of the financial report of the entity and any other entity in the consolidated entity 958,000 958,000 - transactional advisory services 262,300 47,441
1,220,300 1,005,441
*Certain amounts shown here do not correspond to the 2011 financial statements as they reflect required adjustments resulting from the adoption of AASB10 as set out in note 2.
33. EVENTS AFTER BALANCE SHEET DATE
Other than as disclosed in this report and to the knowledge of directors, there has been no other matter or circumstance that has arisen since the end of the financial year that has or may affect the Group’s operations in future financial years, the results of those operations or the Group’s state of affairs in future financial years.
For
per
sona
l use
onl
y

ABACUS PROPERTY GROUP
115
DIRECTORS’ DECLARATION
In accordance with a resolution of the Directors of Abacus Group Holdings Limited, we state that:
In the opinion of the directors:
a. the financial statements, notes and the additional disclosures included in the directors’ report designated as audited, of the company and of the consolidated entity are in accordance with the Corporations Act 2001, including:
(i) giving a true and fair view of the company’s and consolidated entity’s financial position as at 30 June 2012 and of their performance for the year ended on that date; and
(ii) complying with Australian Accounting Standards (including Australian Accounting Interpretations) and the Corporations Regulations 2001;
b. the financial report also complies with International Financial Reporting Standards as disclosed in Note 2(b); and
c. there are reasonable grounds to believe that the Company will be able to pay its debts as and when they become due and payable.
This declaration has been made after receiving the declarations required to be made to the directors in accordance with sections 295A of the Corporations Act 2001 for the financial year ended 30 June 2012.
On behalf of the Board
John Thame Frank Wolf Chairman Managing Director Sydney, 28 August 2012
For
per
sona
l use
onl
y

For
per
sona
l use
onl
y

For
per
sona
l use
onl
y

Abacus Property Group Corporate Governance Report
1
This report sets out the Group’s position relating to each of the ASX Corporate Governance Council Principles of Good Corporate Governance during the year. Additional information, including charters and policies, is available through a dedicated corporate governance information section on the Abacus website at www.abacusproperty.com.au under ‘About Abacus’. Principle 1: Lay solid foundations for management and oversight Recommendation 1.1 The Board has adopted a charter that sets out the functions and responsibilities reserved by the Board, those delegated to the Managing Director and those specific to the Chairman. The conduct of the Board is also governed by the Constitution. The roles of Chairman and Managing Director are not exercised by the same individual. The primary responsibilities of the Board and the Managing Director are set out in the Board Charter. Senior executives reporting to the Managing Director have their roles and responsibilities defined in position descriptions and are given a letter of appointment on commencement. The Board Charter and Constitution are available on the Abacus website. Recommendation 1.2 Induction procedures are in place for all staff (including senior executives) that include a briefing on relevant aspects of Abacus’ financial position, strategies, operations and risk management policies as well as the respective rights, duties and responsibilities of the Board and senior executives, Each year the Board, with the assistance of the Managing Director, and the Nomination and Remuneration Committee, undertakes a formal process of reviewing the performance of senior executives. The measures generally relate to the performance of Abacus and the performance of the executive individually. The Managing Director is not present at the Board or Nomination and Remuneration Committee meetings when his own remuneration and performance is being considered. An annual review has taken place in the reporting period in accordance with the process outlined above. Principle 2: Structure the board to add value Recommendation 2.1 The board comprises one executive director and five non-executive directors. The majority of the Board (Messrs Thame, Irving, Bastian and Bartlett) are independent members. The board has determined that an independent director is one who:
• is not a substantial security holder or an officer of, or is not otherwise associated directly with, a substantial security holder of the Group;
• has not within the previous three years been employed in any executive capacity;
• has not within the last three years been a principal of a material professional adviser or a material consultant to the Group; or an employee materially associated with the service provided;
For
per
sona
l use
onl
y

Abacus Property Group Corporate Governance Report
2
• is not a material supplier or customer of the Group, or an officer of or otherwise associated directly or indirectly with a material supplier or customer; or
• does not have a material contractual relationship with the Group other than as a director.
No independent non-executive director has a relationship significant enough to compromise their independence on the Board. Non-executive directors confer regularly without management present. Any change in the independence of a non-executive director would be disclosed and explained to the market in a timely manner. Given the nature of the Group’s business and current stage of development, the Board considers its current composition provides the necessary skills and experience to ensure a proper understanding of, and competence to deal with, the current and emerging issues of the business to optimise the financial performance of the Group and returns to securityholders. Details of the skills, experience and expertise of each director are set out on page 6. Directors’ independent advice Directors may seek independent professional advice with the Chairman’s consent, which will not be unreasonably withheld or delayed, on any matter connected with the performance of their duties, and which advice will be at the Group’s expense. Recommendation 2.2 The Chairman of the Board (Mr John Thame) is an independent, non-executive director. Recommendation 2.3 The roles of Chairman and Chief Executive Officer/Managing Director are not exercised by the same individual. The division of responsibility between the Chairman and Managing Director has been agreed by the Board and is set out in the Board Charter. Recommendation 2.4 The Board has established a Nomination and Remuneration Committee. The Committee’s charter sets its role, responsibilities and membership requirements. The members of the committee and their attendance at meetings are provided on page 8. The Chairman of the committee is independent. The Selection and Appointment of Non-Executive Directors policy sets out the procedures followed when considering the appointment of new directors. The Nomination and Remuneration Committee Charter and the Selection and Appointment of Non-Executive Directors Policy are available on the Abacus website. The Board is committed to workplace diversity, with a particular focus on supporting the representation of women at a senior level of the Group and on the Board. The Diversity Policy is available on the Abacus website. Over 45% of Abacus’ employees are women. Abacus has female representation at both the Board (17%) and senior management (11%) level. In 2011, the Board set female representation at Board level as a priority and this was met in April 2011 with the appointment of a female director. In the current period, Abacus has recruited from a diverse pool of candidates for all positions filled during the year and has a number of employees with flexible employment arrangements to take account of domestic responsibilities.
For
per
sona
l use
onl
y

Abacus Property Group Corporate Governance Report
3
Recommendation 2.5 The Board has a documented Performance Evaluation Policy which outlines the process for evaluating the performance of the board, its committees and individual directors. An annual review has taken place in the reporting period in accordance with the policy. Principle 3: Promote ethical and responsible decision-making Recommendation 3.1 The Group’s Code of Conduct promotes ethical practices and responsible decision making by directors and employees. The Code deals with confidentiality of information, protection of company assets, disclosure of potential conflicts of interest and compliance with laws and regulations. The Code of Conduct is available on the Abacus website. Recommendation 3.2 The Diversity Policy is available on the Abacus website. The Board is committed to workplace diversity, with a particular focus on supporting the representation of women at a senior level of the Group and on the Board. Over 45% of Abacus’ employees are women. In 2011, the Board set female representation at Board level and senior management as a priority. Abacus currently has female representation at both the Board (17%) and senior management (11%) level. Abacus has recruited from a diverse pool of candidates for all positions filled during the year and has a number of employees with flexible employment arrangements to take account of domestic responsibilities. Principle 4: Safeguard integrity in financial reporting Recommendation 4.1, 4.2 and 4.3 The board has established an Audit and Risk Committee. The Audit and Risk Committee comprises three independent non-executive directors and one non-independent non-executive director and the chairman of the Committee is not the chairman of the Board. The members of the committee and their attendance at meetings are provided on page 8. Other directors that are not members of the committee, the external auditor and other senior executives attend meetings by invitation. The Audit and Risk Committee has a formal charter which sets out its specific roles and responsibilities, and composition requirements. The procedures for the selection and appointment of the external auditor are set out in the Audit and Risk Committee Charter. The Audit and Risk Committee Charter is available on the Abacus website. Principle 5: Make timely and balanced disclosure Recommendation 5.1 The Group has a policy and procedures designed to ensure compliance with ASX Listing Rule disclosure requirements. The Managing Director is responsible for ensuring that the Group complies with its disclosure obligations.
For
per
sona
l use
onl
y

Abacus Property Group Corporate Governance Report
4
The Continuous Disclosure and Shareholder Communications Policy is available on the Abacus website. Principle 6: Respect the rights of securityholders Recommendation 6.1 The Group aims to keep securityholders informed of significant developments and activities of the Group. The Group’s website is updated regularly and includes annual and half-yearly reports, distribution history and all other announcements lodged with the ASX. The Abacus website also includes webcasts of the results briefings. The Group keeps a summary record for internal use of the issues discussed at group and one-on-one briefings with investors and analysts, including a record of those present where appropriate. The Continuous Disclosure and Shareholder Communications Policy is available on the Abacus website. In addition, the Group publishes a newsletter from time to time which updates investors and their advisers on the current activities of the Group. External auditor The external auditor attends the annual general meetings of the Group and is available to answer securityholder questions. Principle 7: Recognise and manage risk Recommendation 7.1 and 7.2 The Business Risk Management Policy dealing with oversight and management of material business risks is set out in the corporate governance information section on the Abacus website. The Group’s Risk Management Framework was developed in consultation with an external consultant. Under the compliance plan, the responsible managers report regularly on the risks they manage and any emerging risks. An independent consultant has been appointed who reviews business processes and undertakes formal assessments throughout the year. These assessments are provided to the Audit and Risk Committee for review. The Audit and Risk Committee has responsibility for reviewing the Group’s risk management framework. The risk management framework is formally reviewed annually. This review is initially carried out by the Compliance and Risk Manager and then reviewed by the Audit and Risk Committee and the Board to assess any necessary changes. Recommendation 7.3 The Managing Director and Chief Financial Officer confirm in writing to the Board that the financial statements present a true and fair view and that this statement is based on a sound system of risk management and internal compliance. The statement also confirms that the statement is founded on a sound system of risk management and internal control and that the system is operating effectively in all material respects in relation to financial reporting risks.
For
per
sona
l use
onl
y

Abacus Property Group Corporate Governance Report
5
Principle 8: Remunerate fairly and responsibly Recommendation 8.1 The board has established a Nomination and Remuneration Committee. The Nomination and Remuneration Committee is responsible for assessing the processes for evaluating the performance of the Board and key executives. A copy of the committee charter is available on the Abacus website. The Chairman of the Nomination and Remuneration Committee is independent. The Group’s remuneration policies including security-based payment plans and the remuneration of key management personnel are discussed in the Remuneration Report. The Nomination and Remuneration Committee may seek input from individuals on remuneration policies but no individual employee is directly involved in deciding their own remuneration. The members of the committee and their attendance at meetings are provided on page 8. Non-executive directors are paid fees for their service and do not participate in other benefits which may be offered other than those which are statutory requirements.
For
per
sona
l use
onl
y

ASX Additional Information
Abacus Property Group is made up of the Abacus Trust, Abacus Income Trust, Abacus Storage Property Trust, Abacus Group Holdings Limited, Abacus Group Projects Limited and Abacus Storage Operations Limited. The responsible entity of the Abacus Trust and Abacus Income Trust is Abacus Funds Management Limited. The responsible entity of the Abacus Storage Property Trust is Abacus Storage Funds Management Limited. Unless specified otherwise, the following information is current as at 23 August 2012. Number of holders of ordinary fully paid stapled securities 9,794 Voting rights attached to ordinary fully paid stapled securities one vote per stapled security Number of holders holding less than a marketable parcel of ordinary fully paid stapled securities
639
Secretary, Abacus Funds Management Limited Secretary, Abacus Storage Funds Management Limited Secretary, Abacus Group Holdings Limited Secretary, Abacus Group Projects Limited Secretary, Abacus Storage Operations Limited
Ellis Varejes
Registered office Abacus Funds Management Limited Abacus Storage Funds Management Limited Abacus Group Holdings Limited Abacus Group Projects Limited Abacus Storage Operations Limited
Level 34, Australia Square264-278 George Street
Sydney NSW 2000612 9253 8600
Registry Boardroom Pty Limited
Level 7, 207 Kent StreetSydney NSW 2000
(02) 9290 9600 Other stock exchanges on which Abacus Property Group securities are quoted none Number and class of restricted securities or securities subject to voluntary escrow that are on issue none There is no current on-market buy-back SUBSTANTIAL SECURITYHOLDER NOTIFICATIONS
Securityholders Number of Securities Calculator Australia Pty Limited 178,459,600
Perpetual Limited 39,473,995
For
per
sona
l use
onl
y

SECURITIES REGISTER
Number of Securities Number of Securityholders 1-1,000 1,443
1,001-5,000 3,615 5,001-10,000 2,318
10,001-100,000 2,322 100,001-over 96
Totals 9,794
TOP 20 LARGEST SECURITYHOLDINGS
Holder Name Number of securities
% issued securities
CALCULATOR AUSTRALIA PTY LIMITED <CALCULATOR AUSTRALIA A/C> 144,888,962 32.569 CALCULATOR AUSTRALIA PTY LIMITED <CALCULATOR AUSTRALIA A/C> 39,710,478 8.926 J P MORGAN NOMINEES AUSTRALIA LIMITED 35,731,683 8.032 NATIONAL NOMINEES LIMITED 26,137,497 5.875 RBC INVESTOR SERVICES AUSTRALIA NOMINEES PTY LIMITED <PI POOLED A/C> 25,119,865 5.647 HSBC CUSTODY NOMINEES (AUSTRALIA) LIMITED 18,172,358 4.085 CITICORP NOMINEES PTY LIMITED 9,823,073 2.208 CITICORP NOMINEES PTY LIMITED <COLONIAL FIRST STATE INV A/C> 8,430,088 1.895 BNP PARIBAS NOMS PTY LTD <MASTER CUST DRP> 7,418,168 1.667 RBC INVESTOR SERVICES AUSTRALIA NOMINEES PTY LIMITED <APN A/C> 7,237,875 1.627 AMP LIFE LIMITED 6,660,074 1.497 RBC INVESTOR SERVICES AUSTRALIA NOMINEES PTY LIMITED <PIIC A/C> 4,204,427 0.945 JP MORGAN NOMINEES AUSTRALIA LIMITED <CASH INCOME A/C> 3,938,368 0.885 AUSTRALIAN EXECUTOR TRUSTEES LIMITED <NO 1 ACCOUNT> 3,004,853 0.675 EQUITY TRUSTEES LIMITED <EQT SGH PROPERTY INC FUND> 2,346,193 0.527 BNP PARIBAS NOMS PTY LTD <SMP ACCOUNTS DRP> 2,171,501 0.488 NAVIGATOR AUSTRALIA LTD <MLC INVESTMENT SETT A/C> 1,810,804 0.407 BNP PARIBAS NOMS PTY LTD <DRP> 1,717,492 0.386 NULIS NOMINEES (AUSTRALIA) LIMITED <NAVIGATOR MAST PLAN SETT A/C> 1,359,717 0.306 PLUTEUS (NO 164) PTY LIMITED 1,102,341 0.248
For
per
sona
l use
onl
y