aaptp project 05-02: fuel resistant sealers and … · hma airfield pavements airfield asphalt...
TRANSCRIPT

AAPTP Project 05-02: Fuel Resistant Sealers and Binders for HMA Airfield Pavements
Airfield Asphalt Pavement Technology Program (AAPTP)
FINAL REPORT
Submitted by:
Douglas I. Hanson AMEC Earth and Environmental
Dr. Robert E. Boyer
Airport Pavement Consultant
Dr. Gayle King GHK, Inc
Atish Nadkarni
AMEC Earth and Environmental
April 30, 2009

i.
ACKNOWLEDGEMENT OF SPONSORSHIP
This report has been prepared under the Airport Asphalt Pavement Technology Program (AAPTP). Funding is provided by the Federal Aviation Administration (FAA) Cooperative Agreement Number 04-G-038. Dr. David Brill is the Contracting Officer’s Technical Representative and a Program Manager in FAA Technology R & D Branch at the William J. Hughes Technical Center. Mr. Monte Symons served as the Project Director for this project. The AAPTP and the FAA thank the Project Technical Panel that willingly gave of their expertise and time for the development of this report. They were responsible for the oversight and the technical direction. The names of the individuals on the Technical Panel are as follows:
1. David Brill 2. David Hein 3. Jack Youcheff 4. Michael Moore
DISCLAIMER The contents of this report reflect the views of the authors, who are responsible for the facts and the accuracy of the data presented within. The contents do not necessarily reflect the official views and policies of the Federal Aviation Administration. The report does not constitute a standard, specification or regulation. Neither the authors not the United States Government endorse products or manufacturers. Company or equipment manufacturer’s names appear herein only because they are considered essential to the purpose of the report. ACKOWLEDGMENTS The authors would like to thank Mike Wood and Atish Nadkarni who did all the laboratory testing associated with this project. Without their efforts and professional work in the lab this report would not be possible.

ii
TABLE OF CONTENTS
ITEM DESCRIPTION Acknowledgement of Sponsorship i Disclaimer i Acknowledgements i Table of Contents ii List of Figures v List of Tables vii Abstract ix Summary of Findings x Chapter 1 Project Introduction 1.1 Problem Statement 1 1.2 Objectives 2 1.3 Research Approach 2
1.4 Research Products 3 References – Chapter 1 Chapter 2 State of the Practice 2.1 Fuel Resistant Products 5 2.2 Fuel Resistant Sealers 6 2.2.1 Surface Treatment Products 2.2.2 Observation/Performance of Non Coal-Tar Fuel Resistant Sealers 2.2.3 Test Procedures for Fuel Resistant Sealers
2.3 Fuel Resistant HMA Systems 26 2.3.1 Products Used to Manufacture Fuel Resistant HMA Mixes 2.3.2 Summary of Research Studies on Fuel Resistant HMA Mixes 2.3.3 Observation/Performance of Fuel Resistant Binder/HMA Systems 2.3.4 Test Procedures for Evaluation of Fuel Resistant Mixes
2.4 Conclusions 38 References - Chapter Two 40

iii
Chapter 3.0 Evaluation of Test Methods for Fuel Resistant Sealers
3.1 Initial Investigation of Laboratory Procedures for Evaluation of Sealers 42 3.1.1 Modulus/Stiffness Testing 3.1.2 Abrasion Testing
3.1.3 Ceramic Tile Sealer Adhesion Test 3.1.4 Laboratory Fuel Infiltration Test
3.2 Further Study and Refinement of Selected Laboratory Procedures 65
3.2.1 Ceramic Tile Sealer Adhesion Test 3.2.2 Laboratory Fuel Permeability Test 3.2.3 Laboratory Fuel Infiltration Test 3.2.4 Rapid Field Fuel Infiltration Test
3.3 Discussion of Sealer Test Procedures and Results 83 3.3.1 Initial Evaluation of Proposed Test Procedures 3.3.2 Final Evaluation of Promising Test Procedures
3.4 Conclusions and Recommendations 88
References – Chapter 3 4.0 EVALUATION OF TEST METHODS FOR FUEL RESISTANT MIXES
4.1 Introduction and Test Plan 90
4.2 Aggregate and Asphalt Materials Used 93 4.2.1 Aggregates 4.2.2 Asphalt Binders 4.2.3 Hot Mix Asphalt Mixture
4.3 Test Results 98
4.3.1 Aggregate Gradation, Air Voids and Binder Study 4.3.2 Evaluation of Aggregate Type on Fuel Resistance of an
HMA Mixture 4.3.3 Evaluation of Kerosene versus Jet Fuel
4.4 Statistical Analysis of Results 103 4.4.1 Description of Statistical Procedures Used 4.4.2 Effect of Aggregate Gradation 4.4.3 Influence of Air Voids 4.4.4 Influence of Binder 4.4.5 Influence of Aggregate Type 4.4.6 Influence of Different Solvent on Fuel Resistance

iv
4.5 Conclusions 114 APPENDIX A – A1 Guide Specification for Application of Non-Coal Tar Fuel Resistant Sealers APPENDIX B – B1 Test Procedure for Evaluation the Quality of a Fuel Resistant Sealer APPENDIX C – C1 Test Procedures for Evaluation of the Fuel Resistance of a Hot Mix Asphalt (HMA) Mixture

v
LIST OF FIGURES
Chapter 2
Figure 2-1 LAS-320 Application, TWM, McDill AFB, FL, 2003 Figure 2-2 Typical Parking Lot Application, LAS-320 Sealer, New York. Figure 2-3 CarbonPlex Application, Apron, Columbia Airport, SC, 2007. Figure 2-4 CarbonPlex Sealer Demonstration Section, October 2007. Figure 2-5 Jet Fuel Stain on CarbonPlex Seal Coat, After Six Months. Figure 2-6 Rubber Tire Tracks from USAF C-17 High Performance Turn Figure 2-7 Simulated Petroleum Spills on CarbonPlex Seal Coat. Figure 2-8 University Oxford Airport, Oxford, MS. Figure 2-9 University Oxford GA Apron, Westward Look. Figure 2-10 University Oxford GA Apron, Eastward Look. Figure 2-11 Close-up of Block Crack Condition. Figure 2-12 Tupelo Regional Airport, Tupelo, MS Figure 2-13 E-Krete on East End of Main Taxiway, Tupelo Regional. Figure 2-14 E-Krete on GA Storage and Refueling Area, Tupelo Regional Figure 2-15 Corinth-Alcorn County Airport, Corinth, MS Figure 2-16 Corinth-Alcorn County Airport, Apron Looking North Figure 2-17 Corinth-Alcorn County Airport, Apron and Hangar Figure 2-18 DSR Dynamic Creep Setup Figure 2-19 Set-ups for Abrasion Test with Pneumatic Tube. Figure 2-20 Set up for Wet-Track Abrasion Test Figure 2-21 Fuel Soaked Neat Binder/HMA Specimen. Figure 2-22 Fuel Soaked StellaFlex Fuel Resistant Binder/HMA Specimen Figure 2-23 Completed Alleyway B-C Project, Boston Logan, and November 2006. Figure 2-24 View of Alley B-C Pavement, BLIAP, and November 2006 Figure 2-25 Close-Up of Surface Texture of the Item P-401 FR, November 2006. Figure 2-26 FDOT Agricultural Inspection Station SP FR 12.5 mm (fine). Figure 2-27 Petroleum Contaminates on the SP FR 12.5 mm (fine).
Chapter 3 Figure 3-1 LAS 320 Figure 3-2 Coal Tar Figure 3-3 Setup for Abrasion Test with pneumatic tube Figure 3-4 Set-up With Wire Brush Figure 3-5 Samples after Abrasion Testing with Wire Brush Figure 3-6 Set up for Wet-Track Abrasion Test Figure 3-7 SS-1h Figure 3-8 LAS 320 Figure 3-9 Coal Tar

vi
Figure 3-10 Specimens Ready for Testing Figure 3-11 Kerosene Being Poured into the PVC pipe coupler Figure 3-12 Untreated at Five Minutes: Figure 3-13 Untreated at four hours: Figure 3-14 Coal Tar at 30 minutes: Figure 3-15 The coal tar test after four hours. Figure 3-16 LAS 320 with 0.18 gal/sy after four hours: Figure 3-17 LAS 320 with 0.18 gal/sy after four hours: Figure 3-18 LAS 320 with 0.36 gallons per sq yd. Figure 3-19 LAS 320 with 0.36 gallons per sq yd. Figure 3-20 Permeability Test Set Up Figure 3-21 Kerosene Level at One Hour Figure 3-22 Kerosene Level at Two Hours Figure 3-23 Kerosene Level at Three Hours Figure 3-24 Kerosene Level at Four Hours Figure 3-25 Samples clipped to paper clamp Figure 3-26 Samples placed in the fluid Figure 3-27 Specimens Allowed To Drain For 15 Minutes Figure 3-28 Thumb Test On TRMSS Sealer Figure 3-29 Fuel Samples after Removal Of The Test Specimens Figure 3-30 Laboratory Permeameter Used for Testing (all testing was done in a fume hood
due to the volatility of the kerosene) Figure 3-31 Layout showing all of the test specimens Figure 3-32 Layout Of Field Test Section Figure 3-33 Kitty Litter Used To Control Fuel Leakage Chapter 4 Figure 4-1 Effect of Air Voids on Soak Test Results Figure 4-2 Effect of Asphalt Binder Stiffness on Soak Loss Figure 4-3 Effect of Asphalt Binder Stiffness on Soak Loss (Aggregate Study)

vii
LIST OF TABLES Chapter 2 Table 2-1 Summary of Potential FR Products Table 2-2 Summary of CarbonPlex Test Properties [PRI, 2006] Table 2-3 Marshall Design Criteria, P-401 FR. Table 2-4 Summary of Results on Testing - Different Mixes Table 2-5 Percent Loss for Binders Table 2-6 Asphalt Properties Table 2-7 Resistance to deformation at 40oC Table 2-8 Material Acceptance Data, Alleyway B-C. Table 2-9 Material Acceptance Data, FDOT AIS Chapter 3 Table 3-1 Test Matrix Table 3-2 Results of Abrasion Testing with Pneumatic Tube Table 3-3 Results after Abrasion Testing with Wire Brush Table 3-4 Results of Laboratory Fuel Permeability Testing Table 3-5 Pooled Analysis Of Variance Of Water Permeability Samples Table 3-6 Analysis Of Variance Of Kerosene Permeability - Single-Coated Samples Table 3-7 Analysis of Variance of Kerosene Permeability - Double-Coated Samples Table 3-8 Pooled Analysis Of Variance Of Kerosene Permeability Samples Table 3-9 Laboratory Fuel Infiltration Test (Minutes) Table 3-10 Rapid Field Fuel Infiltration Test (Minutes to Failure) Table 3-11 Average Permeabilities from Laboratory Fuel Permeability Test
Excluding Run No. 2 Table 3-12 Average Permeabilities from Rapid Fuel Infiltration Test Table 3-13 Average Permeabilities from Rapid Fuel Infiltration Test Table 3-14 Ranking Fuel Resistance Chapter 4 Table 4-1 Experimental Matrix for the Soak Test Table 4-2 Experimental Matrix for Tensile Testing Table 4-3 Experimental Matrix for Soaking Fluid Comparison Study (Kerosene vs Jet Fuel) Table 4-4 Properties of Asphalt Binders Used for Air Void Study Table 4-5 Properties of Asphalt Binders Used for Aggregate Study Table 4-6 Gradation of Mixes Table 4-7 Mixture Properties Table 4-8 Aggregate and Mixture Properties Table 4-9 Results Using Logan Mix Table 4-10 Results Using P-401 ½-inch Mix Table 4-11 Results Using Sand and Gravel Table 4-12 Results Using Granite Table 4-13 Results Using Limestone Table 4-14 Results of Fuels Study

viii
Table 4-15 Example of test results Table 4-16 ANOVA Results Comparing percent Loss for Two Aggregate Gradations Table 4-17 ANOVA Results Comparing percent Loss at Three Air Void Levels Table 4-18 ANOVA Results Comparing percent Loss at Three Binder Grades Table 4-19 ANOVA Results Comparing percent Loss at Four Binder Grades (2.5% Air Voids) Table 4-20 ANOVA Results Comparing percent Loss at Three Aggregate Types (2.5% Air Voids) Table 4-21 ANOVA Results Com

ix
ABSTRACT
The overall objective of AAPTP Project 05-02 “Fuel Resistant Sealers and Binders for HMA Airfield Pavements” was to review/improve test procedures for fuel resistant materials, develop performance-based evaluation criteria and provide technical guidance with respect to the application and use of non-coal tar-based fuel-resistant pavement sealers and binders.
This report consists of three parts:
• Part 1 (Chapter 2) - The focus of this chapter is to provide background information on the use of fuel resistant materials for HMA pavements, the field performance of those materials and the test procedures that can be used to evaluate those materials.
• Part 2 (Chapter 3) – The focus of this chapter is to describe the study conducted to develop an improved procedure that could be used for the evaluation of fuel resistant sealers. The goal was to develop a laboratory test procedure that was simple and would quickly identify whether or not a sealer could be used to improve the fuel resistance of an HMA pavement surface. Based on this work it is suggested that the ceramic tile test used in this study replace the test in ASTM D4868 due to its simplicity as compared to the current D ASTM 4866 procedure.
• Part 3 (Chapter 5) - The focus of this chapter is to describe the study conducted to evaluate the effect of HMA mixture variables on the fuel resistance of an HMA mixture. Specifically the gradation of the Hot Mix Asphalt (HMA) mixture, the air voids of the HMA mixture, the asphalt binder used in that mixture and the geological source of the aggregate used on the fuel resistance of an HMA mixture were evaluated. The test results showed that the air voids and the asphalt binder used are the two primary characteristics that must be evaluated when designing and constructing a fuel resistant HMA mixture.

x
SUMMARY OF FINDINGS
Chapter 1 – Introduction
Protection of Hot Mix Asphalt (HMA) pavements from damage due to fuel spills or oil leaks has long been recognized as an important component of any airport pavement maintenance plan. Aircraft fuels, hydraulic fluids and most lubricating oils are produced by refining crude oil. Asphalt cement used in the construction of HMA pavements is also a product of the crude oil refining process. As such, jet fuel, oil, and asphalt are chemically compatible and readily mix with each other. This can cause a softening of the asphalt binder that can result in a degradation of the HMA pavement surface.
Fuel-resistant sealers are frequently applied to the surface of the HMA pavement to prevent degradation from fuel and oil spills. Since oils derived from coal are highly aromatic and less compatible with petroleum-based fuels and lubricants, commonly used sealers frequently contain coal tar as the primary binder.
Although coal tar-based sealants have proven to be highly effective in protecting asphalt pavements from damage related to fuel spills, their use has been curtailed due to two significant drawbacks:
• First, the coefficient of thermal expansion for coal tar sealants is different from that of the underlying asphalt pavement, resulting in cracking of the sealant within two to three years and the resulting need for repeated applications
• Second, coal tars contain chemicals that are known to cause mutagenic/carcinogenic
behavior in human cells. There is a concern that these chemicals may enter the nation’s water supply.
The overall objective of this AAPTP Project was to review/improve test procedures, develop performance-based evaluation criteria and provide technical guidance with respect to the application and use of non-coal tar-based pavement sealers and binders.
Chapter 2 - State of the Practice
Three products were identified as non coal-tar fuel resistant sealers that have been used on airfield pavements:
• Enviroseal LAS-320 - LAS-320 is marketed by Enviroseal Corporation, Port St. Lucie, FL. The LAS-320 material is identified as a proprietary polymeric inorganic acrylic co-polymer with two percent carbon black. The sealer is classified as a non-hazardous material by the U.S. Environmental Protection Agency.
• Blacklidge CarbonPlex - CarbonPlex is marketed by Blacklidge Emulsions, Inc., Gulfport, MS. The CarbonPlex material is identified as a proprietary mineral reinforced
xi
inorganic polymer containing less than 70 percent petroleum asphalt, less than one percent surfactant [CAS # 3052-42-4], less than 25 percent proprietary organic polymer mixture, and less than 50 percent proprietary inorganic filler.
• E-Krete - E-Krete is marketed by Polycon, Inc., Madison, MS. The E-Krete material employs polymer composite micro-overlay (PCMO) technology in its application of polymer concretes over paving surfaces, particularly asphalt pavements. The PCMOs are polymer-modified concretes containing latex or dry polymer, Portland cement (or other types of hydraulic cements), and proprietary additives (pozzolans, plasticizers, air-entraining agents, etc.). The E-Krete product is designed to provide a durable wearing surface that is abrasion and fuel-resistant.
Two products that have been used to manufacture fuel resistant HMA pavements were identified:
• StellaFlex FR - much of the literature on this product will identify it as CITGOFlex. The company marketing this product changed hands in the spring of 2008 and changed the name of the product. It is manufactured by NuStar Energy.
• ROSPHALT FR is manufactured by Royston Laboratories which is a Division of Chase Corporation.
Sites were visited where each of the products listed above was used to determine their field performance. It was found that each of the products is performing satisfactorily.
Chapter 3 – Evaluation of Test Procedures for Fuel Resistant Sealers
The current procedure for the evaluation of fuel-resistant sealer is to use ASTM Test Procedures: ASTM D2939 “Standardized Test Methods for Emulsified Bitumens Used as Protective Coatings” and ASTM D4866 “Coal Tar Pavement Sealers”. The first test procedure covers general test procedures for an emulsified bitumen (asphalt cement or coal tar) when used as a sealer and the second procedure uses a test procedure that consists of coating a ceramic tile and evaluating the resistance of the coating to being soaked in kerosene.
This study evaluated other tests for possible use for determining the effectiveness of a proposed fuel resistant sealer. These included:
• Dynamic Shear Rheometer (DSR) Torsion Bar Test and the Bending Beam Rheometer (BBR). Both of these tests require that the top layer (12 mm) of a laboratory or field specimen be sliced off of core. It was found that the thin surface of a fuel soaked specimen would not remain intact so that the test could be conducted.
• Abrasion Testing. Foreign Object Damage (FOD) is an important area of concern to airport managers. Because aggregate loosened by fuel damage can be detrimental to aircraft, it was decided to evaluate possible abrasion tests that can simulate fuel-damaged raveling mixes. Three different abrasion tests were evaluated. The first two used a 150 mm diameter gyratory specimen that was treated with a sealer. Then the surface was abraded with either a pneumatic tube or a steel brush that had been mounted in a Hobart mixer. The third abrasion test evaluated was a modification of the
xii
International Slurry Seal Association Wet Track Abrasion test. The test results from these did not show sufficient differentiation between sealers (fuel resistant vs. non fuel resistant) that they could be used as a standardized test procedure.
• Ceramic Tile Soak Test. A variation of the ASTM D4866 was evaluated. The ASTM test procedure contains very specific details on how the tile is to be coated and the kerosene applied. It was decided in this research to further evaluate and refine the procedure. The results showed that this simple test could be used to determine if a material was fuel resistant.
• Permeability. If one of the purposes of the sealer is to prevent aviation fuel from entering an HMA surface it would appear that a laboratory and/or a field permeability test might be a method for evaluating the effectiveness of a sealer. Three variations of the permeability test were evaluated.
o The first was the laboratory permeability device developed by the Florida DOT (Test Procedure ASTM Standard PS129-01). The test procedure requires that the sample be sealed with a membrane. The standard membrane will dissolve is kerosene. Therefore, a nitrile membrane was obtained and used.
o The second test consisted of using silicone to seal a two-inch diameter PVC pipe coupler to the surface of a laboratory-produced specimen that had been sealed with a prospective sealer. The PVC pipe coupler was filled with kerosene and the specimen was observed to see if the kerosene would penetrate through the sealer.
o The third test was a variation of the second test. It was conducted on an HMA pavement surface rather than a core to establish an in-place field test..
All the permeability tests ranked each of the sealant materials tested in the same order. But, they all had a great deal of variability in the test results. Thus, the conclusion of this study is shows that the first test does not show promise for use as a purchase test for fuel resistant sealers. But, the second and third test do show some promise for use by an airport engineer or manager for evaluating the use of a particular product on his airfield.
Chapter 4 - Evaluation of Test Procedures for Fuel Resistant Mixes
Based on the literature review, the research team established four questions that needed to be answered with regard to the fuel resistance of an HMA mixture. Each of these questions is presented below along with the research approach for developing the answers to the questions.
• Does aggregate gradation have a significant effect on the fuel resistance of an HMA mixture? A typical P401 mix was compared to a similar mix with a fine gradation.
• Do changes in air voids have a significant affect on the fuel resistance of an HMA mixture? Specimens were evaluated at air void levels of 2.5%, 5.0% and 7.5%.
• Does binder grade (as measured using the Superpave grading system) have a significant effect on the fuel resistance of an HMA mixture? Specimens were evaluated with PG 64-22, PG 76-28, PG 82-22 and a “StellarFlex FR” binder grades.
• Does aggregate type have a significant effect on the fuel resistance of an HMA mixture? Specimens were evaluated using three aggregate sources.

xiii
The literature review had identified that the fuel resistance of an HMA mixture could be evaluated by manufacturing a Superpave specimen that is soaked in kerosene for 24 hours and determining the amount of weight loss. The previous studies established a minimum acceptable criterion of five percent loss after soaking in kerosene and that criterion was adopted for this study. The research team also evaluated the use of the tensile splitting test for the determination of the fuel resistance of an HMA mixture. Overall summary The following presents a summary of the overall results of the study of fuel resistance mixes:
• Aggregate gradation – It was concluded that, for the two gradations used in this study the aggregate gradation did not have an effect on the fuel resistance of an HMA mixture.
• Air voids - It was determined, based on the results of the soak tests that the soak test results (i.e. the percent Loss values) decrease as the air voids decrease. This means that irrespective of the type of binder and the aggregate gradation, the fuel resistance increases with a decrease in the air voids.
• Binder grade - It was found that the grade of the asphalt binder (as measured by the high temperature stiffness) has a significant effect on the fuel resistance of an HMA mixture. In general the stiffer the binder (as measured by the Dynamic Shear Rheometer) the higher the fuel resistance of the mixture.
• Aggregate type - There was no significant difference between the percent loss values from the soak test irrespective of the type of aggregate for the higher PG grade binders. It was seen that for lower PG grade binders, the percent loss values were significantly dependent on the type of aggregate.

1
CHAPTER 1 INTRODUCTION
1.1 PROBLEM STATEMENT
Protection of HMA pavements from the damage associated with fuel spills or oil leaks has long been recognized as an important component of any airport pavement maintenance plan. Aircraft fuels, hydraulic fluids and most lubricating oils are produced by refining crude oil. Asphalt cement used in the construction of Hot Mix Asphalt (HMA) pavements is also a product of the crude oil refining process. As such, jet fuel, oil, and asphalt are chemically compatible and readily mix with each other, resulting in a softening of the asphalt that commonly leads to degradation of the pavement surface via the following distress modes:
• Raveling, resulting in the generation of loose aggregate particles that could cause Foreign Object Damage (FOD)
• Rutting and shoving due to loss of mixture modulus • Stripping of the asphalt cement from the aggregate which results in loss of surface
friction (flushing), potholes, and other forms of accelerated pavement damage.
Fuel-resistant sealers are frequently applied to the surface of the pavement to prevent degradation from fuel and oil spills. Since oils derived from coal are highly aromatic and less compatible with petroleum-based fuels and lubricants, many fuel-resistant sealers contain coal tar as the primary binder. Although coal tar-based sealants have proven to be highly effective in protecting HMA pavements from damage related to fuel spills, their use has been curtailed due to two significant drawbacks:
• The coefficient of thermal expansion for coal tar sealants is different from that of the underlying HMA pavement, resulting in cracking of the sealant within two to three years and the resulting need for repeated applications.
• Coal tar contains significant amounts of polycyclic aromatic hydrocarbons (PAHs) known to cause mutagenic/carcinogenic behavior in human cells1,2. Three possible environmental issues raise concern:
o Direct skin contact can create health hazards for workers when PAHs are absorbed through the skin during product application.
o Surface run-off water may contain dissolved PAHs. o When airfield pavements are hot-recycled, the coal tar contaminated recycled
asphalt pavement (RAP) might cause HMA plant and laydown crews to be exposed to fumes which contain PAHs.
The issues regarding PAH concentrations in run-off water are controversial, as evidenced by studies in the city of Austin, Texas. Initial results of a scientific study identified coal tar-based sealers as the origin for approximately 90 percent of PAHs in local streams and lakes, resulting in a local ban of use of coal tar sealers. Other studies refuted some of these leachate findings, and the local ban was reportedly lifted. California has also placed some bans on use of coal tar products, and discussion is ongoing. The coal-tar industry argues that bans such as enacted by Austin are premature2.

2
Although conventional asphalt cements are highly susceptible to softening when exposed to aircraft fuels or oils, the addition of certain polymer modifiers can dramatically increase the strength and durability of the resulting modified binders, even in the presence of lighter petroleum fractions. Given such advancements in materials, suppliers now can offer two separate options for addressing airfield needs. Fuel-resistant polymers can be included in formulations for typical emulsion sealer products, or a polymer-modified binder can be used to create a thin HMA surface layer with built-in fuel resistance. Hence, environmental concerns and thermal expansion limitations can be overcome, so long as fuel-resistance standards and other performance requirements can be met at a reasonable cost.
Although the industry has recognized the need for alternate sealants having suitable fuel-resistant properties; an economical alternative to coal tar has proven elusive. A number of epoxy and acrylic based resins (such as LAS 320 which was tested in this study) have been developed and utilized alone and in combination with asphalt with some success in airport environments.
1.2 OBJECTIVE
The Project 05-02 Request for Proposal provided the following statement of the project objective:
The objective of this study is to develop technical guidance and recommended evaluation tests and procedures for sealers and binders that are resistant to damage which is primarily caused by repetitive small spills of aircraft fuels. It is not the intent to evaluate and endorse specific products in this research. The project shall use categorized groups of existing products by function and/or materials chemistry or properties as the primary basis recommendations. Sealer and binders (mostly polymer modified asphalt) shall be addressed separately. The project includes both a field element and a laboratory performance element. The field performance element shall consist of gathering performance histories of selected product categories to be correlated with results from recommended test protocols. The laboratory element shall consist of developing test protocols to evaluate a material’s resistance to damage and establishing limits that are consistent with observed field performance results.
1.3 RESEARCH APPROACH
To meet the objectives of this fuel resistant sealer/binder study, the following activities were accomplished:
1. Review existing literature on fuel-resistant binders and sealers and corresponding test methods to evaluate resistance to fuel spillages.
2. Collect field performance and product usage data. 3. Conduct preliminary laboratory testing to develop and assess possible test
procedures for the evaluation of fuel resistant sealers and binders. 4. Conduct a detailed laboratory study after review and approval by the AAPTP
Technical Panel. 5. Develop draft advisory specifications for possible FAA adoption in FAA format for
possible use by the FAA.
3
1.4 Research Products
As a of this research project the following products were developed (they are presented as Appendixes to this report):
• A Guide Specification for Application of Non-Coal Tar Fuel Resistant Sealers
• A Test Procedure for the Evaluation of a Fuel Resistant Sealer
• A Test Procedure for the Evaluation of the Fuel Resistance of an Hot Mix Asphalt (HMA) Mixture
Note to reader – this report contains a number of photos which are clear in color – but may be difficult to review if the report is printed in black and white.

4
REFERENCES – CHAPTER ONE
1. “Austin Bans Use of Coal Tar Emulsions – First in Nation” News release October 2005
2. Cheryl Hogue “Dustup Over Pavement Coatings” Chemical and Engineering News, Volume 85, February 2007

5
CHAPTER 2 STATE OF THE PRACTICE The initial effort of this investigation focused on a review of literature to identify, exclusive of coal-tar materials, the fuel resistant (FR) product applications and construction procedures, used for HMA airport pavements, including an extensive world-wide web search. To supplement the literature review, interviews with industry representatives in the manufacture, distribution and/or construction of potential FR applications were accomplished, and additional interviews were conducted with each FAA regional engineer and members of the US Government Tri-service Pavement Group to determine what products were being used as fuel-resistant sealers and/or binder systems.
2.1 FUEL RESISTANT PRODUCTS
Based on the information gathered, it was clear that the “state of the practice” for fuel-resistant materials lies almost exclusively with proprietary products with the majority being derived from a coal tar base. This is unfortunate because the suppliers of these products tend to be secretive about their actual ingredients. However, from the list of potential sealer products and binder systems, the respective Material Safety Data Sheets (MSDS) were used as the basis to determine if the products and/or systems, contained coal tar, or other hazardous chemicals. In accordance with the 1983 OSHA Hazard Communication Standard [29 CFR Part 1910], each MSDS is required to identify (product name) used on the label, and chemical and common name(s) of ingredients which have been determined to be health hazards, and which comprise 1 percent or greater of composition, except carcinogens shall be listed if the concentrations are 0.1 percent or greater. After screening the respective MSDS, Table 2-1 presents a summary of the potential FR products, exclusive of coal tar, grouped into the two categories as (1) surface treatment applications that were further subdivided into liquids and emulsions; and (2) modified binders that were employed in combination with a HMA system application. Subsequently, the material data sheets were reviewed to determine if the product supplier had a claim for fuel resistance. The selection for the potential FR product list was derived from this final screening process.

6
Table 2-1 – Summary of Potential Fuel Resistant Products
Manufacturer Product Description FR Claimed Surface Treatment - Liquids
Tricor Refinery Reclamite Petroleum Maltene Rejuvenator No Enviroseal Corporation LAS-320 Liquid Asphalt Seal (LAS) Yes Polymeric Blacklidge Emulsions Carbon-Plex Mineral Reinforced Inorganic Yes
Polymer with <70 percent Asphalt
Mariani Asphalt APR Asphalt Pavement Rejuvenator No
Surface Treatment - Emulsions Tricor Refinery CRF Restorative Sand/Emulsion No Sealer Asphalt Systems GSB-88 Gilsonite Resin Polymer No Emulsion The Brewer Company Gold Premium Polymer Modified Emulsion No Resurfacer Blacklidge Emulsions LD-7 Polymer Modified Emulsion No Polycon Systems E-Krete Two-Component Polymer Yes Resin Emulsion
Modified Binder/HMA Systems Citgo Refining Company Stellaflex FR PG 88-22/12.5 mm SP/ Yes 2 1/2 percent Air Voids Chase Corporation Rosphalt HMA with Thermoplastic Yes Polymeric Binder Additive
2.2 FUEL RESISTANT SEALERS
The AMEC research team identified three products that have been documented as a non coal-tar fuel resistant sealer.
2.2.1 Surface Treatment Products
Enviroseal LAS-320.
LAS-320 sealer is marketed by Enviroseal Corporation, Port St. Lucie, FL. The LAS-320 material is identified as a proprietary polymeric inorganic acrylic co-polymer with two percent carbon black. The sealer is classified as a non hazardous material by the U.S. Environmental Protection Agency1. According to the manufacturer, the product is non-toxic, non-flammable, and environmentally safe. The LAS-320 material was developed for use on asphalt pavement

7
surfaces, including airport aprons, fuel storage areas, parking lots and private driveways. The LAS-320 performs as a sealer by forming a molecular bond with the oxidized asphalt surface and penetrates distressed areas, such as cracks and raveled areas. The material renders the surface impervious to water, petroleum products, and most common chemicals.
Prior to application, the surface area should be thoroughly cleaned by air blowing, sweeping, or pressure washing. Areas contaminated by petroleum product deposits, or other common chemicals, should be thoroughly cleaned using a detergent and rinsed with high pressure water. The area to be treated should be dry and clean prior to application. For low severity raveling distress, a mix of coarse sand and LAS-320 can be applied as a slurry. Where medium to high severity raveling distress has occurred, permanent pothole type patching procedures should be employed prior to application of the LAS-320 sealer.
The LAS-320 is normally applied with an asphalt distributor as a spray operation, but may be applied by pouring the product on the surface and spreading with a push-type broom. The recommended application rates are 0.05 to 0.12 gallons per square yard depending on the condition of the pavement surface. As with other asphalt sealer products, the cure time is dependent on the environmental conditions [temperature and humidity] at the time of application. To insure stability, the material should not be applied when rainfall is expected within two hours. The material can be applied at ambient temperature between 50 to 1300F and will cure to light traffic within one hour, and under these conditions the pavement can receive the normal vehicular traffic. There has been no evidence of the material tracking after a full 24- hour cure period.
Blacklidge CarbonPlex.
CarbonPlex is marketed by Blacklidge Emulsions, Inc., Gulfport, MS. CarbonPlex is identified as a proprietary mineral reinforced inorganic polymer containing less than 70 percent petroleum asphalt, less than one percent surfactant [CAS # 3052-42-4], less than 25 percent proprietary organic polymer mixture, and less than 50 percent proprietary inorganic filler2. CarbonPlex was developed for use on asphalt surfaces, including airport aprons, fuel storage areas, parking lots and private driveways. CarbonPlex performs as a sealer with a high adhesive bond with asphalt surface and penetrates distressed areas, such as cracks and raveled surfaces. The material renders the surface impervious to water, petroleum products, and most common chemicals.
Prior to application, the surface area should be thoroughly cleaned by air blowing, sweeping, or pressure washing. Areas contaminated by petroleum product deposits, or other common chemicals, should be thoroughly cleaned using a detergent and rinsed with high pressure water, and the area to be treated should be dry and clean prior to application.
CarbonPlex is normally applied with an asphalt distributor as a spray operation. The manufacturer recommends a single application rate of 0.08 to 0.12 gallons per square yard for light traffic; with a second application for normal traffic; and a third application for heavy traffic and airport apron pavements. As with other asphalt sealer products, the cure time is dependent on the environmental conditions (temperature and humidity) at the time of application. To insure stability, the material should not be applied when rainfall is expected within two hours. The material can be applied at ambient temperatures between 50 to 1300F.

8
Polycon E-Krete.
E-Krete is marketed by Polycon, Inc., Madison, MS. E-Krete employs polymer composite micro-overlay (PCMO) technology in its application of polymer concretes over paved surfaces, particularly asphalt pavements. The PCMOs are polymer-modified concretes containing latex or dry polymer, Portland cement (or other types of hydraulic cements), and proprietary additives (pozzolans, plasticizers, air-entraining agents, etc.). The E-Krete product is designed to provide a durable wearing surface that is abrasion and fuel-resistant.
Prior to application, the surface area should be thoroughly cleaned by air blowing, sweeping, or pressure washing. Areas contaminated by petroleum product deposits, or other common chemicals, should be thoroughly cleaned using a detergent and rinsed with high pressure water, and the area to be treated should be dry and clean prior to application.
The E-Krete is applied to the pavement surface in a manner similar to asphalt slurry seals, or it may be applied using a flooding/squeegee/brush applicator, which can be followed by an aggregate chip layer, if desired. The thickness normally ranges from 0.0625 to 0.25 inch (1.5 to 6.0 mm) depending on aggregate size and number of applications. The thickness can vary, depending on the formulation and number of coats. Depending upon formulation, the resistance of E-Krete to different chemicals or physical effects may vary significantly. A surface sealer (either solvent or water-based) may be applied to E-Krete to enhance the fuel/oil/chemical resistance in areas where an additional level of protection is warranted, such as aircraft parking areas or parking garages.
2.2.2 Observation/Performance of Non Coal-Tar Fuel Resistant Sealers
Enviroseal LAS-320
The first documented performance characteristics LAS-320 was from a test section placed at the U.S. Army Engineer Research and Development Center [ERDC], Vicksburg, MS, in 2000, as part of the U.S. Air Force Study on “Rejuvenators, Rejuvenator/Sealers and Seal Coats for Airfield Pavements3.” The LAS-320 test section at ERDC was placed to evaluate the manufacturer’s claim that it was fuel resistant. The material was applied at 0.058 gal/sy. The test section was subjected to the Pavement Coating Technology Center [PCTC] fuel-resistance test method4 which requires applying a 6.0-inch diameter metal pipe to the pavement with a silicon sealant; adding gasoline to a depth of 1.0-inch; and the penetration of gasoline is evaluated through depth measurements at 15 and 30 minutes. The LAS-320 material test section passed the PCTC fuel-resistance test. Evaluation of the long-term performance of the LAS-320 was not possible because the study was cancelled after one year due to wartime funding priorities. In slightly more than one year, the sealer retained a uniform black appearance with no noticeable defects. In the event skid resistance is important, the report recommends that a sand-sized aggregate be spread on the treated surface immediately after application to combat reduced skid properties.
In 2003, a test section was placed on Taxiway M at McDill Air Force Base, Florida, as shown in Figure 2-1. There was no record of performance and the condition of the test section was not observed during this investigation.

9
Figure 2-1– LAS-320 Application, TWM, McDill AFB, FL, 2003
LAS-320 has been produced by the Enviroseal Corporation since 2000, and is marketed through Enviroseal distributors in the U.S. and foreign countries. Because of this purchase arrangement, it was difficult to track material applications to specific projects for determination of performance results. A typical parking lot application with LAS-320 was provided by the manufacturer and is depicted in Figure 2-2. Interviews relative to the typical parking lot applications were conducted on two airports in the State of New York, where coal-tar sealers have been banned. They expressed satisfaction with the use of the LAS-320 in lieu of the coal-tar sealers. Their experience was of short duration without observation for long-term performance. The Airport Authority at St. Croix Inland, U.S. Virgin Islands, recently purchased LAS-320 for application on the apron pavement, but the material has not been placed to date.

10
Figure 2-2 Typical Parking Lot Application, LAS-320 Sealer, New York
Blacklidge Carbonplex
Blacklidge Emulsions initiated development of CarbonPlex in 2005 and introduced it in early 2006. In July 2006, tests were accomplished by PRI Asphalt Technologies to certify a sample of the material to be fuel resistant in accordance with provisions of ASTM D 29395 and a second test to certify the fuel resistance in accordance with ASTM D2939 was done by Momentum Laboratory in August 20076. A summary of the 2006 testing results are provided in Table 2-2.
In April 2007, a CarbonPlex demonstration section was constructed on the east apron at the Columbia Municipal Airport, West Columbia, SC. The pavement surface was highly oxidized and exhibited brittle characteristics with moderate block cracking distress. Since the demonstration section was a cooperative effort between Blacklidge Emulsions and the SC Aeronautics Office, there was no funding or plans for formal testing and/or evaluation. The CarbonPlex was placed in three coats of 0.10 gal/sy each. Figure 2-3 shows the final coat being placed on the apron pavement in April 2007.

11
Table 2-2 – Summary of CarbonPlex Test Properties [PRI, 2006].
Property Spec Requirement Test Result
Drying time, hrs 8.0 hrs. max 7.0 hrs
Resistance to heat @ 80 C No blistering sag or slipping Pass
Adhesion & Resistance to Kerosene
No penetration or loss of adhesion
Pass
Adhesion & Resistance to Water
No loss of adhesion or tendency not to emulsify
Pass
Flexibility @ 73.4 F No flaking, cracking or loss of adhesion
Pass
Resistance to Impact No flaking or loss of adhesion >¼” impact area.
Pass
Figure 2-3 – CarbonPlex Application, Apron, Columbia Airport, SC, 2007.
Figure 2-4 shows a demonstration section during a site visit approximately six months after placement (October, 2007).

12
Figure 2-4 – CarbonPlex Sealer Demonstration Section, October 2007
Other observations/performance characteristics noted during the site visit include:
• Jet fuel was poured on the CarbonPlex surface several hours after the final application, and Figure 2-5 shows the discoloration of the surface six months later, but no evidence of penetration of the pavement surface and no raveling distress. The light spot was caused by attempting to dislodge aggregate with a hammer and chisel.
• About three months after placement of the CarbonPlex sealer, a U.S. Air Force C-17 jet transport aircraft [280,000 pounds] made a high performance turn [very tight, power on, breaking turn] on the demonstration CarbonPlex section. Figure 2-6 shows the visible rubber tire marks approximately three months later. CarbonPlex displayed excellent resistance to wear after exposure to the high shear stress imparted by the C-17 maneuver.
• During the site visit, both jet fuel and aviation oil were poured on the pavement surface for a quick observation/performance determination of the effectiveness of the CarbonPlex Sealer. After several hours, Figure 2-7 shows that neither the jet fuel nor the aviation fuel had made any visible penetration of the CarbonPlex.

13
Figure 2-5 – Jet Fuel Stain on CarbonPlex Seal Coat, After Six Months.
Figure 2-6 – Rubber Tire Tracks from USAF C-17 High Performance Turn.

14
Figure 2-7 - Simulated Petroleum Spills on CarbonPlex Seal Coat.
The SC Department of Aeronautic expressed satisfaction with the CarbonPlex material and used the product for a project at the Summerville Airport, SC, in 2008.
Polycon E-Krete
University Oxford Airport - The University Oxford Airport is located adjacent to the University of Mississippi Campus in Oxford, MS. The Rayner Terminal at the airport is shown in Figure 2-8.
Figure 2-8 – University Oxford Airport, Oxford, MS.
15
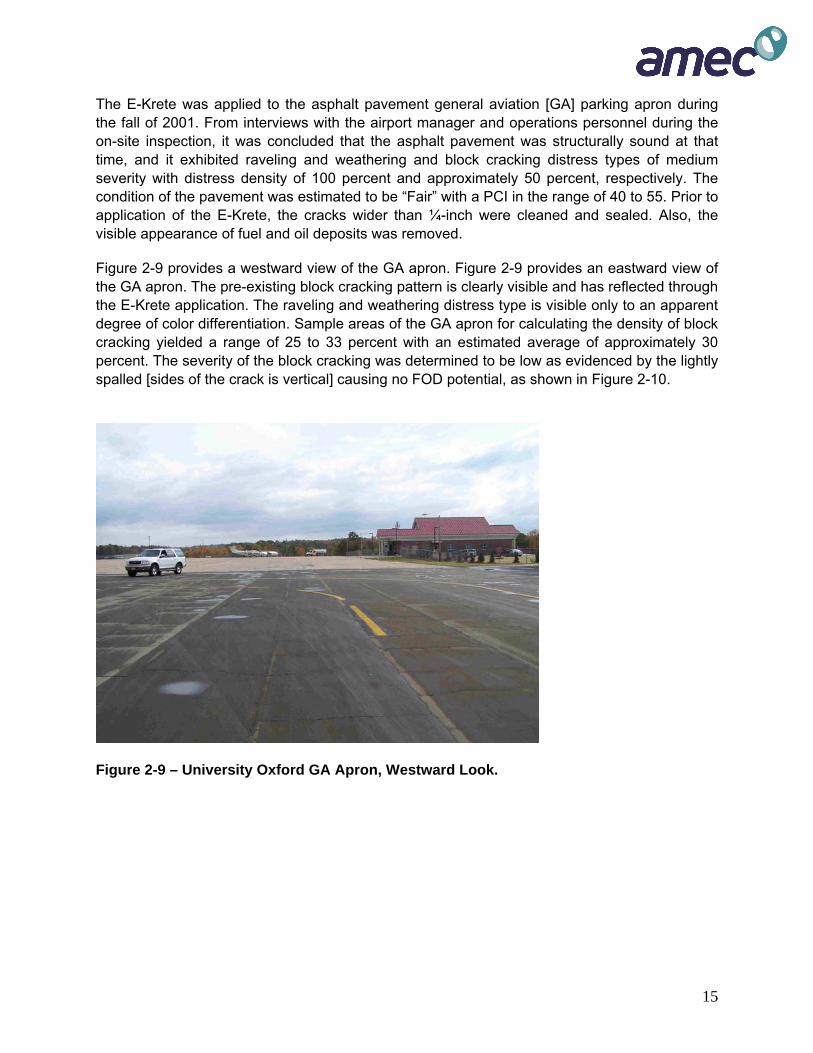
The E-Krete was applied to the asphalt pavement general aviation [GA] parking apron during the fall of 2001. From interviews with the airport manager and operations personnel during the on-site inspection, it was concluded that the asphalt pavement was structurally sound at that time, and it exhibited raveling and weathering and block cracking distress types of medium severity with distress density of 100 percent and approximately 50 percent, respectively. The condition of the pavement was estimated to be “Fair” with a PCI in the range of 40 to 55. Prior to application of the E-Krete, the cracks wider than ¼-inch were cleaned and sealed. Also, the visible appearance of fuel and oil deposits was removed.
Figure 2-9 provides a westward view of the GA apron. Figure 2-9 provides an eastward view of the GA apron. The pre-existing block cracking pattern is clearly visible and has reflected through the E-Krete application. The raveling and weathering distress type is visible only to an apparent degree of color differentiation. Sample areas of the GA apron for calculating the density of block cracking yielded a range of 25 to 33 percent with an estimated average of approximately 30 percent. The severity of the block cracking was determined to be low as evidenced by the lightly spalled [sides of the crack is vertical] causing no FOD potential, as shown in Figure 2-10.
Figure 2-9 – University Oxford GA Apron, Westward Look.

16
Figure 2-10 – University Oxford GA Apron, Eastward Look.
Figure 2-11 – Close-up of Block Crack Condition.
The distress deduct value for the University Oxford Airport GA apron pavement condition is 24 which results in a PCI = 76. By the ASTM D 5340 definition, this PCI value indicates a performance of “Very Good” based on visual condition of the pavement. There were visual observations of fuel, oil and/or hydraulic fluid deposits on the surface of the apron pavement; yet, there was no evidence of damage to the E-Krete application.
17
The conclusion from this investigation is that after approximately five years of service, the E-Krete applied to the GA apron at the University Oxford Airport is performing “Very Good” and has exhibited excellent fuel-resistant characteristics.
E-Krete - Tupelo Regional Airport.
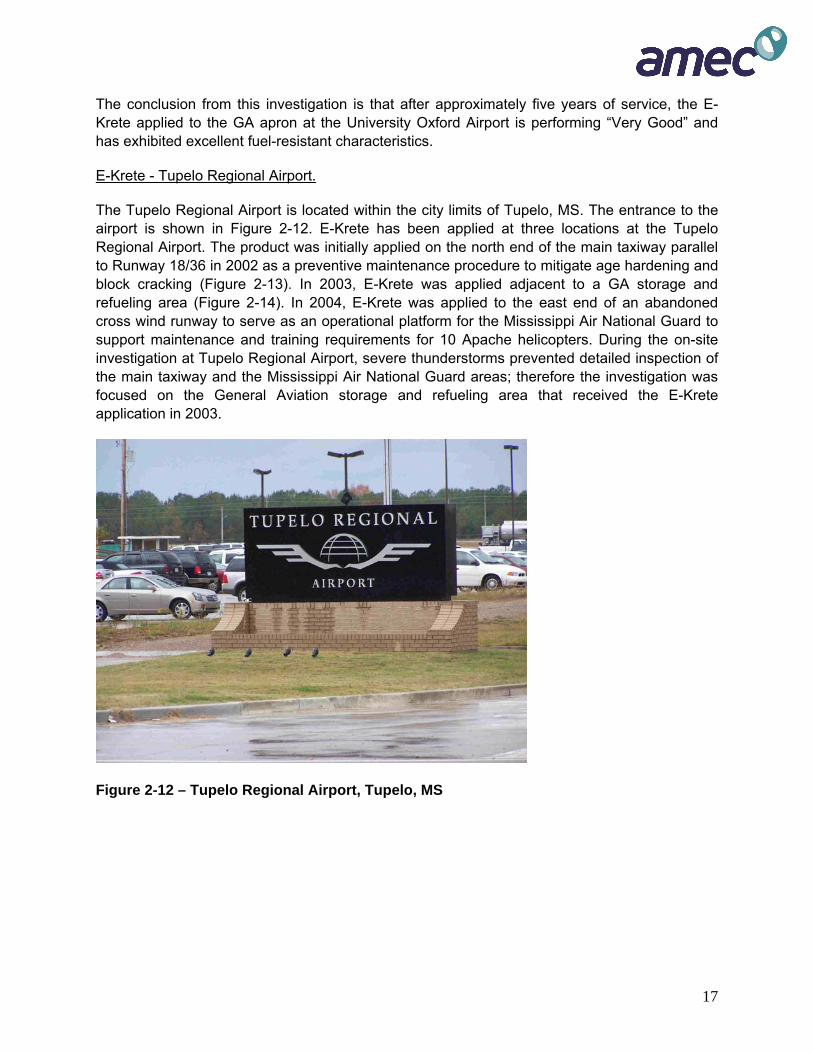
The Tupelo Regional Airport is located within the city limits of Tupelo, MS. The entrance to the airport is shown in Figure 2-12. E-Krete has been applied at three locations at the Tupelo Regional Airport. The product was initially applied on the north end of the main taxiway parallel to Runway 18/36 in 2002 as a preventive maintenance procedure to mitigate age hardening and block cracking (Figure 2-13). In 2003, E-Krete was applied adjacent to a GA storage and refueling area (Figure 2-14). In 2004, E-Krete was applied to the east end of an abandoned cross wind runway to serve as an operational platform for the Mississippi Air National Guard to support maintenance and training requirements for 10 Apache helicopters. During the on-site investigation at Tupelo Regional Airport, severe thunderstorms prevented detailed inspection of the main taxiway and the Mississippi Air National Guard areas; therefore the investigation was focused on the General Aviation storage and refueling area that received the E-Krete application in 2003.
Figure 2-12 – Tupelo Regional Airport, Tupelo, MS

18
Figure 2-13 – E-Krete on East End of Main Taxiway, Tupelo Regional.
Figure 2-14 – E-Krete on General Aviation Storage and Refueling Area, Tupelo Regional
In regard to the General Aviation (GA) storage and refueling area treated with E-Krete in 2003 is shown in Figure 2-14, the pavement on the right in the photo was a conventional Mississippi DOT HMA highway mix and the pavement on the left was the old surface treated with the E-Krete application. Both construction operations were accomplished during the summer of 2003. The area treated with the E-Krete comprises the area where GA aircraft are parked and refueled. There was no surface preparation other than sweeping operations. The spillage of

19
fuel, oil and other petroleum fluids is visible at the far end of the E-Krete treated section. The airport manager stated that the fuel and oil deposits are washed off periodically by the fire department using detergent and water, and there has been no damage to the E-Krete surface.
The HMA pavement is structurally sound. Sample areas of the area for calculating the density of block cracking yielded a range of 16 to 23 percent with an estimated average of approximately 20 percent. The severity of the block cracking was determined to be low as evidenced by small widths of the crack opening and no spalling. The distress deduct value for this GA storage and refueling area is 20 which results in a PCI = 80. By the ASTM D 5340 definition, this PCI value indicates a performance in the upper range of “Very Good” based on visual condition of the pavement.
The conclusion from this investigation is that after approximately four to five years of service, the E-Krete applied to the GA storage and refueling areas at the Tupelo Regional Airport is performing “Very Good” and has exhibited excellent fuel-resistant characteristics.
E-Krete - Corinth-Alcorn County Airport [Roscoe Turner Field].
The Corinth-Alcorn County Airport is located two miles east of Corinth, MS, on the Mississippi-Tennessee state borders. The entrance to the airport is shown in Figure 2-15.
Figure 2-15 – Corinth-Alcorn County Airport, Corinth, MS
The E-Krete was applied to the asphalt pavement main taxiway and general aviation [GA] parking apron during the summer of 2002. From observation and interviews with the airport manager during the on-site inspection, it was concluded that the asphalt pavement was structurally sound at this time, and it exhibited raveling and weathering and block cracking distress types. The condition of the pavement was estimated to be “Fair” with a PCI in the range

20
of 40 to 55. Prior to application of the E-Krete, the cracks wider than ¼-inch were cleaned and sealed. Also the visible appearance of fuel and oil deposits was removed.
Figure 2-16 provides a view looking north of the GA apron and main taxiway. Figure 2-17 provides a view of the GA apron leading to one of the aircraft hangars. The pre-existing block cracking pattern is clearly visible and has reflected through the E-Krete application. The raveling and weathering distress type is visible only to an apparent degree of color differentiation. Sample areas of the GA apron for calculating the density of block cracking yielded a range of 22 to 31 percent with an estimated average of approximately 25 percent. The severity of the block was determined to be low as evidenced by the nonspalled [sides of the crack were vertical] or lightly spalled, causing no FOD potential, as shown in Figure 2-17.
Figure 2-16 – Corinth-Alcorn County Airport, Apron Looking North
21
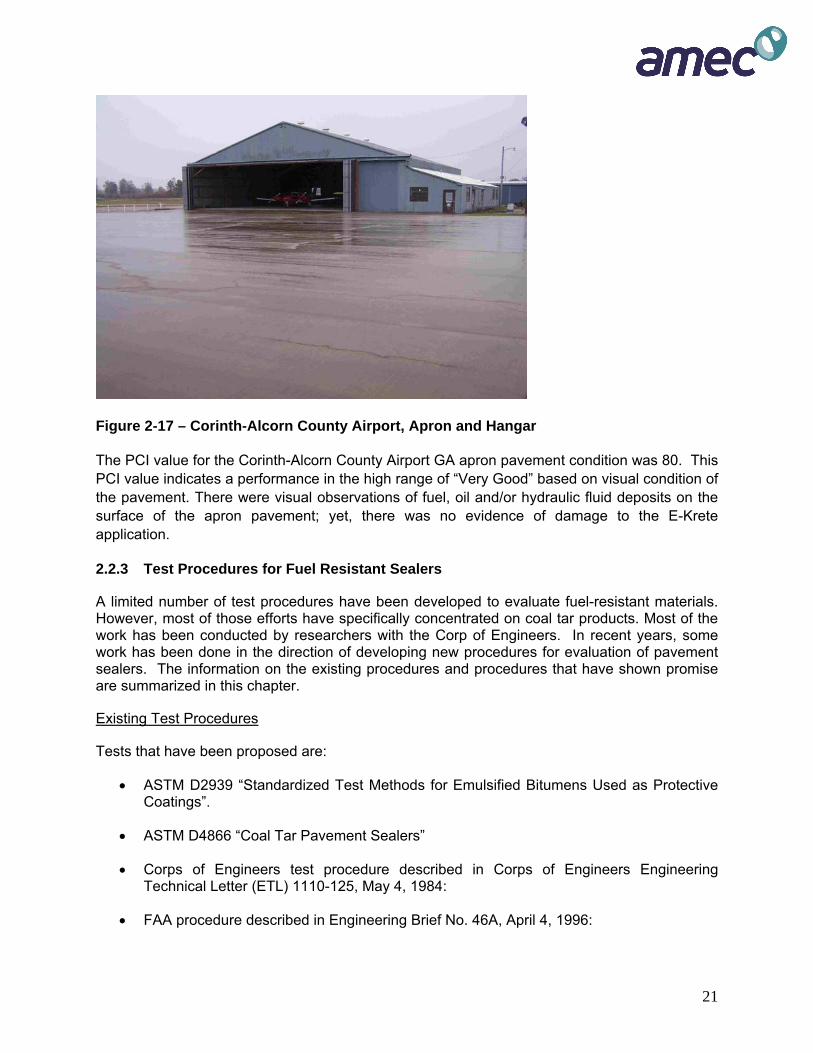
Figure 2-17 – Corinth-Alcorn County Airport, Apron and Hangar
The PCI value for the Corinth-Alcorn County Airport GA apron pavement condition was 80. This PCI value indicates a performance in the high range of “Very Good” based on visual condition of the pavement. There were visual observations of fuel, oil and/or hydraulic fluid deposits on the surface of the apron pavement; yet, there was no evidence of damage to the E-Krete application.
2.2.3 Test Procedures for Fuel Resistant Sealers
A limited number of test procedures have been developed to evaluate fuel-resistant materials. However, most of those efforts have specifically concentrated on coal tar products. Most of the work has been conducted by researchers with the Corp of Engineers. In recent years, some work has been done in the direction of developing new procedures for evaluation of pavement sealers. The information on the existing procedures and procedures that have shown promise are summarized in this chapter.
Existing Test Procedures
Tests that have been proposed are:
• ASTM D2939 “Standardized Test Methods for Emulsified Bitumens Used as Protective Coatings”.
• ASTM D4866 “Coal Tar Pavement Sealers”
• Corps of Engineers test procedure described in Corps of Engineers Engineering Technical Letter (ETL) 1110-125, May 4, 1984:
• FAA procedure described in Engineering Brief No. 46A, April 4, 1996:
22
• A procedure developed by the University of Nevada Reno for the FAA in 1997.
Generally when a laboratory is requested to evaluate a fuel-resistant sealer the lab will conduct the evaluation using ASTM D 2939 and ASTM D4866. ASTM D 2939 is used to conduct an overall evaluation of the sealer and ASTM D4866 is used to evaluate the fuel resistance of the sealer in the presence of kerosene.
ASTM D2939.6 “Standard Test Methods for Emulsified Bitumens Used as Protective Coatings”.
This test procedure covers procedures for sampling and testing emulsified bitumens used in thick films as protective coatings for metals, built-up roofs and bituminous pavements. The test procedure contains a number of tests that are referenced in other test procedures. It includes procedures for
• sampling • evaluation of the uniformity of the sample • determining the sample’s resistance to freezing • determining the percent residue and percent volatiles • determining ash content • determining the drying time • determining the resistance to heat • determining the resistance to water • determining the flexibility of the material • determining the brush and spray application procedure • determining the wet flow • a procedure for conduction of a direct flame test • determining the solubility of residue in trichloroethylene • determining the wet film continuity • determining the resistance to volatilization • determining the solubility in carbon disulfide • determining the resistance to kerosene • determining the resistance to impact • determining the resistance to impact after accelerated weathering • determining the sand content in bituminous emulsions
ASTM D48667. Standard Performance Specification for Coal Tar Pitch Emulsion Pavement
Sealer Mix Formulations Containing Mineral Aggregates and Optional Polymeric Admixtures”
This ASTM standard covers mixtures of coal-tar pitch, mineral aggregates, and optional polymeric admixtures. They are used as a weather-protective and straight aliphatic hydrocarbon resistant coatings over bituminous pavements of airports, parking areas, and driveways. The test procedure makes extensive reference to procedures contained in ASTM D2939. The test procedure for evaluating the resistance to kerosene is determined by applying two coats of a coal-tar sealer to an unglazed ceramic tile. The two coats are applied using a brass mask 4/64 inch in thickness for the first coat and the 8/64 for the second coat. After curing, a metal ring is attached to the surface with a silicone sealant. The metal ring is filled with kerosene. The surface is exposed to the kerosene for 24 hours before evaluating. After the kerosene and ring have been removed, the surface is examined for softness and loss of

23
adhesion. The test procedure also has a procedure for evaluation of resistance to water and flexibility.
ETL 1110-125. Corps of Engineers Test Procedure8 This test procedure consists of testing six-inch diameter cores approximately two inches thick. The cores are glued to the top of concrete cylinders. They are sealed with the sealant to be tested. The sealant is placed on all sides of the core by painting the specimens with a 1 ½ inch paint brush. The sealant is cured at room temperature for a minimum of 24 hours. After the specimens are cured, they are subjected to a fuel drip test. In approximately 10 minutes, 1000 ml of reference fuel (Fuel B 70 percent Iso-octane + 30 percent toluene by volume), under a constant five psi pressure head, is dripped on each specimen tested. This fuel covers the entire specimen surface for the required time. The specimens are rotated 90 degrees every 2-1/2 minutes to help assure uniform coverage of fuel over the specimen surface. The specimens are placed on a wire mesh for the fuel tests to prevent the fuel from accumulating on the bottom of the specimen. An abrasion test is run on all specimens within 5 minutes of completion of the fuel drip test. The abrasion test is an adaptation of the “wet track abrasion test”, ASTM D3910 (ASTM D1982). Two changes required to this method included shortening the abrasion hose from 5.0 in. to 1.5 in. and increasing the depth of the metal pan from 2.0 in. to 2.5 in. The shorter hose is required for use with the 6-inch specimens and the depth increase is to allow the specimens to be completely submerged in water. At the completion of the abrasion test, the specimens are allowed to dry to a constant weight or for 24 hours, whichever is shorter. This weight is recorded along with noting any loss of aggregate particles from the specimens. If the material takes longer than 24 hours to obtain a constant weight, this signifies that fuel or water has penetrated the sealer. The two possible causes of fuel penetration are: (a) the specimen is not completely sealed, or (b) the fuel has softened the sealer and penetrated the specimen. The product is rejected if the weight loss (loss of aggregate/coating material) exceeds the weight of the original coating material. FAA Procedure EB No 46A9 This procedure requires the determination of the viscosity using the Brookfield Viscosimeter, a scuff resistance test, a cyclic freeze-thaw test, an adhesion test, and a fuel resistance test. In the first three tests the sealer is applied to a 3/16 inch aluminum panel. In the scuff test a scuffing load is applied through a ¾ inch reinforced rubber hose. The cyclic freeze-thaw test consists of applying the sealant to a 3/16 inch aluminum panel and then determining the extent of cracking after ten freeze (10 oF) thaw (140 oF) cycles. The pass/fail criterion is the amount of cracking occurring in the sample at five and ten cycles. The adhesion test consists of determining the adhesion of a sand coat tar emulsion mixture by measuring the amount of sealant that the pressure-sensitive tape pulled from the 3/16 inch aluminum panel. The fuel resistance test consists of applying a sealant to a ceramic tile (with 10 to 18 percent water absorption) and then soaking a portion of the tile in kerosene. The tile is broken in half to evaluate the penetration of the kerosene. University of Nevada Field Test4 This procedure was developed to fulfill the need for a procedure to check the quality of a fuel resistant sealer as it is delivered to the project, and to determine the amount of sealer that is needed to provide the desired fuel resistance. The procedure consists of placing the sealer on the pavement at the desired rate. After the sealer is cured, a pipe is placed on the surface of
24
the pavement. The edge of the pipe is sealed with silicon. Care is taken to ensure that the aviation fuel will not flow through the sealant. The silicon is cured for three hours and then one inch of kerosene is poured into the pipe which is covered with a lid. Every 15 minutes the level of the kerosene is checked by placing a ruler inside the pipe. The measurements are continued for one hour or until all the kerosene goes into the pavement. Other Possible Procedures
The following section briefly describes other test procedures that the research team evaluated during the initial phase to determine if they would be applicable for the evaluation of the fuel resistance of HMA spray-applied sealers. A more detailed discussion of the research team’s evaluation of each test method is presented later in the report.
Permeability - The laboratory permeability test (ASTM PS129-01)10 has been used to evaluate the permeability of an HMA specimen. The test procedure was developed using water as a fluid. The AMEC team initially discounted this procedure due to a concern about the effect that kerosene/aviation fuel has on the neoprene seals typically used in the test apparatus. A quick test was conducted and it was found that they disintegrate when exposed to an aviation fuel. HMA Lab Supply was able to identify and manufacture membranes made from nitrile. This material was found to be impervious to the effects of kerosene/aviation fuel. During the initial phases of the research study the Research Team thought that a permeability test had the most promise for evaluating fuel resistance sealers.
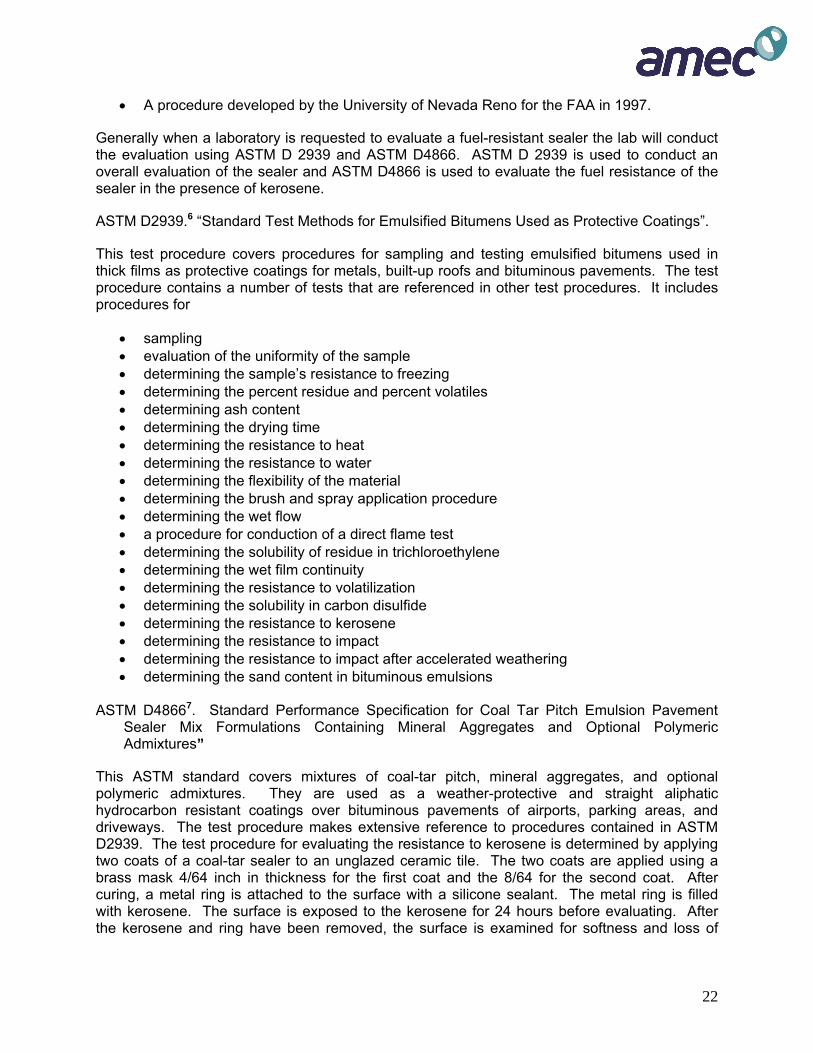
Dynamic Shear Rheometer (DSR) Torsion Bar Test - Research studies have evaluated the concept of determining the modulus of thin HMA specimens with reasonable accuracy using a research-grade Dynamic Shear Rheometer (DSR) equipped with torsion fixtures. This test, as developed by Reese (Caltrans) and later refined by Goodrich (Chevron) and then Reinke (MTE)11, is typically used to determine the modulus and/or flow time of mixtures at high pavement temperatures (typically 60°C). The top 5 to 10 mm of the fuel-conditioned specimen is trimmed off to provide a smooth surface. A 12 mm slice of the core is made. This layer is cut into rectangular specimens 10 mm thick by 50 mm long. These specimens are tested at ambient temperature using a modified Dynamic Shear Rheometer equipped to test rectangular specimens in torsion. See Figure 2-18 for a photo of the test apparatus.
Figure 2-18 – DSR Dynamic Creep Setup
25
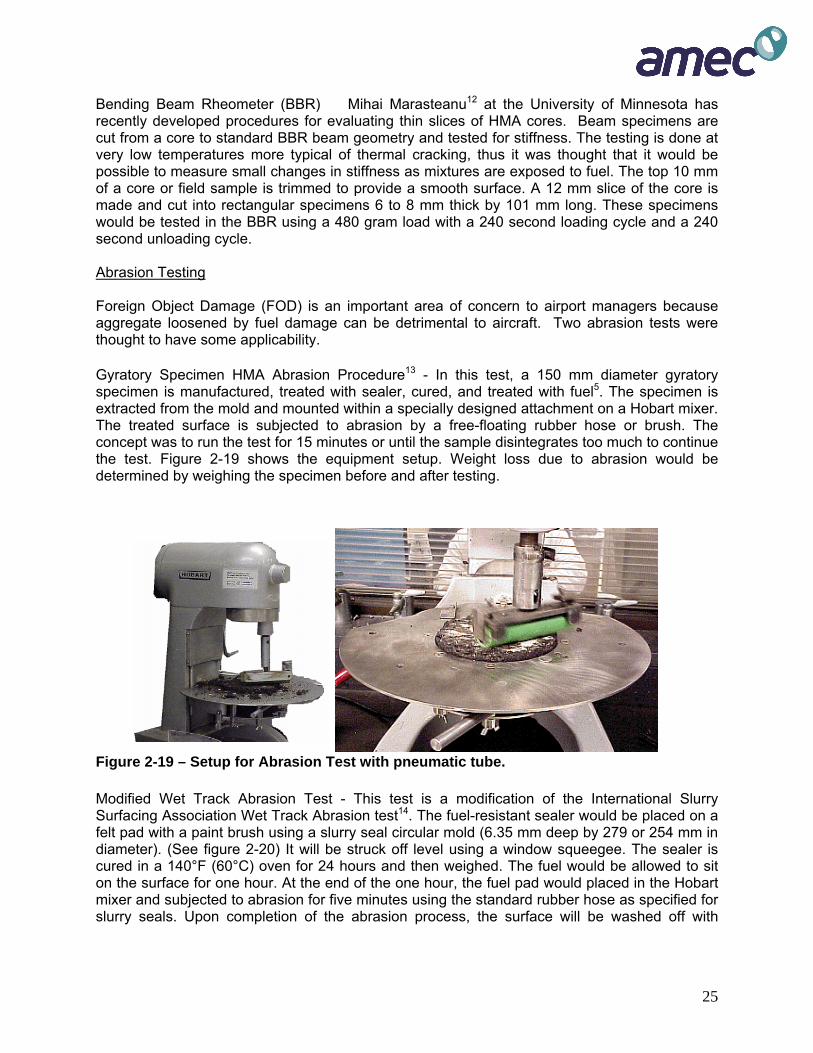
Bending Beam Rheometer (BBR) Mihai Marasteanu12 at the University of Minnesota has recently developed procedures for evaluating thin slices of HMA cores. Beam specimens are cut from a core to standard BBR beam geometry and tested for stiffness. The testing is done at very low temperatures more typical of thermal cracking, thus it was thought that it would be possible to measure small changes in stiffness as mixtures are exposed to fuel. The top 10 mm of a core or field sample is trimmed to provide a smooth surface. A 12 mm slice of the core is made and cut into rectangular specimens 6 to 8 mm thick by 101 mm long. These specimens would be tested in the BBR using a 480 gram load with a 240 second loading cycle and a 240 second unloading cycle. Abrasion Testing Foreign Object Damage (FOD) is an important area of concern to airport managers because aggregate loosened by fuel damage can be detrimental to aircraft. Two abrasion tests were thought to have some applicability. Gyratory Specimen HMA Abrasion Procedure13 - In this test, a 150 mm diameter gyratory specimen is manufactured, treated with sealer, cured, and treated with fuel5. The specimen is extracted from the mold and mounted within a specially designed attachment on a Hobart mixer. The treated surface is subjected to abrasion by a free-floating rubber hose or brush. The concept was to run the test for 15 minutes or until the sample disintegrates too much to continue the test. Figure 2-19 shows the equipment setup. Weight loss due to abrasion would be determined by weighing the specimen before and after testing.
Figure 2-19 – Setup for Abrasion Test with pneumatic tube. Modified Wet Track Abrasion Test - This test is a modification of the International Slurry Surfacing Association Wet Track Abrasion test14. The fuel-resistant sealer would be placed on a felt pad with a paint brush using a slurry seal circular mold (6.35 mm deep by 279 or 254 mm in diameter). (See figure 2-20) It will be struck off level using a window squeegee. The sealer is cured in a 140°F (60°C) oven for 24 hours and then weighed. The fuel would be allowed to sit on the surface for one hour. At the end of the one hour, the fuel pad would placed in the Hobart mixer and subjected to abrasion for five minutes using the standard rubber hose as specified for slurry seals. Upon completion of the abrasion process, the surface will be washed off with

26
lukewarm water and then placed in an oven at 140°F (60°C) for 24 hours. It would then be removed and weighed. The abrasion loss (percent) would be:
{(Weight before abrasion-weight after abrasion)/weight before abrasion} x 100
Figure 2-20 – Set up for Wet-Track Abrasion Test
2.3 FUEL RESISTANT HMA SYSTEMS
2.3.1 Products Used to Manufacture Fuel Resistant HMA Mixtures
There have been two products that have been used to manufacture fuel resistant HMA pavements:
• StellaFlex FR - much of the literature on this product will identify it as CITGOFlex the company marketing this product changed hands in the spring of 2008 and changed the name of the product
• ROSPHALT FR
StellaFlex FR
StellaFlex FR is a polymer-modified HMA mix that is designed, produced, and placed to achieve low air voids. The objective is to achieve acceptable fuel resistant characteristics through a highly modified binder mix design with low air voids for the plant produced material and constructed low permeability field placed material. The StellaFlex FR was developed in the Netherlands and has seen application at several International Airports [AIP]; including Kuala IAP in 1996; Cairo IAP in 1997; Aden AIP in 1999; introduced in the U.S. at La Guardia Airport in
27
2002; and had the full fuel resistant apron application at Boston Logan IAP in 200415. At Boston Logan IAP, the FAA Item P-401, Plant Mix Bituminous Pavement, was revised to include a PG 82-22 modified asphalt binder, and the Marshall Method mix criteria was used, as shown in Table 2-3. The generic specification that could be used for the jet fuel resistant surface mix is referred to as in this report as Stellaflex FR.
Table 2-3 – Marshall Design Criteria, Stellaflex FR.
Test Properties All Aircraft Number of blows 50 Stability, Lbs. – minimum 2150 Air Voids ( percent) 2.5 % ± 0.2 . VMA – minimum ( percent) 14 Weight loss by fuel immersion – max* (percent)
1.5
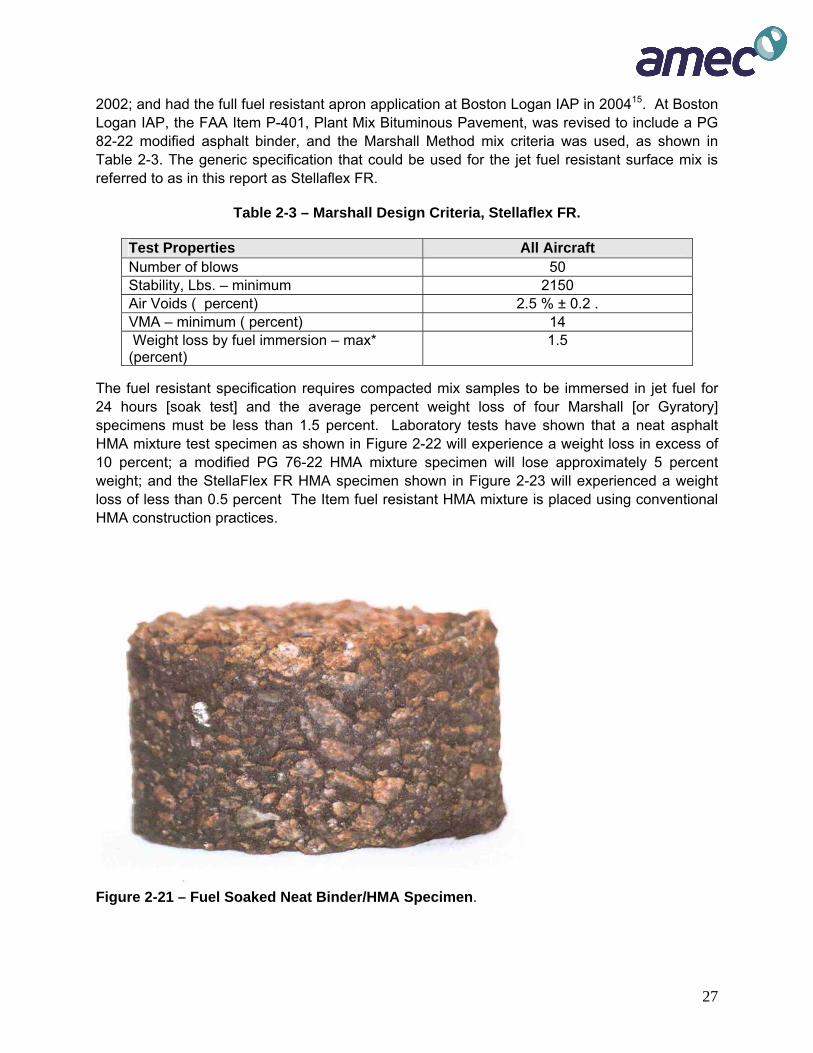
The fuel resistant specification requires compacted mix samples to be immersed in jet fuel for 24 hours [soak test] and the average percent weight loss of four Marshall [or Gyratory] specimens must be less than 1.5 percent. Laboratory tests have shown that a neat asphalt HMA mixture test specimen as shown in Figure 2-22 will experience a weight loss in excess of 10 percent; a modified PG 76-22 HMA mixture specimen will lose approximately 5 percent weight; and the StellaFlex FR HMA specimen shown in Figure 2-23 will experienced a weight loss of less than 0.5 percent The Item fuel resistant HMA mixture is placed using conventional HMA construction practices.
Figure 2-21 – Fuel Soaked Neat Binder/HMA Specimen.

28
Figure 2-22 – Fuel Soaked StellaFlex Fuel Resistant Binder/HMA Specimen
Rosphalt FR.
In the early 1980s Royston Laboratories, a Division of Chase Corporation, developed a product that they called Rosphalt 50. It was used as a sealer and wearing course for PCC bridge decks and has had application in this arena since 1983. The Rosphalt 50 is a proprietary concentrated thermoplastic virgin polymeric material that, when added to HMA during the mixing process, combines with the asphalt to produce the sealer and wearing course characteristics. The manufacturer claims the Rosphalt 50 meets the criteria of a PG 94-38 asphalt binder.
In November 2002, a Rosphalt 50 Item P-401mix design was placed as a test section (25 ft x 150 ft patch) side by side with a PG 76-28 P-401 test section (patch, 25 ft x 150 ft patch) at the beginning of Runway 22R at Boston Logan IAP16. The mixes were placed with the primary objective of rut resistance. The short-term performance of the Rosphalt 50 exceeded that of previous unmodified mixes, but long-term performance was interrupted by reconstruction using 4.0-inches of modified reclaimed asphalt pavement mix, 3.5-inches of Item P-401 FR [structural], and 2.0-inches of Item p-401 FR surface mix.
The Rosphalt FR is an HMA mix with a low concentration of a thermoplastic virgin polymeric asphalt additive. The manufacturer indicates that there are two Rosphalt mixes being marketed: a Rosphalt 50 which is a 45 pound mix versus a 30 pound mix for the Rosphalt FR. The HMA mix with Rosphalt FR has been successfully tested by PRI Asphalt Technologies and certified to meet, or exceed, the provisions for percent weight loss by jet fuel immersion (less than 5% weight loss). The material is listed on the web under Chase Construction Products as Rosphalt Rx/FR Asphalt Additive (Mix Modifier); however, as of the date of this report, there is no documented information of fuel resistant application and/or performance on airport pavements. The Rosphalt HMA mixes are using conventional HMA construction practices.

29
2.3.2 Summary of Research Studies on Fuel Resistant HMA Mixtures
Tom Bennett conducted a study17 using a CITGOFLEX PG 82-22 and CITGOFLEX Fuel Resistant (FR) binders. Two gradations were used: an Port Authority of New York/New Jersey (PANYNJ) #3 (95 percent passing the ½ inch sieve) Surface Mix and the mix used at the Boston’s Logan Airport in the summer of 2006. The Logan mix had a finer gradation (for example; 70 percent passing the 4.75 mm sieve versus 50 percent for the PANYNJ mix). The mixtures were tested to determine the permanent deformation characteristics, (determined using the simple performance test), the flexural fatigue resistance (determined using the flexural beam fatigue test - ASTM T321), stiffness (using the dynamic modulus test – ASTM TP62) and permeability of the different mixes. From the results of this study, the authors concluded that:
• The best performing mixes were those using the FR binder.
• The use of the FR binder instead of the PG 82-22 in the PANYNJ No. 3 mix improved its rut resistance as well as its fatigue resistance.
• The decrease in the compacted air voids in the FR mixes had very little detrimental effect on the stiffness and rut resistance of those mixes.
• The permeability of the FR (Logan) mixes could not be measured with the falling head permeameter apparatus; while the permeability of the PANYNJ No. 3 mix was 112 x 10-5 cm/sec. (This is probably due to the fact that the PANYNJ No. 3 mix is coarser than the FR (Logan) mix).
Tom Bennett conducted another study18 to compare the laboratory performance of six different fuel resistant CITGOFLEX FR mixtures that were constructed in 2006 and 2007. All of the materials were tested and found to provide good fatigue characteristics and rutting resistance. They were also tested to determine their resistance to jet fuel using a soak test. The test specimens were compacted to 4 + 0.3 percent air voids. Table 2-4 presents a summary of certain test results from this study.

30
Table 2-4 Summary of Results - Different Mixes
Sieve Size
Fuel Resistant Mix Type
Logan (FR +
Sasobit)
Logan (FR)
Charlotte (FR)
FLDOT FR
NYC FR NYC FR
¾ 100.0 100.0 100.0 100.0 100.0 100.0 ½ 99.9 99.9 99.8 98.7 100.0 100.0 3/8 96.5 96.3 96.4 87.2 92.5 91.9 No. 4 73.9 71.7 69.3 61.4 58.0 56.6 No. 8 50.5 51.2 52.2 43.1 42.3 40.2 No. 16 33.0 34.5 41.9 29.8 31.9 30.8 No. 30 23.6 24.0 34.4 21.7 23.7 23.4 No. 50 17.4 18.7 24.5 15.4 16.3 16.6 No. 100 13.3 14.6 14.7 10.6 10.2 10.1 No. 200 9.1 10.6 6.4 6.9 5.8 5.4 Binder Content
6.1 6.4 6.4 6.1 7.2 7.2
Percent Loss
0.36 0.57 3.25 1.0 2.9 1.2
Mr. Bennett’s research proved in the laboratory that fuel resistant mixtures can be manufactured.
Steve Leroux, et. al. discuss19 a project to evaluate three asphalt binders for fuel resistance. The binders were a B-1 penetration grade (30/50) asphalt and two polymer modified binders (PMB B-1 & PMB-2). The two modified binders were formulated to provide a binder with improved fuel resistance. The 35/50 penetration grade binder was the base stock for the two polymer modified binders. The specimens were immersed in kerosene for 24 hrs and for 7 days at room temperature. After drying, each specimen was weighed and the mass loss determined and expressed as a percentage5. The samples were compacted to produce Duriez specimens. (The Duriez test is a French test which is a variation of the Immersion-Compression test used in the United States). They were compacted using different compressive forces to produce specimens with different air voids.

31
Table 2-5 Percent Loss for Binders
Asphalt Binders B-1
Air Voids 11 10 7.8 6.6 5.9 5.2 % Loss 24 hr 8 2.6 2.1 2.1 2.1 1.7 % Loss 7 days 11.5 5.2 3 1.8 1.5 1.5 PMB -1 Air Voids 9.7 8.4 4.2 2.5 % Loss 24 hr 1.9 0 0.2 1.8 % Loss 7 days 3.6 0 0 1.7 PMB – 2 Air Voids 9.8 7.4 6.6 5.0 4.9 % Loss 24 hr 0.9 0.2 0.4 0.8 0.4 % Loss 7 days 1.3 0.8 0.2 0.8 3.7
The report concluded that the kerosene soak test is suitable for showing significant differences between a binder with improved fuel resistance and a non-fuel-resistant binder. The report also shows that effect of their on has on the fuel resistance of an HMA mixture.
Ronald C. van Rooijen, et. al.20 discusses an early use of jet fuel resistant HMA mixtures at five airports around the world beginning in 1996. He reports that the performance has been excellent. In this study, the rheological behavior of both fresh asphalt and asphalt recovered from conditioned asphalt specimens was determined.
The report describes both a study of the laboratory performance of jet fuel resistant binders and an evaluation of three field projects: Kaula Lumpur International Airport, International Airport of Saint Maarten and La Guardia Airport in New York.
In the laboratory study, three asphalt binders were tested: a standard penetration grade, a high quality SBS modified asphalt, and a jet fuel resistant binder. Table 2-6 shows the results for penetration and softening point. The authors’ conclusions were that all three asphalt binders were affected by the exposure to jet fuel. For both of the polymer modified binders the decrease in penetration and softening point was relatively small. The effect on the penetration and softening point was the largest for the 40/60 penetration asphalt. This study did not provide weight loss after soaking in kerosene test results.

32
Table 2-6 Asphalt Properties
Penetration at 25oC Ring and Ball Softening Point (oC)
40/60 Asphalt Fresh 55 50.5 Recovered (no conditioning) 50 51.6 Recovered (after immersion in jet fuel)
148 40.1
SBS Polymer Modified Asphalt Fresh 61 101.5 Recovered (no conditioning) 50 97.5 Recovered (after immersion in jet fuel)
79 92.0
Fuel Resistant Polymer Modified Asphalt Fresh 56 86.0 Recovered (no conditioning) 54 82.0 Recovered (after immersion in jet fuel)
65 79.0
The authors also studied the permanent deformation characteristics using a uniaxial cyclic compression test. The test load of 0.4 MPa was applied vertically, without confining pressure and one load cycle lasted for 1 second. The test was stopped at 7 percent permanent deformation or 10,000 load cycles, whichever came earlier. They quantified the resistance to permanent deformation at the end of the test and the mixture viscosity.
Table 2-7 Resistance to deformation at 40oC
Permanent Deformation (%)
Mixture Viscosity (GPa*s)
40/60 Asphalt Not conditioned 4.9 52 After immersion in jet fuel > 7.0 31
SBS Polymer Modified Asphalt Not conditioned 1.7 940 After immersion in jet fuel 2.5 410
Fuel Resistant Polymer Modified Asphalt Not conditioned 1.3 1,050 After immersion in jet fuel 1.4 1,050
The results of the Ronald C. van Rooijen, et. Al study showed that the use of the SBS Polymer Modified Asphalt and Fuel Resistant Polymer Modified Asphalt significantly improved the permanent deformation of the HMA mixture and that the Fuel Resistant Polymer Modified Asphalt is not affected by the jet fuel.

33
Conclusions Based On The Review Of Work Done By Others
Work done by other researchers drew the following conclusions:
• The best performing mixes were those using fuel resistant binders.
• The use of the fuel resistant binder instead of the PG 82-22 in the PANYNJ #3 mix improved its rut resistance as well as its fatigue resistance.
• The decrease in the compacted air voids in the FR mixes had very little detrimental effect on the stiffness and rut resistance of those mixes.
• Fuel Resistant Polymer Modified Asphalt significantly improved the permanent deformation of the HMA mixture and Fuel Resistant Polymer Modified Asphalt was unaffected by the jet fuel.
• The kerosene soak test was suitable for showing significant differences between a binder with improved fuel resistance and a non-fuel-resistant binder
• A kerosene immersion period of 24 hours was appropriate for the soak test.
2.3.3 Observation/Performance of Fuel Resistant Binder/HMA Systems
Logan International Airport
This section presents information on the use of StellaFlex FR at Logan International Airport. The StellaFlex FR was a well designed HMA mixture as shown in Table 2-1. It was manufactured using a fine dense aggregate gradation with 100 percent passing the ½-inch sieve and 87-99 percent [normally close to the 97 percent] passing the 3/8-inch sieve. The design air voids are to 2.0 to 4.0 percent. The result is a fuel resistant mix is essentially impermeable to fuel spills.
In June 2004, 1300 tons of the StellaFlex FR mix was placed on Taxiway N and Runway 4L-22R at Boston Logan IAP. This initial placement of the mix was designated as a FAA Item P-401 FR and placed for rut resistance. This mix was designed using the Marshall Mix Design Procedure. The mix was a ½-inch maximum aggregate size gradation designed and produced at 2.5 percent air voids. The FR asphalt graded as a PG 88-22. After three summers there was no rutting, no raveling and weathering, no cracking, and the grooves showed no deterioration. In October 2005, the Item P-401 FR was placed on the Alleyway B-C apron project at Boston Logan IAP to combat fuel spillage distress in addition to the rut resistance feature. This Alleyway B-C project involved milling 8.0-inches of existing HMA and constructing the first 6.0-inches of stabilized base material using the ½” Item P-401 with PG 82-22 asphalt binder and a 2.0-inches surface layer using the ½” Item P-401 FR with PG 88-22 asphalt binder. Figure 2-23 shows the completed construction of ½” Item P-401 FR on Alleyway B-C.

34
Figure 2-23 – Completed Alleyway B-C Project, Boston Logan IAP, November, 2006.
The Stantec Consulting Services Inc. provided construction records for placement of the Item P-401 FR on Alleyway B-C21. The construction records are summarized in Table 2-8.
Table 2-8 – Material Acceptance Data, Alleyway B-C.
LOT #
Plant Produced Air Voids, %
Field Density % Gmb
FR1 1.7 100.5 FR2 1.6 100.7 FR3 1.8 100.0 FR4 1.8 100.0 FR5 1.5 100.0 FR6 1.5 100.6 FR7 1.9 98.7 FR8 2.2 97.9 FR9 1.7 98.1 FR10 1.9 98.8 Sum 17.6 995.3 Ave. 1.8 99.5
The material acceptance data for Alleyway B-C displayed consistent production of the fuel resistant HMA with overall average laboratory air voids of 1.8 percent. The field-placed material for lots 1 thru 6 had densities exhibiting compaction in excess of 100 percent of the bulk

35
Marshall density of the plant-produced material. Lower compaction levels were achieved in LOTs 7 thru 10 with the overall field-placed material having an average of 99.5 percent of the average Marshall density of the plant-produced material. The field placed material had an average in-place air voids less than 3.0 percent, and the Item P-401 FR process met the required fuel resistance criteria.
On November 17, 2006, more than one year after placement of the Item P-401 FR, an on-site inspection of the pavement was performed in accordance with the general procedures outlined by ASTM D 5340. Figure 2-24 shows the Concourse C side of the Alleyway pavement. There was no evidence of raveling/weathering, rutting, and/or cracking distress types. The single measurable distress type was “depression” at a low severity level calculated at two percent density. This pavement distress was attributable to a construction deficiency. The PCI for this section is 85 which translate to a pavement performance condition at the borderline between “Very Good” and “Excellent,” with no fuel and/or rutting distress. After two full years of service, the Massachusetts Port Authority reports that the Stellaflex [Item P-401 FR] is performing in an excellent manner without evidence of fuel and/or rutting distress.
Figure 2-25 illustrates the surface texture of the Item P-401 FR. To be noted is the fine gradation and the dense nature of the HMA mixture. This photo was taken subsequent to rainfall with water on the surface. It is obvious that the moisture was not penetrating the surface attesting to the impermeability of the P-401 FR.
Figure 2-24 – View of Alley B-C Pavement, BLIAP, November 2006

36
Figure 2-25 – Close-Up of Surface Texture of the Item P-401 FR, November 2006.
Since placement of the Stellaflex on Alleyway B-C at Boston Logan IAP, the Massachusetts Port Authority has accomplished Stellaflex projects for fuel and rut resistance on Alleyway C-E in 2006, and Alleyway C in 2007. Early satisfactory performance of these projects has been reported by the Port Authority.
Florida DOT Highway Project
Stellaflex was used for a project to rehabilitate the FDOT I-10 Agricultural Inspection Station (AIS), FL, in spring 2007. A revised FDOT Standard Specification, Section 334, Superpave Asphalt Concrete was prepared for this project22. The SP mixture was specified as a SP FR 12.5 mm (fine) mixture prepared to meet design traffic level E (30 x 106 ESAL’s); performance grade asphalt binder criteria for PG 82-22.
The FDOT provided construction records for placement of the SP FR 12.5 mm (fine) mixture on the I-10 AIS24. A summary of the construction records is provided in Table 2-9.
Table 2-9 – Material Acceptance Data, FDOT AIS. LOT Plant Produced Field Density
# Air Voids, % % Gmm 12SL1 2.1 95.7
12SL1S 2.1 94.0 12 SL2 1.9 96.3 12 SL 3 1.9 97.9
Sum 8.0 383.9 Ave. 2.0 96.0
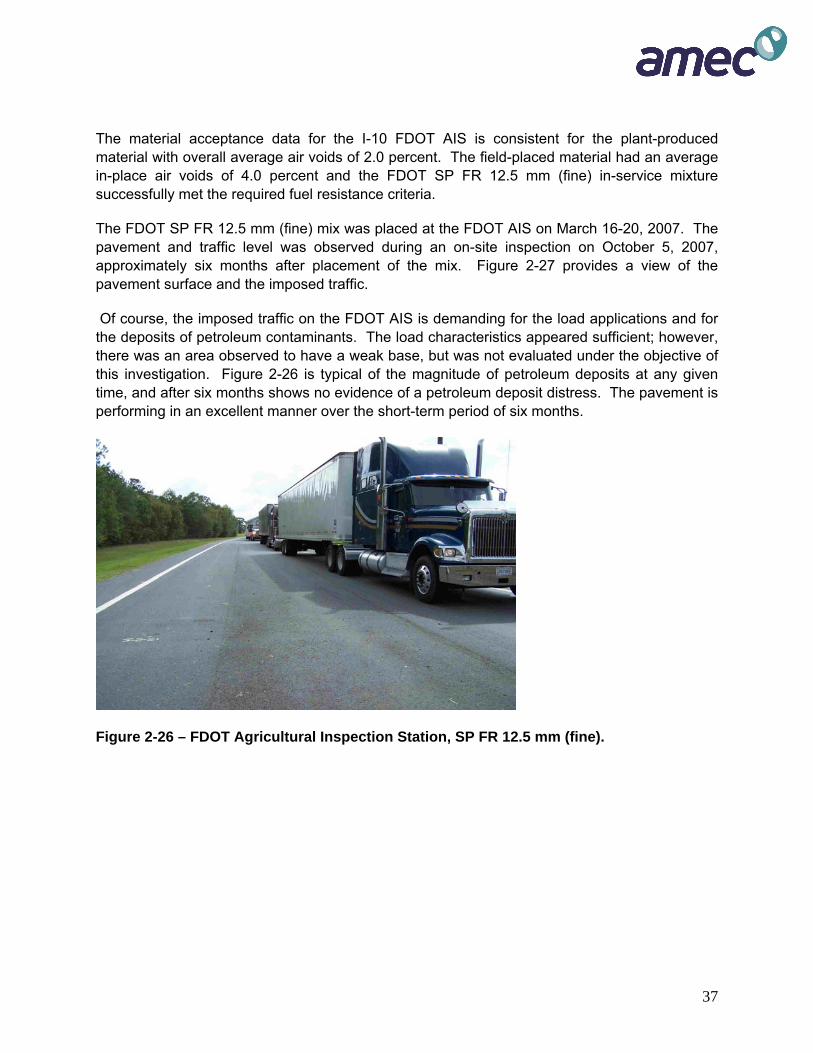
37
The material acceptance data for the I-10 FDOT AIS is consistent for the plant-produced material with overall average air voids of 2.0 percent. The field-placed material had an average in-place air voids of 4.0 percent and the FDOT SP FR 12.5 mm (fine) in-service mixture successfully met the required fuel resistance criteria.
The FDOT SP FR 12.5 mm (fine) mix was placed at the FDOT AIS on March 16-20, 2007. The pavement and traffic level was observed during an on-site inspection on October 5, 2007, approximately six months after placement of the mix. Figure 2-27 provides a view of the pavement surface and the imposed traffic.
Of course, the imposed traffic on the FDOT AIS is demanding for the load applications and for the deposits of petroleum contaminants. The load characteristics appeared sufficient; however, there was an area observed to have a weak base, but was not evaluated under the objective of this investigation. Figure 2-26 is typical of the magnitude of petroleum deposits at any given time, and after six months shows no evidence of a petroleum deposit distress. The pavement is performing in an excellent manner over the short-term period of six months.
Figure 2-26 – FDOT Agricultural Inspection Station, SP FR 12.5 mm (fine).
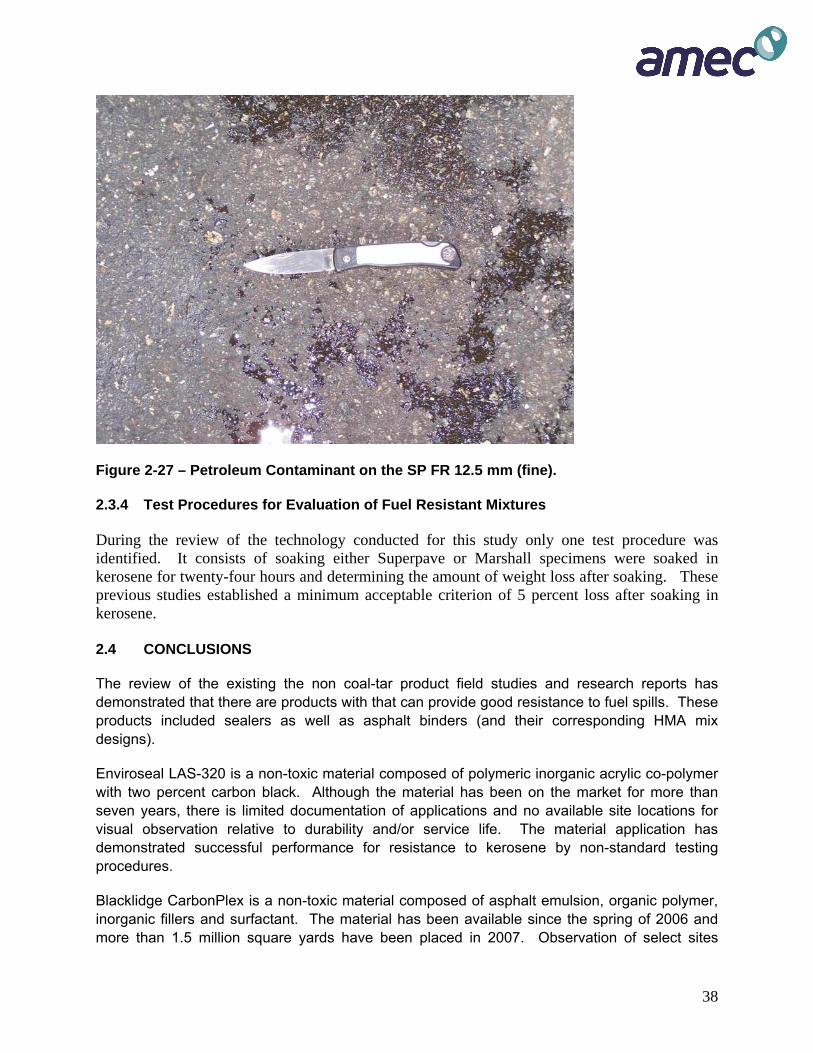
38
Figure 2-27 – Petroleum Contaminant on the SP FR 12.5 mm (fine).
2.3.4 Test Procedures for Evaluation of Fuel Resistant Mixtures
During the review of the technology conducted for this study only one test procedure was identified. It consists of soaking either Superpave or Marshall specimens were soaked in kerosene for twenty-four hours and determining the amount of weight loss after soaking. These previous studies established a minimum acceptable criterion of 5 percent loss after soaking in kerosene. 2.4 CONCLUSIONS
The review of the existing the non coal-tar product field studies and research reports has demonstrated that there are products with that can provide good resistance to fuel spills. These products included sealers as well as asphalt binders (and their corresponding HMA mix designs).
Enviroseal LAS-320 is a non-toxic material composed of polymeric inorganic acrylic co-polymer with two percent carbon black. Although the material has been on the market for more than seven years, there is limited documentation of applications and no available site locations for visual observation relative to durability and/or service life. The material application has demonstrated successful performance for resistance to kerosene by non-standard testing procedures.
Blacklidge CarbonPlex is a non-toxic material composed of asphalt emulsion, organic polymer, inorganic fillers and surfactant. The material has been available since the spring of 2006 and more than 1.5 million square yards have been placed in 2007. Observation of select sites

39
indicated user satisfaction and good performance characteristics for the short-term service. The CarbonPlex has been successfully tested for resistance to kerosene in accordance with ASTM D 2939 by two independent testing laboratories.
E-Krete is a non-toxic, two-component polymer resin emulsion, sometimes classified as a polymer composite micro-overlay (PCMO), which is an application of polymer concretes over paving surfaces, especially asphalt. PCMOs are polymer-modified concretes containing latex or dry polymer, Portland cement (or other types of hydraulic cements), proprietary additives (pozzolans, plasticizers, air-entraining agents, etc.), and aggregate. Highly successful applications were documented for applications between 1998 and 2003; however, there has been little marketing activity since 2003. The E-Krete applications have demonstrated the ability to provide a durable wearing surface with good FR characteristics.
StellaFlex FR is a non-toxic modified binder/HMA process. The process has seen successful constructions internationally since 1996 and successfully introduced in the United States in 2002. After initial construction at La Guardia Airport in 2002, the construction has seen extensive application at Boston Logan IAP, MA, recently at Charlotte-Durham IAP, NC, and highway construction at an Agricultural Inspection Station off I-10 in northern FL. The StellaFlex FR process has demonstrated excellent in-service performance in terms of rutting and resistance to petroleum deposits for each construction application; including almost five years at La Guardia Airport and three years at Boston Logan IAP. In each case, the Stellaflex process successfully passed a non-standard jet fuel immersion test.
Rosphalt FR is a non-toxic modified binder/HMA process. There is no documented record of construction; however, laboratory samples of HMA prepared with the Rosphalt modified binder have successfully passed a non-standard jet fuel immersion test.
40
REFERENCES - CHAPTER TWO
1. Material Safety Data Sheet [MSDS], Enviroseal Corporation, Enviroseal LAS-320, May 2003.
2. Material Safety Data Sheet [MSDS], CarbonPlex Seal Coat, Blacklidge Emulsions, Inc., July 2006.
3. Shoenberger, James E., Rejuvenators, Rejuvenator/Sealers and Seal Coats for Airfield Pavements” Engineer Research and Development Center, Vicksburg, MS Feb 2003
4. Sebaaly, Peter E, Mohammad Rahman, Kevin Hardin, Bernie Schlake “Development of Field Validation Tests for Coal-Tar Emulsions” Report DOT/FAA/AR-96/15, U. S. Department of Transportation, Federal Aviation Administration, Office of Aviation Research, Washington, D.C. 20591 1997
5. ASTM D2939. “Standard Test Methods for Emulsified Bitumens Used as Protective Coatings”. ASTM International, 100 Bar Harbor Drive, P.O. Box C700, West Conshohocken, PA 19248
6. Technical Service Report, Analysis of CarbonPlex for Resistance to Kerosene per ASTM D 2939, Momentum Technologies, Inc., Uniontown, OH, August 30, 2007.
7. ASTM Test Procedure D 4866 - 88, “Standard Performance Specification for Coal Tar Pitch Emulsion Pavement Seal Mix Formulations Containing Mineral Aggregates and Optional Polymeric Admixtures” ASTM International, 100 Bar Harbor Drive, P.O. Box C700, West Conshohocken, PA 19248
8. ETL 1110-125 “Test Procedure for Evaluating the Quality of Fuel Resistant Sealers in the Laboratory” U. S. Army Corps of Engineer Waterways Experiment
9. Engineering Brief 46A, “Coal-Tar Emulsion Seal Coat”, Federal Aviation Administration, April 1996
10. ASTM PS 129-01 – “Lab Permeability Test” ASTM International, 100 Bar Harbor Drive, P.O. Box C700, West Conshohocken, PA 19248
11. Reinke, Gerald, “Report to NCAT-Rejuvenator Study - Study of Rejuvenator Type of Mixture Stiffness” Mathy Technology and Engineering Services, Inc, May 2002
12. Basu, A., M.O. Marasteanu, and S.A.M. Hesp. Time-Temperature Superposition and Physical Hardening Effects in Low-Temperature Asphalt Binder Grading. Transportation Research Record: Journal of the Transportation Research Board, No. 1829, pp. 1-7, 2003.
13. Thomas, Todd, Arlis Kadrmas “Performance-Related Tests and Specifications for Cold In-Place Recycling: Lab and Field Experience” Koch Pavement Solutions, 4027 E. 37th St. North, Wichita, KS 67220, 2002

41
14. “Recommended Performance Guidelines for Emulsified Asphalt Slurry Seal”, International Slurry Surfacing Association, #3 Church Circle, PMB 250, Annapolis, MD 21401, January 2001
15. Corun, R., Van Rooijen, R. C., de Bondt, A. H., Performance Evaluation of Jet fuel
Resistant Polymer-Modified Asphalt for Airport Pavements, ASCE 2006 TD&I Airfield and Highway Pavement Conference, Atlanta, Georgia, April 30 – May 03, 2006.
16. Pelland, R.J., Gould, J.S., and Mallick, R.B., Selecting a Rut Resistant Hot Mix Asphalt
for Boston-Logan International Airport, ASCE 2003 TD&I Airfield Pavement Specialty Conference, Las Vegas, Nevada, September 21-24, 2003
17. Bennett, Tom “Laboratory Performance of Fuel Resistant Hot Mix Asphalt – CITGOFlex
FR. Rutgers Asphalt Pavement Laboratory (RAPL) Center for Advanced Infrastructure and Transportation (CAIT), Rutgers University, 100 Brett Road, Piscataway, NJ 08854-8058., May 16, 2007
18. Bennett, Tom “Summary of Laboratory Comparisons Between Different CITGOFlex FR
Mixes. Rutgers Asphalt Pavement Laboratory (RAPL) Center for Advanced Infrastructure and Transportation (CAIT), Rutgers University, 100 Brett Road, Piscataway, NJ 08854-8058.
19. Sieve, Leroux C., Teurquetil F., “Fuel Resistance Performance Evaluation of Asphalt
Pavements”. 3rd Eurasphalt and Eurobitume Congress, Vienna 2004
20. Ronald C. van Rooijen, de Bondit, Arian H., Corun, Ronald L., ”Performance Evaluation of Jet Fuel Resistant Polymer Modified Asphalt for Airport Pavements”. 2004 FAA Worldwide Airport Technology Transfer Conference, Atlantic City, New Jersey, April 2004
21. Material Acceptance Records [Transmittal], MPA Contract No. L495-C1, Rehabilitate
Terminal B-C Alleyway, Boston Logan International Airport, Stantec Consulting Services, Portland, ME, October 12, 2006.
22. Revised Section 334, Fuel Resistant Superpave Asphalt Concrete, Standard Specifications for Road and Bridge Construction, Florida Department of Transportation, April 18, 2006.
23. Project Summary of Plant Produced Material and Field Placed Material Test Results, Florida Department of Transportation, Project No. 21356025201, SR I-10, March 16-21, 2007
.

42
CHAPTER 3 EVALUATION OF TEST PROCEDURES FOR FUEL RESISTANT SEALERS
This Chapter presents the results of a study conducted to develop improved test procedures that can be used by an airport manager or engineer for the evaluation of fuel resistant sealers. The goal of the study is to develop simple test procedures that can be used to evaluation the multitude of products are being marketed. The Chapter consists of two parts: an initial evaluation of a number of possible test procedures and a detailed evaluation of the most promising test procedures.
3.1 INITIAL EVALUATION OF LABORATORY PROCEDURES FOR EVALUATING SEALERS
The following section presents the results of preliminary testing conducted in this study. The purpose of this initial work was to consider the six promising test procedures and to make decisions about which test procedures would be appropriate for further evaluation later in the study.
Certain procedures were universal to each of the procedures. For example all the procedure involved coating laboratory prepared HMA specimens and then exposing the coated surface to kerosene. Kerosene was used because it is similar to jet fuel and other aviation fuels. It would also be readily available to a testing laboratory or others who may be using these techniques that jet fuel would be.
The HMA mixture used for the initial group of tests was a 12.5 mm Superpave Mix. The mix was designed for 4 percent air voids and was compacted for testing to approximately 6-7 percent air voids. The asphalt binder used in all of the mixes for this study was a PG 64-22 (in a couple of situations other binders were used – and they are identified when used). It was decided that testing during the initial phase would be done with three sealers:
• Coal-tar (which has been used for years as a fuel resistant sealer), • LAS 320 (which was identified in the literature review (reported in Part I of this report) as
fuel-resistant sealer and • SS-1h asphalt emulsion which would not generally be classified as a non-fuel resistant
material. The coal tar and the SS-1h were chosen to provide control comparisons for the study. The LAS-320 is polymeric asphalt sealer produced by Enviroseal (1019 Holbrook Ct, Port St. Lucie, FL 34952). On the basis of the MSDS sheet provided with the product, it is classified as “practically non-toxic”. Some of the tests required caulking to restrain the kerosene to specific portions of the test specimens. For, example the outer edges of the permeability specimens were caulked to force the kerosene to flow through the specimen and not around the edges. In previous research studies it is was noted that silicone had been used for caulking or “sealing” the edges. To validate the stability of the silicone in the kerosene a sample of silicone was placed in a cup of kerosene for a period of 48 hours. At the end of the 48 hours it was noted, by visual inspection, that the silicone sealer was not affected by the kerosene. Therefore, it was used as the sealer for this study.
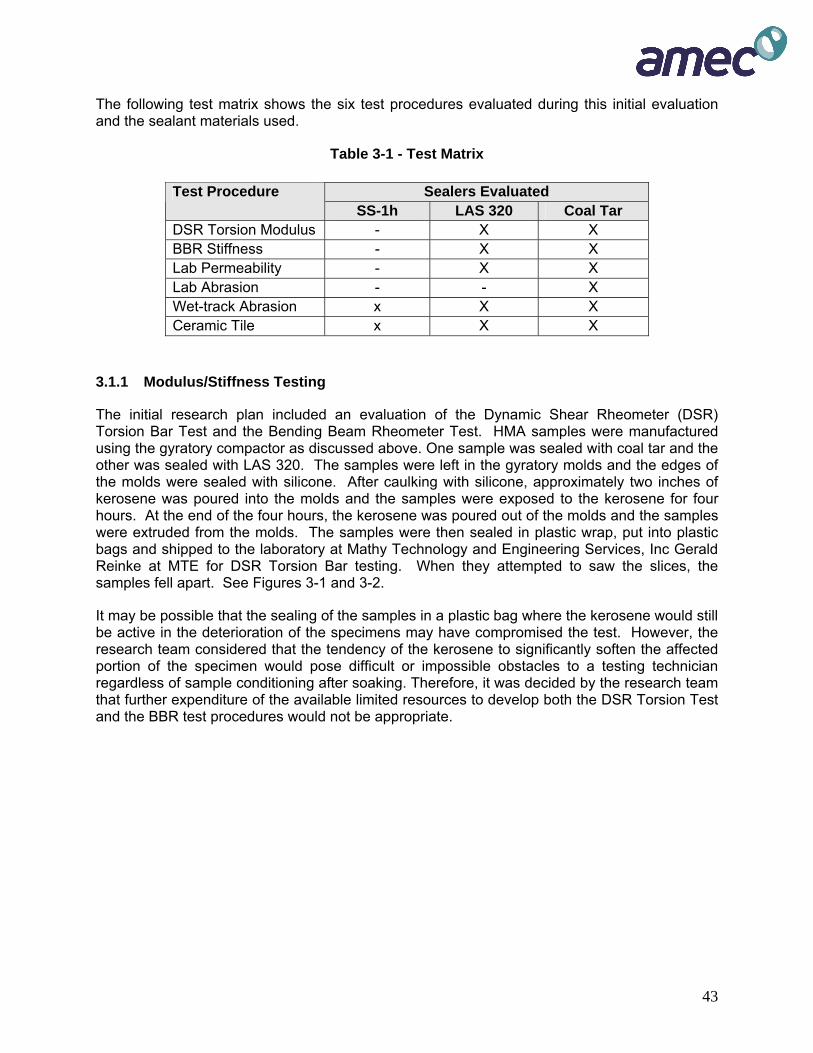
43
The following test matrix shows the six test procedures evaluated during this initial evaluation and the sealant materials used.
Table 3-1 - Test Matrix
Sealers Evaluated Test Procedure SS-1h LAS 320 Coal Tar
DSR Torsion Modulus - X X BBR Stiffness - X X Lab Permeability - X X Lab Abrasion - - X Wet-track Abrasion x X X Ceramic Tile x X X
3.1.1 Modulus/Stiffness Testing
The initial research plan included an evaluation of the Dynamic Shear Rheometer (DSR) Torsion Bar Test and the Bending Beam Rheometer Test. HMA samples were manufactured using the gyratory compactor as discussed above. One sample was sealed with coal tar and the other was sealed with LAS 320. The samples were left in the gyratory molds and the edges of the molds were sealed with silicone. After caulking with silicone, approximately two inches of kerosene was poured into the molds and the samples were exposed to the kerosene for four hours. At the end of the four hours, the kerosene was poured out of the molds and the samples were extruded from the molds. The samples were then sealed in plastic wrap, put into plastic bags and shipped to the laboratory at Mathy Technology and Engineering Services, Inc Gerald Reinke at MTE for DSR Torsion Bar testing. When they attempted to saw the slices, the samples fell apart. See Figures 3-1 and 3-2.
It may be possible that the sealing of the samples in a plastic bag where the kerosene would still be active in the deterioration of the specimens may have compromised the test. However, the research team considered that the tendency of the kerosene to significantly soften the affected portion of the specimen would pose difficult or impossible obstacles to a testing technician regardless of sample conditioning after soaking. Therefore, it was decided by the research team that further expenditure of the available limited resources to develop both the DSR Torsion Test and the BBR test procedures would not be appropriate.
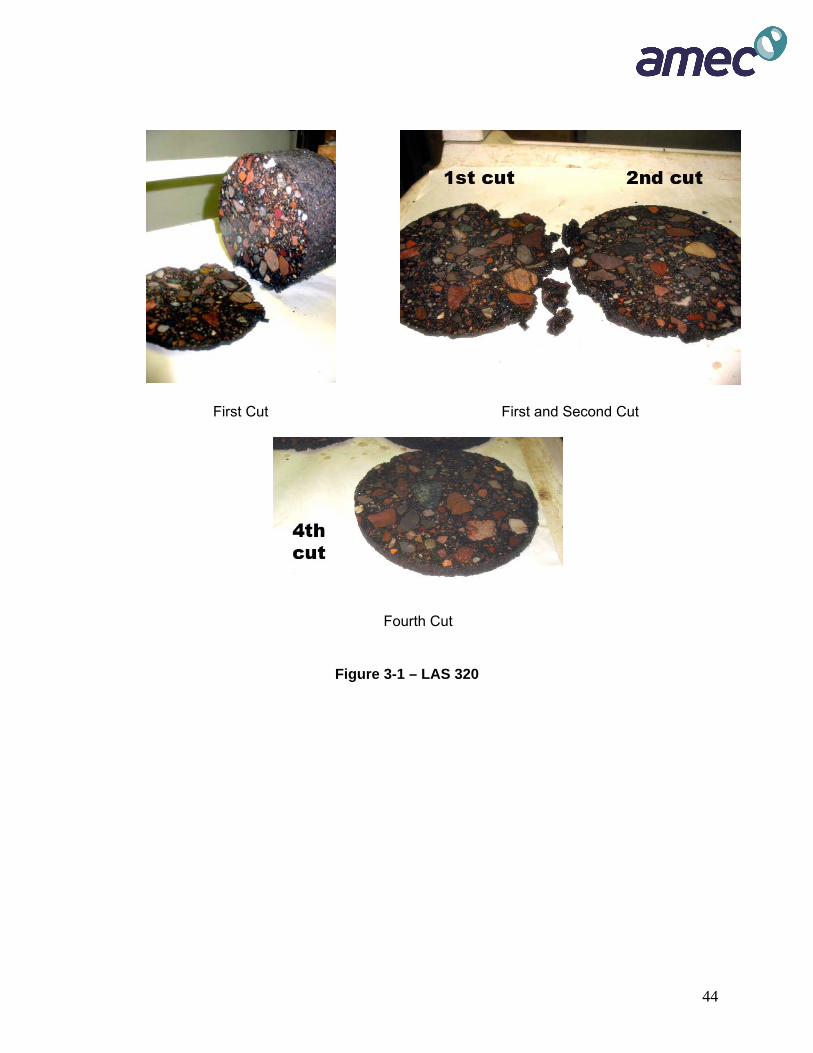
44
First Cut First and Second Cut
Fourth Cut
Figure 3-1 – LAS 320

45
Top Slice Second Cut
Third Cut
Figure 3-2 – Coal Tar

46
3.1.2 Abrasion Testing
Two tests were identified for abrasion resistance of sealers: an adaptation of a procedure developed by the Corps of Engineers and an adaptation of the slurry seal wet track abrasion test.
Gyratory Specimen HMA Abrasion Procedure with Pneumatic Tube
Six (6) 150 mm diameter gyratory specimens were manufactured. Six specimens were manufactured as shown in Table 3-2. Three specimens were manufactured using a PG 64-22 and three specimens were manufactured with a PG 76-28 The purpose of the testing was to determine if the loss by abrasion would be affected by the application rate of the sealer. The only sealer used was coal-tar. The application rates were no sealer, 0.18 gallons per square yard (or about 0.10 gallons per square yard of residual coal tar) and 0.36 gallons per square yard (or about 0.20 gallons per square yard of residual coal tar). The application rates (0.18 and 0.36) are slightly higher than used in the field. It was the feeling of the research team that this would be a good indicator of whether or not the test procedure could be used.
After application of the sealer, the specimens were cured and placed in a gyratory specimen mold. The side of the mold was caulked with silicone to prevent the kerosene from attacking the sides of the specimens. One inch of kerosene was placed in the mold above the sample. The kerosene was allowed to sit on the sample for four hours. At the end of the four hours, the kerosene was poured off, the sample removed and tested. The sample was mounted within a specially designed attachment for the Hobart mixer. The treated surface was subjected to abrasion by a free-floating rubber hose. The test was run for 15 minutes. Figure 3-3 shows the equipment setup. Weight loss due to abrasion was determined by weighing the specimen before and after testing.
\\\ Figure 3-3 – Setup for Abrasion Test with Pneumatic Tube

47
Table 3-2 – Results of Abrasion Testing with Pneumatic Tube
Sealer Rate
Untreated Tar – 0.18 Tar – 0.36 Untreated Tar – 0.18 Tar – 0.36
Base Asphalt
64-22 64-22 64-22 76-28 76-28 76-28
Start Soak 7:40 9:00 10:30 8:10 9:30 11:00 End Soak 11:40 1:00 2:30 12:10 1:30 3:00
Start Weight
4567.6 4654.8 4662.4 4427.4 4656.0 4650.4
End Weight 4558.1 4625.5 4658.6 4426.3 4651.6 4646.8 Wt. Loss (gm)
9.5 29.3 3.8 1.1 4.4 3.6
Percent Weight Loss
0.02 0.6 0.08 0.02 0.09 0.07
Loss Grams/SF
12.91 39.81 5.16 1.49 5.98 4.89
Note 1 – The 64-22 Sample with 0.10 tar included a rock dislodged off the outer edge by the abrasion tube Note 2 – All the wear on the abrasion tubes was only on one end. The results of this testing were inconsistent. In general the treated specimens had a lower loss than the untreated. The low percentage of loss for each sample was a concern. The research team was concerned about the repeatability of the test and therefore recommended that the use of this test with a pneumatic tube be suspended.
Gyratory Specimen HMA Abrasion Procedure with Wire Brush
The research team thought that the use of a wire brush instead of the pneumatic tube might improve the test procedure. Therefore a second study was done using a wire brush. The set up for the brush is shown in Figure 3-3. This test was done using a different technique that that done with the pneumatic tube. It was thought that this procedure would provide a better representation of what actually happens in the field.
The kerosene was applied to the surface of the specimen with a paint brush (thus simulating a fuel spill) and then the surface was abraded (simulating traffic). The testing was done on Superpave specimens with a 64-22 asphalt binder. .
Three samples were tested: one with no sealer or kerosene, one with no sealer and six cycles of kerosene applied at one hour prior to each cycle (this was to allow the sealer to soak into the surface) and one with 0.18 gallons per sq yd of coal tar applied

48
Figure 3-4 Set-up With Wire Brush
Table 3-3 shows the results of the testing after six cycles of testing and Figure 3-5 shows the tops of the specimens after abrasion testing:
Table 3-3 Results after Abrasion Testing with Wire Brush
Control
No Sealer or Kerosene
No Sealer or Kerosene
Six cycles of kerosene
brushed on 1 hour prior to each cycle
Coal Tar Sealer (0.1 gallons per sq yd
residual) Six cycles of kerosene
brushed on 1 hour prior to each cycle
Original Wt 1949.0 gms 1898.3 gms 1963.7 gms Final Wt 1948.2 gms 1887.2 gms 1962.4 gms
Percent Loss 0.04 1.11 .003
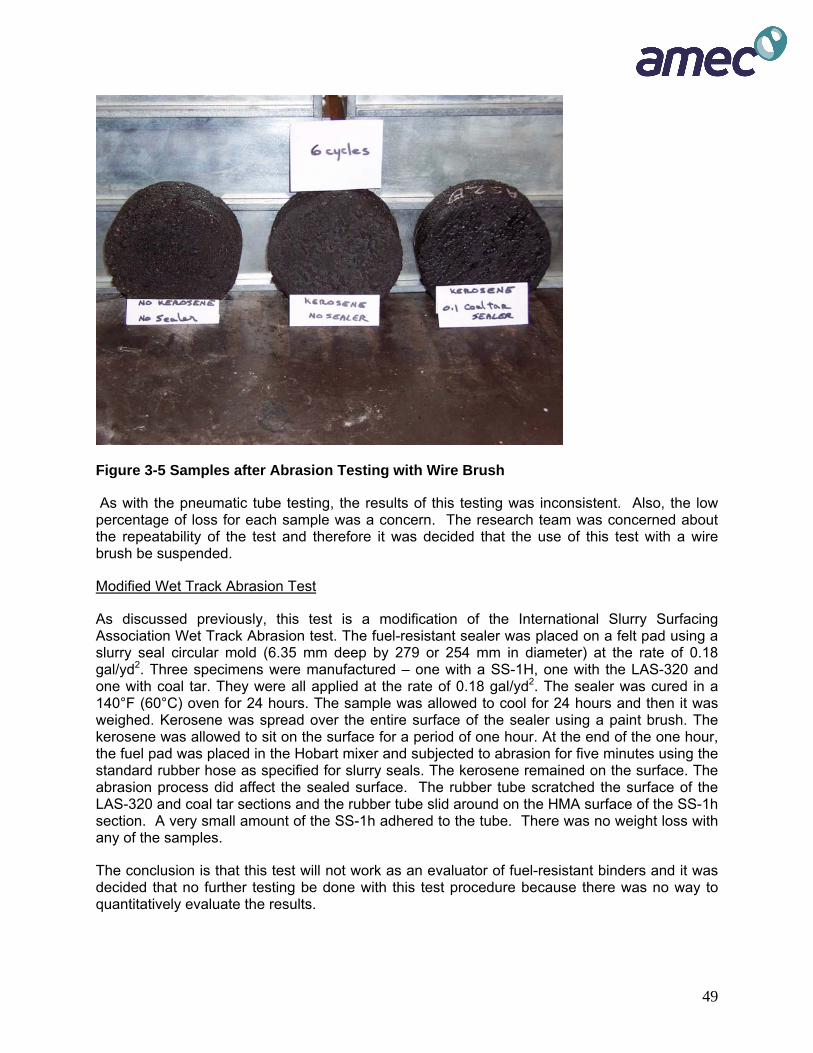
49
Figure 3-5 Samples after Abrasion Testing with Wire Brush
As with the pneumatic tube testing, the results of this testing was inconsistent. Also, the low percentage of loss for each sample was a concern. The research team was concerned about the repeatability of the test and therefore it was decided that the use of this test with a wire brush be suspended.
Modified Wet Track Abrasion Test
As discussed previously, this test is a modification of the International Slurry Surfacing Association Wet Track Abrasion test. The fuel-resistant sealer was placed on a felt pad using a slurry seal circular mold (6.35 mm deep by 279 or 254 mm in diameter) at the rate of 0.18 gal/yd2. Three specimens were manufactured – one with a SS-1H, one with the LAS-320 and one with coal tar. They were all applied at the rate of 0.18 gal/yd2. The sealer was cured in a 140°F (60°C) oven for 24 hours. The sample was allowed to cool for 24 hours and then it was weighed. Kerosene was spread over the entire surface of the sealer using a paint brush. The kerosene was allowed to sit on the surface for a period of one hour. At the end of the one hour, the fuel pad was placed in the Hobart mixer and subjected to abrasion for five minutes using the standard rubber hose as specified for slurry seals. The kerosene remained on the surface. The abrasion process did affect the sealed surface. The rubber tube scratched the surface of the LAS-320 and coal tar sections and the rubber tube slid around on the HMA surface of the SS-1h section. A very small amount of the SS-1h adhered to the tube. There was no weight loss with any of the samples.
The conclusion is that this test will not work as an evaluator of fuel-resistant binders and it was decided that no further testing be done with this test procedure because there was no way to quantitatively evaluate the results.

50
Figure 3-6 – Set up for Wet-Track Abrasion Test 3.1.3 Ceramic Tile Sealer Adhesion Test
The test procedure used is a modification of ASTM D2939. Small (3 inch by 3 inch) ceramic tiles purchased from a local home improvement store were used in this test. These tiles are fairly typical and were manufactured such that the top surface has a glazed finish and the bottom surface has is a porous surface apparently to enhance adhesion to the adhesive used in attaching the tile to the wall or counter top. The unglazed side of each of these tiles was treated with the sealer to be evaluated. For this initial experiment three sealers were used: LAS 320, coal tar and SS-1h. Sufficient sealer was placed to thoroughly coat the unglazed surface of the tiles. The tiles were placed in a 140oF (60°C) oven for twenty-four hours to cure the sealer. After cooling, each sample was submerged in kerosene for 24 hours, taken out, dried and photographed. The drying process consisted of dabbing the surface with a paper towel to remove the kerosene. Figures 3-7 to 3-9 document the results for this study.
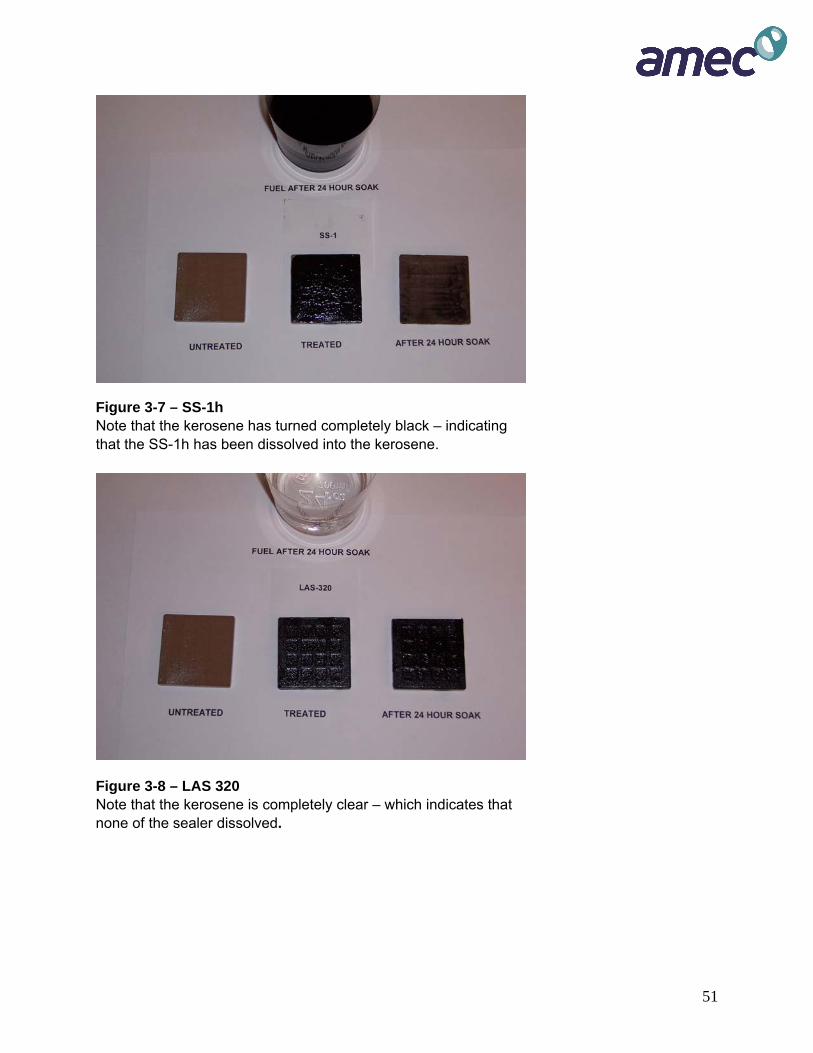
51
Figure 3-7 – SS-1h Note that the kerosene has turned completely black – indicating that the SS-1h has been dissolved into the kerosene.
Figure 3-8 – LAS 320 Note that the kerosene is completely clear – which indicates that none of the sealer dissolved.
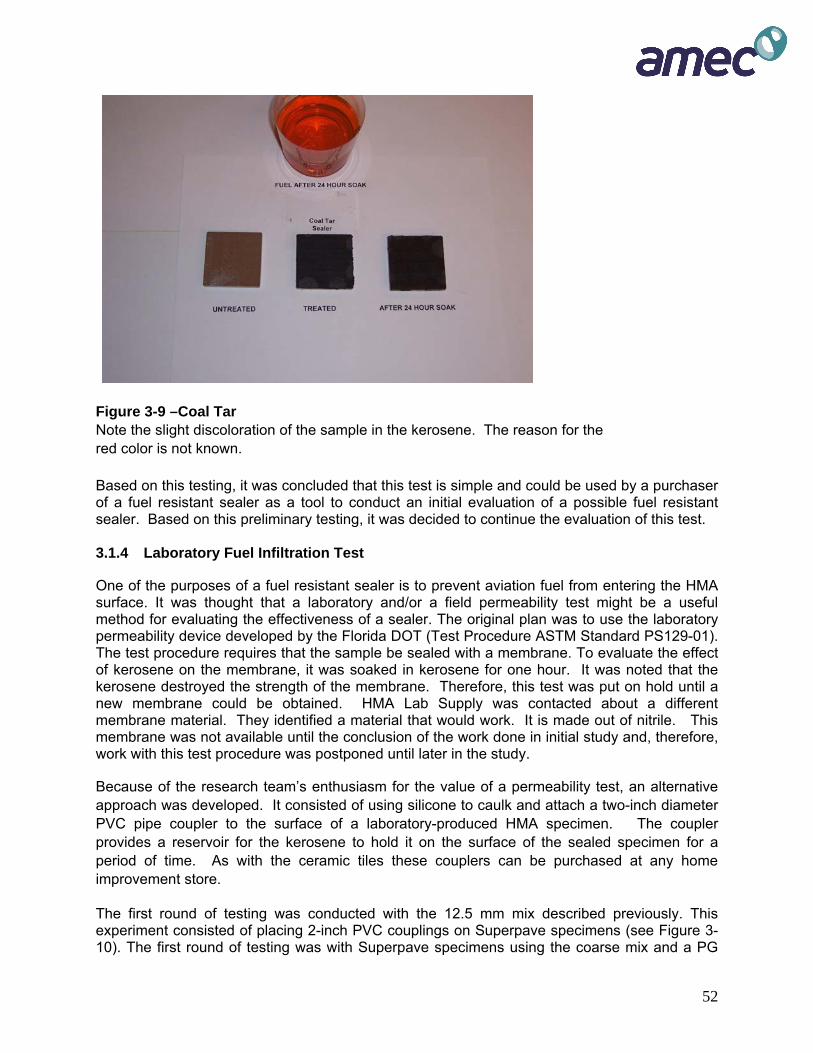
52
Figure 3-9 –Coal Tar Note the slight discoloration of the sample in the kerosene. The reason for the red color is not known. Based on this testing, it was concluded that this test is simple and could be used by a purchaser of a fuel resistant sealer as a tool to conduct an initial evaluation of a possible fuel resistant sealer. Based on this preliminary testing, it was decided to continue the evaluation of this test. 3.1.4 Laboratory Fuel Infiltration Test
One of the purposes of a fuel resistant sealer is to prevent aviation fuel from entering the HMA surface. It was thought that a laboratory and/or a field permeability test might be a useful method for evaluating the effectiveness of a sealer. The original plan was to use the laboratory permeability device developed by the Florida DOT (Test Procedure ASTM Standard PS129-01). The test procedure requires that the sample be sealed with a membrane. To evaluate the effect of kerosene on the membrane, it was soaked in kerosene for one hour. It was noted that the kerosene destroyed the strength of the membrane. Therefore, this test was put on hold until a new membrane could be obtained. HMA Lab Supply was contacted about a different membrane material. They identified a material that would work. It is made out of nitrile. This membrane was not available until the conclusion of the work done in initial study and, therefore, work with this test procedure was postponed until later in the study.
Because of the research team’s enthusiasm for the value of a permeability test, an alternative approach was developed. It consisted of using silicone to caulk and attach a two-inch diameter PVC pipe coupler to the surface of a laboratory-produced HMA specimen. The coupler provides a reservoir for the kerosene to hold it on the surface of the sealed specimen for a period of time. As with the ceramic tiles these couplers can be purchased at any home improvement store.
The first round of testing was conducted with the 12.5 mm mix described previously. This experiment consisted of placing 2-inch PVC couplings on Superpave specimens (see Figure 3-10). The first round of testing was with Superpave specimens using the coarse mix and a PG

53
64-22 binder compacted to approximately 6-7 percent air voids. The six specimens were treated as follows from left to right in the photo:
• No treatment • Treated with coal tar at the rate of 0.18 gallons per sq yd • Treated with LAS 320 at the rate of 0.18 gallons per sq yd • Treated with LAS 320 at the rate of 0.18 gallons per sq yd • Treated with LAS 320 at the rate of 0.36 gallons per sq yd • Treated with LAS 320 at the rate of 0.36 gallons per sq yd
Figure 3-10 - Specimens Ready for Testing After each treatment, the specimens were cured for 24 hours in an oven at 140oF. On the specimens with the heavy application rates (0.36 gallons per sq yd) it was applied in two applications of 0.18 gallons per sq yd each. Each application was cured prior to the next application.
White paper towels were placed below the specimens and attached to the side of the specimens with rubber bands. The paper towels were intended to assist in making visual observations of the movement of kerosene through or around thee HMA specimens.
The PVC pipe couplers were glued and caulked to the top of the specimen with the silicone. The surface of the specimens contained some surface voids and there was a concern about the effectiveness of the silicone. Therefore, prior to placing the kerosene in the PVC pipe coupler, water was placed in the coupler, and the specimen observed to determine if there were any leaks at the interface between PVC pipe coupler and the surface of the specimen. If there were any noticeable leaks additional silicone was placed on the specimen. These steps were repeated as necessary until the integrity of the caulking was validated.

54
After the specimen was treated and the PVC pipe coupler attached, and the system validated the kerosene was poured in the coupler. It was poured to the level of the circular ridge at the mid-height of the coupler (two inches deep). See Figure 3-11. Note the silicone around the bottom of the PVC pipe coupler.
. Figure 3-11 – Kerosene Being Poured into the PVC Pipe Coupler

55
The kerosene was allowed to sit in the PVC pipe coupler for a period of four hours. Figures 3-12 to 3-19 show the results for each of the treatments.
o No Treatment
Figure 3-12 – Untreated at Five Minutes: Note seepage through side of specimen.
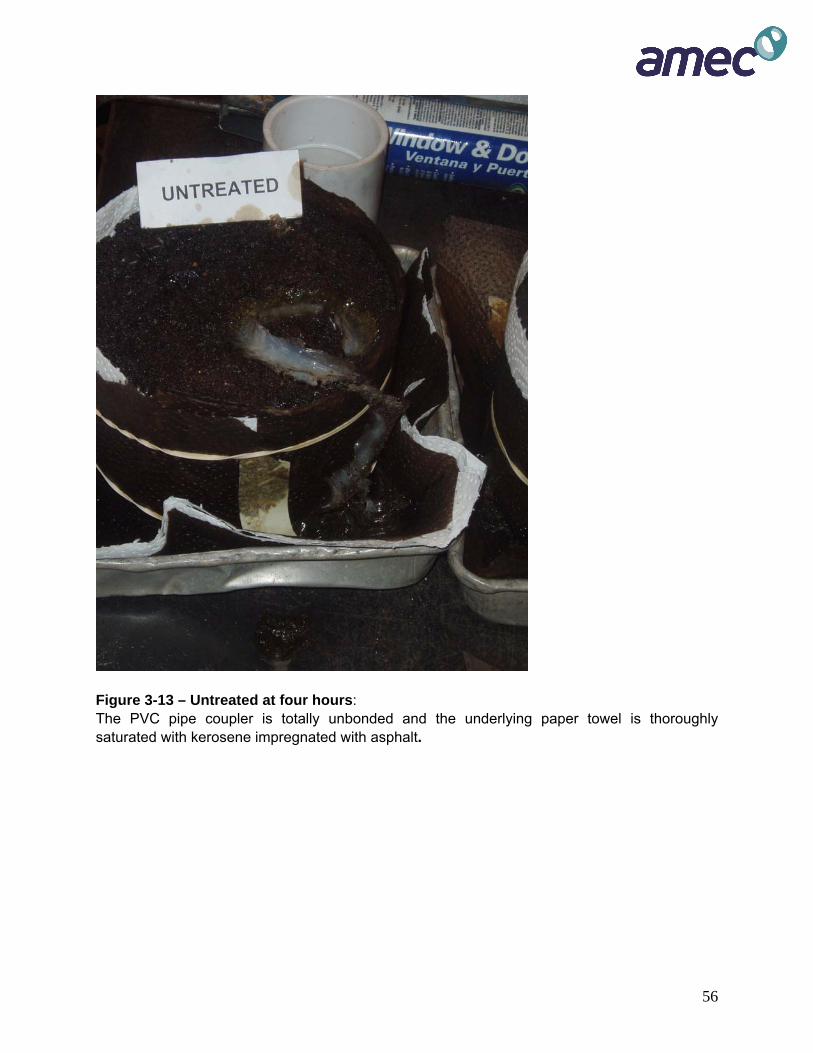
56
Figure 3-13 – Untreated at four hours: The PVC pipe coupler is totally unbonded and the underlying paper towel is thoroughly saturated with kerosene impregnated with asphalt.
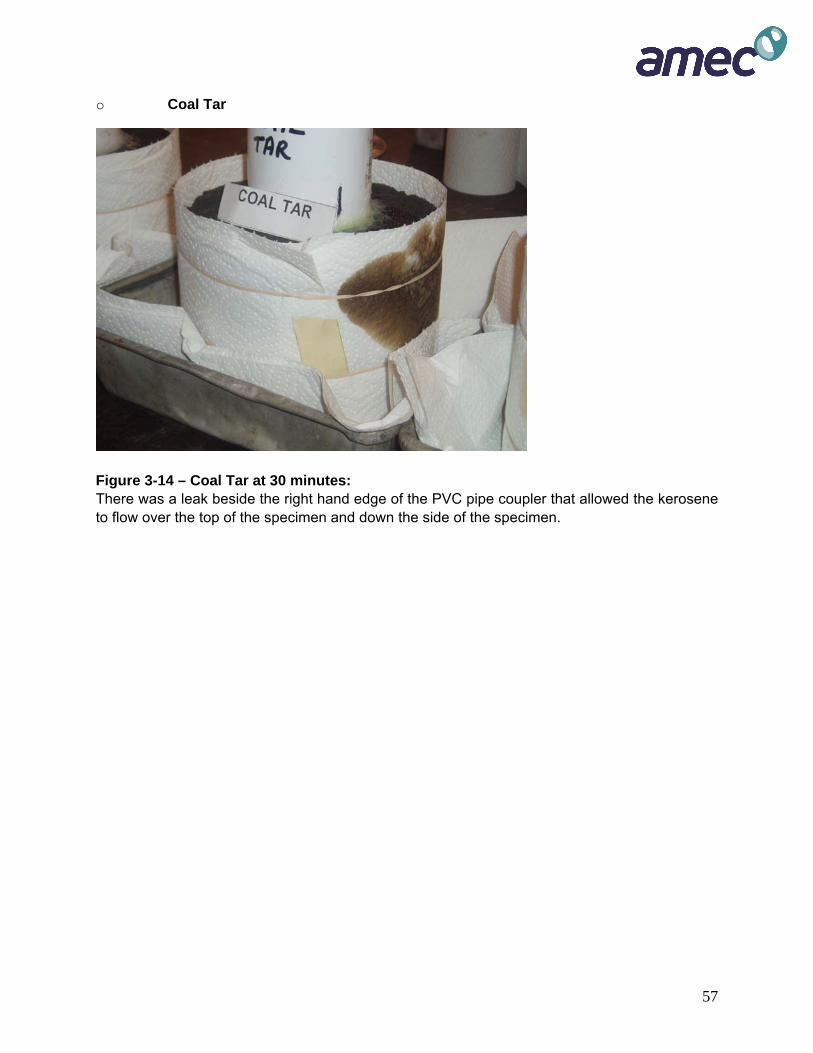
57
o Coal Tar
Figure 3-14 – Coal Tar at 30 minutes: There was a leak beside the right hand edge of the PVC pipe coupler that allowed the kerosene to flow over the top of the specimen and down the side of the specimen.

58
Figure 3-15 – The coal tar test after four hours. The failure here is due to the leak along side of the PVC pipe coupler. Note the paper towel is totally saturated both on the sides and on the bottom of the specimen, but the PVC pipe coupler was still attached to the specimen.

59
o 0.18 Gallons per Square Yard of LAS 320
Figures 3-16 & 3-17 – LAS 320 with 0.18 gal/sy after four hours: Note the slight staining of the specimens on the side and very little at the bottom of the specimen on the lower specimen.

60
o 0.36 Gallons per Square Yard of LAS 320
Figures 3-18 and 3-19 – LAS 320 with 0.36 gallons per sq yd.
Note the lack of staining on the bottom of both specimens but that sides of both specimens are staining. This would indicate that the LAS 320 at this application rate is probably of value when applied at this higher rate.
Based on the experience with the testing shown above, it was determined that this test had promise for evaluating fuel-resistant sealers. Additional testing was conducted to refine the procedure and to address some of the difficulties encountered in the initial testing.
Leakage under the PVC pipe coupler was particularly troubling in the initial series of tests. It was decided to repeat the test with a finer mix (4.75 mm). Another refinement was to cut a small groove in the specimen of the same the diameter as the PVC pipe coupler (2 inches) and insert the coupler into the groove. The specimens were treated with sealant prior to cutting the groove. The grove was cut with a 2-inch core barrel. After grooving, the groove was sealed with the fuel-resistant sealant. The five specimens were treated and tested – both grooved and ungrooved as follows:
• No treatment • Treated with coal tar at the rate of 0.18 gallons per sq yd

61
• Treated with coal tar at the rate of 0.36 gallons per sq yd • Treated with LAS 320 at the rate of 0.18 gallons per sq yd • Treated with LAS 320 at the rate of 0.36 gallons per sq yd
Figures 3-20 through 3-24 show the results of the testing with the revised test procedure.
Figure 3-20 - Permeability Test Set Up

62
Figure 3-21 - Kerosene Level at One Hour The kerosene has completely drained through the untreated specimens
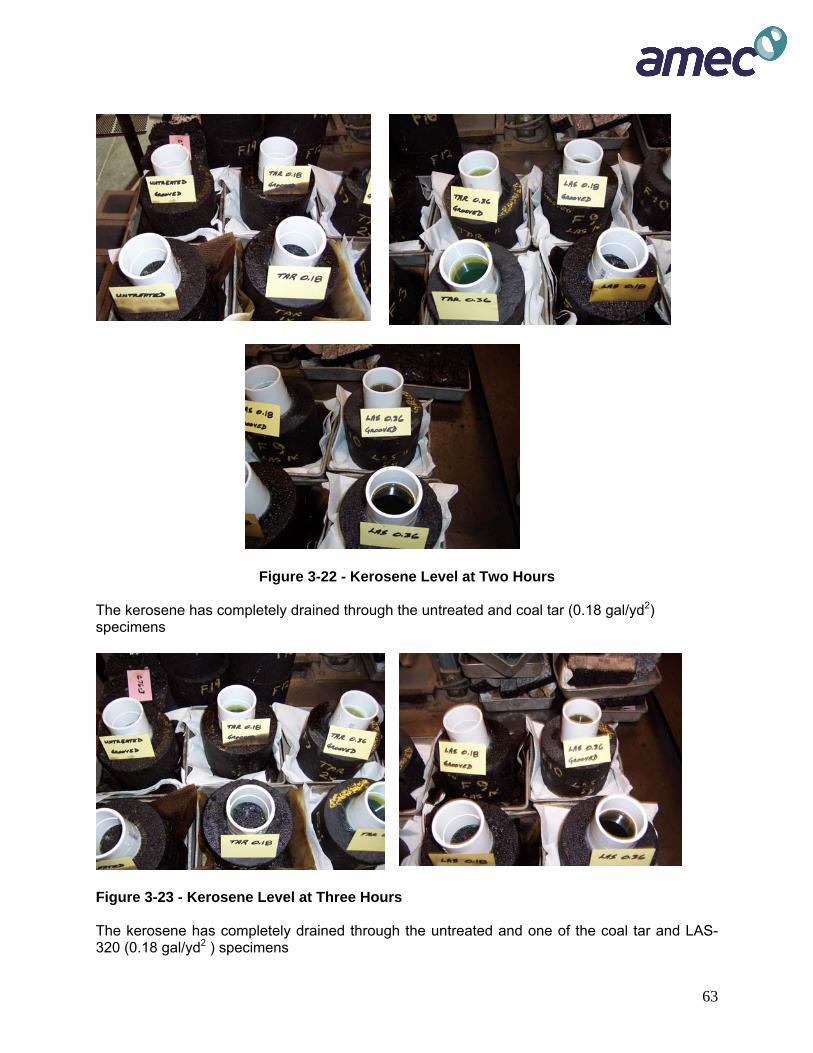
63
Figure 3-22 - Kerosene Level at Two Hours The kerosene has completely drained through the untreated and coal tar (0.18 gal/yd2) specimens
Figure 3-23 - Kerosene Level at Three Hours The kerosene has completely drained through the untreated and one of the coal tar and LAS-320 (0.18 gal/yd2 ) specimens
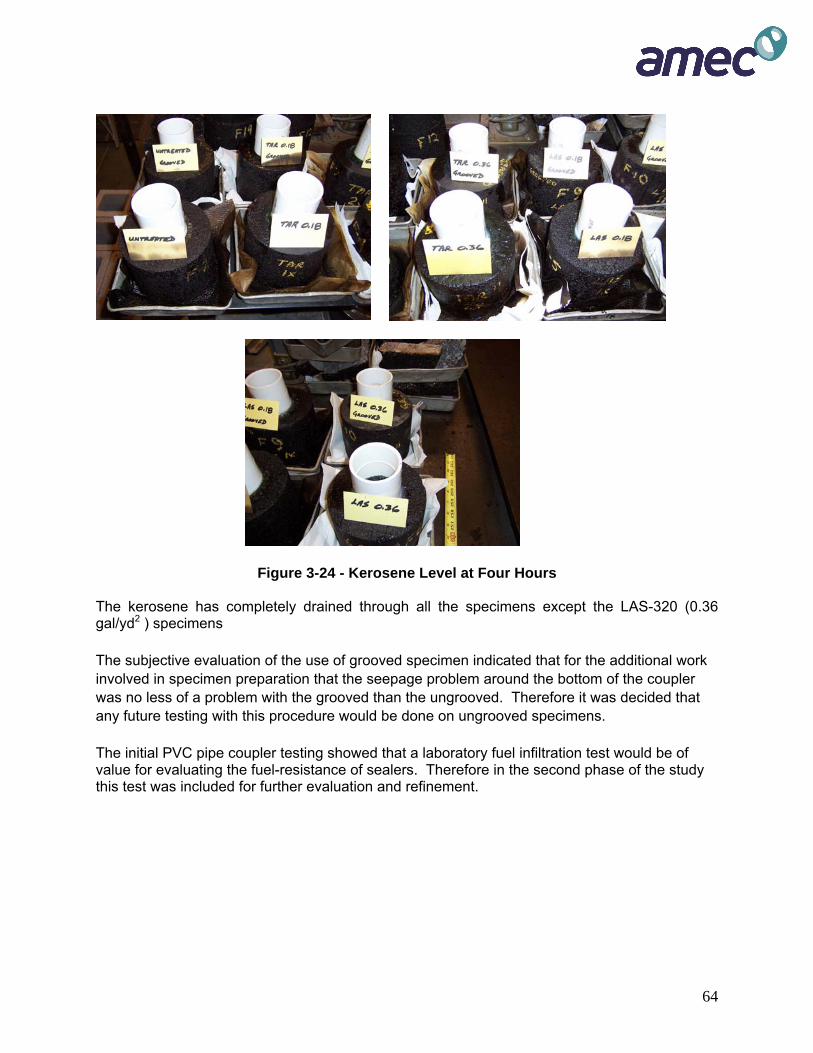
64
Figure 3-24 - Kerosene Level at Four Hours
The kerosene has completely drained through all the specimens except the LAS-320 (0.36 gal/yd2 ) specimens The subjective evaluation of the use of grooved specimen indicated that for the additional work involved in specimen preparation that the seepage problem around the bottom of the coupler was no less of a problem with the grooved than the ungrooved. Therefore it was decided that any future testing with this procedure would be done on ungrooved specimens. The initial PVC pipe coupler testing showed that a laboratory fuel infiltration test would be of value for evaluating the fuel-resistance of sealers. Therefore in the second phase of the study this test was included for further evaluation and refinement.

65
3.2 FURTHER STUDY AND REFINEMENT OF SELECTED LABORATORY PROCEDURES On the basis of the preliminary work a more detailed study was conducted to further develop and refine the laboratory and field test procedures. The goal was to develop procedures that could be used by airfield engineers and airport managers to evaluate if products that are proposed as a fuel resistant sealer would provide the desired fuel resistance and protection from fuel spills. As stated earlier one of the study objectives was to keep the test procedure as simple and straight forward as possible to provide airport managers an easy way to evaluate the claims of a supplier purporting that they have a fuel resistant sealer. Four test procedures from initial study were selected for refinement and further investigation in the final study. The procedures included were::
• Ceramic Tile Sealer Adhesion Test • Laboratory Fuel Permeability Test • Laboratory Fuel Infiltration Test • Rapid Field Fuel Infiltration Test
A series of sealant products were tested using each of the four tests. The intent was to gain insight on the value of the procedures by comparing rankings of the products and by assessing the sensitivity of the test results to the different sealers. The following sealers were evaluated during Phase II:
SS-1h -- Control Coal Tar – Known fuel resistant material which also provided a control material LAS – 320 Manufactured by EnviroSeal – An acrylic material being marketed as a fuel
resistant sealer Blacklidge CarbonPlex manufactured by Blacklidge Emulsions – Being marketed as a
fuel resistant sealer TRMSS (Tire Rubber Modified Sealer) manufactured by SealMaster – as asphalt based
sealer that has been reported to have fuel resistant properties. It was decided that the residual rate for each of the sealers should be the same. Therefore for each of the materials the residual binder in each sealer was determined. The results of the residual testing showed that the residual for the five materials ranged from 0.53 and 0.58. All five of the sealers had approximately the same residual value therefore, it was decided that they could be applied to the surface of the test specimen at the same rate. 3.2.1 Ceramic Tile Sealer Adhesion Test In the initial phase of this study the ceramic tile test was shown to be a simple initial screening test that could be conducted by an airport manager or other airport employee to evaluate the claims of a prospective supplier. Therefore, it was decided that further testing would be done in the final phase of the project with all of the sealers.

66
Overview This laboratory test was intended to evaluate if a sealant has a tendency to dissolve or soften in the presence of fuels. The sealant to be tested was applied to the absorptive side of a ceramic tile specimen. The coated specimen was placed in a beaker of kerosene and observed to see if the sealant dissolved or softened. The research team was concerned about whether kerosene (which is easily obtained) would provide the same results as an aviation fuel. Therefore, a sample of JPA jet fuel was obtained from a local petroleum distributor and a series of tests were conducted to compare the results using kerosene and JPA jet fuel. Materials and Equipment
● Sealants. ● Kerosene
• JPA jet fuel ● 1000ml beaker ● Fume Hood ● Ceramic Tile ● Clock Sample Preparation This test used uncoated and unglazed surfaces of clay tiles with water absorption of approximately 10 percent. One foot square tiles were obtained from a home improvement center and cut into a 3” by 3” sample sizes. On one face, the sealer being tested was applied in sufficient amount to completely coat the surface and then cured at 140˚ F overnight. It was then allowed to cool to room temperature. Test Procedure Using a container of suitable shape and size to allow the specimen to be placed upright on its edge, the coated tile was immersed in the test fluid. This test series utilized 1000 ml beakers; each received 600 ml of the fuel being tested. Each sealer was placed on two tiles, one was then placed in a container with kerosene, and the second was placed in a container with JPA jet fuel. On each of the tiles a paper clamp was attached to the tile to ease the insertion of the sample in the fuel (kerosene or jet fuel). See Figure 3-25 for how the samples were clipped to the specimen. The samples were placed in the fuel (see Figure 3-26).

67
Figure 3-25 – Samples clipped to paper clamp
Figure 3-26- Samples placed in the fluid (the sample on right is kerosene, and the sample on left is jet fuel) The test was run for one hour. The specimens were removed and allowed to drain for 15 minutes at an approximate 75˚ angle. See Figure 3-27.
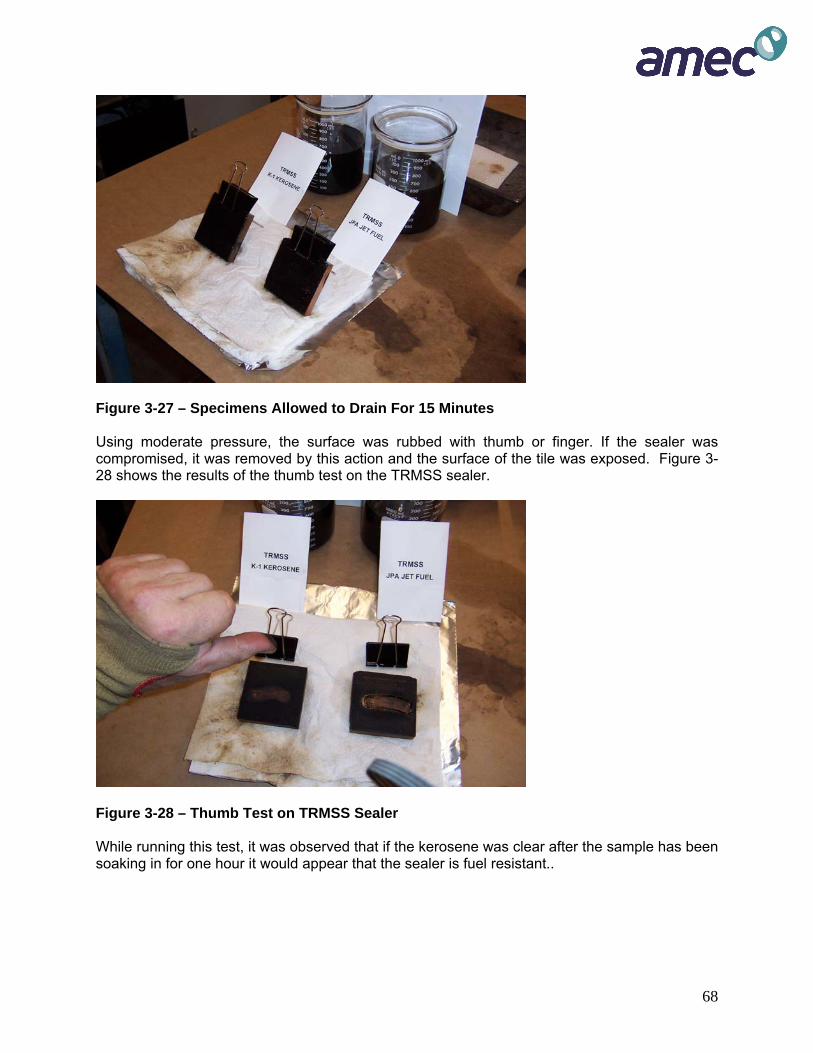
68
Figure 3-27 – Specimens Allowed to Drain For 15 Minutes Using moderate pressure, the surface was rubbed with thumb or finger. If the sealer was compromised, it was removed by this action and the surface of the tile was exposed. Figure 3-28 shows the results of the thumb test on the TRMSS sealer.
Figure 3-28 – Thumb Test on TRMSS Sealer While running this test, it was observed that if the kerosene was clear after the sample has been soaking in for one hour it would appear that the sealer is fuel resistant..
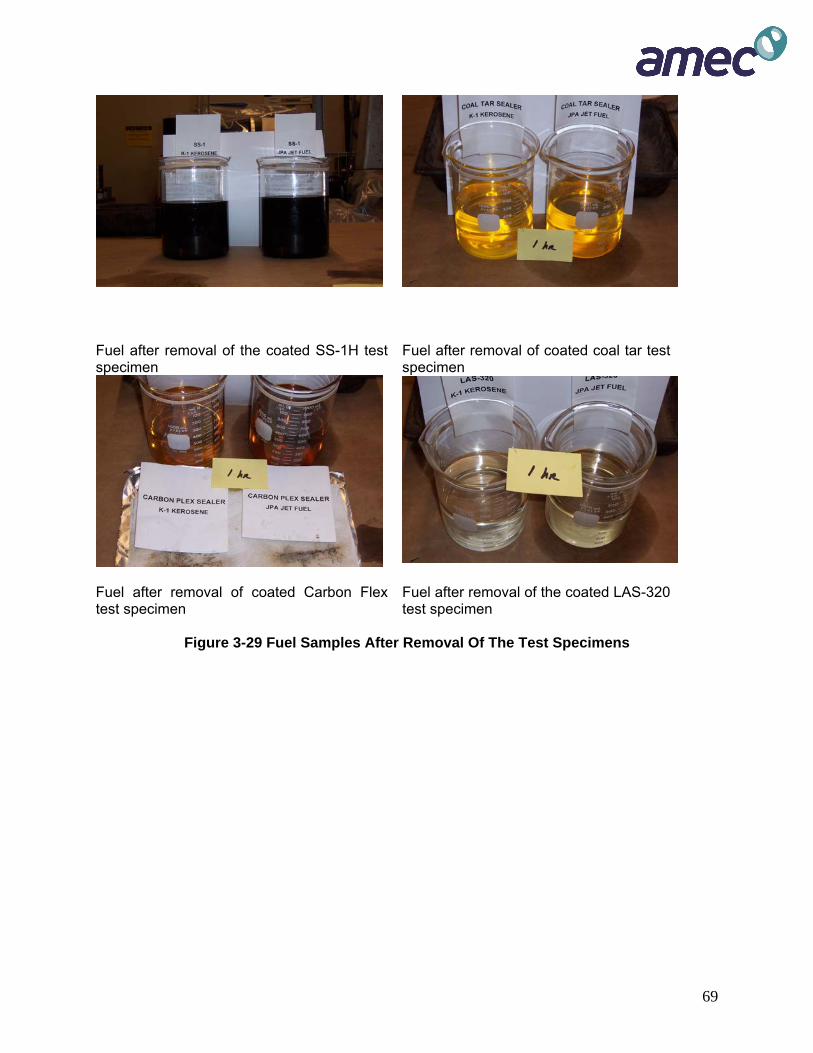
69
Fuel after removal of the coated SS-1H test specimen
Fuel after removal of coated coal tar test specimen
Fuel after removal of coated Carbon Flex test specimen
Fuel after removal of the coated LAS-320 test specimen
Figure 3-29 Fuel Samples After Removal Of The Test Specimens

70
Results/Discussion As expected, the SS-1H sealer showed minimal, if any, resistance to either the kerosene or JPA jet fuel. The TRMSS and CarbonPlex sealers also showed minimal resistance albeit slightly better than the SS-1H. The Coal Tar Sealer and LAS 320 performed, as anticipated, very well. LAS 320 produced no discoloration to either the kerosene or JPA and demonstrated no loss after rubbing. The Coal Tar Sealer produced minor discoloration of the kerosene and JPA jet fuel, but only had minor “thumb” disruption with no tile visible after rubbing. Upon completion of the soaking and “rub test” each tile was broken in order to view sealer absorption and/or infiltration. This resulted in no discernable evidence of either. There was no difference in the test results when either the JPA jet fuel or the kerosene was used. Conclusions Based on the testing discussed above it is concluded that the ceramic tile sealant adhesion test can be used to determine if a sealer is fuel resistant. 3.2.2 Laboratory Fuel Permeability Test Overview Based on the work done in the initial phase of the study, it was thought that a permeability test could be used for the evaluation of the fuel resistance of a potential fuel resistant sealer. It was also thought that if a standard ASTM test procedure with some modification could be used it would provide an excellent test procedure. It was thought that ASTM PS 129-01 (see figure 3-32) developed by the Florida DOT would provide such a procedure. For this study the test procedure consists of using a laboratory-prepared specimen, encapsulating it in a membrane, and then putting the encapsulated sample in a laboratory permeameter and determining the falling head permeability of the sample. The standard membrane dissolves in kerosene and therefore, a nitrile membrane was obtained and used for this testing.
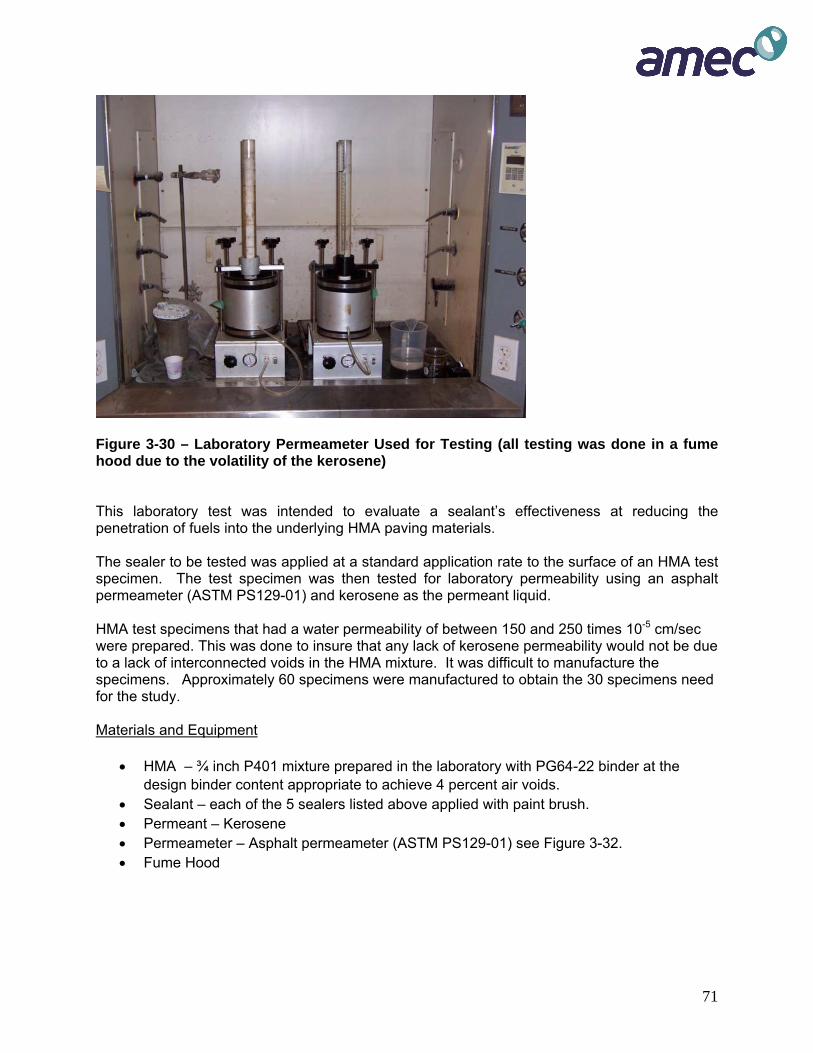
71
Figure 3-30 – Laboratory Permeameter Used for Testing (all testing was done in a fume hood due to the volatility of the kerosene) This laboratory test was intended to evaluate a sealant’s effectiveness at reducing the penetration of fuels into the underlying HMA paving materials. The sealer to be tested was applied at a standard application rate to the surface of an HMA test specimen. The test specimen was then tested for laboratory permeability using an asphalt permeameter (ASTM PS129-01) and kerosene as the permeant liquid. HMA test specimens that had a water permeability of between 150 and 250 times 10-5 cm/sec were prepared. This was done to insure that any lack of kerosene permeability would not be due to a lack of interconnected voids in the HMA mixture. It was difficult to manufacture the specimens. Approximately 60 specimens were manufactured to obtain the 30 specimens need for the study. Materials and Equipment
• HMA – ¾ inch P401 mixture prepared in the laboratory with PG64-22 binder at the design binder content appropriate to achieve 4 percent air voids.
• Sealant – each of the 5 sealers listed above applied with paint brush. • Permeant – Kerosene • Permeameter – Asphalt permeameter (ASTM PS129-01) see Figure 3-32. • Fume Hood

72
Sample Preparation
Superpave gyratory specimens were used for this study. They were four inches high and prior to accomplishing the permeability testing and treating of the specimens the top ½ inch and the bottom ½ inch of each specimen was sliced off. Also prior to coating, each of the specimens was tested to determine its permeability with water. All of the specimens met the criteria of 150 and 250 times 10-5 cm/sec. This range was chosen to insure that the mixes were permeable. The specimens were then sorted so that each set of 3 would have roughly the same average permeability. It was very difficult to obtain samples with the required permeability. To obtain the 30 samples needed to conduct this testing it was necessary to prepare 62 samples. Test Procedure The final specimens were coated with each of the five sealers. They were applied at two different rates:
• 0.18 gallons per square yard (this provides a residual rate of 0.10 gallons per square yard)
• 0.36 gallons per square yard (this provides a residual rate of 0.20 gallons per square yard)
After coating, the permeability of each of the specimens was determined in accordance with ASTM PS 129-01 except a nitrile membrane was used and kerosene was substituted for water in the procedure. Test Results The test results for all of the testing is shown in Table 3-4

73
Table 3-4 – Results of Laboratory Fuel Permeability Testing RECAP OF PERMEABILITY TESTING ON PURPOSE BUILT* HMA SPECIMENS ( * MIX DESIGNED, COMPACTED AND TESTED TO OBTAIN PERMEABILITY OF 150 TO 250 X 10^-5 cm/sec) Group Specimen Water Average Kerosene Average
# Sealant Used #
# of Coats Perm. Water Perm. Kerosene
Perm. Perm. Notes: 1 Coal tar 1 1 181 0 Test concluded after one hour with no drop in fluid height.
" 21 1 246 10 Test concluded at 49 min., 48 sec. " 27 1 183 203 9.6 6.5 Test concluded at 51 min., 29 sec. with 25cm fluid drop.
1A Coal Tar 15 2 218 30 Rock was dislodged during sealing, probably causing fluid drop. " 18 2 152 0 Test concluded at 60 min. with no drop in fluid level. " 10 2 216 195 0 10.0 Test concluded at 60 min. with no drop in fluid level.
2 TRMSS 7 1 244 60 Times increased significantly on successive trials, test terminated. " 9 1 154 25 Times increased significantly on successive trials, test terminated. " 11 1 219 206 110 65.0 Times increased significantly on successive trials, test terminated.
2A TRMSS 2 2 216 1.9 Test was halted after 60 minutes with a total fluid drop of 6.6 cm. " 3 2 179 0.13 Test halted at 60 minutes with total fluid drop of 0.4 cm. " 17 2 186 194 0.26 0.8 Test halted at 60 minutes with total fluid drop of 0.9 cm.
3 LAS 320 8 1 155 0.75 Test halted at 40 minutes with a fluid drop of 2.2cm. " 22 1 212 3.7 Test halted at 60 minutes with a total fluid drop of 13.9cm. " 24 1 191 186 10 4.8 Test halted at 60 minutes with total fluid drop of 21.4cm on second run.

74
Group
#
Sealant Used
Specimen #
# of Coats
Water Perm.
Average Water Perm.
Kerosene Perm
Average Kerosene
Perm. 3A LAS 320 5 2 223 20 Test halted after two trials both required 20+minutes to drop 25cm.
" 12 2 178 0.28 Test halted at 60 minutes with a total fluid drop of 1.0cm. " 13 2 243 215 1.4 7.2 Test halted at 60 minutes with a total fluid drop of 5.9cm.
4 CarbonPlex 23 1 232 63 0
" 26 1 199 5.9 Test halted at 45 minutes with a total fluid drop of 17.1cm. " 29 1 191 207 9.9 26.3 Test halted at 49 minutes with a fluid drop of 25cm.
4A CarbonPlex 4 2 174 0.5 Test halted at 60 minutes with a total fluid drop of2.5cm.
" 19 2 158 3.6 Second run halted at 60 minutes with a total fluid drop of 13.5cm. " 30 2 241 191 2.4 2.2 Test halted at 60 minutes with a total fluid drop of 9.6cm.
5 SS-1H 6 1 192 89 Test concluded after four high fluid drop runs. " 16 1 234 44 Test halted due to doubling of time lapse between first and second runs. " 25 1 164 197 3.4 45.5 Test halted at 60 minutes with a total fluid drop of 12.7cm.
5A SS-1H 14 2 164 0.21 Test halted at 60 minutes with total fluid drop of 0.5cm. " 20 2 233 8.2 Test was halted after 25cm fluid drop. Time required 1h 2m 5s. " 28 2 195 197 2 3.5 Test halted after 60 minutes with a total fluid drop of 8.3cm. Observation with primary regard to the LAS 320:
LAS 320 is a low viscosity liquid allowing it to permeate through specimens with, by intent, higher than "normal" permeabilities. This may or may not have contributed to the resultant permeability of the treated specimens. In other words the surface was not completely sealed. Conversely, other products, such as the Coal Tar and CarbonPlex, with their relatively high viscosity and, to a lesser degree, the TRMSS and the SS-1H could also have influenced the results.

75
Analysis/Discussion To insure that the water permeability of the specimens did not vary between the sets, an analysis of variance was conducted on the test results. (Table 3-5) confirm that there is no significant difference between original sample permeabilities.
Table 3-5 - Pooled Analysis Of Variance Of Water Permeability Samples
Statistics Values
Average 199.1 Variance 935.07 F 0.01572 P-value 0.90112 F crit 4.19598 Difference NON-SIGNIFICANT
Single coat of sealer – Table 3-6 indicates that there was no statistically significant difference between the permeability values for sealants used in the study. This means that the permeability values for kerosene-immersed single-coated samples were unaffected by the type of sealant chosen; whether it is Coal Tar or SS-1h. It can also be seen that the average permeability values ranged from as high as 65.00 for TRMSS to as low as 4.82 for LAS 320. It may be noted that the variances for certain types of sealants were very high compared to others.
Table 3-6 - Analysis Of Variance Of Kerosene Permeability - Single-Coated Samples -
Type of Sealant Specimen
Coal Tar TRMSS LAS320 Carbon Plex SS-1h 1 0.00 60.00 0.75 63.00 89.00 2 10.00 25.00 3.70 5.90 44.00 3 9.60 110.00 10.00 9.90 3.40 Average 6.53 65.00 4.82 26.27 45.47 Variance 32.05 1825.00 22.33 1016.00 1833.45 F 2.11123 P-value 0.15407 F crit 3.47805 Difference NO SIGNIFICANT DIFFERENCE
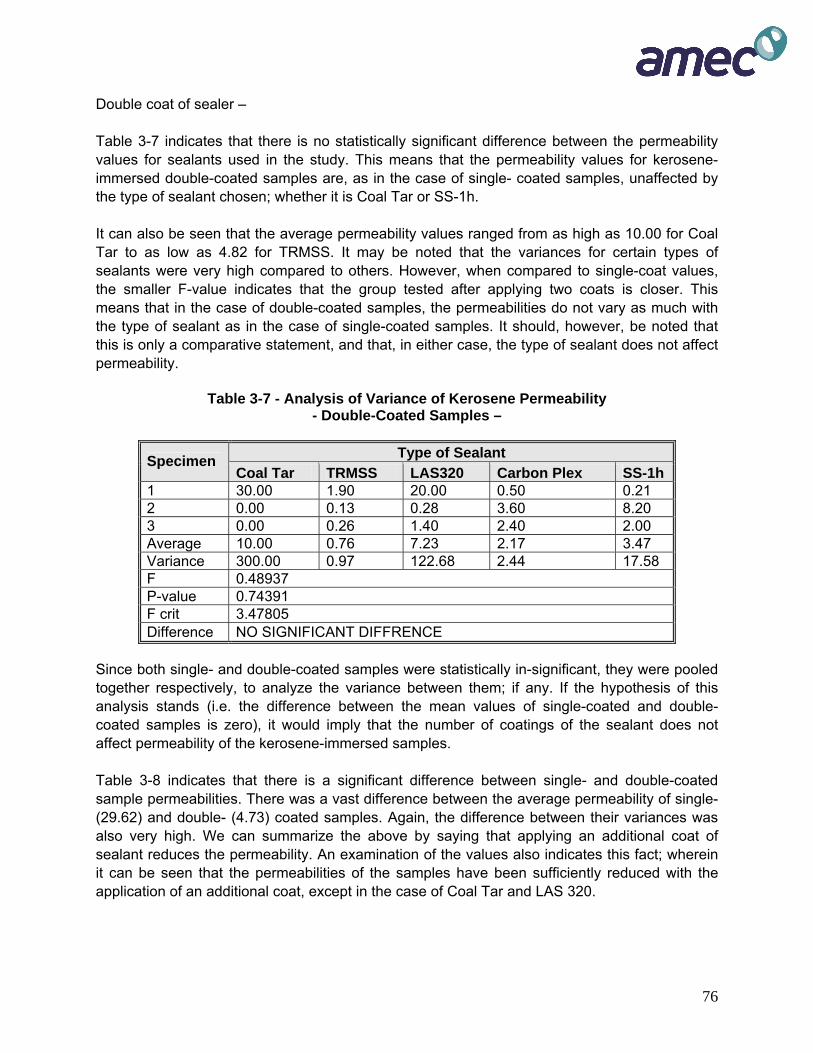
76
Double coat of sealer – Table 3-7 indicates that there is no statistically significant difference between the permeability values for sealants used in the study. This means that the permeability values for kerosene-immersed double-coated samples are, as in the case of single- coated samples, unaffected by the type of sealant chosen; whether it is Coal Tar or SS-1h. It can also be seen that the average permeability values ranged from as high as 10.00 for Coal Tar to as low as 4.82 for TRMSS. It may be noted that the variances for certain types of sealants were very high compared to others. However, when compared to single-coat values, the smaller F-value indicates that the group tested after applying two coats is closer. This means that in the case of double-coated samples, the permeabilities do not vary as much with the type of sealant as in the case of single-coated samples. It should, however, be noted that this is only a comparative statement, and that, in either case, the type of sealant does not affect permeability.
Table 3-7 - Analysis of Variance of Kerosene Permeability - Double-Coated Samples –
Type of Sealant Specimen
Coal Tar TRMSS LAS320 Carbon Plex SS-1h 1 30.00 1.90 20.00 0.50 0.21 2 0.00 0.13 0.28 3.60 8.20 3 0.00 0.26 1.40 2.40 2.00 Average 10.00 0.76 7.23 2.17 3.47 Variance 300.00 0.97 122.68 2.44 17.58 F 0.48937 P-value 0.74391 F crit 3.47805 Difference NO SIGNIFICANT DIFFRENCE
Since both single- and double-coated samples were statistically in-significant, they were pooled together respectively, to analyze the variance between them; if any. If the hypothesis of this analysis stands (i.e. the difference between the mean values of single-coated and double-coated samples is zero), it would imply that the number of coatings of the sealant does not affect permeability of the kerosene-immersed samples. Table 3-8 indicates that there is a significant difference between single- and double-coated sample permeabilities. There was a vast difference between the average permeability of single- (29.62) and double- (4.73) coated samples. Again, the difference between their variances was also very high. We can summarize the above by saying that applying an additional coat of sealant reduces the permeability. An examination of the values also indicates this fact; wherein it can be seen that the permeabilities of the samples have been sufficiently reduced with the application of an additional coat, except in the case of Coal Tar and LAS 320.

77
Table 3-8 - Pooled Analysis Of Variance Of Kerosene Permeability Samples
Coating Statistics
Single Double Average 29.62 4.73 Variance 1246.04 75.79 F 7.03090 P-value 0.01304 F crit 4.19599 Difference SIGNIFICANT
Conclusions Based on the test results developed and presented above, it was decided not to continue with this test procedure for the following reasons:
• Of the difficulty associated with the preparation of the test specimens. The goal was to develop a test procedure that would be easy to implement.
• Inconsistency in test results for a particular material. • That the statistical analysis did not show a significant difference between the results for
the different materials. • It may be possible to use this test procedure; but, the resources available for this project
precluded any further development of the procedure. 3.2.3 Laboratory Fuel Infiltration Test Overview Due to the problems encountered with the laboratory fuel permeability test, and the success with the initial testing it was decided by the Research Team to conduct an additional evaluation of the laboratory fuel-infiltration test. This laboratory test was also intended to evaluate a sealant’s effectiveness at stopping the penetration of fuels into the underlying HMA materials. The sealant to be tested was applied at a standard application rate to the surface of an HMA test specimen. The treated test specimen was then tested for infiltration by gluing a short PVC pipe coupler to the surface, filling it with kerosene and measuring the time needed to drain through the specimen. The specimens were coated with each of the five sealers. They were applied at three different rates:
• 0.09 gallons per square yard (.this provides a residual application rate of 0..05 gallons per square yard)

78
• 0.18 gallons per square yard (.this provides a residual application rate of 0.10 gallons per square yard)
• 0.36 gallons per square yard (this provides a residual application rate of 0.20 gallons per square yard).
Materials and Equipment
● HMA – ¾ inch P401 mixture at design binder content (based on 4.0 air voids) using a PG 64-22 binder
● Sealants – Each of the five sealants listed above, applied with a paint brush for this study.
● Permeant – kerosene ● Fume Hood
● Permeameter – 2” diameter PVC pipe coupler glued to sealed HMA surface (See figures 30 and 31).
● Adhesive caulk – silicone ● Stopwatch Sample Preparation The Superpave specimens were manufactured to have 6 to 7 percent air voids. This air void level was chosen to simulate the in-place air voids of a pavement. The specimens were cut in half. The specimens were coated and then the coated specimens were placed in an oven at 110oF for 24 hours and then taken out and stored until the PVC pipe coupler was attached. If a second coat or third coat was to be applied it was applied after the sample cooled to room temperature. It was then put into the oven at 110oF for 24 hours and taken out until the additional coat of a sealer was to be applied. Based on the problems encountered during the initial testing with the sealing of the PVC pipe coupler to the specimen it was decided to saw the Superpave specimens in half and mount the couple to the cut face (thus providing a smooth surface. A total of 45 specimens were coated with each of five sealers, three with a single application and three with two applications and three with three application rates as discussed above. Each application was allowed to cure overnight before additional coats were applied and/or test set-up was performed. Figure 3-31 shows the layout of the test specimens.

79
Figure 3-31 – Layout showing all of the test specimens Test Procedure After application of the sealant product, the PVC pipe coupler was glued onto the surface and filled halfway full (to the center ridge of the coupler) with kerosene. For visual reference, white paper towels were folded and wrapped around the specimens in such a way as to provide a visual demonstration of failure and its location. A stopwatch was started when the kerosene was poured into the PVC pipe coupler and was recorded as failure when discoloration in the paper towel made it apparent that kerosene had traveled through the HMA and to one of the outer edges of the specimen. Failure was defined as a drop of ¼ inch in the kerosene level or the coupler coming loose from the specimen. Results/Discussion
Table 3-9 Laboratory Fuel Infiltration Test ( Minutes)
SS-1h TRMSS CarbonPlex LAS 320 Coal Tar .09 gpsy .09 gpsy .09 gpsy .09 gpsy .09 gpsy
5 21 20 4 6 6 12 16 15 > 60 > 60 > 60 > 60 > 60 > 60 Average = 15 Average = 6 Average = 15 Average > 60 Average > 60
.18 gpsy .18 gpsy .18 gpsy .18 gpsy .18 gpsy
30 * 15 15 * 30 * >60 * > 60 > 60 * * > 60 * >60 >60 >60 >60 >60 >60 >60 >60 >60 >60 >60 >60 >60 >60 >60 23 4 26 6 12 4 16 25 18 > 60 > 60 > 60 > 60 > 60 50
Average = 20 Average = 14 Average = 30 Average > 60 Average = 57
.36 gpsy .36 gpsy .36 gpsy .36 gpsy .36 gpsy * * 55 15 * * 55 >60 20 > 60 > 60 > 60 > 60 > 60 > 60
>60 >60 >60 >60 >60 >60 >60 >60 >60 >60 >60 >60 >60 >60 >60 20 88 77 16 25 18 18 50 18 .> 60 > 60 > 60 .> 69 > 60 > 60
Average = 60 Average = 18 Average = 36 Average > 60 Average > 60 * Not run due seal failure.

80
Three samples were tested with no sealant material. They all failed at less than one minute. Therefore, it appears that any sealer placed on a pavement that reduces the permeability of the pavement surface has the possibility of improving the fuel resistance of the HMA pavement, even if it is not a fuel resistant product. The data shown in Table 4-6 presents the results of three series of tests for the 0.18 gpsy and the 0.36 gpsy. and two series for the 0.09 gpsy. The results showed that the LAS-320 and the coal tar performed very well as expected from the ceramic tile testing. Conclusions The test results show that the coal tar and the LAS 320 materials are fuel resistant. This is consistent with the test results from the ceramic tile test. The research team has concerns about the variability of this test procedure. It probably is not ready for implementation as a specification test but it is a test procedure that can be easily used by an airport manager or engineer to evaluate a prospective fuel resistant sealer. 3.2.4 Rapid Field Fuel Infiltration Test Overview It was decided that a simple field test would be of benefit to airport management personnel. Therefore, the rapid field fuel infiltration test was evaluated. This field test was intended to evaluate a sealant’s effectiveness at stopping the penetration of fuels into the underlying HMA materials. The sealant to be tested was applied at the standard application rates to the surface of an HMA pavement. The treated pavement was then tested for infiltration by gluing a short PVC pipe coupler to the surface, filling it with kerosene and measuring the amount of time needed for the kerosene to drain into the pavement surface The specimens were coated with each of the five sealers. They were applied at three different rates:
• 0.09 gallons per square yard (residual application rate of 0..05 gallons per square yard) • 0.18 gallons per square yard (residual application rate of 0.10 gallons per square yard) • 0.36 gallons per square yard (residual application rate of 0.20 gallons per square yard).
Materials and Equipment
● Sealants – Each of the 5 sealants listed above were applied with a paint brush for this study.
● Permeant – Kerosene ● Permeameter – 2” diameter PVC pipe coupler glued to the treated HMA surface ● Adhesive – Silicone ● Stopwatch or clock ● Asphalt coring equipment with a 6” diameter diamond studded barrel. Sample Preparation This series of sealer testing was performed on a pavement utilized for vehicle parking and which was chosen for its isolation from regular traffic that could cause damage and/or interruption to the tests. An area was marked off to provide 1 square foot sections that were then coated with

81
both one and two applications of five different sealers with two replicates of each. Figure 3-32 shows the layout of the test sections.
Figure 3-32 – Layout Of Field Test Sections For the purpose of containment of any kerosene leaking through the specimen or due to adhesive failure, the test area was isolated by using a 6 inch core bit and cutting to a depth of 2 to 2 ½ “. This was performed after the sealer was applied and allowed to cure. The test area was allowed to dry for 48 hours prior to attaching the PVC pipe coupler couplers with silicone sealer to the approximate center of the test section. The silicone sealer was allowed to cure until it was no longer tacky to the touch, at which time a second bead was applied as an additional precautionary measure to prevent leakage. The water test was not used to check for leakage (as was with the laboratory test) due to problem of removing the water. The test specimens were then allowed to cure overnight. Test Procedure After a final inspection, kerosene was placed into the coupler to the rib used as the fill line. The kerosene was then allowed to react with the sealer being evaluated. Periodically each sealer was evaluated with testing continuing until failure occurred. Failure for this series was defined as rapid fluid drop or adhesive failure. Upon failure, any remaining kerosene was suctioned out of the coupler and any fluid on the outside surface was covered with absorptive clay (kitty litter) (see Figure 3-33).

82
Figure 3-33 – Kitty Litter Used To Control Fuel Leakage Results Table 3-10 presents the results of the field testing.
Table 3-10 Rapid Field Fuel Infiltration Test (Minutes to Failure)
SS-1h TRMSS CarbonPlex LAS 320 Coal Tar .09 gpsy .09 gpsy .09 gpsy .09 gpsy .09 gpsy
55 61 57 171 189 162 205 99 100 >420 >420 >420 >420 >420 >420 68 76 71 126 173 199 * * 204 >420 >420 >420 >420 * >420
Average = 64 Average = 164 Average = 152 Average = 420 Average = 420
.18 gpsy .18 gpsy .18 gpsy .18 gpsy .18 gpsy 120 49 13 270 108 72 135 102 102 >420 >420 >420 100 176 203 14 16 14 67 78 78 96 159 76 >420 >420 >420 >420 >420 >420
Average = 37 Average = 119 Average = 118 Average = 420 Average = 290
.36 gpsy .36 gpsy .36 gpsy .36 gpsy .36 gpsy 64 109 50 >420 123 81 105 160 86 >420 >420 >420 159 90 94
54 47 45 97 86 104 160 98 114 >420 >420 >420 174 167 310
Average = 61 Average = 161 Average = 121 Average = 420 Average = 165 Note: Testing was concluded at 420 minutes (7 hours) * Leakage around seal – test terminated

83
Discussion The test results do show that the coal tar sealer and the LAS 320 sealer are fuel resistant. This is consistent with the test results from the ceramic tile test and the laboratory fuel infiltration test. But, a review of the data shows that there was a great deal of inconsistency in the test results. For example the .09 gpsy result with the TRMSS provided approximately the same fuel resistance as did 0.36 gpsy (four times as much). Also the coal tar showed a reduction in fuel resistance as the quantity increased. These results are troubling and it appears that this test may not provide sufficiently consistent results to be used as a test that might be used as a purchase specification for a fuel resistant sealer. But, it does show promise for use in the field by an airport authority to establish rates of fuel resistant sealer for a particular project. 3.3 DISCUSSION OF SEALER TEST PROCEDURES AND RESULTS
• A discussion of the evaluation of the test methods and the final recommendations is presented below.
The overall objective of this AAPTP Project is to review/improve test procedures, develop performance-based evaluation criteria and provide technical guidance with respect to the application and use of non-coal tar-based pavement sealers and modified binders. This particular report dealt with development of a test procedure that could be used to determine if pavement sealers provided some fuel resistance to the surface it was applied to.
3.3.1 Initial Evaluation of Proposed Test Procedures
It was determined that the current procedure for the evaluation of fuel-resistant sealer is to use ASTM Test Procedures: ASTM D2939 “Standardized Test Methods for Emulsified Bitumens Used as Protective Coatings” and ASTM D4866 “Coal Tar Pavement Sealers”. The first Standard covers general test procedures for an emulsified bitumen (asphalt cement or coal tar) when used as a sealer and the second Standard uses a test procedure that consists of coating a ceramic tile and evaluating the resistance of the coating to being soaked in kerosene.
Other tests that were identified were:
• Dynamic Shear Rheometer (DSR) Torsion Bar Test. In this test the top layer (12 mm) of a laboratory or field specimen is sliced off the specimen. It is cut into rectangular specimens 10 mm by 50 mm. They are then tested in torsion in a specially adapted DSR device. When evaluated it was found that the thin surface of a fuel soaked specimen would not remain intact so that the test could be conducted.
• Bending Beam Rheometer (BBR). Mihai Marasteanu10 at the University of Minnesota has recently developed procedures for evaluating thin slices of HMA cores using a bending beam rheometer. Beam specimens are cut from a core to standard BBR beam geometry and tested for stiffness. The same problem developed with this procedure as discussed above.
• Abrasion Testing. Foreign Object Damage (FOD) is an important area of concern to airport managers. This is aggregate loosened by fuel damage can be detrimental to aircraft operations. Therefore, it was decided to evaluate possible abrasion tests that can simulate fuel-damaged raveling mixes. Three different abrasion tests were

84
evaluated. The first two used a 150 mm diameter gyratory specimen that was treated with a sealer. Then the surface was abraded with either a pneumatic tube or a steel brush that had been mounted in a Hobart mixer. The concept was to run the test for 15 minutes or until the sample disintegrates too much to continue the test. Weight loss due to abrasion was determined by weighing the specimen before and after testing. The third abrasion test evaluated was a modification of the International Slurry Surfacing Association Wet Track Abrasion test. The fuel-resistant sealer was placed on a felt pad using a slurry seal circular mold (6.35 mm deep by 279 or 254 mm in diameter). It was struck off level with a window squeegee. The sealer was cured in a 140°F (60°C) oven for 24 hours. The sample was allowed to cool for 24 hours and then was weighed. Using a paint brush, the kerosene was spread over the entire surface of the sealer. The fuel will be allowed to sit on the surface for one hour. At the end of the one hour, the fuel pad was placed in the Hobart mixer and subjected to abrasion for five minutes using the standard rubber hose as specified for slurry seals. The test results did not show sufficient differentiation between sealers (fuel resistant vs. non fuel resistant). Thus, it was decided that they could not be used as standardized test procedure.
• Ceramic Tile Sealer Adhesion Test. A variation of the ASTM D4866 was evaluated. The ASTM test procedure contains very specific details on how the tile is to be coated and the kerosene applied. It was decided in this research study to just coat the porous side of a ceramic tile and soak in kerosene. The results showed that this simple test could be used to determine if a material was fuel resistant.
• Permeability. If one of the purposes of the sealer is to prevent aviation fuel from entering an HMA surface it would appear that a laboratory and/or a field permeability test might be a method for evaluating the effectiveness of a sealer. The original plan was to use the laboratory permeability device developed by the Florida DOT (Test Procedure ASTM Standard PS129-01). The test procedure requires that the sample be sealed with a membrane. To evaluate the effect of kerosene on the membrane, it was soaked in kerosene for one hour. It was noted that the kerosene destroyed the strength of the membrane. Therefore, this test was put on hold until a new membrane could be obtained. Therefore, an alternative approach was developed. It consisted of using silicone to seal a two-inch diameter PVC pipe coupler to the surface of a laboratory-produced specimen. Prior to initiating this testing it was determined that the silicone would not dissolve in kerosene by placing silicone sealant in a cup and filling the cup with kerosene. During the Phase I testing this test procedure showed some promise. HMA Lab Supply was contacted about a different membrane material. They have identified a material that may work. It is made out of Nitrile. This membrane was not available until the conclusion of the work done in initial study and therefore work with this test procedure was postponed until later in the study.
At the end of Phase one of the study four test procedures were selected for refinement and further investigation in the final study. The procedures were the:
• Ceramic Tile Sealer Adhesion Test • Laboratory Fuel Permeability Test • Laboratory Fuel Infiltration Test • Rapid Field Fuel Infiltration Test

85
3.3.2 Final Evaluation of Test Possible Procedures In this phase, five pavement sealers were tested using four of the most promising test procedures. These sealers used were:
SS-1h -- Control Coal Tar – Known fuel resistant material which also provided a control material LAS – 320 Manufactured by EnviroSeal – An acrylic material being marketed as a fuel
resistant sealer Blacklidge CarbonPlex manufactured by Blacklidge Emulsions – Being marketed as a
fuel resistant sealer TRMSS (Tire Rubber Modified Sealer) manufactured by SealMaster – an asphalt based
sealer that has been reported to have fuel resistant properties Ceramic Tile Sealer Adhesion Test This laboratory test was intended to evaluate if a sealant has a tendency to dissolve or soften in the presence of fuels. The sealant to be tested was applied to the absorptive side of a ceramic tile specimen. The coated specimen was placed in a beaker of kerosene and observed to see if the sealant dissolved or softened. The research team was concerned about whether kerosene (which is easily obtained) would provide the same results as an aviation fuel. Therefore a sample of JPA jet fuel was obtained from a local petroleum distributor and a series of tests were conducted to compare the results using kerosene and JPA jet fuel. As expected, the SS-1H sealer showed minimal, if any, resistance to either the kerosene or JPA jet fuel. The TRMSS and CarbonPlex sealers also showed minimal resistance albeit slightly better than the SS-1H. The Coal Tar Sealer and LAS 320 performed, as anticipated, very well. LAS 320 produced no discoloration to either the kerosene or JPA and demonstrated no loss after rubbing. The Coal Tar Sealer produced minor discoloration of the kerosene and JPA jet fuel, but only had minor “thumb” disruption with no tile visible after rubbing. Upon completion of the soaking and “rub test” each tile was broken in order to view sealer absorption and/or infiltration. This resulted in no discernable evidence of either. There was no difference in the test results when either the JPA jet fuel or the kerosene was used. It was concluded that this test procedure could be used by an airport manager or engineer to quickly evaluate claims about whether a proposed product would provide a fuel resistant HMA surface. Laboratory Fuel Permeability Test In the initial phase of the study, it was shown that a permeability test could be used for the evaluation of the fuel resistance of a potential fuel resistant sealer. It was also thought that if a standard ASTM test procedure with some modification could be used it would provide an excellent test procedure. It was thought that ASTM PS 129-01 (see Figure 4-6) developed by the Florida DOT would provide such a procedure. For this study, the test procedure consists of using a laboratory prepared specimen, encapsulating it in a membrane, and then putting the encapsulated sample in a laboratory permeameter and determining the falling head permeability of the sample. The standard membrane dissolves in kerosene and therefore a nitrite membrane
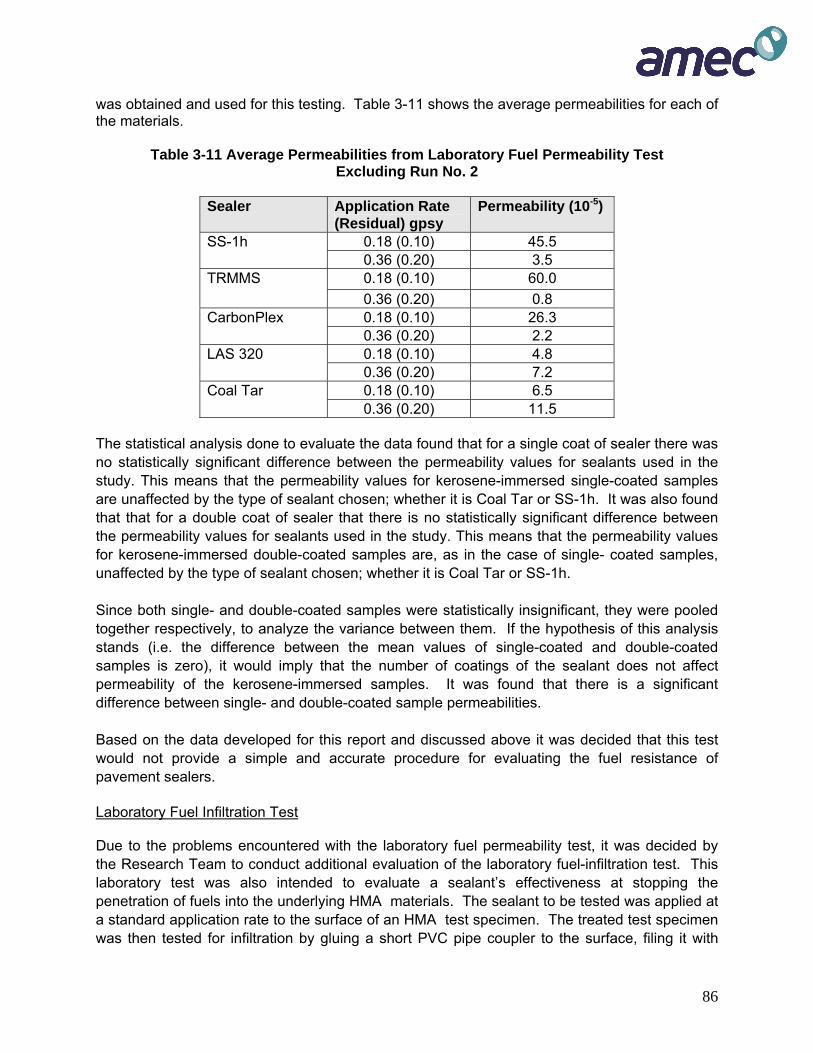
86
was obtained and used for this testing. Table 3-11 shows the average permeabilities for each of the materials.
Table 3-11 Average Permeabilities from Laboratory Fuel Permeability Test Excluding Run No. 2
Sealer Application Rate
(Residual) gpsy Permeability (10-5)
0.18 (0.10) 45.5 SS-1h 0.36 (0.20) 3.5 0.18 (0.10) 60.0 TRMMS 0.36 (0.20) 0.8 0.18 (0.10) 26.3 CarbonPlex 0.36 (0.20) 2.2 0.18 (0.10) 4.8 LAS 320 0.36 (0.20) 7.2 0.18 (0.10) 6.5 Coal Tar 0.36 (0.20) 11.5
The statistical analysis done to evaluate the data found that for a single coat of sealer there was no statistically significant difference between the permeability values for sealants used in the study. This means that the permeability values for kerosene-immersed single-coated samples are unaffected by the type of sealant chosen; whether it is Coal Tar or SS-1h. It was also found that that for a double coat of sealer that there is no statistically significant difference between the permeability values for sealants used in the study. This means that the permeability values for kerosene-immersed double-coated samples are, as in the case of single- coated samples, unaffected by the type of sealant chosen; whether it is Coal Tar or SS-1h. Since both single- and double-coated samples were statistically insignificant, they were pooled together respectively, to analyze the variance between them. If the hypothesis of this analysis stands (i.e. the difference between the mean values of single-coated and double-coated samples is zero), it would imply that the number of coatings of the sealant does not affect permeability of the kerosene-immersed samples. It was found that there is a significant difference between single- and double-coated sample permeabilities. Based on the data developed for this report and discussed above it was decided that this test would not provide a simple and accurate procedure for evaluating the fuel resistance of pavement sealers. Laboratory Fuel Infiltration Test Due to the problems encountered with the laboratory fuel permeability test, it was decided by the Research Team to conduct additional evaluation of the laboratory fuel-infiltration test. This laboratory test was also intended to evaluate a sealant’s effectiveness at stopping the penetration of fuels into the underlying HMA materials. The sealant to be tested was applied at a standard application rate to the surface of an HMA test specimen. The treated test specimen was then tested for infiltration by gluing a short PVC pipe coupler to the surface, filing it with

87
kerosene and measuring the time needed to drain through the specimen. The specimens were coated with each of the five sealers. They were applied at three different rates: 0.09 gpsy. (.residual rate 0..05 gpsy) 0.18 gpsy (.residual 0.10 gsy), 0.36 gpsy (residual 0.20 gpsy). Table 3-12 shows the average permeabilities for each of the materials tested:
Table 3-12 Average Permeabilities from Rapid Fuel Infiltration Test
Sealer Application Rate (Residual) gpsy
Permeability (10-5) Average Permeability (10-5)
0.09 (0.05) 15 0.18 (0.10) 20
SS-1h
0.36 (0.20) 60
31
0.09 (0.05) 6 0.18 (0.10) 14
TRMMS
0.36 (0.20) 18
16
0.09 (0.05) 15 0.18 (0.10) 30
CarbonPlex
0.36 (0.20) 36
27
0.09 (0.05) 60 0.18 (0.10) 60
LAS 320
0.36 (0.20) 60
60
0.09 (0.05) 60 0.18 (0.10) 60
Coal Tar
0.36 (0.20) 57
59
Rapid Field Fuel Infiltration Test It was decided that a simple field test would be of benefit to airport management personnel. Therefore, the rapid field fuel infiltration test was evaluated. This field test was intended to evaluate a sealant’s effectiveness at stopping the penetration of fuels into the underlying HMA materials. The sealant to be tested was applied at standard application rates to the surface of an HMA pavement. The treated pavement was then tested for infiltration by gluing a short PVC pipe coupler to the surface, filing it with kerosene and measuring the amount of time needed for the kerosene to drain into the pavement. As with the laboratory fuel infiltration test the five sealers were tested at three different rates: 0.09 gpsy. (.residual rate 0..05 gpsy) 0.18 gpsy (residual 0.10 gpsy), 0.36 gpsy (residual 0.20 gpsy). Table 3-13 shows the average permeabilities for each of the materials tested:

88
Table 3-13 Average Permeabilities from Rapid Fuel Infiltration Test
Sealer Application Rate (Residual) gpsy
Permeability (10-5) Average Permeability (10-5)
0.09 (0.05) 64 0.18 (0.10) 37
SS-1h
0.36 (0.20) 61
44
0.09 (0.05) 164 0.18 (0.10) 119
TRMMS
0.36 (0.20) 161
148
0.09 (0.05) 152 0.18 (0.10) 118
CarbonPlex
0.36 (0.20) 121
130
0.09 (0.05) 420 0.18 (0.10) 420
LAS 320
0.36 (0.20) 420
420
0.09 (0.05) 420 0.18 (0.10) 290
Coal Tar
0.36 (0.20) 165
291
3.4 CONCLUSIONS AND RECOMMENDATIONS Consideration should be given to using the simpler ceramic tile sealer test used in this study to replace the current procedure in ASTM 4866 Table 3-14 presents a ranking of each of the sealers for each of the permeability procedures.
Table 3-14 – Ranking Fuel Resistance
Ranking for each test procedure Material Tile Test Laboratory Fuel Permeability Test
Laboratory Fuel Infiltration Test
Field Fuel Infiltration
Test
LAS – 320 Passed 1 1 1 Coal Tar Passed 2 2 2 CarbonPlex Failed 3 3 3 TRMSS Failed 5 5 5 SS -1 Failed 4 4 4
All the permeability tests ranked each of the materials tested in the same order. But, they all had a great deal of variability in the test results. The conclusion of this study is that while the testing done in this study are that the laboratory fuel permeability test should not be used as a specification test a fuel resistant sealer. The two

89
infiltration tests show promise as tests that could be used by an airport manager or engineer for the evaluation of the fuel resistance of a proposed material. But, because of the variability of the test results that are not recommended as a specification for use at this time. Also the field fuel infiltration test has shown that it could be used help establish the proper application rate for a fuel resistant sealer .
90
CHAPTER 4 - EVALUATION OF THE FUEL RESISTANCE OF HMA
MIXES.
4.1 INTRODUCTION AND TEST PLAN Based on the literature review, the research team established three questions that needed to be answered with regard to the fuel resistance of an HMA mixture. The laboratory testing plan for the current project was developed as a starting point to determine answers to those questions:
• Does aggregate gradation have a significant effect on the fuel resistance of an HMA mixture?
• Do changes in air voids have a significant effect on the fuel resistance of an HMA mixture?
• Does binder grade (as measured using the Superpave grading system) have a significant impact on the fuel resistance of an HMA mixture?
During the course of the study, it was learned from Mr. Bennett of Rutgers University that he was seeing different results when the aggregate type was changed. It is known that the use of different aggregates will affect the moisture susceptibility of an HMA mixture – but, the question was will they have the same effect on the fuel resistance of an HMA mixture. Therefore, although not a part of the original test plan, the research team added a minor evaluation of aggregate from different geological sources to determine whether the source affects fuel resistance of an HMA mixture. The decision was made early in the study to use kerosene as the fluid for soaking the HMA specimens to evaluate the fuel resistance. Previous research used kerosene and it was assumed to be appropriate because of its availability and its similarity to the characteristics of an aviation fuel. The team decided to verify this assumption by conducting a study that compared the results of kerosene with those of a jet fuel. The laboratory testing portion of this study was based on several elements of the previous studies discussed in Chapter Two. One such element was a fuel resistance test where Superpave specimens were soaked in kerosene and the amount of weight loss was determined. The previous studies established a minimum acceptable criterion of 5 percent loss after soaking in kerosene and that criterion was adopted for this study. The Research Team also utilized tests identified in the literature that evaluated the effect that soaking Superpave specimens in kerosene would have on the tensile strength of specimens. After the addition of the aggregate type and splitting tensile testing, the final testing plan for the project was designed to answer five questions as follows:
• Does aggregate gradation have a significant effect on the fuel resistance of an HMA mixture? A typical P401 mix was compared to a similar mix with a fine gradation.
• Do changes in air voids have a significant affect on the fuel resistance of an HMA mixture? Specimens were evaluated at air void levels of 2.5, 5.0 and 7.5 percent.
• Does binder grade (as measured using the Superpave grading system) have a significant effect on the fuel resistance of an HMA mixture? Specimens were evaluated with PG 64-22, PG 76-28, PG 82-22 and a “StellarFlex FR” binder grades.

91
• Does aggregate type have a significant effect on the fuel resistance of an HMA mixture? Specimens were evaluated using three aggregate sources.
• Can the splitting tensile test be used to evaluate the fuel resistance of an HMA mixture? Three mixtures were evaluated using the splitting tensile test.
Tables 4-1, 4-2 and 4-3 delineate the testing matrix used to complete this study. Table 4-1 outlines the testing done using the soak test and Table 4-2 outlines the testing done with the tensile strength test and Table 4-3 outlines the testing done to evaluate the soaking fluids (kerosene versus jet fuel). The study was conducted at three air void levels; 7.5, 5.0 and 2.5 percent. Five different aggregate types were examined. They were FAA (P401); Logan; Sand and Gravel (Arizona); Granite (Georgia); and Limestone (New Mexico). Four types of binders were used; PG 64-22, PG 76-28, PG 82-22 and StellarFlex FR.
As noted in the discussion of studies by others, several projects and studies have been conducted using CITGOFLEX. (During the period of this research the company producing CITGOFLEX changed ownership. The new name for the product is StellarFlex FR. This is the product name that will normally be used to describe the product tested in this report).

92
Table 4-1 Experimental Matrix for the Soak Test
* Did not have sufficient aggregate to conduct all of the testing and the decision was made to use the available aggregate for the tests on polymer modified material.
Mix 7.5% Voids 5% Voids 2.5% Voids Binder Replicates Binder Replicates Binder Replicates
PG 64-22 10 PG 64-22 10 PG 64-22 10 PG 76-28 10 PG 76-28 10 PG 76-28 10
FAA (P401) &
Logan Graded
Mix StellarFlex FR 10 StellarFlex
FR 10 StellarFlex FR 10
1.5 %
Rosphalt 10 Logan Mix 3.0 %
Rosphalt 10
Binder Replicates PG 64-22 3 PG 76-28 3 PG 82-22 3
Sand & Gravel
Aggregates (Arizona)
Not Tested Not Tested
StellarFlex FR 3
Binder Replicates PG 64-22 1* PG 76-28 3 PG 82-22 3
Granite Aggregates (Georgia)
Not Tested Not Tested
StellarFlex FR 3
Binder Replicates PG 64-22 3 PG 76-28 3 PG 82-22 3
Limestone Aggregates
(New Mexico)
Not Tested Not Tested
StellarFlex FR 3
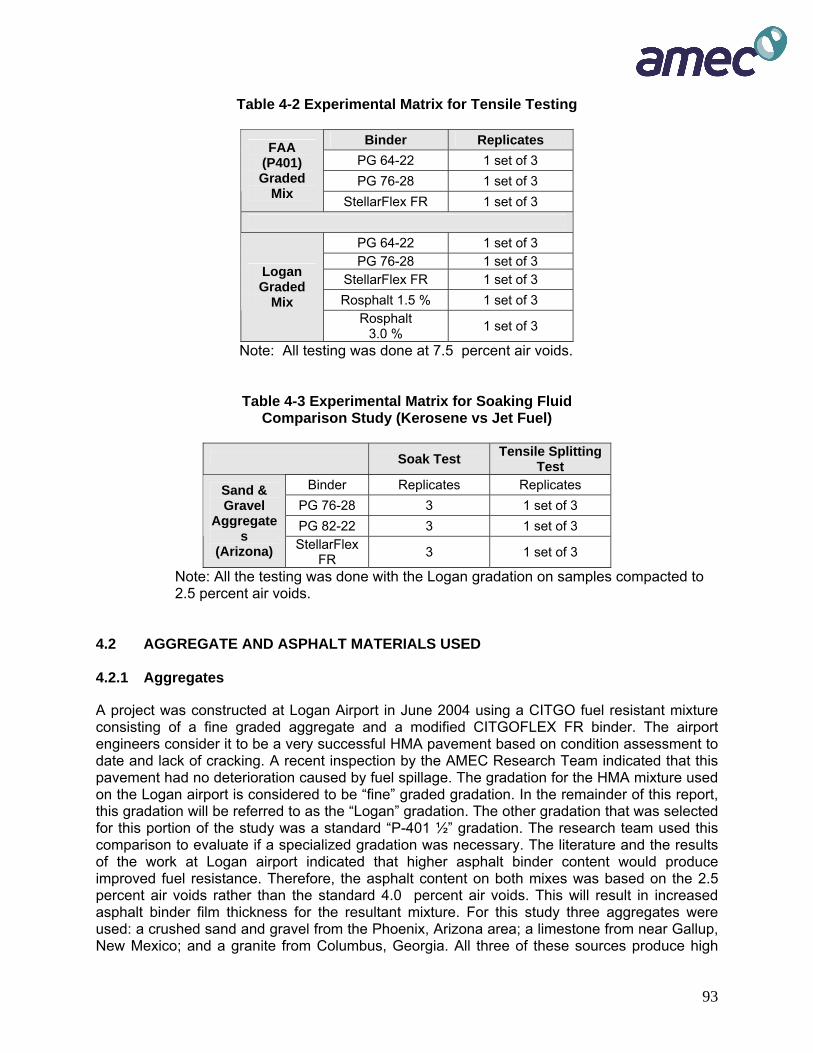
93
Table 4-2 Experimental Matrix for Tensile Testing
Binder Replicates PG 64-22 1 set of 3 PG 76-28 1 set of 3
FAA (P401) Graded
Mix StellarFlex FR 1 set of 3
PG 64-22 1 set of 3 PG 76-28 1 set of 3
StellarFlex FR 1 set of 3 Rosphalt 1.5 % 1 set of 3
Logan Graded
Mix Rosphalt
3.0 % 1 set of 3
Note: All testing was done at 7.5 percent air voids.
Table 4-3 Experimental Matrix for Soaking Fluid Comparison Study (Kerosene vs Jet Fuel)
Soak Test Tensile Splitting
Test Binder Replicates Replicates
PG 76-28 3 1 set of 3 PG 82-22 3 1 set of 3
Sand & Gravel
Aggregates
(Arizona) StellarFlex FR 3 1 set of 3
Note: All the testing was done with the Logan gradation on samples compacted to 2.5 percent air voids.
4.2 AGGREGATE AND ASPHALT MATERIALS USED 4.2.1 Aggregates
A project was constructed at Logan Airport in June 2004 using a CITGO fuel resistant mixture consisting of a fine graded aggregate and a modified CITGOFLEX FR binder. The airport engineers consider it to be a very successful HMA pavement based on condition assessment to date and lack of cracking. A recent inspection by the AMEC Research Team indicated that this pavement had no deterioration caused by fuel spillage. The gradation for the HMA mixture used on the Logan airport is considered to be “fine” graded gradation. In the remainder of this report, this gradation will be referred to as the “Logan” gradation. The other gradation that was selected for this portion of the study was a standard “P-401 ½” gradation. The research team used this comparison to evaluate if a specialized gradation was necessary. The literature and the results of the work at Logan airport indicated that higher asphalt binder content would produce improved fuel resistance. Therefore, the asphalt content on both mixes was based on the 2.5 percent air voids rather than the standard 4.0 percent air voids. This will result in increased asphalt binder film thickness for the resultant mixture. For this study three aggregates were used: a crushed sand and gravel from the Phoenix, Arizona area; a limestone from near Gallup, New Mexico; and a granite from Columbus, Georgia. All three of these sources produce high

94
quality aggregates. They are currently used by the local DOTs for Interstate highway construction projects.
4.2.2 Asphalt Binders
One of the goals for this study was to determine what effect different binders would have on fuel resistance of an HMA mixture. An important question was “Could an engineer design an HMA mixture with a standard polymer modified asphalt and provide a fuel resistant mixture?” For this part of the study, three binders were used: a PG 64-22, a PG 76-28, a PG 82-22, and StellaFlex FR. The PG 64-22 and PG 76-28 were obtained from Holly Asphalt (a local asphalt supplier in Phoenix), the 82-22 was obtained from SEM Materials and the StellaFlex was obtained from the NuStar Energy. With the exception of the 64-22, all of the asphalt binders used in this study were polymer modified with an elastomer.
During the conduct of the research described in this study it was learned that individuals constructing fuel resistant HMA pavements were observing different results with aggregates from different geological sources (i.e. sand and gravel vs. limestone vs. granite). Therefore, the decision was made to evaluate the effect the effect of aggregate type on fuel resistance. When this decision was made the research team did not have sufficient asphalt binder to conduct the additional testing. Therefore, new samples were obtained. These new samples were tested to insure that they were basically the same material used in the first part of the study. In addition another grade (the 82-22) was included.
For each binder, the temperature at which it met the failure value for a given property was determined to establish the true high temperature PG grade. For example, the failure criteria for G*/Sinδ for original asphalt is 1.00 kPa. Therefore the temperature at which that asphalt met the 1.00 kPa value was determined. This threshold temperature was designated as the Pass/Fail temperature (true high temperature PG grade) for that asphalt binder. Two data tables are provided to show the properties if the binders used in this study: table 4-4 presents the properties of the asphalt binders used in the air voids study and table 4-5 presents the properties of the asphalt binders used in the aggregate study.
A proprietary material that promotes itself as a fuel resistant HMA mixture was also included in the study. This material is ROSPHALT. It is a thermoplastic polymer additive that comes as a granular material that is added to the aggregate prior to mixing it with the asphalt binder. It was added at 1.5 and 3.0 percent by weight of total mixture. This was a solid additive, and no asphalt binder properties could be determined. Because this was a solid additive and a proprietary product only limited testing was conducted on this material. The ROSPHALT was tested only on Logan grading.
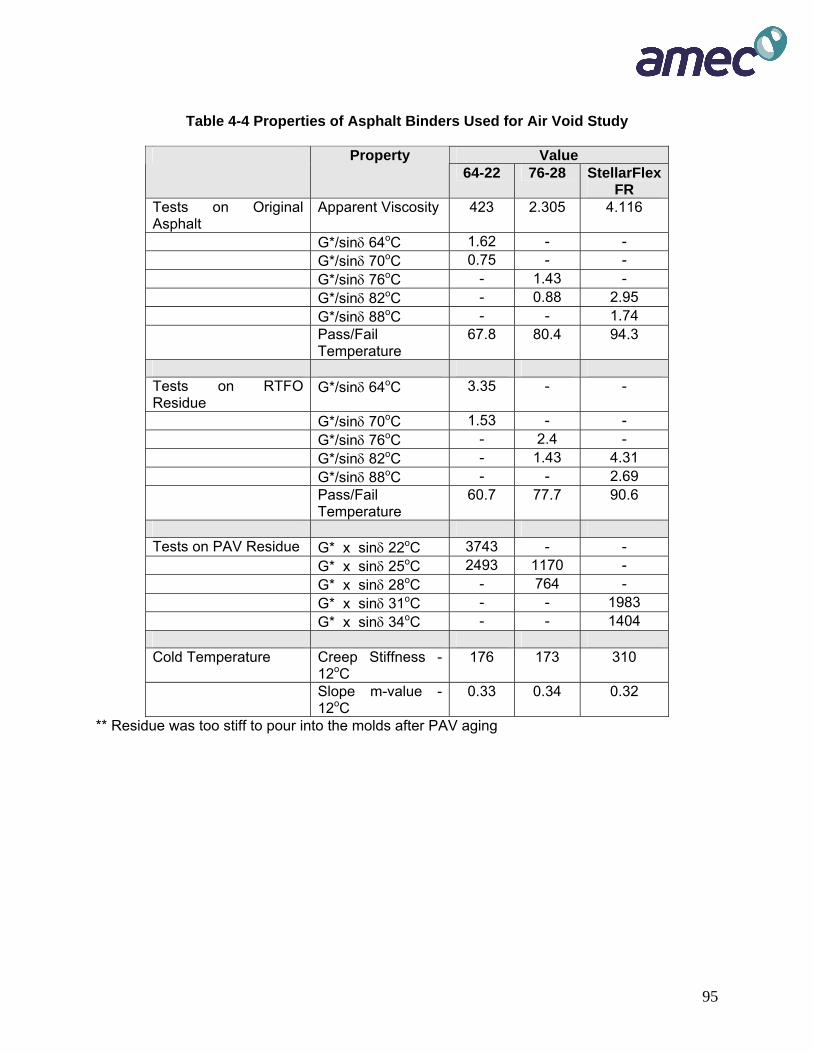
95
Table 4-4 Properties of Asphalt Binders Used for Air Void Study
Value Property
64-22 76-28 StellarFlex FR
Tests on Original Asphalt
Apparent Viscosity 423 2.305 4.116
G*/sinδ 64oC 1.62 - - G*/sinδ 70oC 0.75 - - G*/sinδ 76oC - 1.43 - G*/sinδ 82oC - 0.88 2.95 G*/sinδ 88oC - - 1.74 Pass/Fail
Temperature 67.8 80.4 94.3
Tests on RTFO Residue
G*/sinδ 64oC 3.35 - -
G*/sinδ 70oC 1.53 - - G*/sinδ 76oC - 2.4 - G*/sinδ 82oC - 1.43 4.31 G*/sinδ 88oC - - 2.69 Pass/Fail
Temperature 60.7 77.7 90.6
Tests on PAV Residue G* x sinδ 22oC 3743 - - G* x sinδ 25oC 2493 1170 - G* x sinδ 28oC - 764 - G* x sinδ 31oC - - 1983 G* x sinδ 34oC - - 1404 Cold Temperature Creep Stiffness -
12oC 176 173 310
Slope m-value - 12oC
0.33 0.34 0.32
** Residue was too stiff to pour into the molds after PAV aging

96
Table 4-5 Properties of Asphalt Binders Used for Aggregate Study
Value Property 64-22 76-28 82-22 StellarFlex
FR Tests on Original Asphalt
Apparent Viscosity 0.440 1.55 3.40 7.84
G*/sinδ 64oC 1.51 G*/sinδ 70oC 0.71 G*/sinδ 76oC 1.36 G*/sinδ 82oC 0.78 1.73 G*/sinδ 88oC 1.13 2.31 G*/sinδ 94oC 0.76 1.42 G*/sinδ 100oC 0.87 Pass/Fail
Temperature 67.3 79.7 89.9 93.8
Tests on RTFO Residue
G*/sinδ 64oC 3.60
G*/sinδ 70oC 1.63 G*/sinδ 76oC 4.37 G*/sinδ 82oC 2.90 3.74 G*/sinδ 88oC 1.65 2.33 4.17 G*/sinδ 94oC 1.43 2.54 G*/sinδ 100oC 1.55 Pass/Fail
Temperature 67.7 84.5 89.6 95.7
Tests on PAV Residue G* x sinδ 16oC 2970 G* x sinδ 19oC 3720 4170 G* x sinδ 22oC 6070 5260 5780 5770 G* x sinδ 25oC 4110 4100 G* x sinδ 28oC 2880 Cold Temperature Creep Stiffness
- 12oC 186 250 204
Slope m-value - 12oC
0.317 0.318 0.316

97
4.2.3 Hot Mix Asphalt Mixture The gradation for the mixes used in this study is shown in 4-6 and the mix properties for the two mixes using the sand and gravel aggregate is shown in Table 4-7. The mixture properties for the Logan mix using the other aggregates is shown in table 4-8.
Table 4-6 Gradation of Mixes
Sieve Size Logan Gradation
FAA P-401 Gradation
¾ inch 100 100 ½ inch 100 89
3/8 inch 93 78 No. 4 66 58 No. 8 46 43
No. 16 30 30 No. 30 21 22 No. 50 14 15
No. 100 9 11 No. 200 4 4.5
Table 4-7 Mixture Properties
Notes: Optimum A.C. content was developed using the sand/gravel aggregate with 2.5
percent air voids as the primary criteria for picking an optimum A.C.
Property Logan P-401 Aggregate Properties
Dry Gsb 2.614 SSD Gsb 2.639
Gsa 2.682 Absorption 1.0
Mixture Properties Asphalt Binder
Content (%) 6.6 5.8
% VTM 2.39 2.50 % VMA 16.2 15.8 % VFA 84.7 83.5

98
Table 4-8 Aggregate and Mixture Properties
Property Sand/gravel Granite Limestone Aggregate Properties
Dry Gsb 2.614 2.658 2.604 SSD Gsb 2.639 2.680 2.634 Gsa 2.682 2.717 2.685 Absorption 1.0 0.8 1.1
Mixture Properties % VTM 2.47 2.48 2.55 % VMA 16.2 15.7 14.9 % VMA 84.7 84.1 82.8 Asphalt Content (%)
6.6 6.6 6.6
Notes: Values were calculated using specimens that were compacted to 2.5 + 0.3%
VTM Optimum A.C. content was developed using the sand/gravel aggregate with 2.5%
air voids as the primary criteria. The water absorption for the three aggregates was very close so the same A.C.
content (6.6%) was used for all three mixes 4.3 TEST RESULTS 4.3.1 Aggregate Gradation, Air Voids And Binder Study The purpose of the first study was to evaluate the following:
• does air voids affect the fuel resistance of HMA • does the aggregate gradation affect the fuel resistance of HMA • does the asphalt binder affect the fuel resistance of HMA
In this study the asphalt binders described in Table 4-4 used along with a river run sand and gravel aggregate available in Phoenix, Arizona. In addition to the three binders, a study was done with the ROSPHALT material using the Logan gradation. The Superpave gyratory specimens were soaked in kerosene for 24 hours. The specimens were tested at three different air void contents (2.5 ± 0.3 percent, 5.0 ± 0.3 percent and 7.5 ± 0.3 percent). Five replicate tests were conducted. The weight loss and tensile strength of each tested specimen was determined after the kerosene soak. A dry tensile strength was conducted on each mix at the 7.5 percent air void level and this strength along with the tensile strength after soaking was used to calculate a tensile strength ratio (TSR) for 7.5 percent air voids.. Tables 4-9 and 4-10 present the test results.

99
Table 4-9 Results Using Logan Mix
percent Loss Tensile Splitting Results Asphalt Binder
PG Grade (Pass/fail Temperature)
Air Voids ( percent)
Average Standard Deviation
Dry Strength at 7% Air Voids (psi)
Strength after Kerosene Soak (psi)
Tensile Strength Ratio (%)
7.4 20 4.91 55 48 5.1 11.8 1.4
64-22 (67.8)
2.5 6.1 1.08
114
7.6 7.2 3.85 87 70 5.2 6.3 1.07
76-28 (80.4)
2.7 5.3 0.86
124
7.4 11.7 0.48 102 44 5 8.5 0.44
StellarFlex FR (94.3)
2.5 6.2 0.29
232
1.5 % Rosphalt 2.5 6.2 0.93 66 113 1.71 3.0 % Rosphalt 4.1 5.9 0.85 74 96 1.29
Table 4-10 Results Using P-401 ½ inch Mix
% Loss Tensile Splitting Results Asphalt Binder
PG Grade (Pass/fail Temperature)
Air Voids
(%) Average Standard
Deviation Dry
Strength @ 7%
Air Voids (psi)
Strength after
Kerosene Soak (psi)
Tensile Strength
Ratio (%)
7.4 14.4 1.75 31 35 5.1 10.4 0.97
64-22 (67.8)
2.7 6.6 0.58
89
7.6 7.9 2.26 75 53 5.1 6.7 1.48
76-28 (80.4)
2.7 4 0.93
142
7.4 10.4 0.95 112 53 5 9.2 0.86
StellarFlex FR (94.3)
2.6 5.6 0.41
210
Tables 4-9 and 4-10 show:
• As the air voids decrease the percent loss from soaking decreases • The dry strength and the strength after kerosene soak as measured by the tensile
splitting test increases as the high temperature stiffness of the asphalt binder increases (as measured by the pass/fail temperature)

100
• The strength of the mix after soaking in kerosene (at 7.5 percent air voids) decreases significantly.
4.3.2 Evaluation of Aggregate Type on Fuel Resistance of an HMA Mixture Study
The HMA mixture used for this second study was the Logan gradation presented previously. The asphalt content for this gradation was developed based on the use of a PG 64-22 as the base asphalt binder. The mix was designed at 2.5 percent air voids. This asphalt content was used in all the test mixes. All testing for this part of the study was on HMA mixes compacted to 2.5 percent air voids. For each test result, three specimens were tested. The following aggregates were used in this study
o Sand and Gravel from Phoenix, Arizona o Limestone from Western New Mexico o Granite from Columbus, Georgia
The results of this testing are presented in 4-11, 4-12 and 4-13,
Table 4-11 Results Using Sand and Gravel
% Loss Tensile Splitting Results Asphalt
Binder PG Grade (Pass/fail Temperature)
Air Voids
(%) Average Standard
DeviationDry
Strength @ 2 1/2 % Air Voids (psi)
Strength after
kerosene Soak (psi)
Tensile Strength
Ratio (%)
64-22 (67.3) 2.5 6.53 1.24 146 112 77 76-28 (79.7) 2.47 1.81 0.53 180 166 92 82-22 (89.9) 2.48 6.39 0.94 177 134 75 StellarFlex FR (93.6)
2.45 2.84 1.13 279 236 85

101
Table 4-12 Results Using Granite
% Loss Tensile Splitting Results Asphalt
Binder PG Grade (Pass/fail Temperature)
Air Voids
(%) Average Standard
DeviationDry
Strength @ 2 1/2 % Air Voids (psi)
Strength after
kerosene Soak (psi)
Tensile Strength
Ratio (%)
64-22 (67.3) 2.39 10.46 - 121 108 89 76-28 (79.7) 2.51 3.97 0.14 155 124 79 82-22 (89.9) 2.44 5.61 0.52 147 109 74 StellarFlex FR (93.6)
2.49 4.43 0.13 278 207 75
Table 4-13 Results Using Limestone
% Loss Tensile Splitting Results Asphalt
Binder PG Grade (Pass/fail Temperature)
Air Voids
(%) Average Standard
DeviationDry
Strength @ 2 1/2 % Air Voids (psi)
Strength after
kerosene Soak (psi)
Tensile Strength
Ratio (%)
64-22 (67.3) 2.65 10.13 0.98 89 74 83 76-28 (79.7) 2.58 3.11 0.59 135 121 90 82-22 (89.9) 2.43 5.53 1 143 111 78 StellarFlex FR (93.6)
2.34 2.73 0.36 255 221 86
Tables 4-11 and 4-12 and 4-13 show:
• Generally the percent loss after soaking in kerosene dropped with an increase in the high temperature stiffness of the asphalt binder increases (as measured by the pass/fail temperature).
• The dry and wet strength as measured by the tensile splitting test increases as the high temperature stiffness of the asphalt binder increases (as measured by the pass/fail temperature)
• The tensile strength ratio after soaking in kerosene (at 2.5 percent air voids) did not significantly change with the different asphalt binders.

102
4.3.3 Evaluation of Kerosene versus Jet Fuel Study Kerosene was selected to be the simulated jet fuel in the laboratory tests. This was done because kerosene was a more accessible and less expensive fuel as compared to jet fuel and if it was proved that there is no significant difference in the test results using either fuel, the testing procedure would be simpler and more economical. The final study was conducted to determine if the same results could be obtained using both jet fuel and kerosene. This testing was done using the same asphalt binders used in the aggregate study using only the Phoenix sand and gravel. The results are provided in Table 4-6.
Table 4-14 Results of Fuels Study
% Loss Tensile Splitting Results Asphalt
Binder Fuel Air
Voids (%)
Average Standard Deviation
Dry Strength @ 2 1/2 % Air Voids (psi)
Strength after Fuel Soak (psi)
Retained Strength
(%)
Kerosene 2.51 1.81 0.53 180 166 92 76-28 (79.7) Jet Fuel 2.48 3.6 1.5 180 101 56
Kerosene 2.48 6.39 0.94 177 139 75 82-22 (89.9) Jet Fuel 2.45 5.7 0.41 177 143 80
Kerosene 2.45 1.13 0.28 279 236 85 StellarFlex FR (93.6) Jet Fuel 2.71 2.76 0.88 279 226 81
Table 4-14 shows mixed results. In two cases the loss after soaking in jet fuel is higher than in kerosene and for those same two samples the strength after soaking is less for those soaked in kerosene versus those soaked in jet fuel. But, the differences are very small.
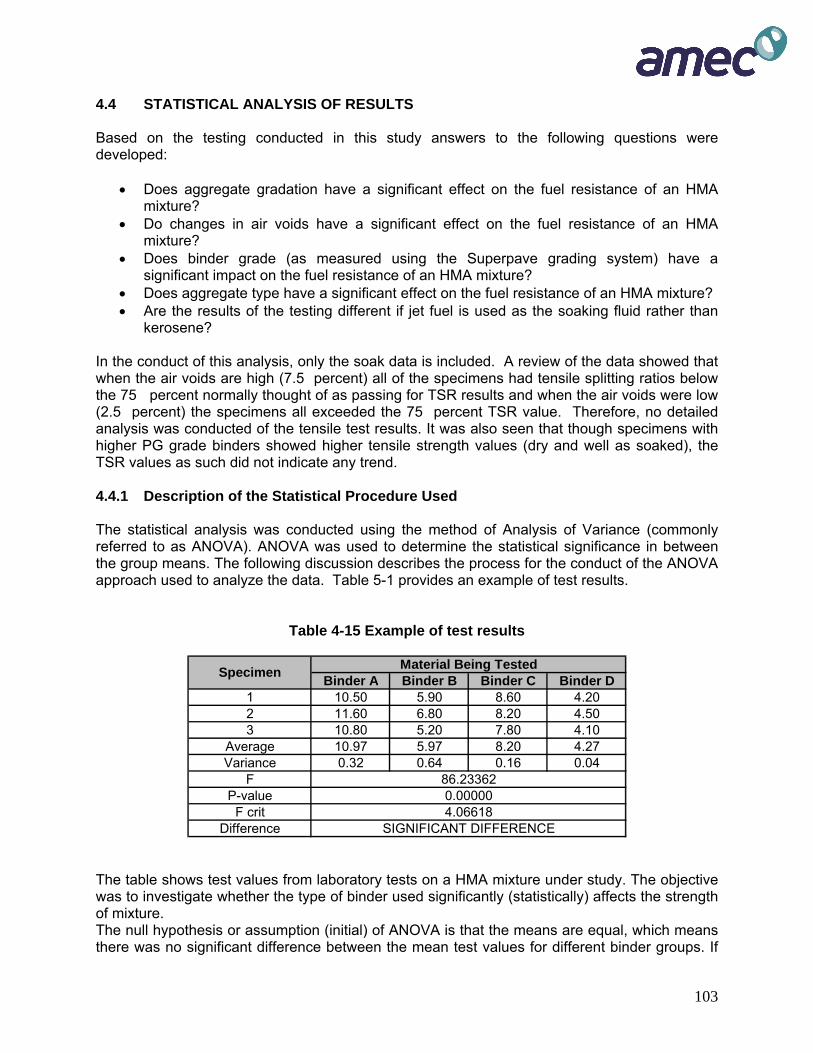
103
4.4 STATISTICAL ANALYSIS OF RESULTS Based on the testing conducted in this study answers to the following questions were developed:
• Does aggregate gradation have a significant effect on the fuel resistance of an HMA mixture?
• Do changes in air voids have a significant effect on the fuel resistance of an HMA mixture?
• Does binder grade (as measured using the Superpave grading system) have a significant impact on the fuel resistance of an HMA mixture?
• Does aggregate type have a significant effect on the fuel resistance of an HMA mixture? • Are the results of the testing different if jet fuel is used as the soaking fluid rather than
kerosene? In the conduct of this analysis, only the soak data is included. A review of the data showed that when the air voids are high (7.5 percent) all of the specimens had tensile splitting ratios below the 75 percent normally thought of as passing for TSR results and when the air voids were low (2.5 percent) the specimens all exceeded the 75 percent TSR value. Therefore, no detailed analysis was conducted of the tensile test results. It was also seen that though specimens with higher PG grade binders showed higher tensile strength values (dry and well as soaked), the TSR values as such did not indicate any trend. 4.4.1 Description of the Statistical Procedure Used The statistical analysis was conducted using the method of Analysis of Variance (commonly referred to as ANOVA). ANOVA was used to determine the statistical significance in between the group means. The following discussion describes the process for the conduct of the ANOVA approach used to analyze the data. Table 5-1 provides an example of test results.
Table 4-15 Example of test results
Binder A Binder B Binder C Binder D1 10.50 5.90 8.60 4.202 11.60 6.80 8.20 4.503 10.80 5.20 7.80 4.10
Average 10.97 5.97 8.20 4.27Variance 0.32 0.64 0.16 0.04
FP-value
F critDifference SIGNIFICANT DIFFERENCE
4.066180.0000086.23362
Specimen Material Being Tested
The table shows test values from laboratory tests on a HMA mixture under study. The objective was to investigate whether the type of binder used significantly (statistically) affects the strength of mixture. The null hypothesis or assumption (initial) of ANOVA is that the means are equal, which means there was no significant difference between the mean test values for different binder groups. If

104
the null hypothesis is rejected, the alternative would have to be accepted; which would imply that there is a significant difference between the strengths obtained with the different binders. The analysis is based on measuring the group variances. There are two variances for the population (the test values):
• between binder group • and within each group.
Between binder group variance arises due to treatment effect (each binder being different) and laboratory testing variation. Within binder variance is only due to laboratory testing variation. The ratio of these variances (between/within) is the F-value (F). Another parameter, Fcrit, is based on three factors:
• The degrees of freedom within a binder group. • The degrees of freedom between different binder groups. • Confidence interval (assumed 95 percent in this case).
If F>Fcrit, it means that the null hypothesis or assumption is to be rejected and the alternative (that there exists a significant difference between the groups) is to be accepted. In the above case, we can see that since F>Fcrit, the type of binder significantly affects the test values. Another method of analyzing the results of ANOVA is using the P-value, which is the probability that null hypothesis or assumption will be accepted. This ANOVA assumed a 95 percent confidence interval, which means that if P-value is less than or equal to 5 percent, there is a statistical significant between the binder group at the 95 percent confidence level. The following could be concluded from the ANOVA as applied in this work, assuming a 95 percent confidence interval:
• Means are equal: F<Fcrit and P>0.05 • Significant difference: F>Fcrit and P<0.05
4.4.2 Effect of Aggregate Gradation The following is a study of the influence of aggregate gradation on the fuel resistance (measured in terms of percent Loss) of three different HMA mixtures, characterized by the type of binder used in them. The aggregate gradation can have a significant effect on the properties of the HMA mixture. A fine HMA mixture (an HMA mixture with a high percentage of fines) will have a lower permeability and thus the probability of a fuel penetrating the mixture is reduced. The research work described above generally used one gradation (referred to in this report as the Logan gradation). The Logan gradation is different than the standard P-401 gradation used by the FAA. Therefore, it was decided to conduct a limited study to determine if the standard FAA P-401 gradation could be used to manufacture a fuel resistant mixture. The results of this study are limited to the two gradations used and no inference should be made to coarser gradations. Each mix should be evaluated for the project it is being used on.

105
Loss after soaking The soak test results in terms of percent Loss values for Logan and P-401 mix indicated that for the FAA mix gradation, PG 64-22 at 7.5 percent air voids showed the highest and PG 82-22 at 5 percent air voids showed the lowest percent Loss values. These values ranged from 14 to 0.3 percent. For the Logan mix gradation, PG 64-22 at 7.5 percent air voids showed the highest and PG 82-22 at 2.5 percent air voids showed the lowest percent Loss values. These values ranged from 20 to 0.17 percent. ANOVA testing The assumption being evaluated in this analysis was that the aggregate gradations used in this study do not affect the fuel resistance of the HMA mixture. An analysis of variance was conducted of the data from Tables 4-1 and 4-2. The ANOVA was conducted for each binder group separately, in between P-401 mix and Logan mix percent Loss of soak values; irrespective of which air void group they belonged to. This means that for a given mix gradation and binder type, all percent Loss values were pooled together, irrespective of air voids. Results of Analysis The statistical results are presented in table 5-2. The hypothesis of this ANOVA testing was that there was no significant difference between the percent Loss values for P-401 and Logan mixtures for a given binder type. This hypothesis was proven correct as shown in the table below.
Table 4-16 ANOVA Results Comparing percent Loss for Two Aggregate Gradations
HMA Mixtures Characterized by the
following Binder Types F-value P-Value Fcrit Statistical
Significance PG 64-22 1.26277 0.27067 4.19598 No PG 76-28 0.00987 0.92158 4.19598 No
StellaFlex FR 0.21528 0.64625 4.19598 No Conclusion It was concluded that the type of asphalt binder and the air voids were the primary influencers on the fuel resistance of the resultant HMA mixture. Therefore further analysis of the data from the two mixes was combined and treated as one data set.

106
4.4.3 Influence of Air Voids The following is a study of the influence of air voids on the fuel resistance (measured in terms of percent Loss) of three different HMA mixtures, characterized by the type of binder used in them. The air voids in an HMA mixture can significantly affect the ability of a fluid (water or aviation fuel) to affect the properties of the asphalt binder. Therefore, the AMEC team conducted a study to evaluate the effect of air voids on the fuel resistance of an HMA mixture. Loss after soaking The loss after soaking values for each of the three asphalt binders was analyzed separately for their susceptibility to variation in air voids; or simply, the effect of air voids on soak values. The results are shown graphically in figure 5-1. This analysis examines the effect of a change in the air voids on the soak values of the mix for each of the asphalt binders. The binders are identified as to the pass/fail temperature at which the binder meets the 1 kPa pass/fail temperatures.
0
2
4
6
8
10
12
14
16
18
2 3 4 5 6 7 8
Air Voids (%)
% L
oss
(Soa
k Te
st)
PG-64 (67.8) 76-22 (80.4) StellaFlex (94.3) Figure 4-1 Effect of Air Voids on Soak Test Results From an examination of the test results, it can be seen that the soak test results (i.e. the percent Loss values) decrease as the air voids decrease. This means that irrespective of the type of binder, and the aggregate gradation, the fuel resistance increases with a decrease in the air voids. (See Figure 4-1) The highest percent loss values were recorded for 67.8 binder at 7.5 percent air voids, implying a very low fuel resistance; and the lowest values were recorded for 80.4 binder at 2.5 percent air voids.

107
ANOVA testing The assumption being evaluated in this analysis is that a change in air voids does not have an effect on the fuel resistance of an HMA mixture (as measured using the soak test). An analysis of variation (single factor analysis) was conducted on the pooled soak test values from both Logan and P-401 mix. This analysis shows whether the effect of a change in any variable (air voids, in this case) on the data under examination (soak values for a particular binder type, in this case) is significant or not. ANOVA was conducted for each binder group separately, in between percent Loss values for different air voids. Results of analysis The statistical results are presented in table 4-17. The hypothesis of this ANOVA testing was that there was no significant difference between the percent Loss values from the soak test irrespective of the level of air voids.
Table 4-17 ANOVA Results Comparing percent Loss at Three Air Void Levels HMA Mixtures
Characterized by the following Binder Types F-value Fcrit P-value Rank
67.8 38.07403 3.354131 1.38576E-08 2 80.4 5.560366 3.354131 0.009500231 3 94.3 117.5797 3.354131 4.70737E-14 1
* The type of binder (whose fuel resistance is analyzed for statistical variance under the influence of air voids) Conclusion This hypothesis was proved incorrect as shown in the table 5-3. Based on the Fcrit and P-values, it was seen that for every binder group, the percent Loss values were significantly dependent on the magnitude of air voids. The table below ranks the different binders in this study according to their susceptibility to a change in air voids. It can be seen that percent Loss values for 94.3 (StellarFlex) are the most affected by an air void change. Even though all the binders were affected, it was seen that the affect on 80.4 binder was comparatively less significant. This means that for all binders, air voids is a big influence on their fuel resistance. The fuel resistance of StellarFlex binder is most significantly affected by (or sensitive to) air voids; and that of 80.4 binder is the least. The air voids in the HMA mixture will, therefore, have a significant effect on the fuel resistance of an HMA mixture. As the air voids increase the effect an aviation fuel will have on the fuel resistance of an HMA mixture will increase. 4.4.4 Influence of Binder Type The following is a study of the influence of binder type on the fuel resistance (measured in terms of percent Loss) of three different HMA mixtures, characterized by their air voids level. In this part, the interest was to study the effect of binder on the fuel resistance of an HMA mixture, expressed in terms of percent Loss values. The assumption being evaluated in this
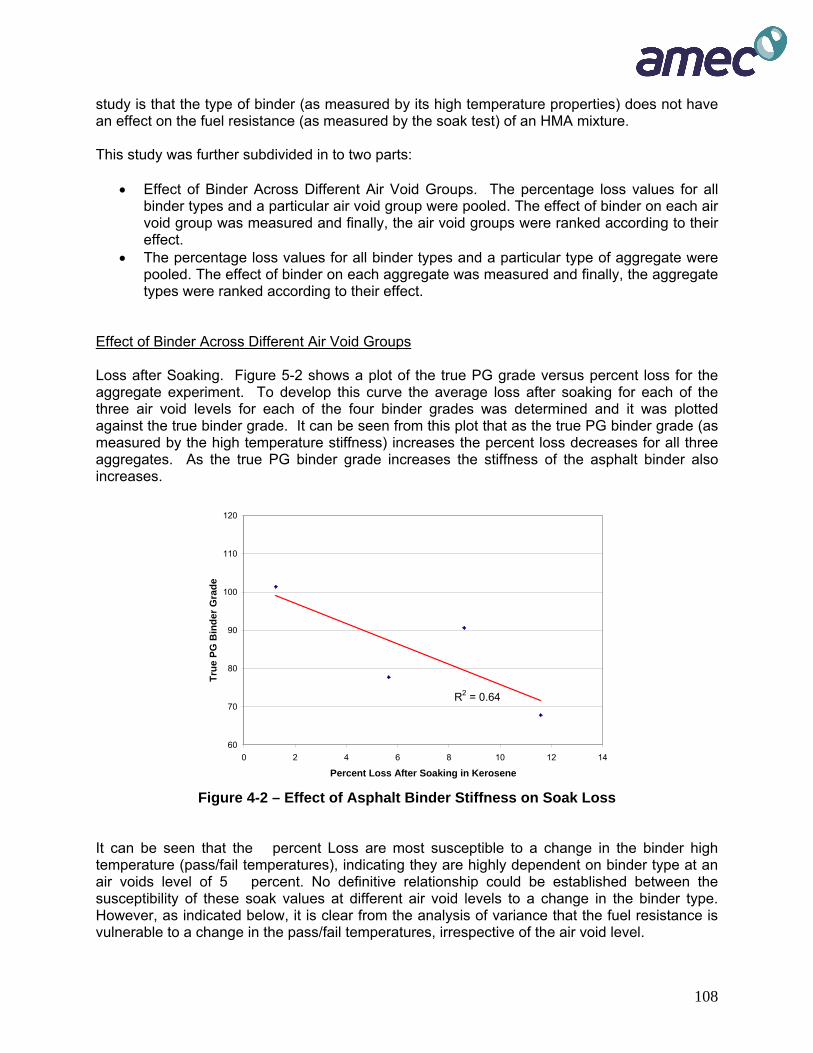
108
study is that the type of binder (as measured by its high temperature properties) does not have an effect on the fuel resistance (as measured by the soak test) of an HMA mixture. This study was further subdivided in to two parts:
• Effect of Binder Across Different Air Void Groups. The percentage loss values for all binder types and a particular air void group were pooled. The effect of binder on each air void group was measured and finally, the air void groups were ranked according to their effect.
• The percentage loss values for all binder types and a particular type of aggregate were pooled. The effect of binder on each aggregate was measured and finally, the aggregate types were ranked according to their effect.
Effect of Binder Across Different Air Void Groups Loss after Soaking. Figure 5-2 shows a plot of the true PG grade versus percent loss for the aggregate experiment. To develop this curve the average loss after soaking for each of the three air void levels for each of the four binder grades was determined and it was plotted against the true binder grade. It can be seen from this plot that as the true PG binder grade (as measured by the high temperature stiffness) increases the percent loss decreases for all three aggregates. As the true PG binder grade increases the stiffness of the asphalt binder also increases.
R2 = 0.64
60
70
80
90
100
110
120
0 2 4 6 8 10 12 14
Percent Loss After Soaking in Kerosene
True
PG
Bin
der G
rade
Figure 4-2 – Effect of Asphalt Binder Stiffness on Soak Loss
It can be seen that the percent Loss are most susceptible to a change in the binder high temperature (pass/fail temperatures), indicating they are highly dependent on binder type at an air voids level of 5 percent. No definitive relationship could be established between the susceptibility of these soak values at different air void levels to a change in the binder type. However, as indicated below, it is clear from the analysis of variance that the fuel resistance is vulnerable to a change in the pass/fail temperatures, irrespective of the air void level.

109
ANOVA testing - An analysis of variation (single factor analysis) was conducted on the pooled soak test values from both Logan and FAA mix. This analysis shows whether the effect of a change in any variable (binder type, in this case) on the data under examination (soak values for a particular air voids group, in this case) is significant or not. The ANOVA was conducted for each air void group separately, in between percent Loss values for different binder types. Results of analysis - The statistical results are presented in table 4-18. The hypothesis of this ANOVA testing was that there was no significant difference between the percent Loss values irrespective of the type of binder. This hypothesis was proved incorrect as shown in the table below. Based on the Fcrit and P-values, it was seen that for every air void group, the percent Loss values were significantly dependent on the type of binder.
Table 4-18 ANOVA Results Comparing percent Loss at Three Binder Grades
HMA Mixtures
Characterized by the following Air Void
levels F-value Fcrit P-value Rank 7.5 23.2222 3.354131 1.35821E-06 2 5 39.82481 3.354131 8.82999E-09 1
2.5 10.74756 3.354131 0.000368543 3 *The air voids level group (whose fuel resistance is analyzed for statistical variance under the influence of different binder types)
Conclusion. Table 4-18 ranks the different air voids in this study according to their susceptibility to a change in binder type. It can be seen that percent Loss values for 5 percent air voids are the most affected by the type of binder. Even though all the air void groups were affected, it was seen that the effect on 2.5 percent air voids group was comparatively less significant. This means that for all air voids, the binder used has a big influence on the fuel resistance of an HMA mixture. Effect of Binder on the Fuel Resistance Across Different Aggregate Types The following is a study of the influence of binder type on the fuel resistance (measured in terms of percent Loss) of three different HMA mixtures, characterized by the type of aggregate used in them. Due to a change in the binders used in the two experiments the effect of the binder on the fuel resistance of the HMA mixtures with the different aggregates was evaluated. Loss after Soaking. Figure 4-3 shows a plot of the true PG high temperature grade versus percent loss for the aggregate experiment. It can be seen from this plot that as the true PG binder grade increases the percent loss decreases for all three aggregates. This confirms the conclusion drawn previously with the air voids study. As the true PG binder grade increases the fuel resistance of the HMA mixture also increases. It was seen that the Sand and Gravel mixture with PG 76-28 binder showed the lowest percent Loss values of about 1.8 percent; and Granite mix and Limestone mix showed the highest percent Loss values of about 10 percent.
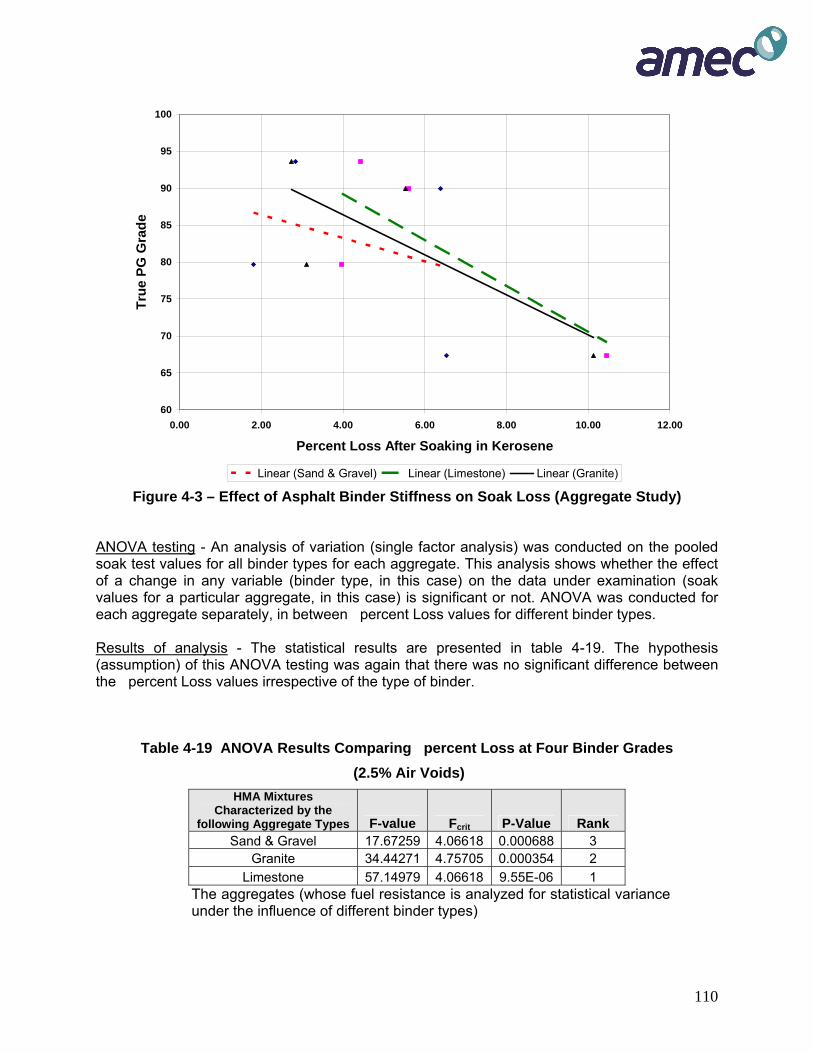
110
60
65
70
75
80
85
90
95
100
0.00 2.00 4.00 6.00 8.00 10.00 12.00
Percent Loss After Soaking in Kerosene
True
PG
Gra
de
Linear (Sand & Gravel) Linear (Limestone) Linear (Granite)
Figure 4-3 – Effect of Asphalt Binder Stiffness on Soak Loss (Aggregate Study) ANOVA testing - An analysis of variation (single factor analysis) was conducted on the pooled soak test values for all binder types for each aggregate. This analysis shows whether the effect of a change in any variable (binder type, in this case) on the data under examination (soak values for a particular aggregate, in this case) is significant or not. ANOVA was conducted for each aggregate separately, in between percent Loss values for different binder types. Results of analysis - The statistical results are presented in table 4-19. The hypothesis (assumption) of this ANOVA testing was again that there was no significant difference between the percent Loss values irrespective of the type of binder.
Table 4-19 ANOVA Results Comparing percent Loss at Four Binder Grades
(2.5% Air Voids) HMA Mixtures
Characterized by the following Aggregate Types F-value Fcrit P-Value Rank
Sand & Gravel 17.67259 4.06618 0.000688 3 Granite 34.44271 4.75705 0.000354 2
Limestone 57.14979 4.06618 9.55E-06 1 The aggregates (whose fuel resistance is analyzed for statistical variance under the influence of different binder types)

111
Conclusion - This assumption (hypothesis) was proved incorrect as shown in the table 5-5. Based on the Fcrit and P-values, it was seen that for every aggregate group, the percent Loss values were significantly dependent on the type of binder. The table ranks the different aggregates in this study according to their susceptibility to a change in binder type. It can be seen that percent Loss values for Limestone aggregate are the most affected by the type of binder. Even though all the air void groups were affected, it was seen that the effect on Sand & Gravel was comparatively less significant. This means that for all types of aggregate in this study, binder is a big influence on their fuel resistance. It can be concluded the fuel resistance of an HMA mixture will be improved by the use of a higher high temperature PG grade asphalt binder. Conclusion of Binder Study For both of the studies conducted it was found that the grade of the asphalt binder (as measured by the high temperature stiffness) has a significant effect on the fuel resistance of an HMA mixture. 4.4.5 Influence of Aggregate Type The following is a study of the influence of aggregate type on the fuel resistance (measured in terms of percent Loss) of three different HMA mixtures, characterized by the type of binder used in them. This testing was conducted using the Logan gradation on HMA mixtures compacted to 2.5 percent voids total mix. Three aggregate types as discussed above were evaluated: Sand and Gravel Mix form Phoenix, Arizona: Granite Mix form Western New Mexico and Limestone Mix form Columbus, Georgia. Each of these aggregates was combined with each of the four asphalt binders:
• PG 64-22 • PG 76-28 • PG 82-22 and • StellarFlex FR
The assumption (hypothesis) for this analysis was that the fuel resistance of an HMA mixture was not affected by the geological source of the aggregate when the aggregate gradation is held constant. Loss after Soaking In this analysis, the soak values for each of the binder types were analyzed separately for their susceptibility to variation in the aggregate type; or simply, the effect of aggregate type on percent Loss. In other words, this analysis examines the effect of a change in the aggregate type on the fuel resistance of the mix, for different types of binder. It was seen that the Sand and Gravel mixture with PG 76-28 binder showed the lowest percent Loss values of about 1.8 percent; and Granite mix and Limestone mix showed the highest percent Loss values of about 10 percent.
112
ANOVA testing An analysis of variation (single factor analysis) was conducted on the pooled soak test values for the three aggregate types for each binder. This analysis shows whether the effect of a change in any variable (aggregate type, in this case) on the data under examination (soak values for a particular binder PG grade, in this case) is significant or not. ANOVA was conducted for each binder separately, in between percent Loss values for different aggregate types. Results of analysis The statistical results are presented in Table 4-20.
Table 4-20 ANOVA Results Comparing percent Loss at Three Aggregate Types (2.5% Air Voids)
HMA Mixtures Characterized
by the following Binder Types F-value Fcrit P-Value Rank
PG 64-22 9.318924 6.944276 0.031221 2 PG 76-28 11.36403 5.143249 0.009110 1 PG 82-22 0.935773 5.143249 0.442867 NS
StellaFlex FR 4.456975 5.143249 0.065114 NS
* The type of binder (whose fuel resistance is analyzed for statistical variance under the influence of air voids)
Conclusion The hypothesis (assumption) of this ANOVA testing was that there was no significant difference between the percent Loss values irrespective of the type of aggregate. This hypothesis was proved correct only for the higher PG grade binders as shown in table 4-20. Based on the Fcrit and P-values, it was seen that for lower PG grade binders, the percent Loss values were significantly dependent on the type of aggregate. The table ranks the different binders in this study according to their susceptibility to a change in aggregate type. It can be seen that percent Loss values for PG 76-28 and PG 64-22 are the most affected by the type of aggregate. It was seen that the effect on PG 82-22 and StellarFlex FR binders was significant. This means that aggregate is a big influence on their fuel resistance for low PG grade binders. It can be concluded that the different aggregate type has a significant effect on the fuel resistance of mixtures with PG 64-22 and PG76-28 binders, but no effect on the mixtures with PG 82-22 or StellarFlex FR binders. It may, therefore, be said that, in general, higher temperature PG grade binders are less sensitive to a change in the type of aggregate 4.4.6 Influence of Different Solvent on Soak Test Results The following is a study of the influence of solvents on the fuel resistance (measured in terms of percent Loss) of three different HMA mixtures, characterized by the type of binder used in them.
113
This study was conducted by testing the aggregates and the binders using Soak Test. The Sand & Gravel aggregates, an air void level of 2.5 percent, were tested in both jet fuel and kerosene; and combined with the following types of binders:
• PG 76-68 • PG 82-22 and • StellarFlex FR
Soak Test Results In general, it was seen that Sand & Gravel combined with PG 82-22 binder showed the highest percent Loss values ANOVA Results An analysis of variation (single factor analysis) was conducted on the pooled soak test values for jet fuel and kerosene media; for each binder. This analysis shows whether the effect of a change in any variable (fuel type, in this case) on the data under examination (soak values for a particular binder PG grade, in this case) is significant or not. ANOVA was conducted for each binder separately, in between percent Loss values for different fuel types. Results of analysis The statistical results are presented in the table 4-21.
Table 4-21 ANOVA Results Comparing percent Loss of Asphalt Binders
HMA Mixtures Characterized by the
following Binder Types F-value P-Value Fcrit Statistical Significance PG 76-28 3.7988 0.1231 7.7086 No PG 82-22 1.3505 0.3098 7.7086 No
StellaFlex FR 0.0096 0.9268 7.7086 No Conclusion The hypothesis of this ANOVA testing was that there was no significant difference between the percent Loss values irrespective of the type of fuel. This hypothesis was proved correct for all binders tested, as shown in the table 4-21. Based on the Fcrit and P-values, it was seen that percent Loss values were not significantly for any of the binders, whether they were tested in jet fuel or kerosene. Table 4-21 ranks the different binders in this study according to their susceptibility to a change in fuel type. It can be seen none of the percent Loss values are affected by the type of fuel. This means that fuel type is not a big influence on the percent Loss values for any binder. It may be concluded that measurement of fuel resistance in terms of percent Loss values for HMA mix in this study can be conducted either using jet fuel or kerosene, and the results would be statistically insignificant from each other.
114
4.5 CONCLUSIONS The following bullet items summarize answers to the questions posed at the commencement of this part of the study:
• Does aggregate gradation have a significant effect on the fuel resistance of an HMA mixture? The aggregate gradation had no effect on the fuel resistance within the limited range of grading considered by this study. Thus, fuel resistant HMA mixtures can be manufactured with a standard P-401 mixture.
• Do changes in air voids have a significant effect on the fuel resistance of an HMA
mixture? The air voids in the HMA mixture have a significant effect on the fuel resistance of the mixture. Therefore, the construction process should be accomplished in such a manner as to reduce the air voids in the completed pavement as much as possible, within constraints necessary to control rutting and flushing.
• Does binder grade (as measured using the Superpave grading system) have a
significant impact on the fuel resistance of an HMA mixture? In general, a higher temperature PG grade asphalt binder used in the HMA mixture will impart greater fuel resistance to the mixture.
• Does aggregate type have a significant effect on the fuel resistance of an HMA mixture?
The type of aggregate does have an effect on the fuel resistance of the HMA Mixture. This effect is reduced as the high temperature stiffness of the binder increases. Therefore, the mix design for a fuel resistant mixture should be done with the actual aggregate to be supplied to the project. This also means that it may be necessary to change aggregate sources to provide a fuel resistant mixture.
Note: Although one of the conclusions of the report is that gradation is a not a factor in the performance of a fuel resistant HMA mixture, this might not be true if a coarse mixture with high permeability was used. The gradations in this study were fine graded and had a nominal maximum size of 3/8 inch. This type of HMA mixture would produce an HMA mixture with very low permeability
Note: It is highly recommended (based on the field experience of the AMEC team) that a fine graded mixture should be used and that it should be compacted in the field to less than five percent air voids or 95% of maximum theoretical density.

115
• Are the results of the testing different if jet fuel is used as the soaking fluid rather than kerosene? Either jet fuel or kerosene can be used as the soaking fluid for evaluation of the fuel resistance of an HMA mixture. Thus, it would appear that an airport authority could use the primary aviation fuel being used at that airfield for the evaluation of the fuel resistance of an HMA mixture.
Note: This study did not evaluate the effect of other petroleum products (such as oils and hydraulic fluids) that are typically found around an airfield. Those products may be more damaging than aviation fuels due to their slow evaporation rate.
A-1
APPENDIX A
GUIDE SPECIFICATION FOR APPLICATION OF NON-COAL TAR FUEL RESISTANT SEALERS
A-2
GUIDE SPECIFICATION FOR APPLICATION OF
NON-COAL TAR FUEL RESISTANT SEALERS 1.0 GENERAL. This item shall consist of construction of a fuel resistant sealer on new or existing (aged) hot mix HMA pavement.
2.0 COMPOSITION AND APPLICATION
2.1 Composition. The fuel resistant seal coat is to consist of fuel resistant material applied in a manner directed by the manufacturer of the material. The fuel resistant material will pass the test procedures outlined in Appendix A.
2.3 Application Rate. Application rates can be based the recommendations of the
manufacturer or an evaluation can be conducted with different application rates using the procedures described in this Guide Specification.
2.4 Test Section. Prior to full production, the Contractor shall apply the sealer over
a test section of at least of 250 square yards. The area to be tested will be designated by the Engineer and will be located on a representative section of the pavement to be seal coated. The actual application rate will be determined by the Engineer during placement of the test section and will depend on the condition of the pavement surface.
The test section can be used to determine the application rate. The same equipment and method of operations shall be used on the test section as will be used on the remainder of the work. After curing for 24 hours the Engineer will conduct the Rapid Fuel Infiltration Test on the test section. If this test shows that the surface is still susceptible to the infiltration of fuel another test section will be constructed at an application rate to be determined by the Engineer.
* * * * * * * * * * * * * * * * * * * * * * * * * * * * * * * * * * * * * * * * * * * * * * * * * * * * * * * * * * * *
The test section affords the Contractor and the Engineer an opportunity to determine the quality of the mixture in place as well as the performance of the equipment.
The application rate depends on the surface texture.
If operational conditions preclude placement of a test section on the pavement to be seal coated, it may be applied on a pavement with similar surface texture.
* * * * * * * * * * * * * * * * * * * * * * * * * * * * * * * * * * * * * * * * * * * * * * * * * * * * * * * * * * *

A-3
3.0 CONSTRUCTION METHODS
3.1 Weather Limitations. The seal coat shall not be applied when the surface is wet or when the humidity or impending weather conditions will not allow proper curing. The seal coat shall be applied only when the atmospheric or pavement temperature is 50°F (10oC) and rising and is expected to remain above 50°F (10°C) for 24 hours, unless otherwise directed by the Engineer.
3.2 Equipment and Tools. The Contractor shall furnish all equipment, tools, and
machinery necessary for the performance of the work.
• Distributors. Distributors or spray units used for the spray application of the seal coat shall be self-propelled and capable of uniformly applying 0.12 to 0.55 gallons per square yard (0.54 to 2.5 liters per square meter) of material over the required width of application. Distributors shall be equipped with removable manhole covers, tachometers, pressure gauges, and volume-measuring devices.
The distributor shall be equipped with a positive displacement pump so that a
constant pressure can be maintained on the mixture to the spray nozzles.
• Hand Squeegee or Brush Application. The use of hand spreading application shall be restricted to places not accessible to the mechanized equipment or to accommodate neat trim work at curbs, etc. Material that is applied by hand shall meet the same standards as that applied by machine.
• Calibration. The Contractor shall furnish all equipment, materials and labor
necessary to calibrate the equipment. It shall be calibrated to assure that it will apply the seal coat at the desired application rate. Commercial equipment should be provided with a method of calibration by the manufacturer. All calibrations shall be made with the approved job materials prior to applying the seal coat to the pavement. A copy of the calibration test results shall be furnished to the Engineer.
3.3 Application of Seal Coat.
• In order to provide maximum adhesion, the pavement shall be dampened with a fog spray of water if recommended by the supplier. No standing water shall remain on the surface.
• Apply the first coat uniformly to obtain the desired application rate.
• Each coat shall be allowed to dry and cure initially before applying any
subsequent coats. The initial drying shall allow evaporation of water of the applied mixture, resulting in the coating being able to sustain light foot traffic. The initial curing shall enable the mixture to withstand vehicle traffic without damage to the seal coat.
• Apply the second coat in the same manner as outlined for the first coat.

A-4
• Additional coats shall be applied over the entire surface as directed by the
engineer.
• The finished surface shall present a uniform texture.
• The final coat shall be allowed to dry a minimum of eight hours in dry daylight conditions before opening to traffic, and initially cure enough to support vehicular traffic without damage to the seal coat.
• Where marginal weather conditions exist during the eight hour drying time,
additional drying time shall be required. The length of time shall be as specified by the supplier. The surface shall be checked after the additional drying time for trafficability before opening the section to vehicle traffic.
• Where striping is required, the striping paint utilized shall meet the
requirements of P-620, shall be compatible with the seal coat and as recommended by the sealer manufacturer.
4.0 QUALITY CONTROL
4.1 Contractor's Certification.
• The Contractor shall furnish the manufacturer's certification that each consignment of fuel resistant sealer shipped to the project meets the requirements of this specification as a non coal-tar sealer, except that the water content shall not exceed 50 percent. The certification shall also indicate the solids content of the sealer and the date the tests were conducted. The certification shall be delivered to the Engineer prior to the beginning of work. The manufacturer's certification for the emulsion shall not be interpreted as a basis for final acceptance. Any certification received shall be subject to verification by testing samples received for project use.
• The Contractor shall also furnish a certification demonstrating a minimum of
three years’ experience in the application of emulsion seal coats. 4.2 Sampling.
• A random sample of approximately one-quart of the sealer will be obtained daily by the contractor and stored in a glass container. The containers shall be sealed against contamination and retained in storage by the Owner for a period of six months. Samples shall be stored at room temperature and not be subjected to freezing temperatures.
4.3 Engineer’s Records.
• The Engineer will keep an accurate record of each batch of materials used in the formulation of the seal coat.

A-5
5.0 METHOD OF MEASUREMENT The sealer shall be measured by the [gallon (liter)] [ton (kg)]. Only the actual quantity of undiluted sealer will be measured for payment. . 6.0 BASIS OF PAYMENT Payment shall be made at the contract unit price per [gallon (liter)] (ton (kg)] for the fuel resistant sealer and at the contract price per ton (kg) for aggregate. These prices shall be full compensation for furnishing all materials, preparing, mixing, and applying these materials, and for all labor, equipment, tools, and incidentals necessary to complete the item. 7.0 APPLICABLE TEST PROCEDURES
ASTM C 67 Sampling and Testing Brick and Structural Clay Tile ASTM D 160 Practice of Sampling Bituminous Materials
8.0 MATERIAL REQUIREMENTS ASTM C 3699 Kerosene

B -6
APPENDIX B
TEST PROCEDURES FOR EVALUATING THE QUALITY OF A
FUEL RESISTANT SEALER
B -7
TEST PROCEDURE FOR EVALUATING THE QUALITY OF A
FUEL RESISTANT SEALER 1.0 SCOPE This procedure provides test methods that can be used by an airport manager or engineer to evaluate whether a spray applied material that is being supplied for a project will provide a fuel resistant surface. 2.0 SAMPLING The samples obtained for testing under this guide specification shall be representative of the material to be supplied for construction. The samples shall be stored in clean, airtight containers and maintained in a dry environment within a temperature range of 40oF to 120oF. The samples will be furnished to the testing laboratory at least 30 days prior to the planned use. 3.0 TEST METHODS
3.1 General note – all testing should be accomplished in a well ventilated area or a
fume hood due to the use of kerosene or other aviation fuel as the test fluid. 3.2 Ceramic Tile Sealant Adhesion Test
3.2.1 Overview – This laboratory test was intended to evaluate if a sealant has
a tendency to dissolve in the presence of fuels. The sealant to be tested is applied to a absorptive ceramic tile specimen. The coated specimen is placed in a beaker of fuel and observed to determine if the sealant has dissolved or softened.
3.2.2 Materials and Equipment
3.2.2.1 Sealant to be evaluated 3.2.2.2 Kerosene 3.2.2.3 1000 ml beaker 3.2.2.4 Fume Hood 3.2.2.5 Ceramic tile 3.2.2.6 Clock
3.2.3 Test specimen – The test specimen will be an unglazed porous clay tile
with a minimum of 10 % water absorption. 3.2.4 Fuel to be used for testing – The standard fluid is kerosene. It is
recommended that the primary fuel being used on the airfield be used as the test fluid.
3.2.5 Test procedure –
3.2.5.1 The selected sealant will be thoroughly coated with the proposed fuel resistant material.
3.2.5.2 After it has been coated it will be cured over night in a 140oF oven. After removal from the oven the sample will be allowed to cool to room temperature.

B -8
3.2.5.3 Using a container of suitable shape and size to allow the specimen to be placed upright. The sample will be placed in a container containing kerosene. The sample will be placed in the container in a vertical position. It will be soaked in the fuel for 1 hour.
3.2.5.4 If the fuel sample shows a discoloration from clear to black the material being tested will have failed the test (some of the materials will give a yellowish color when soaked in the kerosene).
3.2.5.5 Upon removal from fuel the technician conducting the test will then take his/her thumb or other finger and lightly rub the surface of the tile. If any of the sealant rubs off through to the tile (resulting in a visible tile) the fuel-resistant sealant will be considered to have failed the test. Note: Some sealants may have a light amount of residue on the finger/thumb but not show through the surface.
3.3 Laboratory Fuel Infiltration Test
3.3.1 Overview
This laboratory test is intended to evaluate a sealant’s effectiveness at stopping the penetration of fuels into the underlying HMA materials. The sealant to be tested was applied at a standard application rate to the surface of an HMA test specimen. The treated test specimen was then tested for infiltration by gluing a short PVC pipe coupler to the surface, filing it with kerosene and measuring the time needed to drain through the pavement.
3.3.2 Materials and Equipment
3.2.2.1 An HMA specimen compacted in a Superpave gyratory
compactor. The gyratory specimens should be compacted to 5 to 7 % air voids. After compaction the Superpave specimen will be cut in half with a diamond saw. The cut sides will be the test sides,
3.2.2.2 Sealants – Sufficient amount of the sealant be evaluated to conduct the test.
3.2.2.3 Permeant – kerosene 3.2.2.4 Fume Hood 3.2.2.5 Permeameter – 2” diameter PVC pipe coupler glued to sealed
HMA surface (See figures 30 and 31). 3.2.2.6 Glue adhesives – silicone. 3.2.2.7 Stopwatch
3.3.2 Procedure
3.3.2.1 After compaction the Superpave specimens are cut in half. 3.3.2.2 The proposed sealant is applied to the cut surface of the
specimen. The final quantity to be applied should be the amount that is planned for use in the field. If it is planned to apply the material in multiple coats the same process should be used in the laboratory testing.

B -9
3.3.2.3 After each application of the sealant the Superpave specimen with sealant should be cured in an oven set at 140oF overnight. . After removal from the oven the sample should be allowed to cool to room temperature prior to the next coat to sealant being applied.
3.3.2.4 The PVC pipe coupler is attached to the specimen by following the following steps:
3.3.2.4.1 Coat the bottom of the PVC pipe coupler with the silicone sealant.
3.3.2.4.2 Place the PVC pipe coupler on the specimen and then apply a bead of silicone sealant around the joint of the coupler and the specimen pressing and smoothing the silicone into the joint.
3.3.2.4.3 Allow the sealant to cure to cure to the point it is not tacky.
3.3.2.4.4 After the sealant has cured fill the PVC pipe coupler with water and look for any possible leaks at the joint of the sealant and the HMA specimen. If there are leaks empty the water out, let the specimen dry and place some more sealant at the point of the leak. Repeat this process until there are no more leaks. Allow the sealant to thoroughly cure and then apply one more bead of sealant and using your finger push the last bead of sealant into the cured sealant. Then allow a final curing period.
3.3.2.4.5 When the PVC pipe coupler has been secured to the specimen wrap the edges of the specimen with a white paper towel.
3.3.2.4.6 Fill the PVC pipe coupler to the mid-point of the coupler or about 1 3/8 inch deep with kerosene (this will be the level of the rib on the PVC pipe coupler) and monitor the level of the kerosene. If there is a drop in the level of the sealant or the paper towel begins to turn black the sealant will have failed the test. The top of the PVC pipe coupler should be covered to prevent evaporation of the kerosene.
3.4 Rapid Field Fuel Infiltration Test
3.4.1 Overview This field test is intended to evaluate a sealant’s effectiveness
at stopping the penetration of fuels into the underlying HMA materials. The sealant to be tested was applied at standard application rates to the surface of an HMA pavement. The treated pavement was then tested for infiltration by gluing a short PVC pipe coupler to the surface, filing it with kerosene and measuring the amount of time needed for the kerosene to drain into the pavement.
3.4.2 Materials and Equipment
3.4.2.1 Sealants – The product being evaluated should be applied to
the pavement surface with either a paint roller or squeeze. Permeant – Kerosene
3.4.2.2 Permeameter – 2” diameter PVC pipe coupler glued to the treated HMA .
B -10
3.4.2.3 Adhesive – Silicone 3.4.2.4 Stopwatch or clock 3.4.2.5 Asphalt coring equipment with a 6” diameter diamond studded
barrel.
3.4.3 Test procedure
3.4.3.1 The area should be a clean flat surface, free of any fuel or oil spillage spots. It should be thoroughly washed and broomed prior to the test. After the surface has been allowed to thoroughly dry a one foot by one foot square id marked.
3.4.3.2 The proposed fuel resistant sealer is applied at the rate desired for use on the project and allowed to cure.
3.4.3.3 The PVC pipe couplers are attached to the pavement surface as described above for the Laboratory Fuel Infiltration Test.
3.4.3.4 Fill the PVC pipe coupler with 1 3/8 inch of kerosene (this will be the level of the rib on the PVC pipe coupler) and monitor the level of the kerosene. Start the stopwatch when kerosene is applied.
3.4.3.5 If there is a drop in the level of the kerosene, or if there is visible evidence of the kerosene on the asphalt outside the PVC pipe coupler, stop the watch and note the failure mode. Stop the test at 360 minutes.
3.4.4 Results 3.4.4.1 Record the number of minutes to failure and the failure mode.
If no failure has occurred after 360 minutes, record the results as >360 minutes.
C-1
APPENDIX C
SUGGESTED TEST PROCEDURE
FOR
THE EVALUATION OF THE FUEL RESISTANCE OF A HOT MIX ASPHALT (HMA) MIXTURE

C-2
PROCEDURE FOR THE EVALUATION OF THE FUEL RESISTANCE OF A HOT MIX ASPHALT (HMA) MIXTURE
1.0 SCOPE To evaluate the performance of asphalt concrete mixtures against fuel contamination by measuring their resistance to loss after soaking in kerosene This procedure does not purport to address all of the safety concerns associated with its use. It is the responsibility of the user of this procedure to establish appropriate safety and health practices. 2.0 MATERIALS AND EQUIPMENT
• Industrial quality plastic containers having a 5 gallon capacity.
• Aluminum racks were customized with suitable arrangements so as to assist in handling the specimens during immersion into and removal from the fuel.
• Equipment for preparing and compacting specimens from AASHTO T 245 for 4 inch
specimens and from
• Vacuum container, preferably Type E, from ASTM D 2041 and vacuum pump from ASTM D 2041 including manometer.
• Balance and water bath from AASHTO T 166 • Loading jack with ring dynamometer or load cell as required in AASHTO T 245 or ASTM
D 5581
• Loading Strips - steel loading strips with a concave surface having a radius of curvature equal to the nominal radius of the test specimen. For specimens 150mm in diameter the loading strips shall be 19.05mm (0.75 in) wide. The length of the loading strips shall exceed the final compacted thickness of the specimens. The edges of the loading strips shall be rounded by grinding.
3.0 MATERIALS PREPARATION The HMA mixture is to be designed at an asphalt content that will provide for 2.5 percent air voids and with a VMA level as required by the FAA P-401 specification for Hot Mix Asphalt (HMA).
Note to the engineer –In HMA mix design the standard is 4.0% air voids. For fuel resistant mixtures the laboratory design air voids has been reduced to 2.5% to insure that additional asphalt binder is used in the resultant HMA mixture to reduce the permeability of the mixture and thus improve the fuel resistance of the final HMA Mix.
C-3
A minimum of six specimens are to be prepared using a gyratory compactor. Specimens are to be compacted to a height of approximately 4” (101.4mm) with air voids of 2.5 ± 0.3% as determined by ASTM D 2041-03a (Theoretical Maximum Specific Gravity and Density of Bituminous Paving Mixtures) and ASTM D 2726-04 (Bulk Specific Gravity and Density of Non-Absorptive Compacted Bituminous Mixtures). 4.0 TEST PROCEDURE The specimens are to be immersed in the fuel for a period of 2 minutes ± 10 seconds. After this initial soak period, remove the specimens form the container and allow draining lightly. The surface is then to be blotted dry using paper towels. Ensure that the blotting is done by pressing the paper towel just hard enough to deprive the fuel soaked surface of its shine. Rubbing or scrapping the surface with paper towel could result in excessive surface material loss, in turn affecting the test results; and this should be accounted for.
Weigh to the nearest 0.1 gram and record as the starting weight to be used in final loss calculation. Place the specimen back into the container of fuel, record the time and allow soaking for a period of 24 hours ± 10 minutes. After the soak period, remove the sample and allow surfaces to drain for approximately one to two minutes while avoiding contact with surfaces. Use a metal, or other suitable container, lined with paper towels, with dimensions large enough to provide at least one inch clearance for the circumference of the sample(s). Invert the lined container and place it on the surface of the sample and while holding both quickly invert the sample with as little jarring as possible. Remove the lifting rack from the specimen and place specimen and container in a well ventilated area that will allow air drying. Air flow from a fan with a low setting is acceptable. Dry for a period of 24 hours ± 10 minutes. After the drying period, remove from pan with care not to dislodge aggregate by manipulation. Minor loss may result from removal of material adhering to the paper towels, and may be ignored (considered as a part of the overall loss). Aggregate that falls off the sample, that is not a result of direct handling, is also considered to be part of the loss. The following data is to be recorded:
Note to the engineer – generally the fuel used for the soak test will be kerosene. But, if an airport has a particular concern about the aviation fuel used at their installation the test can be conducted using that fuel. The criteria is based on the use of aviation fuel and not oils, hydraulic fluids, etc. Due to the slower evaporation rate of oils and hydraulic fluids this test procedure may not provide an accurate prediction of the HMA mixture’s resistance to these fluids.

C-4
• Weigh and record the initial weight • Weigh and record the final weight. • Percent loss = • (Initial wt. of sample – Final wt. of sample) / Initial wt. of sample x 100
¹ A kitchen cooling rack, modified, using heavy gauge wires formed into handles of sufficient height to facilitate lowering and lifting of the specimen was made and found to be effective in this procedure. 5.0 CRITERION A fuel resistant mixture is defined as a Hot Mix Asphalt mixture that has less than 5 percent loss after soaking in kerosene for 24 hrs.