aamodt - research in law enforcement selection · research in law enforcement selection michael g....
TRANSCRIPT
Research in Law
Enforcement Selection
Michael G. Aamodt, PhD Radford University
BrownWalker Press Boca Raton � 2004
Research in Law Enforcement Selection
Copyright © 2004 Michael G. Aamodt All rights reserved.
BrownWalker Press Boca Raton , Florida
USA � 2004
ISBN: 1-58112-428-7
BrownWalker.com
Contents 1: Understanding Meta-Analysis 1 2: Meta-analysis method used for this project 15 3: Cognitive ability 27 4: Education 47 5: Previous military experience 71 6: Background problems 79 7: Personality inventories 85 8: Vocational interest inventories 145 9: Assessment centers 151 10: Interviews 155 11: Physical ability tests 161 12: Correlations among performance criteria 165 13: Correlations among predictors of performance 175 14: Sex, race, age, and tenure 179 15: Summary and recommendations 189 Subject index 203 Name index 205

Preface
The purpose of this book is to provide a reference source for individuals interested in law enforcement selection. The chapters contain meta-analyses (statistical reviews of the literature) investigating the validity of methods used to predict police performance. These methods include education requirements, cognitive ability, background variables (e.g., military experience, arrest record, discipline problems at work), personality inventories, interest inventories, physical agility tests, assessment centers, and interviews.
The first chapter in the book is a short primer on meta-analysis that informs the reader about the purpose of meta-analysis and how to interpret the meta-analysis tables contained in the book. Readers not familiar with meta-analysis should feel comfortable with the topic after reading Chapter 1. Readers already familiar with meta-analysis can probably skip this chapter.
Chapter 2 describes the methods used to conduct the meta-analyses for this project. Chapters 3-11 list the meta-analysis results for the various predictors of police performance. Chapter 12 describes a meta-analysis of the relationships among criteria (e.g., performance ratings, discipline problems, commendations), Chapter 13 describes a meta-analysis of the relationships among selection methods, and Chapter 14 describes a meta-analysis of the relationship between the various criteria and sex, race, age, and tenure. Chapter 15 summarizes the previous chapters and identifies future research needs.
The chapters were intentionally kept short. Each chapter includes a brief discussion of the topic, tables listing the meta-analysis results, and a brief discussion of the results. The beauty of meta-analysis is that the results tables typically tell the whole story of how well a selection method predicts performance and little additional discussion is usually needed.
For the reader who would like more information on a particular study, a PDF file is available containing over 400 pages of statistical summaries. These summaries contain the information used to conduct the meta-analyses described in chapters 3-14 and information that can be used for future meta-analyses. The aim of
these summaries is to include enough information about a study that the reader will not need to consult the original source—an advantage when many of the original sources such as theses and dissertations can be difficult to obtain. Each summary contains complete citation information as well as information about the sample, the predictors and criteria used in the study, and the essential findings of the study. The web address for this file is www.radford.edu/~maamodt/riles.htm. If I have done my job properly, with a few exceptions of dissertations that could not be obtained, summaries of all journal articles, theses, and dissertations relevant to this topic from 1970 – 2003 are in this book. To find studies relevant to this project, studies older than 1970 and more recent than September, 2003 were included when found but inclusion outside of the years 1970-2003 would not be considered exhaustive. Acknowledgements I would like to thank my wife Bobbie for her support in working on this 10-year project. My guess is if she never hears the words “meta-analysis” or “police selection” again she wouldn’t complain. I am deeply indebted to JoAnne Brewster at James Madison University, Mark Foster at the University of Georgia Institute for Government, Wayman Mullins at Texas State University, Mark Nagy at Xavier University, Bobbie Raynes at New River Community College, and Michael Surrette at Springfield College for reading drafts of this book and providing useful feedback. They spent more hours reading drafts than I would ever have expected, and for that I am greatly appreciative.
I would like to also thank Bud Bennett and his interlibrary loan staff at Radford University. Bud’s hard work and patience in getting other libraries to send dissertations, theses, and articles is much appreciated and this project could not have been completed without his help. Finally I would like to thank my colleagues in the Society for Police and Criminal Psychology for their support and encouragement throughout this project and to Radford University for granting me a one-semester sabbatical to finish the book.
Introduction to Meta-Analysis 1
Chapter 1 Introduction to Meta-Analysis In the old days (prior to 1980) research was reviewed by reading all of the articles on a topic and then drawing a conclusion. For example, suppose that a personnel analyst was asked to review the literature to see if education was related to police performance. The analyst would find every article on the topic, perhaps count the articles showing significant results, and then reach a conclusion such as "given that eight articles showed significant results and nine did not, we must conclude that education is not related to police performance." Unfortunately, there are three common situations in which such a conclusion might be inaccurate: small but consistent relationships, moderate relationships but small sample sizes, and large differences in sample sizes across studies. Small but Consistent Correlations Suppose that you find four studies investigating the relationship between education and police performance, but none of the four studies reported a significant relationship between the two variables. With a traditional review, you would probably conclude that education is not a significant predictor of police performance. However, it might be that the actual relationship between education and performance is relatively small, and a large number of subjects would have been needed in each study to detect this small relationship. Take for example the studies shown in Table 1.1. You have four studies, each with samples of 50 officers. The correlations between education level and performance in the four studies are .20, .17, .19, and .16. Though the size of the coefficients is consistent across the four studies,
Research in Law Enforcement Selection 2
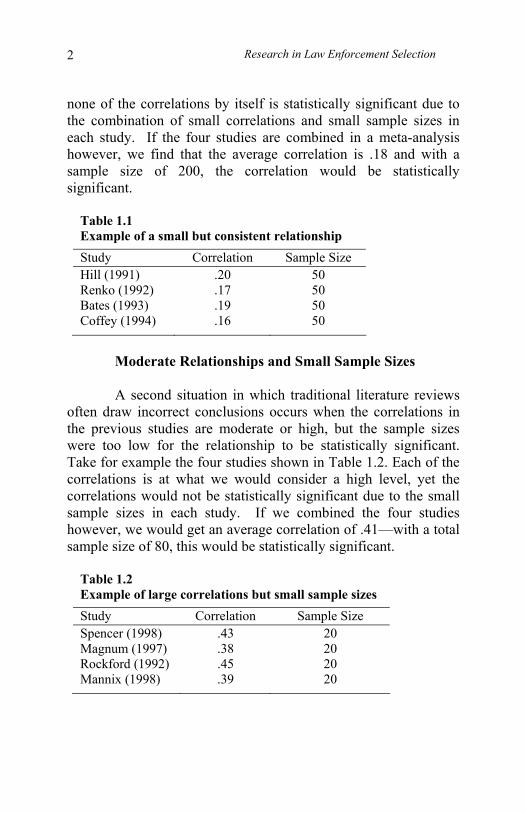
none of the correlations by itself is statistically significant due to the combination of small correlations and small sample sizes in each study. If the four studies are combined in a meta-analysis however, we find that the average correlation is .18 and with a sample size of 200, the correlation would be statistically significant.
Table 1.1 Example of a small but consistent relationship Study Correlation Sample Size Hill (1991) .20 50 Renko (1992) .17 50 Bates (1993) .19 50 Coffey (1994) .16 50
Moderate Relationships and Small Sample Sizes
A second situation in which traditional literature reviews often draw incorrect conclusions occurs when the correlations in the previous studies are moderate or high, but the sample sizes were too low for the relationship to be statistically significant. Take for example the four studies shown in Table 1.2. Each of the correlations is at what we would consider a high level, yet the correlations would not be statistically significant due to the small sample sizes in each study. If we combined the four studies however, we would get an average correlation of .41—with a total sample size of 80, this would be statistically significant.
Table 1.2 Example of large correlations but small sample sizes Study Correlation Sample Size Spencer (1998) .43 20 Magnum (1997) .38 20 Rockford (1992) .45 20 Mannix (1998) .39 20
Introduction to Meta-Analysis 3
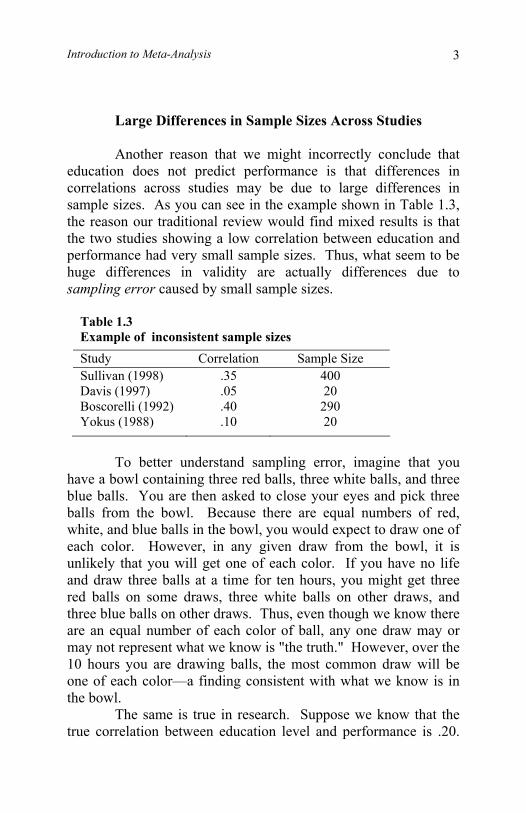
Large Differences in Sample Sizes Across Studies Another reason that we might incorrectly conclude that education does not predict performance is that differences in correlations across studies may be due to large differences in sample sizes. As you can see in the example shown in Table 1.3, the reason our traditional review would find mixed results is that the two studies showing a low correlation between education and performance had very small sample sizes. Thus, what seem to be huge differences in validity are actually differences due to sampling error caused by small sample sizes.
Table 1.3 Example of inconsistent sample sizes Study Correlation Sample Size Sullivan (1998) .35 400 Davis (1997) .05 20 Boscorelli (1992) .40 290 Yokus (1988) .10 20
To better understand sampling error, imagine that you have a bowl containing three red balls, three white balls, and three blue balls. You are then asked to close your eyes and pick three balls from the bowl. Because there are equal numbers of red, white, and blue balls in the bowl, you would expect to draw one of each color. However, in any given draw from the bowl, it is unlikely that you will get one of each color. If you have no life and draw three balls at a time for ten hours, you might get three red balls on some draws, three white balls on other draws, and three blue balls on other draws. Thus, even though we know there are an equal number of each color of ball, any one draw may or may not represent what we know is "the truth." However, over the 10 hours you are drawing balls, the most common draw will be one of each color—a finding consistent with what we know is in the bowl. The same is true in research. Suppose we know that the true correlation between education level and performance is .20.
Research in Law Enforcement Selection 4
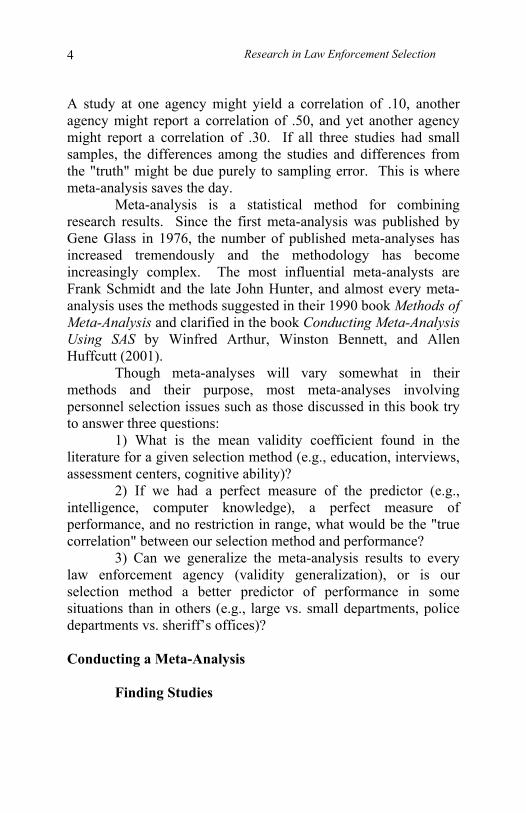
A study at one agency might yield a correlation of .10, another agency might report a correlation of .50, and yet another agency might report a correlation of .30. If all three studies had small samples, the differences among the studies and differences from the "truth" might be due purely to sampling error. This is where meta-analysis saves the day. Meta-analysis is a statistical method for combining research results. Since the first meta-analysis was published by Gene Glass in 1976, the number of published meta-analyses has increased tremendously and the methodology has become increasingly complex. The most influential meta-analysts are Frank Schmidt and the late John Hunter, and almost every meta-analysis uses the methods suggested in their 1990 book Methods of Meta-Analysis and clarified in the book Conducting Meta-Analysis Using SAS by Winfred Arthur, Winston Bennett, and Allen Huffcutt (2001). Though meta-analyses will vary somewhat in their methods and their purpose, most meta-analyses involving personnel selection issues such as those discussed in this book try to answer three questions: 1) What is the mean validity coefficient found in the literature for a given selection method (e.g., education, interviews, assessment centers, cognitive ability)? 2) If we had a perfect measure of the predictor (e.g., intelligence, computer knowledge), a perfect measure of performance, and no restriction in range, what would be the "true correlation" between our selection method and performance? 3) Can we generalize the meta-analysis results to every law enforcement agency (validity generalization), or is our selection method a better predictor of performance in some situations than in others (e.g., large vs. small departments, police departments vs. sheriff’s offices)? Conducting a Meta-Analysis
Finding Studies
Introduction to Meta-Analysis 5
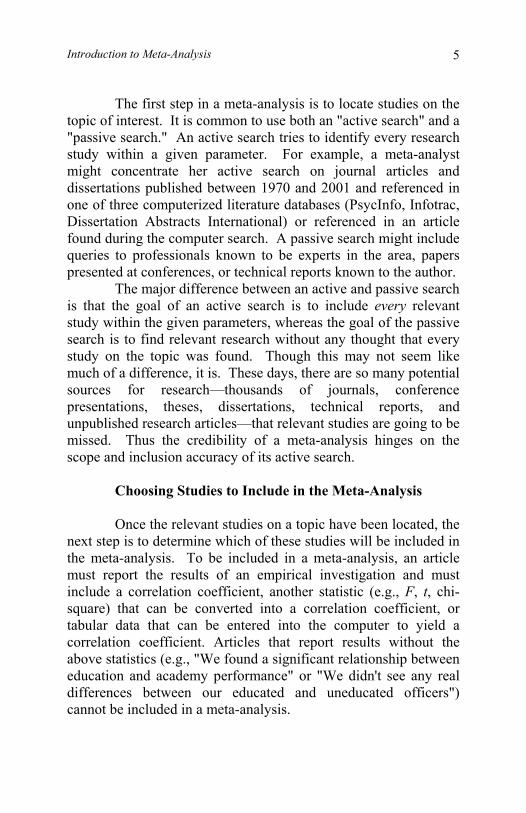
The first step in a meta-analysis is to locate studies on the topic of interest. It is common to use both an "active search" and a "passive search." An active search tries to identify every research study within a given parameter. For example, a meta-analyst might concentrate her active search on journal articles and dissertations published between 1970 and 2001 and referenced in one of three computerized literature databases (PsycInfo, Infotrac, Dissertation Abstracts International) or referenced in an article found during the computer search. A passive search might include queries to professionals known to be experts in the area, papers presented at conferences, or technical reports known to the author. The major difference between an active and passive search is that the goal of an active search is to include every relevant study within the given parameters, whereas the goal of the passive search is to find relevant research without any thought that every study on the topic was found. Though this may not seem like much of a difference, it is. These days, there are so many potential sources for research—thousands of journals, conference presentations, theses, dissertations, technical reports, and unpublished research articles—that relevant studies are going to be missed. Thus the credibility of a meta-analysis hinges on the scope and inclusion accuracy of its active search. Choosing Studies to Include in the Meta-Analysis Once the relevant studies on a topic have been located, the next step is to determine which of these studies will be included in the meta-analysis. To be included in a meta-analysis, an article must report the results of an empirical investigation and must include a correlation coefficient, another statistic (e.g., F, t, chi-square) that can be converted into a correlation coefficient, or tabular data that can be entered into the computer to yield a correlation coefficient. Articles that report results without the above statistics (e.g., "We found a significant relationship between education and academy performance" or "We didn't see any real differences between our educated and uneducated officers") cannot be included in a meta-analysis.
Research in Law Enforcement Selection 6
Often, meta-analysts will have other rules about including studies. For example, in a meta-analysis on employee-wellness programs, the researcher’s decision to include only studies using both pre- and post-measures of absenteeism as well as experimental and control groups resulted in only three usable studies. Converting Research Findings to Correlations
Once research articles have been located and the decision made as to which articles to include, statistical results (e.g., F, t, Chi-square) that need to be converted into correlation coefficients are converted using the formulas provided in Arthur et al. (2001). In some cases, raw data or data listed in tables can be entered into a statistical program (e.g., SAS, SPSS) to directly compute a correlation coefficient. Cumulating Validity Coefficients
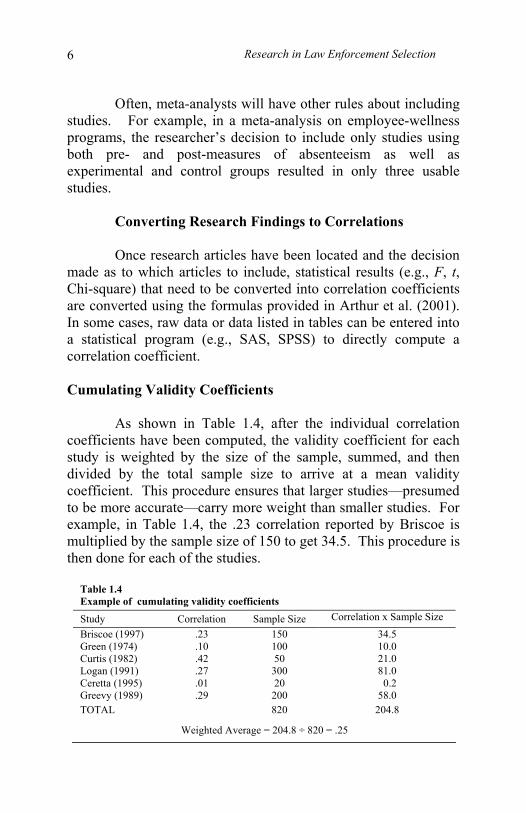
As shown in Table 1.4, after the individual correlation coefficients have been computed, the validity coefficient for each study is weighted by the size of the sample, summed, and then divided by the total sample size to arrive at a mean validity coefficient. This procedure ensures that larger studies—presumed to be more accurate—carry more weight than smaller studies. For example, in Table 1.4, the .23 correlation reported by Briscoe is multiplied by the sample size of 150 to get 34.5. This procedure is then done for each of the studies.
Table 1.4 Example of cumulating validity coefficients
Study Correlation Sample Size Correlation x Sample Size Briscoe (1997) .23 150 34.5 Green (1974) .10 100 10.0 Curtis (1982) .42 50 21.0 Logan (1991) .27 300 81.0 Ceretta (1995) .01 20 0.2 Greevy (1989) .29 200 58.0 TOTAL 820 204.8
Weighted Average = 204.8 ÷ 820 = .25
Introduction to Meta-Analysis 7
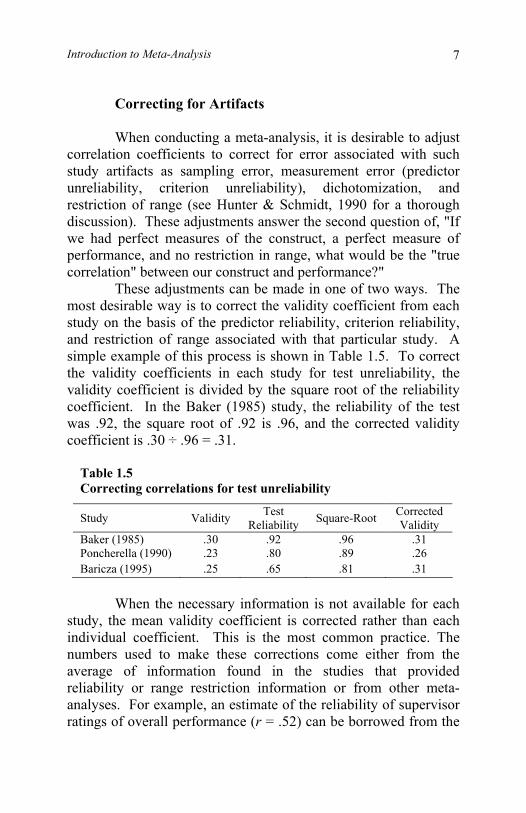
Correcting for Artifacts When conducting a meta-analysis, it is desirable to adjust correlation coefficients to correct for error associated with such study artifacts as sampling error, measurement error (predictor unreliability, criterion unreliability), dichotomization, and restriction of range (see Hunter & Schmidt, 1990 for a thorough discussion). These adjustments answer the second question of, "If we had perfect measures of the construct, a perfect measure of performance, and no restriction in range, what would be the "true correlation" between our construct and performance?" These adjustments can be made in one of two ways. The most desirable way is to correct the validity coefficient from each study on the basis of the predictor reliability, criterion reliability, and restriction of range associated with that particular study. A simple example of this process is shown in Table 1.5. To correct the validity coefficients in each study for test unreliability, the validity coefficient is divided by the square root of the reliability coefficient. In the Baker (1985) study, the reliability of the test was .92, the square root of .92 is .96, and the corrected validity coefficient is .30 ÷ .96 = .31.
Table 1.5 Correcting correlations for test unreliability
Study Validity Test Reliability Square-Root Corrected
Validity Baker (1985) .30 .92 .96 .31 Poncherella (1990) .23 .80 .89 .26 Baricza (1995) .25 .65 .81 .31
When the necessary information is not available for each study, the mean validity coefficient is corrected rather than each individual coefficient. This is the most common practice. The numbers used to make these corrections come either from the average of information found in the studies that provided reliability or range restriction information or from other meta-analyses. For example, an estimate of the reliability of supervisor ratings of overall performance (r = .52) can be borrowed from the
Research in Law Enforcement Selection 8
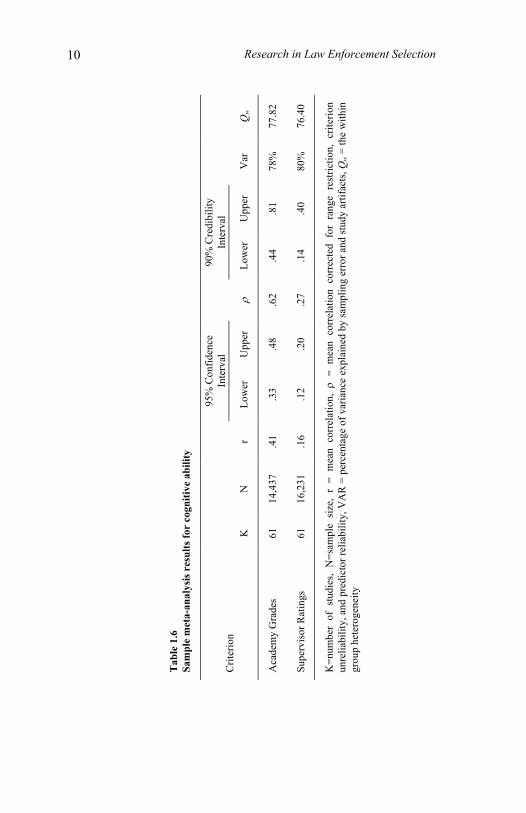
meta-analysis on rating reliability by Viswesvaran, Ones, and Schmidt (1996). Searching for Moderators Being able to generalize meta-analysis findings across all similar organizations and settings (validity generalization) is an important goal of any meta-analysis. It is standard practice in meta-analysis to generalize results when at least 75% of the observed variability in validity coefficients can be attributed to sampling and measurement error. When less than 75% can be attributed to sampling and measurement error, a search is conducted to find variables that might moderate the size of the validity coefficient. For example, education might predict performance better in larger police departments than in smaller ones. The idea behind this 75% rule is that due to sampling and measurement error, we expect correlations to differ from study to study. The question is, are the differences we observe just sampling and measurement error, or do they represent real differences in studies? That is, is the difference between the correlation of .30 found in one study and the correlation of .20 found in another study due to sampling error, or is the difference due to one study being conducted in an urban police department and the other being conducted in a rural department? To answer this question there are formulas that tell us how much variability in studies we have in our meta-analysis, and how much of that variability would be expected due to sampling error and how much due to measurement error. Understanding Meta-Analysis Results Now that you have an idea about how a meta-analysis is conducted, let's talk about how to understand the meta-analysis results you will find in this book. In Table 1.6 you will find the partial results of a meta-analysis conducted on the relationship between cognitive ability and police performance. The numbers in the table represent the validity of cognitive ability in predicting
Introduction to Meta-Analysis 9
academy grades and supervisor ratings of performance as a police officer. Number of Studies and Sample Size The "K" column indicates the number of studies included in the meta-analysis and the "N" column indicates the number of total subjects in the studies. There is not a magical number of studies we look for but a meta-analysis with 20 studies is clearly more useful than one with 5. Mean Observed Validity Coefficient The "r" column represents the mean validity coefficient across all studies (weighted by the size of the sample). This coefficient answers our question about the typical validity coefficient found in validation studies on the topic of cognitive ability and police performance. On the basis of our meta-analysis, we would conclude that the validity of cognitive ability in predicting academy grades is .41 and the validity of cognitive ability in predicting supervisor ratings of on-the-job performance is .16. Confidence Intervals To determine if our observed validity coefficient is "statistically significant," we look at the next two columns that represent the lower and upper limits to our 95% confidence interval. If the interval includes zero, we cannot say that our mean validity coefficient is significant. From the figures in Table 1.6, we would conclude that cognitive ability is a significant predictor of grades in the academy (our confidence interval is .33 - .48) and performance as a police officer (our confidence interval is .12 - .20).
Research in Law Enforcement Selection 10
Qw
77.8
2
76.4
0
Var
78%
80%
Upp
er
.81
.40
90%
Cre
dibi
lity
Inte
rval
Low
er
.44
.14
ρ .62
.27
Upp
er
.48
.20
95%
Con
fiden
ce
Inte
rval
Low
er
.33
.12
r .41
.16
N
14,4
37
16,2
31
K
61
61
Tab
le 1
.6
Sam
ple
met
a-an
alys
is r
esul
ts fo
r co
gniti
ve a
bilit
y
Crit
erio
n
Aca
dem
y G
rade
s
Supe
rvis
or R
atin
gs
K=n
umbe
r of
stu
dies
, N
=sam
ple
size
, r
= m
ean
corr
elat
ion,
ρ =
mea
n co
rrel
atio
n co
rrec
ted
for
rang
e re
stric
tion,
crit
erio
n un
relia
bilit
y, a
nd p
redi
ctor
relia
bilit
y, V
AR
= p
erce
ntag
e of
var
ianc
e ex
plai
ned
by sa
mpl
ing
erro
r and
stud
y ar
tifac
ts, Q
w =
the
with
in
grou
p he
tero
gene
ity
Introduction to Meta-Analysis 11
Using confidence intervals we can communicate our findings with a sentence such as, “Though our best estimate of the validity of cognitive ability in predicting academy performance is .41, we are 95% confident that the validity is no lower than .33 and no higher than .48.” It is important to note that some meta-analyses use 80%, 85%, or 90% confidence intervals. The choice of confidence interval levels is a reflection of how conservative a meta-analyst wants to be: The more cautious one wants to be in interpreting the meta-analysis results, the higher the confidence interval used. Corrections for Artifacts The column labeled ρ (rho) represents our mean validity coefficient corrected for criterion unreliability, predictor unreliability, and range restriction. This coefficient represents what the "true validity" of cognitive ability would be if we had a perfectly reliable measure of cognitive ability, a perfectly reliable measure of academy grades and supervisor ratings of performance, and no range restriction. Notice how our observed correlations of .41 and .16 increase to .62 and .27 after being corrected for study artifacts. When encountering ρ, it is important to consider how many of the artifacts were included in the corrected correlation. That is, two meta-analyses on the same topic might yield different results if one meta-analysis corrected for all three artifacts while another corrected only for criterion unreliability. Credibility Interval Credibility intervals are used to determine if the corrected correlation coefficient (ρ) is statistically significant and if there are moderators present. Whereas a standard deviation is used to compute a confidence interval, the standard error is used to compute a credibility interval. As with confidence intervals, if a credibility interval includes zero, the corrected correlation coefficient is not statistically significant. If a credibility interval contains zero or is large, the conclusion to be drawn is that the corrected validity coefficient cannot be generalized and that
Research in Law Enforcement Selection 12
moderators are operating (Arthur, Bennett, & Huffcutt, 2001). When reading a meta-analysis table, caution must be taken as the abbreviation CI is often used both for confidence and credibility intervals.
Percentage of Variance Due to Sampling Error and Study Artifacts
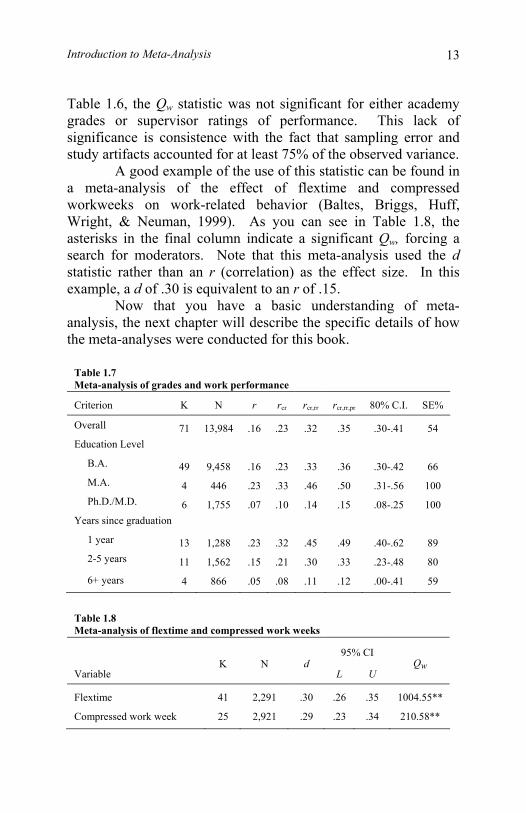
The next column in a meta-analysis table represents the percentage of observed variance that is due to sampling error and study artifacts. Notice that for grades and performance, these percentages are 78% and 80% respectively. Because the percentage is greater than 75, we can generalize our findings and do not need to search for moderators. Such a finding is desired, but is unusual. More typical is the meta-analysis results shown in Table 1.7. These results are from the excellent meta-analysis of the relationship between grades in school and work performance that was conducted by Roth, BeVier, Switzer, and Schippmann (1996). Roth and his colleagues found that only 54% of the observed variance in correlations would have been expected by sampling error and study artifacts. Because of this, they were forced to search for moderators. They hypothesized that the level of education where the grades were earned (undergraduate, masters, or doctoral program) might moderate the validity of how well grades predicted work performance. As you can see from the table, the validity of grades in master’s degree programs was higher than in doctoral programs, and sampling error and study artifacts explained 100% of the variability across studies for these two levels. However, sampling error and study artifacts accounted for only 66% of the observed variance in correlations for grades earned at the bachelor’s level. So, the researchers further broke the bachelor’s level grades down by the years since graduation. Rather than using the 75% rule, some meta-analyses use a test of statistical significance. The results of these tests are reported as a Qw or Hw statistic. If this statistic is significant, then a search for moderators must be made. If the statistic is not significant, we can generalize our findings. As shown back in
Introduction to Meta-Analysis 13
Table 1.6, the Qw statistic was not significant for either academy grades or supervisor ratings of performance. This lack of significance is consistence with the fact that sampling error and study artifacts accounted for at least 75% of the observed variance. A good example of the use of this statistic can be found in a meta-analysis of the effect of flextime and compressed workweeks on work-related behavior (Baltes, Briggs, Huff, Wright, & Neuman, 1999). As you can see in Table 1.8, the asterisks in the final column indicate a significant Qw, forcing a search for moderators. Note that this meta-analysis used the d statistic rather than an r (correlation) as the effect size. In this example, a d of .30 is equivalent to an r of .15. Now that you have a basic understanding of meta-analysis, the next chapter will describe the specific details of how the meta-analyses were conducted for this book.
Table 1.7 Meta-analysis of grades and work performance
Criterion K N r rcr rcr,rr rcr,rr,pr 80% C.I. SE%
Overall 71 13,984 .16 .23 .32 .35 .30-.41 54 Education Level B.A. 49 9,458 .16 .23 .33 .36 .30-.42 66 M.A. 4 446 .23 .33 .46 .50 .31-.56 100 Ph.D./M.D. 6 1,755 .07 .10 .14 .15 .08-.25 100 Years since graduation 1 year 13 1,288 .23 .32 .45 .49 .40-.62 89 2-5 years 11 1,562 .15 .21 .30 .33 .23-.48 80
6+ years 4 866 .05 .08 .11 .12 .00-.41 59
Table 1.8 Meta-analysis of flextime and compressed work weeks
95% CI
Variable K N d
L U Qw
Flextime 41 2,291 .30 .26 .35 1004.55**
Compressed work week 25 2,921 .29 .23 .34 210.58**
Research in Law Enforcement Selection 14
Chapter References Arthur, W., Bennett, W., & Huffcutt, A. I. (2001). Conducting
meta-analysis using SAS. Mahwah, NJ: Erlbaum. Baltes, B. B., Briggs, T. E., Huff, J. W., Wright, J. A., and
Neuman, G. A. (1999). Flexible and compressed work-week schedules: A meta-analysis of their effects on work-related criteria. Journal of Applied Psychology, 84(4), 496-513.
Glass, G. V. (1976). Primary, secondary and meta-analysis of research. Educational Researcher, 5, 3-8.
Hunter, J. E., & Schmidt, F. L. (1990). Methods of meta-analysis: Correcting error and bias in research findings. Newbury Park, CA: Sage Publications.
Roth, P. L., BeVier, C. A., Switzer, F. S., & Schippmann, J. S. (1996). Meta-analyzing the relationship between grades and job performance. Journal of Applied Psychology, 81(5), 548-556.
Viswesvaran, C., Ones, D. S., & Schmidt, F. L. (1996). Comparative analysis of the reliability of job performance ratings. Journal of Applied Psychology, 81(5), 557-574.
The Meta-Analysis 15
Chapter 2 The Meta-Analysis
The meta-analyses presented in this book were conducted using the techniques recommended by Hunter and Schmidt (1990) and Arthur, Bennett, and Huffcutt (2001). Unless specified in later chapters, all meta-analyses were conducted using the following method. Finding Studies
As mentioned in the introduction, the first step was to locate studies correlating the results of selection methods (e.g., cognitive ability, education, personality) with some measure of law enforcement performance (e.g., academy grades, supervisor ratings). The active search for such studies was concentrated on journal articles, theses, and dissertations published between 1970 and 2003. Studies published prior to 1970 or more recently than 2003 were included when found but inclusion outside of the years 1970-2003 would not be considered exhaustive. To find relevant studies, the following sources were used:
Dissertation Abstracts Online was used to search for relevant dissertations. Interlibrary loan was used to obtain most of the dissertations. When dissertations could not be loaned, they were purchased from the University of Michigan dissertation service. There were a few dissertations and theses that could not be obtained because their home library would not loan them and they were not available for purchase.
WorldCat was used to search for relevant master’s theses, dissertations, and books. WorldCat is a listing of books contained in many libraries throughout the world and was the single best source for finding relevant master’s theses.
Research in Law Enforcement Selection 16
PsycInfo, InfoTrac OneFile, ArticleFirst, ERIC, Periodicals Contents Index, Factiva, Lexis-Nexis, and Criminal Justice Abstracts were used to search for relevant journal articles and other periodicals.
Hand searches were made of the Journal of Police and Criminal Psychology, Journal of Criminal Justice, Journal of Police Science and Administration, Police Quarterly, and Public Personnel Management.
Reference lists from journal articles, theses, and dissertations were used to identify other relevant material.
Keywords used to search electronic databases included combinations of occupational terms (e.g., police, law enforcement, sheriff) with predictors (e.g., education, personality, MMPI, CPI, cognitive ability, IQ, military), methods (e.g., validity, relationship, predicting), and criteria (e.g., academy, performance, grades, commendations).
The search for documents stopped when computer searches failed to yield new sources and no new sources from reference lists appeared. To be included in this book, a study had to be an empirical investigation of the validity of a selection method applied to a law enforcement sample and had to include data. There were hundreds of articles on the topic of police selection that did not include data and these were not summarized. The literature search yielded 339 relevant studies: 155 journal articles, 41 master’s theses, 115 doctoral dissertations, 10 technical reports, 12 books, and 6 conference presentations. The 339 studies included 110,464 law enforcement personnel—88% of whom were men and 72% of whom were white. Further information on the studies used in this book can be found in Table 2.1. Technical summaries of each article included in the meta-analyses can be accessed in a PDF file at www.radford.edu/~maamodt/riles.htm.
To be included in the meta-analysis, an article had to report the results of an empirical investigation and had to include a correlation coefficient, another statistic that could be converted to a correlation coefficient (e.g., t, F, χ2), or tabular data or raw data that could be analyzed to yield a correlation coefficient. Articles reporting results without the above statistics (e.g., "We found a
The Meta-Analysis 17
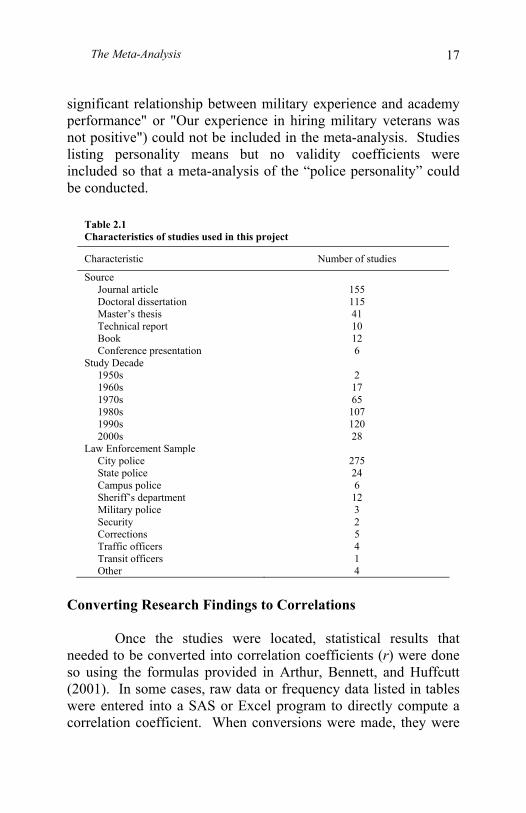
significant relationship between military experience and academy performance" or "Our experience in hiring military veterans was not positive") could not be included in the meta-analysis. Studies listing personality means but no validity coefficients were included so that a meta-analysis of the “police personality” could be conducted.
Table 2.1 Characteristics of studies used in this project
Characteristic Number of studies
Source Journal article 155 Doctoral dissertation 115 Master’s thesis 41 Technical report 10 Book 12 Conference presentation 6 Study Decade 1950s 2 1960s 17 1970s 65 1980s 107 1990s 120 2000s 28 Law Enforcement Sample City police 275 State police 24 Campus police 6 Sheriff’s department 12 Military police 3 Security 2 Corrections 5 Traffic officers 4 Transit officers 1 Other 4
Converting Research Findings to Correlations
Once the studies were located, statistical results that needed to be converted into correlation coefficients (r) were done so using the formulas provided in Arthur, Bennett, and Huffcutt (2001). In some cases, raw data or frequency data listed in tables were entered into a SAS or Excel program to directly compute a correlation coefficient. When conversions were made, they were
Research in Law Enforcement Selection 18
noted in the article summaries located in the previously mentioned PDF file. There were several occasions when the reanalysis of the raw data indicated a computational or transposition error in the original study. For example, the results of one dissertation were clearly different from all other studies. When reviewing the raw data included at the end of the dissertation, it was apparent that the author had coded missing data with a “9” but did not indicate in the SPSS program that a nine represented missing data. When the data were reanalyzed with a nine as missing data rather than as the digit nine, the results were consistent with other studies. When such reanalysis was conducted, a notation was made in the article summary.
Cumulating Validity Coefficients
After the individual correlation coefficients were computed, the validity coefficient for each study was weighted by the size of the sample and the coefficients combined using the method suggested by Hunter and Schmidt (1990) and Arthur, Bennett, and Huffcutt (2001). In addition to the mean validity coefficient, the observed variance, amount of variance expected due to sampling error, 95% confidence interval, true (corrected) correlation, and 90% credibility interval were calculated. All meta-analysis calculations were performed using Meta-Manager, an Excel-based program written by the author for this project. The integrity of the formulas in Meta-Manager were validated using datasets and meta-analysis results provided in Arthur, Bennett, and Huffcutt (2001) and in Hunter and Schmidt (1990). Copies of the Meta-Manager template can be obtained without cost from the author ([email protected]).
Correcting for Artifacts As mentioned in the previous chapter, when conducting a meta-analysis, it is desirable to adjust correlation coefficients to correct for attenuation due to error associated with predictor unreliability, criterion unreliability, restriction of range, and a host of other artifacts (see Hunter & Schmidt, 1990 for a thorough
The Meta-Analysis 19
discussion). Corrections for restriction in range and measurement unreliability can be made in one of two ways. The most desirable is to correct the validity coefficient from each study based on the predictor reliability, criterion reliability, and restriction of range associated with that particular study. To do this, however, each study must provide this information and very few of the studies included in this project, or any meta-analysis project for that matter, provide information on range restriction, predictor reliability, or criterion reliability. So, corrections were made to the mean validity coefficients rather than the individual validity coefficients.
The corrections were made using either the mean values from studies providing the necessary information or from values suggested in previous meta-analyses. In conducting a meta-analysis, the figures used to make corrections is an important one because the wrong choice will result in either an overestimation or underestimation of the true validity of a construct. In considering the figures to use in this meta-analysis, I compared the corrections used in previous meta-analyses with those obtained for the studies in this project. Those figures are shown in Tables 2.2, 2.3, and 2.4.
The corrections used in this meta-analysis are shown in Table 2.5. To correct for unreliability of supervisor ratings, I used the reliability data from the 25 studies in this project that provided such information. Though the reliability coefficient of .64 is above the .52 (Viswesvaran, Ones, & Schmidt, 1996) and .51 (Conway & Huffcutt, 1997) reported in previous meta-analyses of the reliability of supervisor ratings, it is lower than the .73 used by Hirsh, Northrop, and Schmidt (1986) in their earlier meta-analysis of the validity of cognitive ability in law enforcement occupations and similar to those used in meta-analyses by Tett, Jackson, and Rothstein (1991), Gaugler, Rosenthal, Thornton, and Bentson (1997), and Salgado, Anderson, Moscoso, Bertua, and De Fruyt (2003a). Though the use of such a high reliability coefficient may result in an underestimation of the true validity of selection techniques in predicting supervisor ratings, it seems reasonable given the consistency of my findings and those of previous meta-analyses.