aalborg universitet regional policy in european regions. a
TRANSCRIPT
Aalborg Universitet
Regional Policy in European Regions. A Survey of Regional Development AgencyPolicies and Their Knowledge Implications
Halkier, Henrik
Publication date:2010
Document VersionPublisher's PDF, also known as Version of record
Link to publication from Aalborg University
Citation for published version (APA):Halkier, H. (2010). Regional Policy in European Regions. A Survey of Regional Development Agency Policiesand Their Knowledge Implications. Center for Regional Udvikling (CRU), Aalborg Universitet.
General rightsCopyright and moral rights for the publications made accessible in the public portal are retained by the authors and/or other copyright ownersand it is a condition of accessing publications that users recognise and abide by the legal requirements associated with these rights.
- Users may download and print one copy of any publication from the public portal for the purpose of private study or research. - You may not further distribute the material or use it for any profit-making activity or commercial gain - You may freely distribute the URL identifying the publication in the public portal -
Take down policyIf you believe that this document breaches copyright please contact us at [email protected] providing details, and we will remove access tothe work immediately and investigate your claim.
Downloaded from vbn.aau.dk on: March 21, 2022
WP1c FINAL REPORT
REGIONAL POLICY IN EUROPEAN REGIONS
A SURVEY OF REGIONAL DEVELOPMENT AGENCY POLICIES
AND THEIR KNOWLEDGE IMPLICATIONS
Henrik Halkier
CRU Centre for Regional Development Aalborg University, Denmark
July 2010

2
Contents
1. Introduction ........................................................................................................................ 3 2. Conceptual framework and empirical methods.................................................................. 6
2.1. An institutionalist perspective on regional policy...................................................... 6 2.2. Empirical methods.................................................................................................... 10
3. Contexts of regional policy .............................................................................................. 13 4. Regional policies: Key dimensions .................................................................................. 16
4.1. Organisation and strategies ...................................................................................... 16 4.2. Targets and instruments ........................................................................................... 18 4.3. Knowledge implications of RDA policies ............................................................... 20 4.4. RDAs and their regional policy context................................................................... 21
5. Patterns of regional policy................................................................................................ 24
5.1. Patterns of RDA sponsorship ................................................................................... 24 5.2. Patterns of RDA strategies ....................................................................................... 25 5.3. Patterns of RDA policy targets and instruments ...................................................... 26 5.4. Patterns of RDA policy knowledge types ................................................................ 27 5.5. Patterns of RDA policies: Overlapping influences .................................................. 27
6. Conclusion and confrontation with WP8 hypotheses ...................................................... 29
6.1. RDA profiling .......................................................................................................... 29 6.2. Confrontation with WP8 policy hypotheses............................................................. 30 6.3. Policy scoping .......................................................................................................... 31
7. Appendix 1: RDAs included in the survey....................................................................... 33 8. Appendix 2: Figuring out policy patterns ........................................................................ 38 9. Appendix 3: European and regional survey results compared ......................................... 44 10. Appendix 4: RDA policies and WP8 hypotheses......................................................... 48 References ................................................................................................................................ 49
3
1. Introduction
In most regions firms and organisations are subject to many different attempts to influence
their activities in order to bring them closer to public political priorities with regards to e.g.
more and better jobs, increased competitiveness, sectoral change, more knowledge-intensive
networking etc. These policies are sponsored both from within the region and from the
national/European level, and they are implemented by a wide range of public or semi-public
bodies, stretching from government department via semi-autonomous “arm’s-length” regional
development agencies to public-private partnerships or private-sector organisations acting on
behalf of public authorities. In Europe policies for regional economic development have
existed for nearly half a century, but while the interest in influencing economic activity along
spatial lines have been persistent, the form taken by public intervention has changed
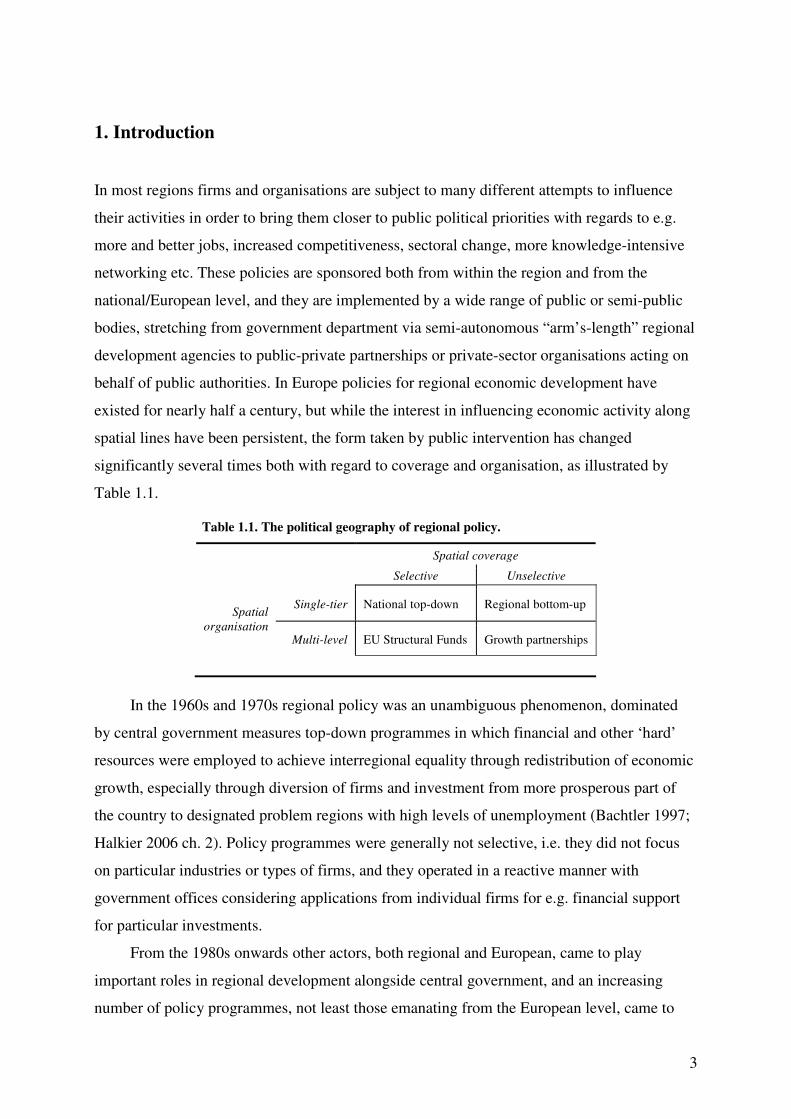
significantly several times both with regard to coverage and organisation, as illustrated by
Table 1.1.
Table 1.1. The political geography of regional policy.
Spatial coverage
Selective Unselective
Single-tier National top-down Regional bottom-up Spatial
organisation Multi-level EU Structural Funds Growth partnerships
In the 1960s and 1970s regional policy was an unambiguous phenomenon, dominated
by central government measures top-down programmes in which financial and other ‘hard’
resources were employed to achieve interregional equality through redistribution of economic
growth, especially through diversion of firms and investment from more prosperous part of
the country to designated problem regions with high levels of unemployment (Bachtler 1997;
Halkier 2006 ch. 2). Policy programmes were generally not selective, i.e. they did not focus
on particular industries or types of firms, and they operated in a reactive manner with
government offices considering applications from individual firms for e.g. financial support
for particular investments.
From the 1980s onwards other actors, both regional and European, came to play
important roles in regional development alongside central government, and an increasing
number of policy programmes, not least those emanating from the European level, came to
4
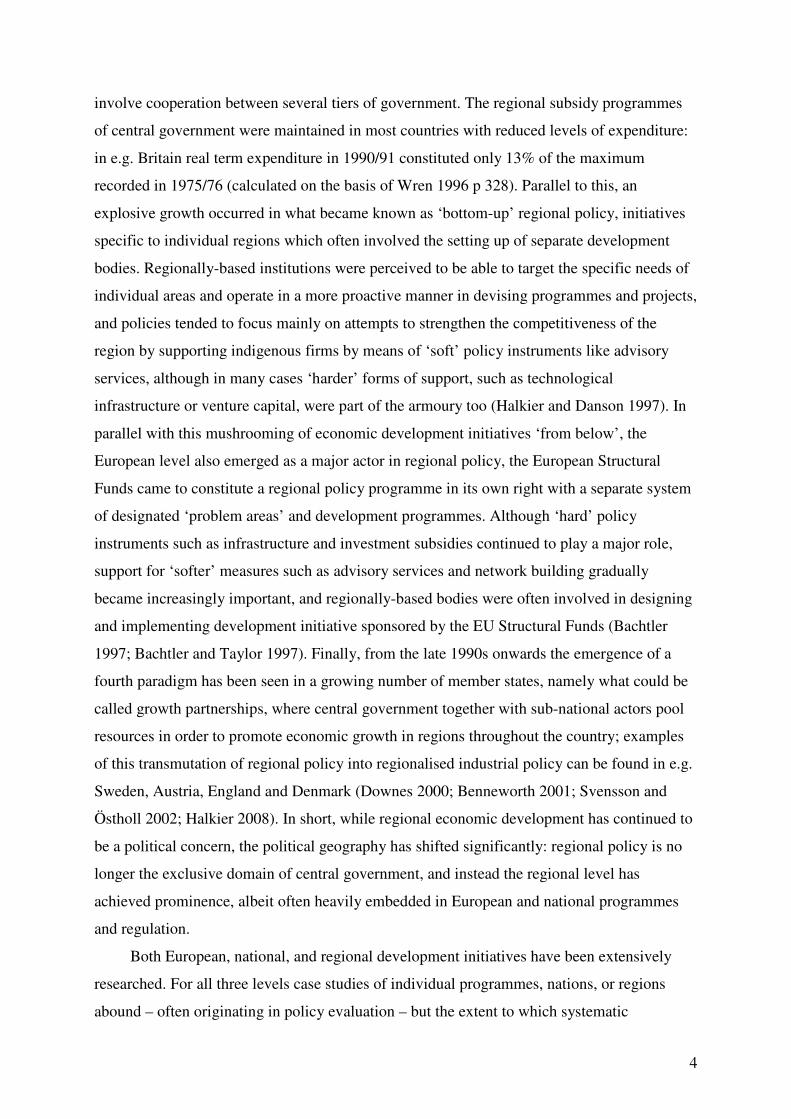
involve cooperation between several tiers of government. The regional subsidy programmes
of central government were maintained in most countries with reduced levels of expenditure:
in e.g. Britain real term expenditure in 1990/91 constituted only 13% of the maximum
recorded in 1975/76 (calculated on the basis of Wren 1996 p 328). Parallel to this, an
explosive growth occurred in what became known as ‘bottom-up’ regional policy, initiatives
specific to individual regions which often involved the setting up of separate development
bodies. Regionally-based institutions were perceived to be able to target the specific needs of
individual areas and operate in a more proactive manner in devising programmes and projects,
and policies tended to focus mainly on attempts to strengthen the competitiveness of the
region by supporting indigenous firms by means of ‘soft’ policy instruments like advisory
services, although in many cases ‘harder’ forms of support, such as technological
infrastructure or venture capital, were part of the armoury too (Halkier and Danson 1997). In
parallel with this mushrooming of economic development initiatives ‘from below’, the
European level also emerged as a major actor in regional policy, the European Structural
Funds came to constitute a regional policy programme in its own right with a separate system
of designated ‘problem areas’ and development programmes. Although ‘hard’ policy
instruments such as infrastructure and investment subsidies continued to play a major role,
support for ‘softer’ measures such as advisory services and network building gradually
became increasingly important, and regionally-based bodies were often involved in designing
and implementing development initiative sponsored by the EU Structural Funds (Bachtler
1997; Bachtler and Taylor 1997). Finally, from the late 1990s onwards the emergence of a
fourth paradigm has been seen in a growing number of member states, namely what could be
called growth partnerships, where central government together with sub-national actors pool
resources in order to promote economic growth in regions throughout the country; examples
of this transmutation of regional policy into regionalised industrial policy can be found in e.g.
Sweden, Austria, England and Denmark (Downes 2000; Benneworth 2001; Svensson and
Östholl 2002; Halkier 2008). In short, while regional economic development has continued to
be a political concern, the political geography has shifted significantly: regional policy is no
longer the exclusive domain of central government, and instead the regional level has
achieved prominence, albeit often heavily embedded in European and national programmes
and regulation.
Both European, national, and regional development initiatives have been extensively
researched. For all three levels case studies of individual programmes, nations, or regions
abound – often originating in policy evaluation – but the extent to which systematic
5
comparisons have been undertaken is uneven. While national policies for regional
development have been systematically compared since 1980 (Yuill et al. 1981-99; Bachtler
and Yuill 2007), and Structural Funds activities for decades have been subject to evaluations
and international comparisons since the late 1980s (Bachtler and Turok 1997; Bachtler and
Wren 2006), regionally-based initiatives have rarely been compared in a systematic manner
on a European scale, with previous surveys being either relative small-scale (Yuill 1982;
Halkier and Danson 1997) or limited by organisational affiliation (EURADA 1995).
This text reports the findings of the first major survey of regionally-based development
bodies and their policies, attempting in particular to illuminate their role in relation to the
emerging knowledge economy and their interactions with the wider economic and political
context in which they operate. By doing so the text provides a framework for understanding
the policies involved in individual EURODITE case studies by situating them in relation to
trends within regional policy in Europe. The following section sets out the conceptual
framework for analysis and the empirical methods employed, after which the three contexts in
which regionally-based economic development initiatives operate are briefly introduced
(economic structure/performance, governance, national and European policies). The main
body of the text presents the findings of the empirical survey with regard to the organisation,
policies and knowledge implications of regional development initiatives in Europe. Following
this, the patterns of policy variation are discussed in relation to the three main contexts in
order to get a first indication of the relative importance of the factors shaping regionally-based
development initiatives, i.e. the balance between ‘problem logic’ (similar economic
challenges result in similar policies), ‘governance logic’ (similar forms of governance result
in similar policies), and ‘policy logic’ (involvement in national/European programmes result
in similar policies). Finally the concluding section sums up the findings and relates them to
the EURODITE policy hypotheses.
6
2. Conceptual framework and empirical methods
2.1. An institutionalist perspective on regional policy
Giving an in-depth account of a particular policy paradigm – or even the operation of an
individual development body – involves attention to a vast array of features of individual
organisations, the ways in which they interact with other organisations, and the overall
structure of the policy network (see Halkier 2006, ch. 3). But in order to identify key features
that set different approaches to economic development apart between regions in the context of
a large-scale survey, focusing on three relationships in particular would seem to make sense,
namely
• the relationship between the region and its wider geographical context in terms of private
economic competitiveness, public governance structures, and involvement in
national/European regional policy programmes,
• the relationship between the region and the policy-making organisation (for the sake of
brevity referred to as the regional development agency (RDA) in the following) in terms
of the resources being made available for policy activities, and
• the policies of the RDA which are designed to influence, directly or indirectly, the
behaviour of firms, citizens and other public organisations in ways that are conducive to
achieving regional development goals.
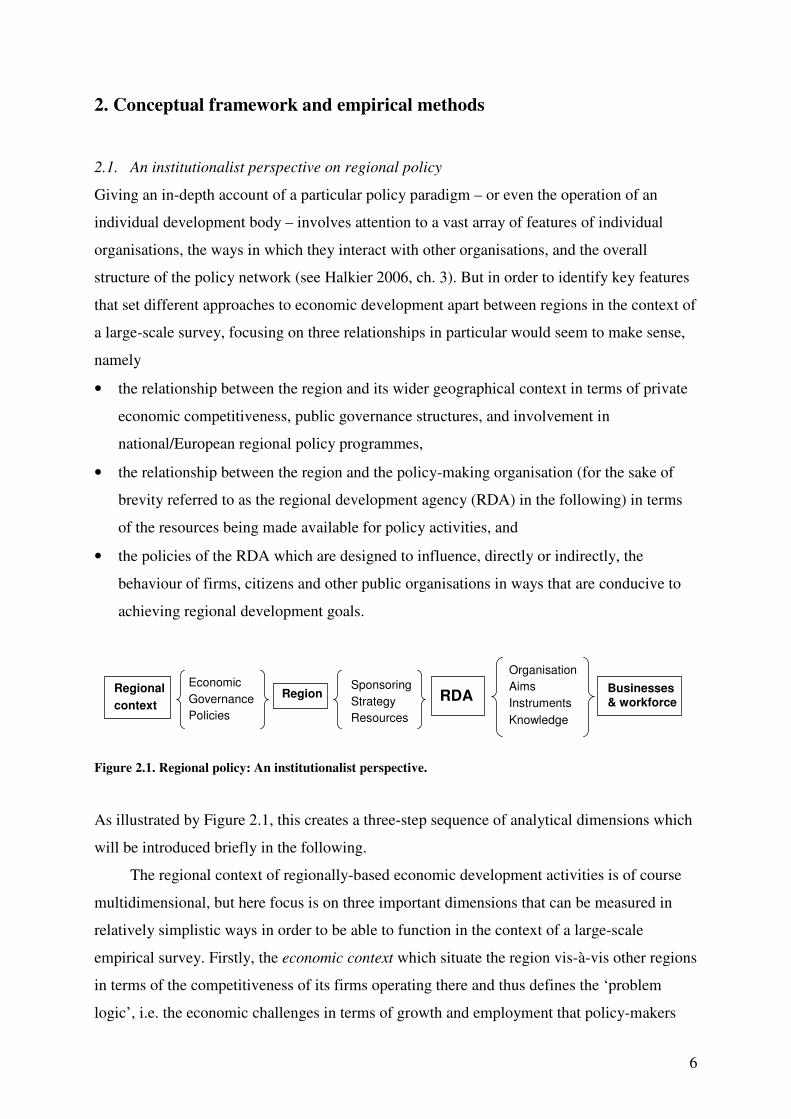
Figure 2.1. Regional policy: An institutionalist perspective.
As illustrated by Figure 2.1, this creates a three-step sequence of analytical dimensions which
will be introduced briefly in the following.
The regional context of regionally-based economic development activities is of course
multidimensional, but here focus is on three important dimensions that can be measured in
relatively simplistic ways in order to be able to function in the context of a large-scale
empirical survey. Firstly, the economic context which situate the region vis-à-vis other regions
in terms of the competitiveness of its firms operating there and thus defines the ‘problem
logic’, i.e. the economic challenges in terms of growth and employment that policy-makers
Regional
context Region Businesses
& workforce
Economic
Governance
Policies
Sponsoring
Strategy
Resources
Organisation
Aims
Instruments
Knowledge
RDA

7
may want to address through various forms of public intervention. In order to maintain a
focus on dynamic economic development and knowledge processes, this is measured using
the synthetic index developed as part of WP4 of the EURODITE project for Western
European countries for which data has been available (Carrincazeaux et al. 2007), and using a
more simplistic GDP measure for CEE member states where data for the synthetic
EURODITE index has not been available. Secondly, the ability of individual regions to
respond to perceived economic challenges is circumscribed by the governance context, i.e. the
extent to which they have powers to institute and finance policy initiatives and hence define
the ‘governance logic’ of what can be done by policy-makers at the regional level. This can be
measured in many different ways, but for the purpose of this survey the general degree of
decision-making capacity enjoyed by individual regions is illuminated through the
comprehensive synthetic index developed by Lisbeth Hooghe and her collaborators (Hooghe
et al. 2008). Thirdly, the adoption of particular policy initiatives also depend on the policy
context¸ i.e. parallel policies instituted by other tiers of government attempting to address
similar issues that institute a ‘policy logic’ because their presence will either inspire or
preclude particular forms of intervention. For the purpose of this survey, the indicator used
was the extent to which regions have were designated by national and/or European regional
programmes, as recorded on the DG Regional Policy website.
The organisational context of the regional development body concerns the sponsorship
relation between the RDA and its sponsors within and/or outside the region. This describes its
freedom of action in terms of being able to decide on the aims and methods in promoting
regional development, and the resources at its disposal to translate strategies into
implemented policies. Following Halkier (2006, ch. 3), this has been translated into three
analytical dimensions, namely
• sponsor relationships (the overall degree of autonomy enjoyed by the RDA)
• resources (staff, budget)
• development strategies (the direction of economic changes seen as desirable)
Regarding the latter, key aspects are the nature of change sought and the organisations
targeted as the carriers of economic change, as illustrated by Table 2.1. While the shift from
quantitative (“more of the same”) to qualitative (“something new”) change is clearly a gradual
scale, in practice this is also the case with regard to organisational change because early-stage
development of firms are closely linked to the original act of entrepreneurship. However, still
the four basic options and the accompanying policy examples aims sketch out important

8
differences with regard to what kind of change is sought, what actors will be involved, and
what knowledge will be required in order to achieve the outcome desired.
Table 2.1. Policy aims: Changes desired.
Target organisations
Existing firms New firms
Quantitative Expansion (e.g. new markets)
Duplication (e.g. enterprise) Change in
economic
activity Qualitative
Modernisation (e.g. new technology)
Creativity (e.g. new products)
Source: Reworked on the basis of Halkier 2006, Table 3.12.
The policies aiming to influence regional development in line with strategic priorities
can be characterised through four dimensions that, taken together, delineate the specific aims
of public intervention, the instruments used, and the knowledge implications of regional
policy. Firstly, the aims of individual policies need to be established as these may of course
deviate from the general strategic thrust of the RDA, and here the categories in Table 2.1 will
again be used. Secondly, the policy targets must be considered in order to establish how the
specific aims are translated in concrete objectives for change, i.e. who/what is going to change
in which way as a result of public intervention. Although both dimensions of the table could
be subdivided further for non-survey purposes, Table 2.2 (inspired by Nauwelaers 2001) still
identifies the changing capabilities sought – material, immaterial or organisational – in
relation to different types of targets, and hence highlights the different sites of new knowledge
that is associated with particular policies.
Table 2.2. Targets of change.
Target capabilities
Hardware Software Orgware
Individuals Example: Attraction of qualified labour
Example: Training of employees
Example: Creation of professional network
Firms/
organisations
Example: Investment promotion
Example: Advisory services Example: Creation of network between firms
Target
insti-
tutions
System Example: Infrastructure improvement
Example: Development of knowledge institutions
Example: Creation of RDA or cluster organisation
Thirdly, the policy instruments, i.e. the means through which policymakers attempt to
bring about desirable changes among economic actors, must be identified. Policy instruments
combine resources and rules: in order to make actors behave in ways conducive to policy
goals, resources are made available on more or less stringent conditions. While the concept of
9
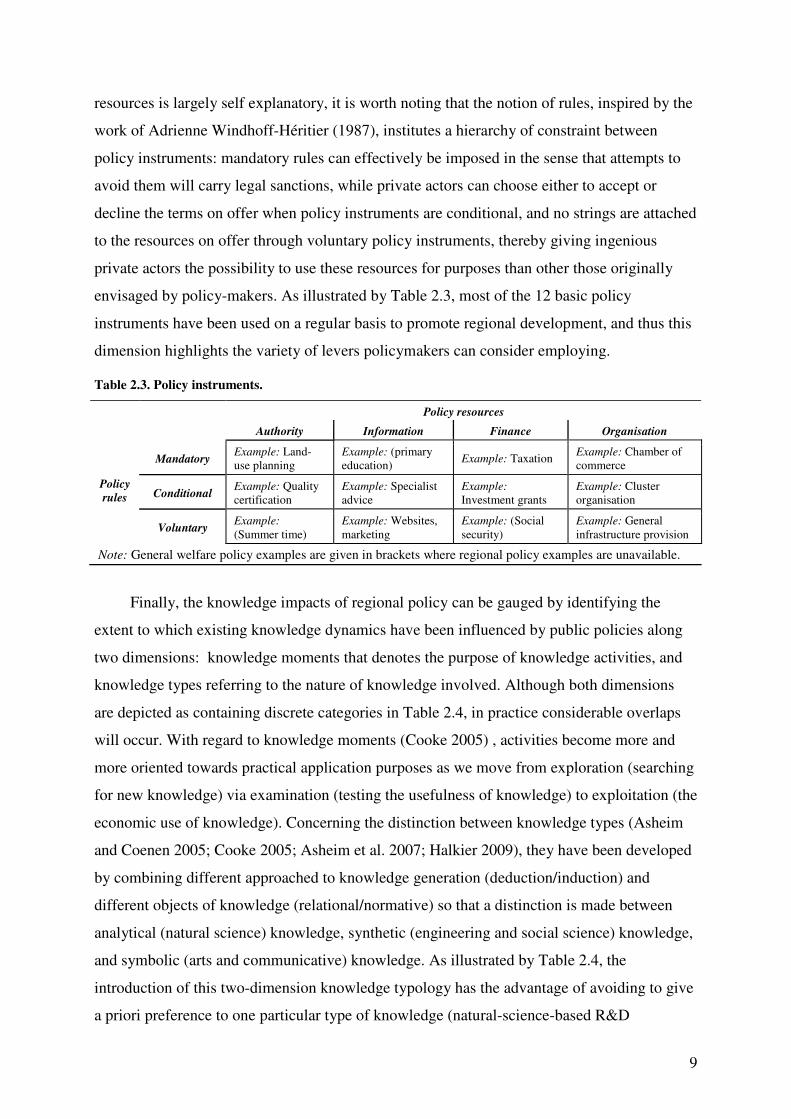
resources is largely self explanatory, it is worth noting that the notion of rules, inspired by the
work of Adrienne Windhoff-Héritier (1987), institutes a hierarchy of constraint between
policy instruments: mandatory rules can effectively be imposed in the sense that attempts to
avoid them will carry legal sanctions, while private actors can choose either to accept or
decline the terms on offer when policy instruments are conditional, and no strings are attached
to the resources on offer through voluntary policy instruments, thereby giving ingenious
private actors the possibility to use these resources for purposes than other those originally
envisaged by policy-makers. As illustrated by Table 2.3, most of the 12 basic policy
instruments have been used on a regular basis to promote regional development, and thus this
dimension highlights the variety of levers policymakers can consider employing.
Table 2.3. Policy instruments.
Policy resources
Authority Information Finance Organisation
Mandatory Example: Land-use planning
Example: (primary education)
Example: Taxation Example: Chamber of commerce
Conditional Example: Quality certification
Example: Specialist advice
Example: Investment grants
Example: Cluster organisation
Policy
rules
Voluntary Example: (Summer time)
Example: Websites, marketing
Example: (Social security)
Example: General infrastructure provision
Note: General welfare policy examples are given in brackets where regional policy examples are unavailable.
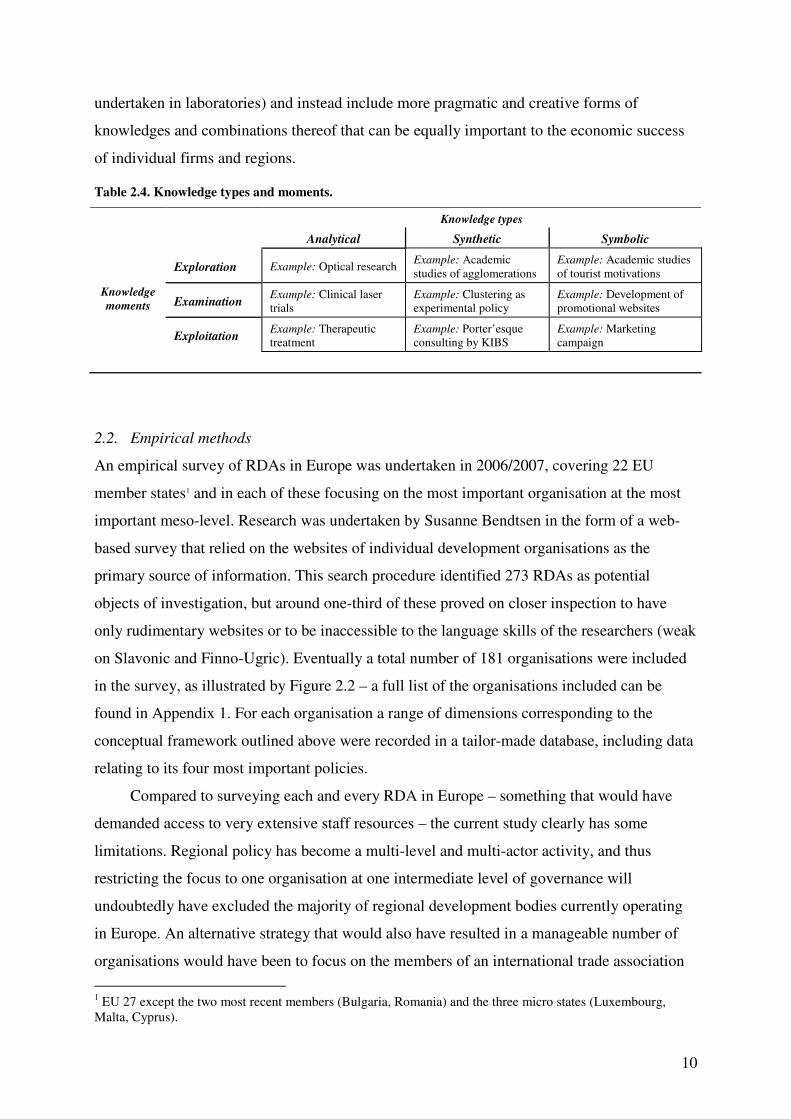
Finally, the knowledge impacts of regional policy can be gauged by identifying the
extent to which existing knowledge dynamics have been influenced by public policies along
two dimensions: knowledge moments that denotes the purpose of knowledge activities, and
knowledge types referring to the nature of knowledge involved. Although both dimensions
are depicted as containing discrete categories in Table 2.4, in practice considerable overlaps
will occur. With regard to knowledge moments (Cooke 2005) , activities become more and
more oriented towards practical application purposes as we move from exploration (searching
for new knowledge) via examination (testing the usefulness of knowledge) to exploitation (the
economic use of knowledge). Concerning the distinction between knowledge types (Asheim
and Coenen 2005; Cooke 2005; Asheim et al. 2007; Halkier 2009), they have been developed
by combining different approached to knowledge generation (deduction/induction) and
different objects of knowledge (relational/normative) so that a distinction is made between
analytical (natural science) knowledge, synthetic (engineering and social science) knowledge,
and symbolic (arts and communicative) knowledge. As illustrated by Table 2.4, the
introduction of this two-dimension knowledge typology has the advantage of avoiding to give
a priori preference to one particular type of knowledge (natural-science-based R&D
10
undertaken in laboratories) and instead include more pragmatic and creative forms of
knowledges and combinations thereof that can be equally important to the economic success
of individual firms and regions.
Table 2.4. Knowledge types and moments.
Knowledge types
Analytical Synthetic Symbolic
Exploration Example: Optical research Example: Academic studies of agglomerations
Example: Academic studies of tourist motivations
Examination Example: Clinical laser trials
Example: Clustering as experimental policy
Example: Development of promotional websites
Knowledge
moments
Exploitation Example: Therapeutic treatment
Example: Porter’esque consulting by KIBS
Example: Marketing campaign
2.2. Empirical methods
An empirical survey of RDAs in Europe was undertaken in 2006/2007, covering 22 EU
member states1 and in each of these focusing on the most important organisation at the most
important meso-level. Research was undertaken by Susanne Bendtsen in the form of a web-
based survey that relied on the websites of individual development organisations as the
primary source of information. This search procedure identified 273 RDAs as potential
objects of investigation, but around one-third of these proved on closer inspection to have
only rudimentary websites or to be inaccessible to the language skills of the researchers (weak
on Slavonic and Finno-Ugric). Eventually a total number of 181 organisations were included
in the survey, as illustrated by Figure 2.2 – a full list of the organisations included can be
found in Appendix 1. For each organisation a range of dimensions corresponding to the
conceptual framework outlined above were recorded in a tailor-made database, including data
relating to its four most important policies.
Compared to surveying each and every RDA in Europe – something that would have
demanded access to very extensive staff resources – the current study clearly has some
limitations. Regional policy has become a multi-level and multi-actor activity, and thus
restricting the focus to one organisation at one intermediate level of governance will
undoubtedly have excluded the majority of regional development bodies currently operating
in Europe. An alternative strategy that would also have resulted in a manageable number of
organisations would have been to focus on the members of an international trade association
1 EU 27 except the two most recent members (Bulgaria, Romania) and the three micro states (Luxembourg, Malta, Cyprus).

11
like e.g. Eurada, but this would also have introduced uncertainty (bias via self-selection), and
eventually organising the survey in a way that could highlight the potential importance of
different governance arrangement was preferred.
With the fast growing importance of websites as means of communication for RDAs
with their customers, political sponsors, and the general public, conducting the survey
primarily on the basis of information made public via websites has now become an option,
and although around on third of the organisations originally identified as relevant turned out
not to have websites suitable for the purposes of this study, the remainder contained sufficient
detail and often provided additional information in response to specific e-mail enquiries. In
relation to the analytical dimensions of the survey, the predominance of factual information
(funding, board membership, etc.) and simple classification of factual information (policy
targets and instruments) meant that relatively few dimensions had to be established through
more complex interpretations by the research team (e.g. strategies, knowledge implications).
The most important discretionary decision that had to be taken for each of the RDAs surveyed
was to choose the four policies to analyse; as ‘mechanical’ criteria (e.g. programme
expenditure) would create a selection bias towards programmes passing on money to client
firms or involving construction of extensive infrastructures (see Dunleavy 1989), it was
instead decided to select policies on the basis of their overall prominence, assuming that this
20/21
9/9
16/16
4/5
12/12
7/14
15/15
17/17
4/15
6/13
6/6
7/11
3/19
2/10
10/12
5/7
4/4
8/12
6/11
2/8
6/16 12/20
Figure 2.2. RDAs surveyed (actual/potential).

12
would best reflect the importance attached to particular initiatives by the organisation and its
political sponsors.
Finally, in order to identify development trends and provide a fuller picture of the multi-
level multi-actor regional policy set-up in European regions, two complementary analyses
were carried out. On the one hand comparisons with previous research undertaken on a
smaller scale in the mid-1990s (Halkier and Danson 1997) will be used to introduce a time
dimension wherever possible. On the other hand the geographical and organisational scope of
the study can be enhanced on the basis of a policy-profiling exercise undertaken by
EURODITE research teams which replicated the survey in 12 case study regions but included
a larger number of regional organisations as well as the role of national and European
programmes.
These caveats notwithstanding, the research underlying this report is still by some
distance the most extensive systematic survey of regionally-based economic development
activities undertaken on a Europe-wide basis, and with its focus on knowledge implications of
public intervention of course also an important part of the context for understanding the
relationship between regional policy and the knowledge economy.
13
3. Contexts of regional policy
Regional policies operate in a number of socio-economic contexts, and here focus is on three
important contextual dimensions that can be measured in relatively simplistic ways in order to
be able to function in the context of a large-scale empirical survey.
As the aim of regional policy is to influence economic development within the region,
an important context is the structure and performance of the regional economy because
different types of challenges are likely to elicit different policy responses. In order to capture
not just the current position of regions but also maintain a focus on economic dynamics and
knowledge processes, the synthetic index developed as part of WP4 of the EURODITE
project (Carrincazeaux, Gaschet et al. 2007) has been used where data has been available,
while a much more simplistic GDP measure has been used for CEE member states where
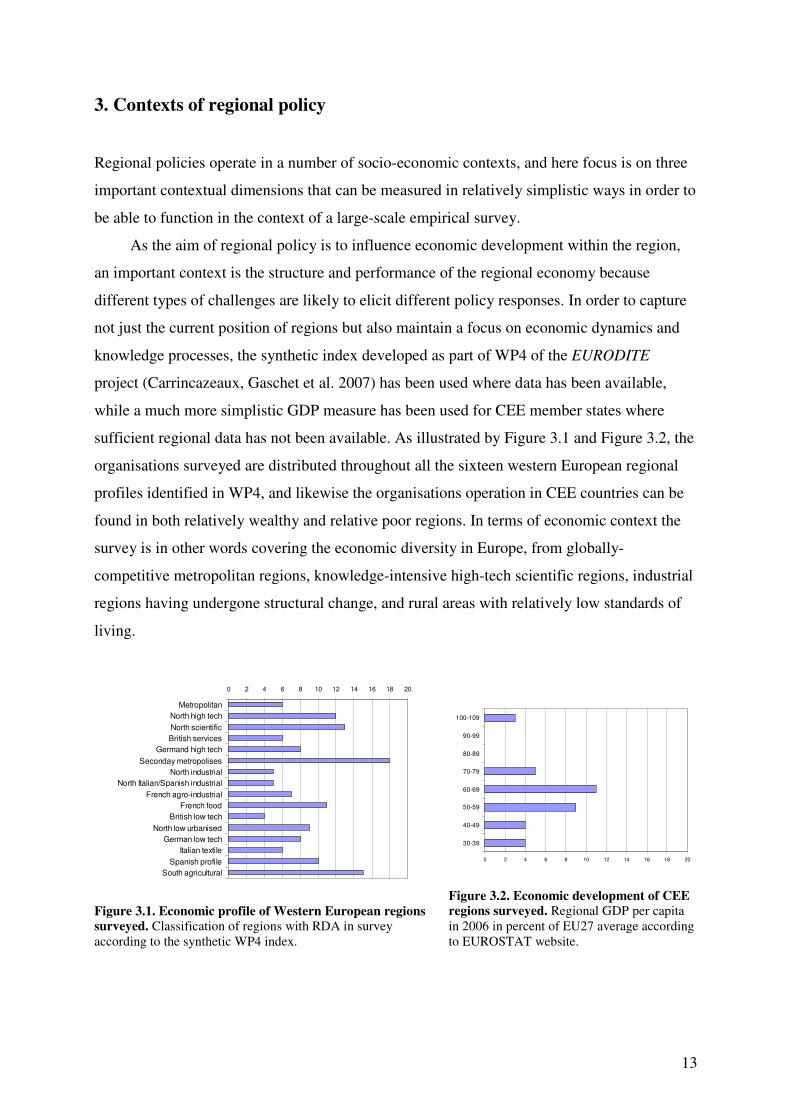
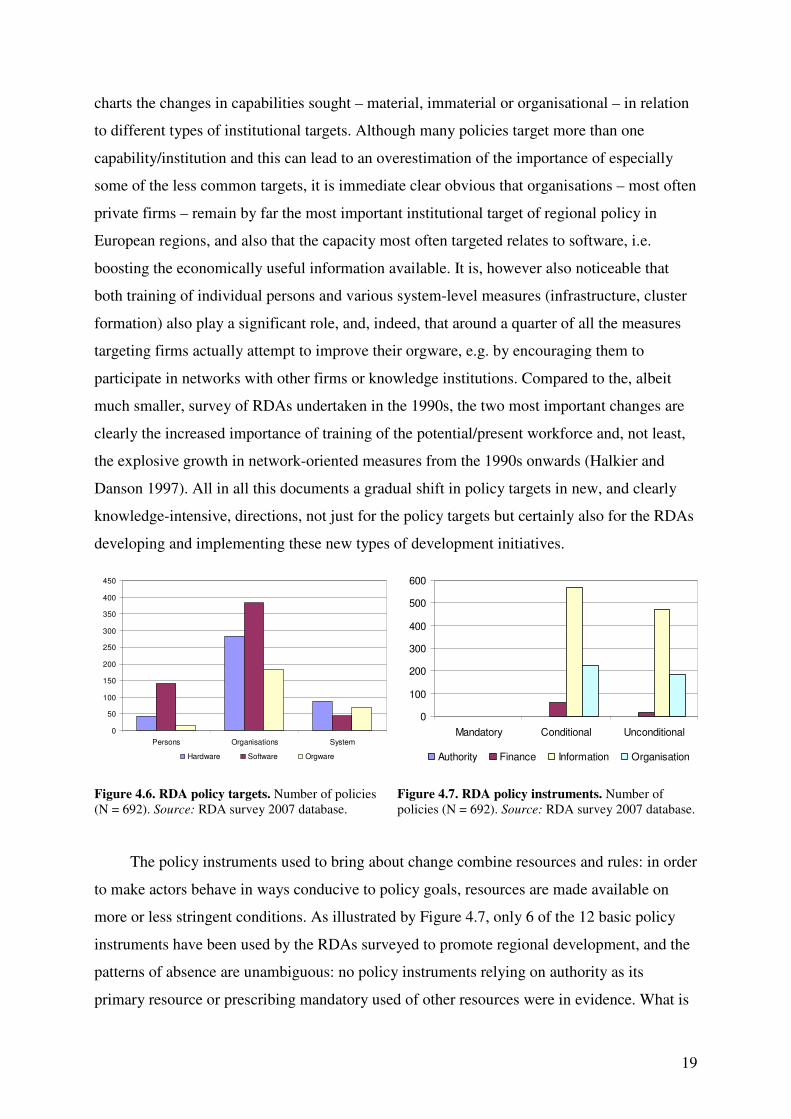
sufficient regional data has not been available. As illustrated by Figure 3.1 and Figure 3.2, the
organisations surveyed are distributed throughout all the sixteen western European regional
profiles identified in WP4, and likewise the organisations operation in CEE countries can be
found in both relatively wealthy and relative poor regions. In terms of economic context the
survey is in other words covering the economic diversity in Europe, from globally-
competitive metropolitan regions, knowledge-intensive high-tech scientific regions, industrial
regions having undergone structural change, and rural areas with relatively low standards of
living.
0 2 4 6 8 10 12 14 16 18 20
Metropolitan
North high tech
North scientific
British services
Germand high tech
Seconday metropolises
North industrial
North Italian/Spanish industrial
French agro-industrial
French food
British low tech
North low urbanised
German low tech
Italian textile
Spanish profile
South agricultural
Figure 3.1. Economic profile of Western European regions
surveyed. Classification of regions with RDA in survey according to the synthetic WP4 index.
0 2 4 6 8 10 12 14 16 18 20
30-39
40-49
50-59
60-69
70-79
80-89
90-99
100-109
Figure 3.2. Economic development of CEE
regions surveyed. Regional GDP per capita in 2006 in percent of EU27 average according to EUROSTAT website.

14
The ability of individual regions to respond to perceived economic challenges is
circumscribed by the governance context, i.e. the extent to which they have powers to
institute and finance policy initiatives. For the purpose of this survey the general degree of
decision-making capacity enjoyed by individual regions is illuminated through the
comprehensive synthetic index developed by Lisbeth Hooghe and her collaborators that
provides a general indication of the ability of individual region to institute measures to
stimulate e.g. economic development within the region (Hooghe, Marks et al. 2008). Also in
this respect a high degree of variation is in evidence, as illustrated by Figure 3.3. The German
länder, unsurprisingly, score highly and above regions in other decentralised countries (Spain,
Italy, Scotland, the Netherlands), while at the other end some countries allow very little room
for regional manoeuvre (Portugal, Estonia, Slovenia), and the great majority of regions find
themselves in a position with varying degrees of authority circumscribed by the national
system of governance.
The adoption of particular policy initiatives is also influenced by the policy context¸ i.e.
parallel policies instituted by other tiers of government attempting to address similar issues,
and for the purpose of this survey, the indicator used is the extent to which regions have been
designated by European and/or national regional programmes. As indicated by Figure 3.4, the
increasing regulation of state aid within the EU (see Wishlade 2008) has produced a high
degree of correlation between national and European regional policy designations, and a
region-by-region investigation reveals that within the survey 78 per cent of the organisations
0
5
10
15
20
25
30
35
0 1 2 3 4 5 6 7 8 9 10 11 12 13 14 15 16 17 18 19 20 21
Figure 3.3. Regional governance in regions surveyed. Scores according to the synthetic regional authority index of Hooghe et al.

15
operation in a region that has been similarly designated by the two supra-regional tiers of
government for regional policy purposes (calculated on the basis of the RDA survey 2007
database).
Finally it is worth noting that the three principal policy contexts of the 181 RDAs in the
survey would appear to be linked, but only to some extent. As could be expected, regions with
relatively poor economic performances are more likely to be completely designated for
regional policy purposes,2 but it is also worth noting that although the average synthetic
authority score of the regions surveyed is lower in the completely designated regions than the
overall average, the partly designated regions are in fact slightly above the overall average.3
Moreover, the variation in each policy designation category with regard to regional authority
is pronounced: the undesignated Paris region is below the overall average, among the partly
designated regions are both the relatively weak English regions and the much more powerful
Austrian länder, while the group of completely designated regions range from weak
Portuguese regions to the strong German länder. There are, in other words, plenty of reasons
to pursue several lines of inquire when looking into the factors that influence regionally-based
economic development initiatives, because it does not seem to be possible to reduce ‘problem
logic’, ‘governance logic’, and ‘policy logic’ to one and the same thing.
2 If the 16 regional profiles in the synthetic WP4 index are given numerical values starting with 1 for ‘metropolitan’ through to 16 for ‘south agricultural’, then the average profile score of the regions surveyed is 8.3 while the average of the fully designated regions is 12.4. 3 The average Hooghe-index governance score of the regions surveyed is 9.8, while the averages for the completely, partly, and un-designated regions are 7.8, 10.9 and 13.3 respectively.
Figure 3.4. Regional policy designations of surveyed regions. Based on 2007 information on DG Regional Policy website.
0
20
40
60
80
100
120
Undesignated Partly Completely
EU designated
Nationally designated

16
4. Regional policies: Key dimensions
4.1. Organisation and strategies
The organisational context of the regional development body concerns the relation between
the RDA and its political and financial sponsors within and/or outside the region. This
describes its freedom of action in terms of being able to decide on the aims and methods in
promoting regional development, and the resources at its disposal to translate strategies into
implemented policies.
In terms of sponsorship it could be expected that RDAs would be primarily be
sponsored by regions, but, as illustrated by Figure 4.1, this is the case for less than half the
organisations surveyed, while central government is the sole sponsor for nearly 20 per cent of
the RDAs for which sponsorship data was available. Interestingly, multiple sponsorship
characterises no less than 40 per cent of the organisations, and as this conclusion is in line
with the results of an earlier small-scale pilot study of the situation in the early 1990s (Halkier
and Danson 1997), multi-level governance would appear to have become a prominent and
permanent feature in the current governance of regional economic development.
0 20 40 60 80
Regional
Central
Local
Multi
Figure 4.1. Sponsors of RDAs. Number of organisations (N = 178). Source: RDA survey 2007 database.
0 20 40 60 80
Departmental
Semi-
departmental
Arm's-
length/single
Arm's-
length/dominant
Arm's-
length/plural
Figure 4.2. Sponsorship relations of RDAs. Number of organisations (N = 165). Source: RDA survey 2007 database.
For the vast majority of organisations for which data was available, the relation between
the RDA and its political sponsors could be characterised as arm’s-length, i.e. that the sponsor
only oversees development in general terms and leaves considerable discretionary powers
with regard to strategic initiatives and implantation to the development body itself. As
illustrated by Figure 4.2, the number of arm’s-length sponsors varies, and this is likely to
affect the RDA’s room for manoeuvre, because one or few sponsors being more likely to

17
wield detailed influence and ‘shorten the sponsorship arm’. Still, a sizeable minority of
organisations are directly incorporated into the administrative structures of mainstream
government, albeit in most cases somewhat sheltered in a semi-departmental position through
the presence of e.g. a separate (advisory) board of directors. With regard to individual policy
initiatives it is, however, also worth noting that nearly half of the policies for which data was
available were sponsored by supra-regional levels of government (calculated on the basis of
the RDA survey 2007 database) so that, although the RDA had been established to promote
development within a particular region, a significant part of its activities involved
implementing policies that to a greater or lesser extent had been designed elsewhere to
address issues of national or European concern.
0
10
20
30
40
50
60
Small Medium ´Large
Staff
Funding
Figure 4.3. Resources of RDAs. Number of organisations. Small organisations have less than 20 staff and a budget of less than 5 €m, large organisations have more than 100 staff and a budget of more than 50 €m (N/staff = 112, N/funding = 48). Source: RDA survey 2007 database.
0 100 200 300 400 500 600 700
Interregional
equality
Equality and
competitiveness
Competitiveness
Corporate values Policy values
Figure 4.4. Strategic values of RDAs. Number of organisations (N/corporate = 165, N/policies = 586). Source: RDA survey 2007 database.
In terms of resources, the organisations surveyed differ in size, as illustrated by Figure
4.3. This will not necessarily influence the ‘policy intensity’ because the size of the regions
also varies considerably, from large German Länder at one extreme to e.g. small rural regions
in the Czech Republic and Slovenia at the other. Nonetheless, the differences in financial and
human resources must still affect the possibilities of individual RDAs in terms of engaging in
large and complex projects, but this does not prevent regional development bodies across
Europe from being almost unison in terms of their objectives, both in terms of their overall
corporate goals and the aims associated with individual policy initiatives, as illustrated by
Figure 4.4. In terms of setting the official aims for regional policy, the competitiveness-
oriented EU Lisbon strategy has clearly established what could be termed discursive
hegemony, and at least in terms of how the aims of regional policy are being talked about, this

18
differs from the situation in the early 1990s where equality-oriented goals like employment
creation/safeguarding accounted for more than a quarter of the, admittedly much smaller,
sample (Halkier and Danson 1997). Also with regard to more detailed strategic policy aims,
the predominance of policies that aim to bring about qualitative change in the regional
economy is evident: seven of the ten most frequent policies appear to involve attempts to
improve things rather than simply bolster existing activities, as do nearly of 75 per cent of all
the policies surveyed, as illustrated by Figure 4.5. Similar figures were recorded in the early
1990s (Halkier and Danson 1997), and thus the dominance of policies oriented towards
qualitative change in the regional economy would by now seem to be firmly entrenched.
4.2. Targets and instruments
In order to characterise the policies in greater detail, the following paragraphs will focus on
the specific aims of public intervention and the instruments used, before turning to the
knowledge implications of regional policy and the broader patterns of regional economic
governance into which they are inscribed.
Considering the policy targets is necessary in order to establish how strategic aims are
translated in concrete objectives for change, i.e. who/what is going to change in which way as
a result of public intervention in order for the policy measure to achieve its aims. Figure 4.6
0 50 100 150 200
Attraction of firms
Modernise sectoral structure
Improve infrastructure
Improve skills
Create/support network/cluster
Increase external project support
Support new/small firms
Modernise firms
Figure 4.5. RDA policy aims. Number of policies (N = 670). Source: RDA survey 2007 database.
19
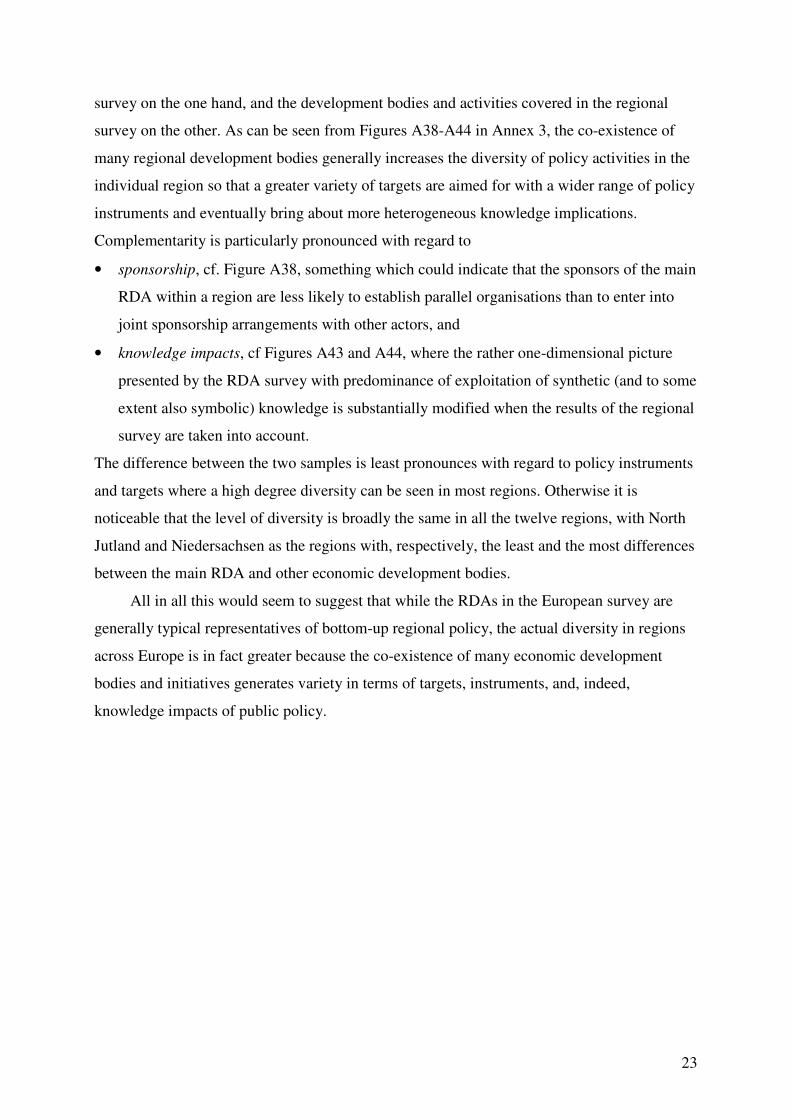
charts the changes in capabilities sought – material, immaterial or organisational – in relation
to different types of institutional targets. Although many policies target more than one
capability/institution and this can lead to an overestimation of the importance of especially
some of the less common targets, it is immediate clear obvious that organisations – most often
private firms – remain by far the most important institutional target of regional policy in
European regions, and also that the capacity most often targeted relates to software, i.e.
boosting the economically useful information available. It is, however also noticeable that
both training of individual persons and various system-level measures (infrastructure, cluster
formation) also play a significant role, and, indeed, that around a quarter of all the measures
targeting firms actually attempt to improve their orgware, e.g. by encouraging them to
participate in networks with other firms or knowledge institutions. Compared to the, albeit
much smaller, survey of RDAs undertaken in the 1990s, the two most important changes are
clearly the increased importance of training of the potential/present workforce and, not least,
the explosive growth in network-oriented measures from the 1990s onwards (Halkier and
Danson 1997). All in all this documents a gradual shift in policy targets in new, and clearly
knowledge-intensive, directions, not just for the policy targets but certainly also for the RDAs
developing and implementing these new types of development initiatives.
0
50
100
150
200
250
300
350
400
450
Persons Organisations System
Hardware Software Orgware
Figure 4.6. RDA policy targets. Number of policies (N = 692). Source: RDA survey 2007 database.
0
100
200
300
400
500
600
Mandatory Conditional Unconditional
Authority Finance Information Organisation
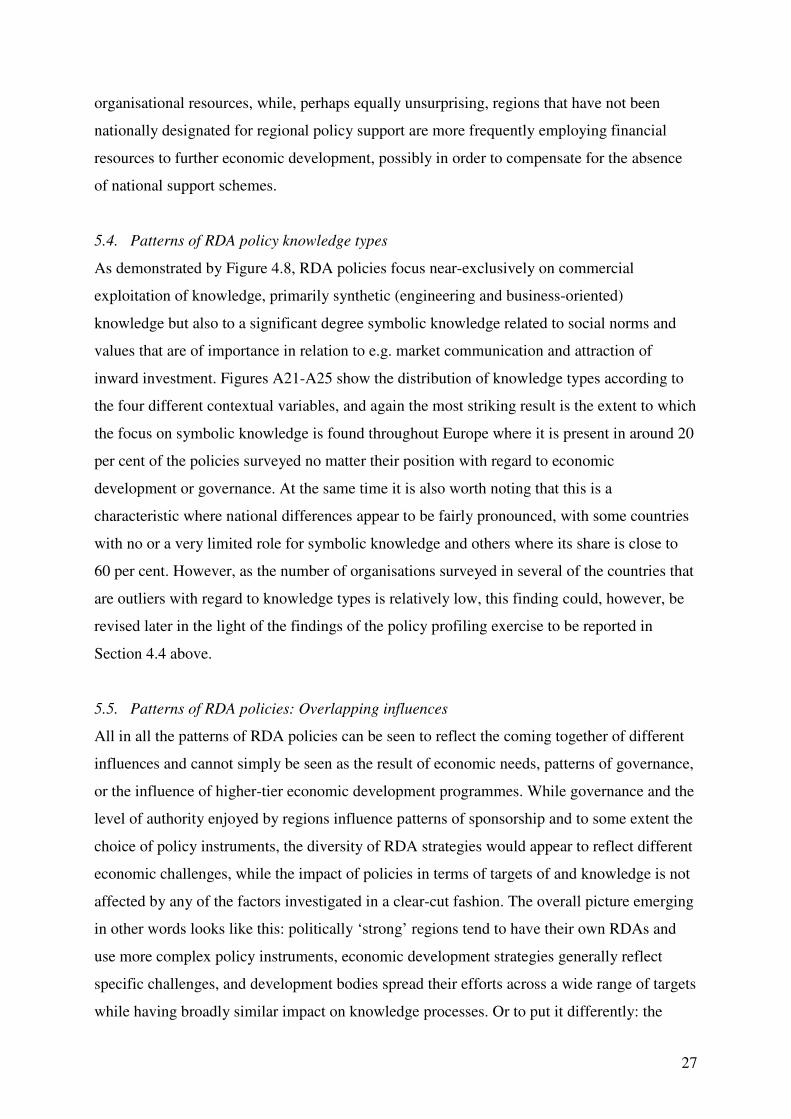
Figure 4.7. RDA policy instruments. Number of policies (N = 692). Source: RDA survey 2007 database.
The policy instruments used to bring about change combine resources and rules: in order
to make actors behave in ways conducive to policy goals, resources are made available on
more or less stringent conditions. As illustrated by Figure 4.7, only 6 of the 12 basic policy
instruments have been used by the RDAs surveyed to promote regional development, and the
patterns of absence are unambiguous: no policy instruments relying on authority as its
primary resource or prescribing mandatory used of other resources were in evidence. What is

20
equally striking, however, is the fact that the direct transfer of financial resources plays a
relatively limited role, although of course the unconditional availability of resources does in
itself automatically entail a significant indirect financial subsidy. The main instruments of
European RDAs are therefore now clearly organisational and informational resources made
available either conditionally and unconditionally, and perhaps unsurprisingly given the
importance of software as the main target of capacity change (cf. Figure 4.6), information is
the most important policy resource. Furthermore, it is common for individual policies to
combine different policy rules by making some resources available unconditionally while
other, presumable more complex or ‘advanced’, resources are only available if firms meet
certain conditions, e.g. sign up to participate in more extensive interactions with the RDA or
undertake to invest some of their own resources in particular ways – in fact more than two-
thirds of the policies surveyed entail both unconditional and conditional access to resources in
other to influence the behaviour of economic actors within their region.
4.3. Knowledge implications of RDA policies
The vast majority of the RDA policies surveyed are in other words ‘knowledge explicit’ in the
sense that they either intend to influence the software or orgware capacities of their targets, or
that they employ informational or organisational resources in order to bring about changes
within the regional economic that are seen as desirable. Compared to previous regional policy
paradigms, especially traditional top-down central government grant schemes, the current
knowledge-intensive policy profile greatly increases the demands on individual RDAs in
terms of knowledge resources, both in-house in terms of the competences of their employees,
and externally through access to regional, national and international networks.
0
100
200
300
400
500
600
700
800
Analytical Synthetic Symbolic
Exploitation
Examination
Exploration
Figure 4.8. RDA policies: Knowledge moments
and types. Number of policies (N = 691). Source:

21
In relation to the firms and other targets of regional development, it is, however, also
interesting to note what kind of knowledge is being influenced by RDA policies: what is the
balance between more or less immediately useful knowledges, and are some forms of
knowledge given particular attention at the expense of others? As illustrated by Figure 4.8, the
focus of the policies surveyed is near exclusively on knowledge exploitation, i.e. using
existing knowledge for economic purposes – in fact only three policies were identified where
knowledge examination in order to establish the economic potential of existing knowledge
was in focus, while, perhaps less surprising, no instances were found where generation of
knowledge through less use-oriented exploration like in e.g. basic research was supported
(calculated on the basis of the RDA survey 2007 database). Similarly, the limited importance
of analytical knowledge is noticeable: only two cases have been identified, but given the
widespread interest in biotech among policy-makers across Europe, this is likely to reflect that
such initiatives have not generally been given sufficient prominence on the RDA websites to
be selected for analysis. Still, the predominance of synthetic knowledge is striking, reflecting
a dominant focus on manufacturing and business skills, but at the same time it is also
noticeable that symbolic knowledge plays an important role in connection with
communication-oriented policies such as attraction of inward investment and advice on
markets and marketing. Compared to the small survey undertaken in the early 1990s, the
relative role of symbolic knowledge would appear to have decreased somewhat, but again this
may simply reflect the fact that especially more low-key advisory services have not been
given prominence on RDA websites. All in all it is obvious that the knowledges necessary for
regional development bodies are marshalling in order to promote economic development
remain heterogeneous, and hence, by implication, that small organisations will need to be well
networked in order to compensate for limited in-house resources.
4.4. RDAs and their regional policy context
The individual RDAs in the survey operate in policy environments where other public bodies
also pursue regional development goals, and therefore the relationship between different
economic development bodies is important in its own right because different patterns of
cooperation and competition between them may be more or less conducive to achieving the
shared goal of regional development. The web-based survey at the centre of this report was
chosen as research design in order to be able to cover regions across Europe, but obviously
this approach is not well-suited to capture in any great detail the relationship between the
RDAs surveyed and the policy environment in which they operate. In order to get a

22
preliminary idea about the relationship, twelve EURODITE partners have surveyed
development bodies and activities in their region, using the same conceptual framework and
similar methods as the main European survey.4 This section presents the findings from this
exercise which, in addition to the main goal of illuminating the balance between
complementary and overlapping policies within individual regions, can also provide an
indication of the extent to which the RDAs chosen for the European survey are similar or
different from the majority of development bodies not included.
Starting with the latter issue, key characteristics of the two samples of economic
development bodies have been compared, as illustrated by Figures A31-A37 in Annex 3 at the
back of the report. With one notable exceptions, the overall distribution of the development
bodies surveyed in the twelve regions is similar to that of the main European survey of RDAs
in the sense that the same policy instruments, policy targets and knowledge impacts have been
found to be both the most and the least prominent ones. The main difference between the two
samples concerns sponsorship; here the dominance of multiple sponsor arrangements in the
regional survey is in reality a reversal of the dominance of single-sponsor agencies in the
European survey, something which further underlines the importance of multi-level
governance patterns in regional economic development in Europe. All in all the comparison
clearly suggests that in terms of the public incentives aimed at changing patterns of behaviour
among private firms, the two samples are not substantially different, and thus the European
RDA survey can be seen as giving a reasonably indications of key characteristics of bottom-
up regional policy across Europe – although an extended, but also very resource-demanding,
survey combining geographical scope with depth of coverage would of course have been
preferable.
While the average development body in the regional survey is quite similar to the
average RDA identified in the European survey, the division of labour within each region
may still take different forms: at one extreme all the organisations have similar profiles and
support the same kind of activities in similar ways, mutually supporting or competing against
each other, and at the other extreme all the organisations have different profiles that
complement each other and constitute a well-defined division of labour. For each of the
twelve regions a comparison has been undertaken between the RDA included in the European
4 In each of the 12 regions the following regional development activities were surveyed: the most important European and national programmes, as well as the four most important policies of the four most important regional or local development bodies. Unlike the main European survey that was conducted by just one researcher, relying on 12 different teams of researchers clearly creates challenges with regard to maintaining the consistency of interpretation, despite the availability of extensive written guidance.
23
survey on the one hand, and the development bodies and activities covered in the regional
survey on the other. As can be seen from Figures A38-A44 in Annex 3, the co-existence of
many regional development bodies generally increases the diversity of policy activities in the
individual region so that a greater variety of targets are aimed for with a wider range of policy
instruments and eventually bring about more heterogeneous knowledge implications.
Complementarity is particularly pronounced with regard to
• sponsorship, cf. Figure A38, something which could indicate that the sponsors of the main
RDA within a region are less likely to establish parallel organisations than to enter into
joint sponsorship arrangements with other actors, and
• knowledge impacts, cf Figures A43 and A44, where the rather one-dimensional picture
presented by the RDA survey with predominance of exploitation of synthetic (and to some
extent also symbolic) knowledge is substantially modified when the results of the regional
survey are taken into account.
The difference between the two samples is least pronounces with regard to policy instruments
and targets where a high degree diversity can be seen in most regions. Otherwise it is
noticeable that the level of diversity is broadly the same in all the twelve regions, with North
Jutland and Niedersachsen as the regions with, respectively, the least and the most differences
between the main RDA and other economic development bodies.
All in all this would seem to suggest that while the RDAs in the European survey are
generally typical representatives of bottom-up regional policy, the actual diversity in regions
across Europe is in fact greater because the co-existence of many economic development
bodies and initiatives generates variety in terms of targets, instruments, and, indeed,
knowledge impacts of public policy.

24
5. Patterns of regional policy
In this section the patterns of policy variation will be discussed in relation to the three main
contexts in order to get a first indication of the relative importance of the factors shaping
regionally-based development initiatives, i.e. the balance between ‘problem logic’ (similar
economic challenges result in similar policies), ‘governance logic’ (similar forms of
governance result in similar policies), and ‘policy logic’ (involvement in national/European
programmes result in similar policies). As argued earlier, the data concerning the three
contexts do not make it possible to reduce ‘problem logic’, ‘governance logic’, and ‘policy
logic’ to one and the same thing, and thus in the following five aspects of regional policy will
be analysed with regard to their inter-regional variation on the basis of economic, governance
and policy criteria. It should be stressed that the analysis in the following will be extended
during autumn 2009 through exploration of additional patterns of co-variation, but for the
time being focus is on the relationship between five key policy dimensions and the three
contexts in which they operate. Finally, a fourth context is introduced which charts policies
according to which member state the region is part of; this could be seen as a supplement to
the general governance context which can give a first indication of the extent to which
detailed national regulation – e.g. preference for particular policy instruments – has guided
regional policy initiatives in particular directions.
In practice this has resulted in sets of breakdowns by regional contextual variables of the
following policy dimensions:
• sponsors of RDAs
• policy aims
• policy targets
• policy instruments, and
• knowledge implications.
This results in 25 figures which for ease of reference and handling have been place in Annex
2 at the back of the text.
5.1. Patterns of RDA sponsorship
As demonstrated by Figure 4.1, RDAs in Europe are sponsored also by other tiers of
government that the regional one; in fact development bodies sponsored exclusively by
regional government account for only 40 per cent of the organisations surveyed (calculated on

25
the basis of the RDA survey 2007 database). Figures A1-A5 in Appendix 2 breaks show the
distribution of sponsors distributed according to the four contextual different variables, and
two observations are immediately obvious. First and foremost, governance clearly makes a
difference: the more extensive authority a region has, the more likely it is to sponsor its own
RDA (Figure A3), and, related to this because sub-national governance is symmetrical in the
vast majority of European countries, sponsorship arrangements tend to be uniform in each
member state, with only one country with three different sponsors and 17 countries where
more than 75 per cent of the organisations surveyed were sponsored by the same tiers of
government. Conversely, being more or less designated for regional policy purposes does not
appear to make much of a difference, while the impact of economic factors is difficult to
gauge, and even the obvious importance of multi-level sponsorship in CEE countries may
simply reflect the fact that these previously centralised countries became EU members at the
same point in time and were pointed in this direction by a raft of EU programmes designed to
strengthen democratic governance and build capacity to absorb Structural Funds support in a
meaningful and efficient manner.
All in all governance is clearly important in determining who sponsors RDAs, and as
this in itself is an issue of governance - who designs and implements regional policy - this is
perhaps not a surprising finding, but nonetheless it is useful to have documented that the most
powerful regions also have regional economic development as one of their central areas of
responsibility.
5.2. Patterns of RDA strategies
As demonstrated by Figure 4.5, RDA strategies are diverse in terms of their aims, but the vast
majority of policies aim to bring about qualitative change in the regional economy rather than
simply bolstering existing activities. Figures A6-A10 in Appendix 2 show the distribution of
strategies according to the four contextual different variables, focusing on four common
strategic priorities which are related to the four basic policy aims outlined in Table 2.1 above,
with attraction of inward investment representing expansion, support for small/new firms
representing duplication, modernisation of firms representing, well, modernisation, and
support for network/clusters representing creativity. Although the strategic variation is
striking no matter the economic position of the region, it would appear that the
network/cluster approach is more common in well-off and dynamic regions than in localities
scoring lower in the economic indices, and that efforts to modernise individual firms are most
pronounces in old industrial regions. Moreover, the highest degree of variation is found in the

26
new member states where the four ‘classic’ approached to regional policy account for
(sometimes much) less than half of the policy measures of the organisations surveyed (Figure
A7); this contrasts sharply with the situation in the old member states where the same policies
account for around 80 per cent of the policies in nearly all the WP4 regional profiles (Figure
A6), and probably reflects the emphasis on training and infrastructure among the relative
small number of regions in the poorest parts of Europe. A similar tendency can be seen in
relation to regional policy designation where ‘other measures’ also are more frequent than in
the partly or un-designated regions (Figure A9), and in terms of governance in the regions
with the lowest score on the synthetic regional authority index (Figure A10). If there is indeed
an economic ‘problem logic’ influencing regional policy strategies, this would appear to be
sufficiently complex to be difficult to capture using the relatively simplistic methods
employed here - and in practice its influence would appear to have been mediated by
alternative governance and policy logics. If regional policies are supposed to address the
specific needs of individual regions - needs that are not just economic but also interpreted
socially and politically - these findings could suggest that this may well be what is happening
in Europe today.
5.3. Patterns of RDA policy targets and instruments
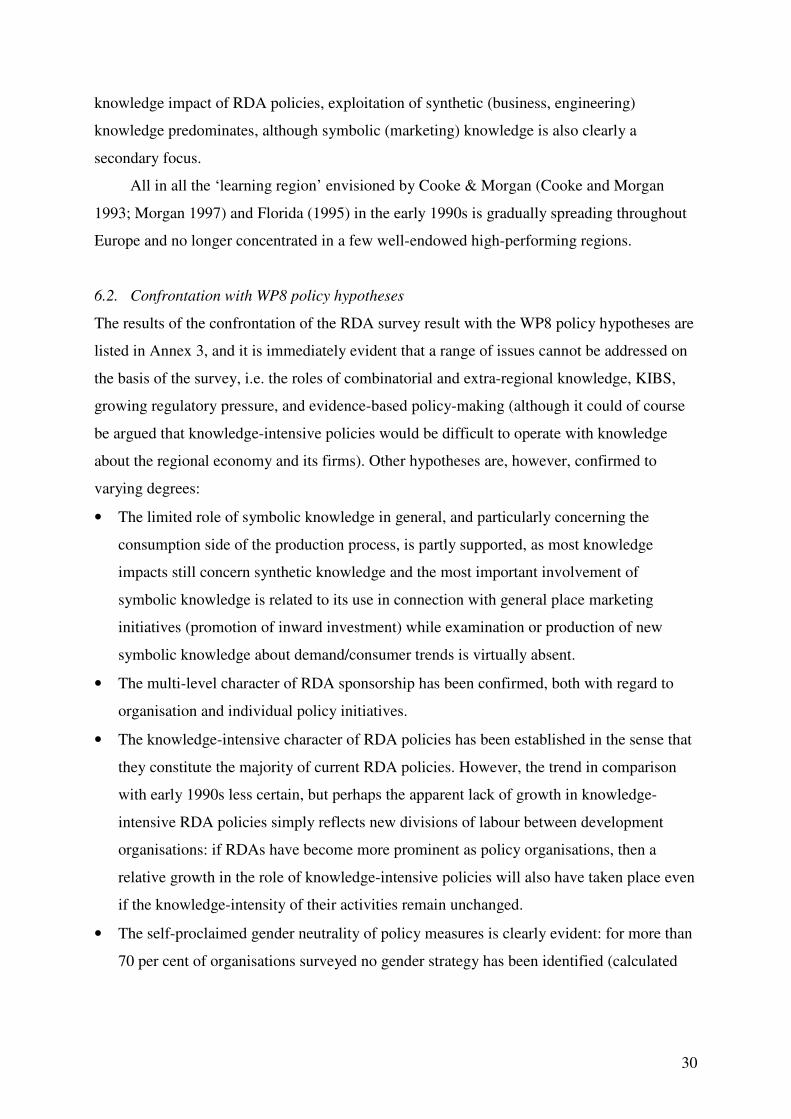
As demonstrated by Figure 4.6, RDA policy targets are diverse both in terms of the
capabilities and the institutions they aim to change, although organisations and software are
the most important targets. Appendix 2 shows the distribution of targets according to the four
different contextual variables in Figures A11-A15 (institutional) and Figures A16-A20
(capacity). Although there seems to be a tendency for regions scoring low in the synthetic
regional authority index to spend more on person-related measures like training (Figure A13),
what is most striking with regard to targets is the extent to which similar institutions and
capacities are the object of regional policy across European regions, and here it is particularly
interesting to note that changing the orgware through support for e.g. networks and clusters
has become commonplace throughout Europe and is no longer the preserve of wealthy and
dynamic regions.
A similar picture presents itself with regard to policy instruments, where Figures A21-
A25 in Appendix 2 would appear to present a similar picture with finance, information and
organisation used as policy resources in regions across Europe with only few examples of
possible influence from the four contextual variables: regions scoring high in the synthetic
regional authority index tend to rely more on provision of (complex and demanding)
27
organisational resources, while, perhaps equally unsurprising, regions that have not been
nationally designated for regional policy support are more frequently employing financial
resources to further economic development, possibly in order to compensate for the absence
of national support schemes.
5.4. Patterns of RDA policy knowledge types
As demonstrated by Figure 4.8, RDA policies focus near-exclusively on commercial
exploitation of knowledge, primarily synthetic (engineering and business-oriented)
knowledge but also to a significant degree symbolic knowledge related to social norms and
values that are of importance in relation to e.g. market communication and attraction of
inward investment. Figures A21-A25 show the distribution of knowledge types according to
the four different contextual variables, and again the most striking result is the extent to which
the focus on symbolic knowledge is found throughout Europe where it is present in around 20
per cent of the policies surveyed no matter their position with regard to economic
development or governance. At the same time it is also worth noting that this is a
characteristic where national differences appear to be fairly pronounced, with some countries
with no or a very limited role for symbolic knowledge and others where its share is close to
60 per cent. However, as the number of organisations surveyed in several of the countries that
are outliers with regard to knowledge types is relatively low, this finding could, however, be
revised later in the light of the findings of the policy profiling exercise to be reported in
Section 4.4 above.
5.5. Patterns of RDA policies: Overlapping influences
All in all the patterns of RDA policies can be seen to reflect the coming together of different
influences and cannot simply be seen as the result of economic needs, patterns of governance,
or the influence of higher-tier economic development programmes. While governance and the
level of authority enjoyed by regions influence patterns of sponsorship and to some extent the
choice of policy instruments, the diversity of RDA strategies would appear to reflect different
economic challenges, while the impact of policies in terms of targets of and knowledge is not
affected by any of the factors investigated in a clear-cut fashion. The overall picture emerging
in other words looks like this: politically ‘strong’ regions tend to have their own RDAs and
use more complex policy instruments, economic development strategies generally reflect
specific challenges, and development bodies spread their efforts across a wide range of targets
while having broadly similar impact on knowledge processes. Or to put it differently: the

28
RDA model emerging in the 1990s as documented by e.g. Halkier & Danson (1997) would
now seem to have become widespread across Europe, and hence, at least on the basis of the
data produced by the 2007 RDA survey, European regional development bodies would to a
large extent seem to comply with the notion of a ‘model RDA’, providing integrated and
tailor-made policy delivery that address specific challenges of individual regions within the
broader framework of national and European governance of economic development
initiatives.

29
6. Conclusion and confrontation with WP8 hypotheses
Surveying RDAs across the EU in a diversity of regional contexts in terms of governance,
policies and (knowledge) economic development has produced a clear picture of the current
profile and long-term trends in bottom-up regional policy in Europe. A picture that may be
deepened through even more extensive surveys and in-depth case studies, but which
nonetheless makes it possible to draw conclusions with regard to the current nature of
regional development initiatives, to relate findings to the WP8 policy hypotheses, and to
identify some current policy challenges.
6.1. RDA profiling
An important finding of the survey is the fact that multi-level governance of bottom-up
regional policy now has become widespread so that most individual development bodies
and/or their activities are sponsored by several tiers of government rather than simply by e.g.
the region itself. This, in turn, has further strengthened the arm’s-length principle so that
RDAs, at least from an institutional perspective, operate as semi-autonomous entities outside
mainstream government. Taken together this implies that a new generation of regionally
based development bodies, networked RDAs, has become a conspicuous feature in regional
policy in Europe.
In terms of strategies, the objectives of regional development is now firmly based in
Lisbon-style competitiveness-oriented discourse, and this fits well with the fact that current
policies focusing on supporting qualitative change in the regional economy now tends to
predominate. While private firms remain the most common target, targeting individuals
through e.g. training measures has grown in importance, along with the now dominant focus
on bringing about change in software and orgware. In short, also regional policy measures
themselves have acquired a conspicuous network dimension, with a focus on stimulating
inter-firm relations and relations between firms and public knowledge institutions in e.g.
clusters.
In the light of this it is hardly surprising that the policy instruments employed by
European RDAs are dominated by the use of informational and organisational resources, and
thus the vast majority of policies are of a knowledge-explicit and knowledge-intensive
character, i.e. either their targets of change or the policy instruments involved required
detailed knowledge of particular firms and areas of economic activity. In terms of the
30
knowledge impact of RDA policies, exploitation of synthetic (business, engineering)
knowledge predominates, although symbolic (marketing) knowledge is also clearly a
secondary focus.
All in all the ‘learning region’ envisioned by Cooke & Morgan (Cooke and Morgan
1993; Morgan 1997) and Florida (1995) in the early 1990s is gradually spreading throughout
Europe and no longer concentrated in a few well-endowed high-performing regions.
6.2. Confrontation with WP8 policy hypotheses
The results of the confrontation of the RDA survey result with the WP8 policy hypotheses are
listed in Annex 3, and it is immediately evident that a range of issues cannot be addressed on
the basis of the survey, i.e. the roles of combinatorial and extra-regional knowledge, KIBS,
growing regulatory pressure, and evidence-based policy-making (although it could of course
be argued that knowledge-intensive policies would be difficult to operate with knowledge
about the regional economy and its firms). Other hypotheses are, however, confirmed to
varying degrees:
• The limited role of symbolic knowledge in general, and particularly concerning the
consumption side of the production process, is partly supported, as most knowledge
impacts still concern synthetic knowledge and the most important involvement of
symbolic knowledge is related to its use in connection with general place marketing
initiatives (promotion of inward investment) while examination or production of new
symbolic knowledge about demand/consumer trends is virtually absent.
• The multi-level character of RDA sponsorship has been confirmed, both with regard to
organisation and individual policy initiatives.
• The knowledge-intensive character of RDA policies has been established in the sense that
they constitute the majority of current RDA policies. However, the trend in comparison
with early 1990s less certain, but perhaps the apparent lack of growth in knowledge-
intensive RDA policies simply reflects new divisions of labour between development
organisations: if RDAs have become more prominent as policy organisations, then a
relative growth in the role of knowledge-intensive policies will also have taken place even
if the knowledge-intensity of their activities remain unchanged.
• The self-proclaimed gender neutrality of policy measures is clearly evident: for more than
70 per cent of organisations surveyed no gender strategy has been identified (calculated

31
on the basis of the RDA survey 2007 database), while mainstreaming (Sweden) or
separate initiatives (UK, Ireland) prevail in only two member states.
6.3. Policy scoping
The survey documents the spreading of a new-model bottom-up regional development policy
which appears to be well in tune with the Lisbon visions for a competitive European
knowledge economy, and this will undoubtedly appeal to policymakers in Brussels and
elsewhere as a sign that regional development is becoming part of a future-oriented political
project rather than simply being a political price that had to be paid to maintain member state
unity in the face of divisive measures such as the completion of the single European market
(Hooghe and Keating 1994). This change in regional policy has, however, also occasionally
received more sceptically, because of what is no longer in focus such as e.g. transfer of
economic resources (e.g. Hudson 1997), and because of unease about the transferability of
practices to less well-off regions and the risk of importing practices without sufficient
adaptation to local circumstances (Markusen 1999; Lagendijk 2000; MacLeod 2000; Hassink
2001; Hassink 2005; Rutten and Boekema 2007). These issues are, however, difficult to
address through surveys like the current one but require in-depth case studies and evaluation-
type research to illuminate, and therefore the contribution to the policy scoping exercise of the
current report will be a more limited one, namely to identify some key implications of the
current policy profile of European RDAs.
In terms of governance the key finding of the survey was that currently RDAs are
operating in a network environment, mostly with a plurality of sponsors for the organisation
as such and/or its policy activities. On the one hand this poses the strategic challenges of
maintaining the overall direction of activities with different sponsors promoting different
development agendas and activities, and with ensuring the integrated policy delivery that has
traditionally been one of the arguments for using multi-functional bodies to stimulate regional
economic development. On the other hand it poses the organisational challenge of having
staff capable of operating effectively in such an environment where it is no longer enough to
‘know your stuff’ and be able to deal with individual clients but you also need to ‘get along’
with parallel/competing organisations in order to make things moving in the direction desired.
With regard to regional development strategies, two findings were particularly
conspicuous: the limited role of direct financial subsidies as policy instruments, and the
predominance of knowledge-explicit policies. The former may reflect a distribution of labour
between development organisations - in some countries financial subsidies are always

32
handled by governmental organisations rather than semi-autonomous bodies like RDAs - and
so the challenge is one of coordination between organisations, if, of course, grant aid is
available from other sources. The challenge of the latter is, however, crucial because the
pivotal role of knowledge with regard to both policy targets and instruments increase the
demands on RDAs to have access to relevant knowledge resources, either in-house or through
their network to public and private providers.
Finally, in terms of knowledge types, the dominance of synthetic knowledge may
suggest room for increasing the focus on symbolic knowledge - and indeed its interplay with
synthetic knowledges - in order to make sure that producer-oriented policies are also taking
current and emerging trends in market demand into account. If this is not the case, then
policies will continue to rely on the perceptions of firms in this regards, thereby running the
risk of strengthening existing path dependencies rather than assisting firms in transgressing
their current limits of strategic vision.
Taken together current and future challenges for RDAs can be captured in the catch-
phrase ‘better and more knowledge-intensive networking’ in order to be able to act as agents
of change in the regional knowledge economy. A role that underlines the character of modern
RDAs as ‘network nodes’ rather than ‘monopolistic implementers’ of regional development
initiatives, where successful performance will require not only good working relationships
with private-sector clients but also fruitful interaction with private knowledge providers such
as KIBS and public knowledge institutions such as universities.

33
7. Appendix 1: RDAs included in the survey
Country Region Organisation Website
Austria Burgenland Wirtschaftsservice Burgenland Aktiengesellschaft – WiBAG
www.wibag.at
Austria Carinthia Entwicklungsagentur KärntenGmbH EAK www.entwicklungsagentur.at/eak_neu
Austria Lower Austria Ecoplus wirtschaftsagentur Niederösrerreich www.ecoplus.at
Austria Oberösterreich Technologie und marketinggesellschaft TMG www.tmg.at
Austria Salzburg Salzburg Agentur www.salzburgagentur.at
Austria Styria Steirische Wirtschaftsförderung www.sfg.at
Austria Tirol Tiroler Zukunftsstiftung www.zukunftstiftung.at
Austria Vienna Vienna Business Agency www.wwff.gv.at
Austria Vorarlberg Wirtschafts-Standort Vorarlberg GmbH (WISTO) www.wisto.at
Belgium Antwerpen Provinciale ontwikkelingsmaatschappij voor de provincie Antwerpen POM Antwerpen
www.provant.be
Belgium Brabant Wallon Intercommunale du Brabant Wallon l'IBW www.ibw.be
Belgium Bruxelles Agence Bruxelloise pour l'Entreprise www.abe-bao.be
Belgium Liège Agence de developpement pour la province de Liège SPI+
www.spi.be
Belgium Namur Bureau economique de la province de Namur BEP entreprises
www.bep.be
Belgium Oost Vlanderen Provinciale ontwikkelingsmaatschappij Oost Vlaanderen POM
www.pomov.be
Belgium West Vlaandern Provinciale ontwikkelingsmaatschappij West Vlaanderen POM West Vlaanderen
www.pomwvl.be
Czech Rep. Hradec-Králové Kralovehradecka agentura regionalniho rozvoje - centrum evropského projektování
www.cep-rra.cz
Czech Rep. Liberec Agentura regionalniho rozvoje, ARR Nisa www.arr-nisa.cz
Czech Rep. Moravia-silesia Agentura pro regionalni rozvoj a.s, Moravskoslezsky kraj
www.rdaova.cz
Czech Rep. South Bohemia Regionalni rozvojova agentura jiznich Cech RERA a.s.
www.rera.cz
Czech Rep. South Moravia Regionalni Rozvojova Agentura Jizni Moravy www.rrajm.cz
Czech Rep. Usti Regionalni rozvojova agentura Usteckeho kraje www.rra.cz
Denmark Bornholm Bornholms Vækstforum www.brk.dk
Denmark Hovedstaden Vækstforum Region Hovedstaden www.regionhovedstaden.dk
Denmark Midtjylland Vækstforum Region Midtjylland www.regionmidtjylland.dk
Denmark Nordjylland Vækstforum Region Nordjylland www.rn.dk
Denmark Sjælland Vækstforum Region Sjælland www.vfsj.dk
Denmark Syddanmark Vækstforum Region Syddanmark www.regionsyddanmark.dk
Estonia Ida-Viru County Ida-Viru Ettevotluskeskus IVEK www.ivek.ee
Estonia Pärnu County Pärnumaa Ettevotlus ja Arenduskekus PEAK www.peak.ee
Estonia Saaremaa County Saaremaa Ettevotluse Edendamise sihtasutus SEES www.sees.ee
Estonia Tartu County Tartu Ärinouandla www.tartu.ee/arinouandla
Finland Itä-Uusimaa Itä-Uudenmaan Liitto www.liitto.ita-uusimaa.fi
Finland Kymenlaakso Kymenlaakson Liitto www.kymenlaakso.fi
Finland Uusimaa Uudenmaan liitto www.uudenmaanliitto.fi

34
France Alsace L'agence de Développement de L'Alsace (ADA) www.ada-alsace.com
France Aquitaine 2ADI L'agence Aquitaine de développement industriel
www.2adi.fr
France Auvergne-Limousin Association pour le Développement Industriel et Economique du Massif Central ADIMAC
www.adimac.com
France Bourgogne Bourgogne développement www.bourgognedeveloppement.com
France Centre Centreco l'agence de développement économique de la région Centre
www.centreco.regioncentre.fr
France Champagne-Ardenne Champagne-Ardenne developpement CADEV www.cadev.fr
France Franche-Comté L'Agence Régionale de Développement de Franche- Comté
www.ardfc.org
France Haute Normandie + Basse Normandie
Normandie développement www.normandydev.com
France Languedoc-Roussillon Invest Languedoc Roussillon www.invest-lr.com
France Lorraine Agence pour le Developpement des Investissements Exterieurs en Lorraine Adielor
www.adielor.com
France Midi-pyrenées Midi-pyrénées Expansion L'agence de Développement de lan Region Midi-pyrénées
www.midipyrenees-expansion.fr
France Nord -Pas-de-Calais NFX Nord France eXperts www.nfx.fr
France Paris Paris Ile-de-France Agence Régionale de Développement (ARD)
www.paris-region.com
France Pays de la Loire + Poitou-Charentes
Ouest atlantique www.western-france.org
France Picardie Conseil Regional de la Picardie www.cr-picardie.fr
France Provence-Alpes-Côte d'Azur
Mission de développement économique régional Provence-Alpes-Côte d'Azur MDER PACA
www.mder-paca.com
France Rhône-Aples Association Rhône-Aples des professionnels du développement economique local ARADEL
www.aradel.asso.fr
Germany Baden-Württemberg Baden-Württemberg International www.bw-i.de
Germany Bayern Bayerische staatsministerium für wirtschaft, infrastruktur, verkehr und technologie
www.stmwivt.bayern.de
Germany Berlin Berlin Partner GmbH www.berlin-partner.de
Germany Brandenburg ZukunftAgentur Brandenbrg GmbH ZAB www.zab-brandenburg.de
Germany Bremen BIG Bremen - die wirtschaftsförderer www.big-bremen.de
Germany Hamburg HWF Hamburgischen Gesellschaft für Wirtschaftsförderung mbH
www.hwf-hamburg.de
Germany Hessen Hessen Agentur www.feh-hessen.de
Germany Mecklenburg-Vorpommeren
Gesellschaft für wirtschaftsförderung Mecklenburg-Vorpommeren
www.gfw-mv.de
Germany Niedersachsen IPA Niedersachsen Investment Promotiopn Agency www.ipa-niedersachsen.de
Germany Nordrhein-Westphalen Gesellschaft für Wirtschaftsförderung Nordrhein-Westphalen
www.gfw-nrw.de
Germany Rheinland-Pfalz Investitions- und Strukturbank Rheinland-Pfalz (ISB) GmbH
www.isb.rlp.de
Germany Sachsen Wirtschaftförderung Sachsen www.wfs.sachsen.de
Germany Sachsen-Anhalt IMG Investitions- und marketing gesellschaft Sachsen-Anhalt mbH
www.img-sachsen-anhalt.de
Germany Schleswig-Holstein Wirtschaftsförderung und technologietransfer Schleswig-Holstein WTSH
www.wtsh.de
Germany Saarland Gesellschaft für Wirtschaftsförderung Saar mbH www.gwsaar.com
Germany Thüringen Landesentwicklungsgesellschaft (LEG) Thüringen mbH
www.leg-thueringen.de
Greece Heraklion Development agency of Heraklion SA www.anher.gr
Greece Ilia Development agency of Olympia SA www.anol.gr
Greece Karditsa Development Agency of Karditsa SA ANKA www.anka.gr
Greece Kozani West Macedonia Development Company ANKO www.anko.gr
Greece Pella Development agency of Pella SA www.anpe.gr
Greece Pieriki Pieriki Anaptyxiaki SA Local development company
www.pieriki-anaptixiaki.gr
Greece Rodopi Rodopi Development SA ANRO SA www.anro.gr
Greece Serres Development Agency of Serres SA www.aneser.gr

35
Hungary Central Hungary Pro régión Agency www.proregio.hu
Hungary Central Transdanubia Közep Dunantuli Régió www.kdrfu.hu
Hungary North great plain Eszak-Alföldi Regionalis Fejlesztesi Ügynökseg www.eszakalfold.hu
Hungary North Hungary Eszak-Magyarorszagi regionalis fejlesztesi tanacs www.norda.hu
Hungary West Pannon Nyugat-dunantuli Regionális Fejlesztési Tanács és Ügynöksége
www.westpa.hu
Ireland Donegal Donegal county enterprise board www.donegalenterprise.ie
Ireland Dublin Dublin city enterprise board www.dceb.ie
Ireland Galway Galway County and City Enterprise Board www.galwayenterprise.ie
Ireland Kilkenny Kilkenny County enterprise board www.kceb.ie
Ireland Mayo Mayo county enterprise board www.mayoceb.com
Ireland Shannon Shannon Development www.shannondev.ie
Ireland Sligo Sligo county enterpriseboard www.sligoenterprise.ie
Ireland Waterford Waterford county Enterpriseboard www.enterpriseboard.ie
Ireland Wexford Wexford County enterprise board www.wexfordceb.ie
Ireland Wicklow Wicklow County enterprise board www.wicklowceb.ie
Italy Abruzzi Finanziaria regionale abruzzese FIRA www.fira.it
Italy Calabria Società Finanziaria Regional per lo sviluppo economico della Calabria FINCALABRA
www.fincalabra.it
Italy Emilia-Romagna Emilia-Romagna Valorizzazione Economica del Territorio ERVET
www.ervet.it
Italy Lazio Sviluppo Lazio www.sviluppo.lazio.it
Italy Liguria Filse Finanzieria Ligure per lo sviluppo economico www.filse.it
Italy Lombardia Finlombarda Finanziaria per lo sviluppo della Lombardia
www.finlombarda.it
Italy Marche Sviluppo Marche SpA SVIM www.svimspa.it
Italy Piemonte Finpiemonte SPA www.finpiemonte.it
Italy Puglia Instituto Finanziario Regionale Pugliese FINPUGLIA
www.finpuglia.it www.pmion.net
Italy Trentino Agenzia per lo sviluppo del trentino Spa www.agenziasviluppo.tn.it
Italy Umbria Sviluppumbria SPA società regionale per la promozione dello sviluppo economico dell'Umbria
www.sviluppumbria.it
Italy Valle d'Aosta Centro Sviluppo L'agenzia di sviluppo regionale della Valle d'Aosta
www.centrosviluppo.it
Latvia Latgale Latgales regiona attistibas agentura www.latgale.lv/en/lraa
Latvia Riga Rigas regiona attistibas agenturas www.rigaregion.lv
Latvia Vidzeme Vidzemes Attistibas Agentura www.vidzemes-regions.lv
Latvia Zemgale Zemgales attistibas agentura www.zemgale.lv
Lithuania Kaunas Kauno Regiono Plètros Agentura www.krda.lt
Lithuania Klaipeda Klaipedos ekonomines plètros agentura www.kepa.lt
Netherlands Drenthe + Fryslan + Groningen
Investerings- en ontwikkelingsmaatschappij vor Nord Nederland NV NOM
www.nvnom.eu
Netherlands Limburg NV Industriebank LIOF www.liof.nl
Netherlands North Brabant NV Brabrantse ontwikkelings maatschappij www.bom.nl
Netherlands Overrijsel + Gelderland Ontwikkelingsmaatschappij oost Nederland NV www.oostnv.nl
Poland Lubelskie Lubelska Fundacja rozwoju www.lfr.lublin.pl
Poland Malopolskie Małopolska Agencja Rozwoju Regionalnego S.A. www.marr.pl
Poland Podkarpackie Rzeszowskiej Agencji rozwoju regionalnego SA www.rarr.rzeszow.pl
Poland Podlaskie Podlaska fundacja rozwoju regionalnego www.pfrr.bialystok.pl
Poland Pomorskie Agencja Rozwoju Pomorza SA www.arp.gda.pl
Poland Warminsko-Mazurska Warminsko-Mazurska Agencja rozwoju regionalnego SA
www.wmarr.olsztyn.pl
Poland Wielkopolskie Agencja rozwoju regionalnego SA w Koninie www.arrkonin.org.pl
Portugal Alto Tamega Associacao de desenvolvimento da regiao do Alto www.adrat.pt

36
Tamega ADRAT
Portugal Douro e Vouga Agencia de desenvolvimento regional de Entre Douro e Vouga ADReDV
www.adredv.pt
Portugal Grande Porto Primus Promocao e desenvolvimento Regional SA www.primus-dr.pt
Portugal Setubal Cooperacao e desenvolvimento Regional SA CDR www.cdr.pt
Portugal Vale do Ave Agencia de desenvolvimento regional do Vale do Ave ADRAVE
www.adrave.pt
Portugal Vale do Cavado Plataforma Minho - Agencia de desenvolvimento regional
www.plataformaminho.pt
Slovakia Kosice Spisska regionalna rozvojova agentura SRRA www.srra.sk
Slovakia Nitra Regionalna rozvojova agentura Nitra www.rra-nitra.sk
Slovenia Obalno-Krasna Regionalni razvojni center Koper www.rrc-kp.si
Slovenia Osrednjeslovenka Regionalna razvojna agencija Ljublanske urbane regije
wwww.rralur.si
Slovenia Podravje Mariborska Razvojna Agencija www.mra.si
Slovenia Pomurje Regionalna razvojna agjencija Mura doo www.rra-mura.si
Slovenia Spodnje posavska Center za razvoj podezelja posavje www.rra-posavje.si
Slovenia Zasavska Regionalni center za razvoj www.rcr.zasavje.si
Spain Andalusia Agencia de innovacion y desarrollo de Andalucia IDEA
www.agenciaidea.es
Spain Aragon Instituto Aragonés de Fomento www.iaf.es
Spain Asturias Instituto de desarrollo economico del principado de Asturias
www.idepa.es
Spain Cantabria Sociedad para el desarrollo regional de cantabria SODERCAN
www.sodercan.es
Spain Castile - La Mancha Instituto de promocion exterior de Castilla- La Mancha IPEX
www.ipex.jccm.es
Spain Castile-Leon La Agencia de Inversiones y servicios de Castila Y León (ADE)
www.jcyl.es/ade
Spain Catalonia El centro de innovation y desarrollo empresarial CIDEM
www.cidem.com
Spain Extremadura Fundación para el Desarrollo de la Ciencia y la Tecnología en Extremadura FUNDECYT
www.fundecyt.es
Spain Galicia Instituto galego de promocion economica www.igape.es
Spain Madrid Instituto madrileño de desarrollo y su grupo empresarial
www.imade.es
Spain Murcia Instituto de fomento region de Murcia INFO www.ifrm-murcia.es
Spain Navarre Sociedad de desarrollo de Navarre SODENA www.sodena.com
Spain Pais vasco/Basque County
Sociedad para la promocion y reconversion industrial
www.spri.es
Spain Rioja Agencia de Desarrollo economica de la Rioja ADER
www.ader.es
Spain Valencia Instituto de la Mediana Pequeña industria Valenciana IMPIVA
www.impiva.es
Sweden Blekinge Region Blekinge www.regionblekinge.se
Sweden Dalarna Region Dalarna www.regiondalarna.se
Sweden Gävleborg Tilväxt Gävleborg Länsstyrelsen www.tillvaxtgavleborg.se
Sweden Halland Region Halland www.regionhalland.se
Sweden Jämtland Länsstyrelsen Jämtlands län - afdelning för Regional utveckling
www.z.lst.se
Sweden Jönköping Regionförbundet Jönköping län www.regionjonkoping.se
Sweden Kalmar Kalmar Regionforbund www.kalmar.regionforbund.se
Sweden Kronoberg Länsstyrelsen i Kronobergs län, Regional Utveckling
www.g.lst.se
Sweden Norrbotten Länsstyrelsen i Norrbottens län, Afdelning näringsliv
www.bd.lst.se www.utvecklinginorrbotten.se
Sweden Skåne Region Skåne www.skane.se
Sweden Stockholm Länsstyrelsen i Stockholm Län, Regional Utveckling
www.ab.lst.se
Sweden Sörmland Regionförbundet Sörmland www.region.sormland.se
Sweden Uppsala Regionförbundet Uppsala län www.regionuppsala.se

37
Sweden Värmland Region Värmland www.regionvarmland.se
Sweden Västerbotten Länsstyrelsen Västerbotten - Näringslivs avdelling www.ac.lst.se
Sweden Västernorrland Länsstyrelsen Västernorrlands län, Näringslivsafdeling
www.ytillvaxt.se www.y.lst.se
Sweden Västmanland Länsstyrelsen i Västmanlands län, Näringslivsenheten
www.u.lst.se
Sweden Västra Götaland Västra Götalandsregionen www.vgregion.se
Sweden Örebro Regionförbundet Örebro län www.regionorebro.se www.orebrolan.se
Sweden Östergotland Regionförbundet Östsam www.ostsam.se
UK East Midlands East Midlands Development Agency www.emda.org.uk
UK East of England East of England development agency www.eeda.org.uk
UK London London development agency www.lda.gov.uk
UK North East England One North East development agency www.onenortheast.co.uk
UK North West North West Regional development Agency www.nwda.co.uk
UK Northern Ireland Invest Northern Ireland www.investni.com
UK Scotland Scottish Enterprise www.scottish-enterprise.com
UK South East of England South East England Development agency www.seeda.co.uk
UK South West of England South West of England Regional development agency
www.southwestrda.org.uk
UK Wales Welsh Assembly government, department of enterprise, innovation and network
www.new.wales.gov.uk
UK West Midlands Advantage West Midlands www.advantagewm.co.uk
UK Yorkshire-Humber Yorkshire Forward www.yorkshire-forward.com

38
8. Appendix 2: Figuring out policy patterns
0% 20% 40% 60% 80% 100%
Metropolitan
North high tech
North scientific
British services
German high tech
Seconday metropolises
North industrial
North Italian/Spanish industrial
French agro-industrial
French food
British low tech
North low urbanised
German low tech
Italian textile
Spanish profile
South agricultural
Regional
Central
Local
Multi
0% 20% 40% 60% 80% 100%
30-39
40-49
50-59
60-69
70-79
80-89
90-99
100-109
Regional
Central
Local
Multi
0% 20% 40% 60% 80% 100%
0
1
4
6
7
8
9
10
11,5
14
14,5
15,5
16,5
18
21
Regional
Central
Local
Multi
0% 20% 40% 60% 80% 100%
Undesignated
Partly
Completely
Regional
Central
Local
Multi
0% 20% 40% 60% 80% 100%
AT
BE
CZ
DE
DK
EE
ES
FI
FR
GR
HU
IE
IT
LT
LV
NL
PL
PT
SE
SI
SK
UK
Regional
Central
Local
Multi
Figures A1-A5: RDA sponsorship patterns. Number of organisations (N = 178). Source: RDA survey 2007 database. A1: Sponsorship and economic profile (west) A2: Sponsorship and economic profile (CEE) A3: Sponsorship and regional governance A4: Sponsorship and national designation A5: Sponsorship and member states

39
0% 20% 40% 60% 80% 100%
Metropolitan
North high tech
North scientific
British services
Germand high tech
Seconday metropolises
North industrial
North Italian/Spanish industrial
French agro-industrial
French food
British low tech
North low urbanised
German low tech
Italian textile
Spanish profile
South agricultural
Attraction of firms
Modernisation of firms
Support new/small firms
Support network/cluster
Other
0% 20% 40% 60% 80% 100%
30-39
40-49
50-59
60-69
70-79
80-89
90-99
100-109
Attraction of firms
Modernisation of firms
Support new/small firms
Support network/cluster
Other
0% 20% 40% 60% 80% 100%
0
1
4
6
7
8
9
10
11,5
14
14,5
15,5
16,5
18
21
Attraction of firms
Modernisation of firms
Support new/small firms
Support network/cluster
Other
0% 20% 40% 60% 80% 100%
Undesignated
Partly
Completely
Attraction of firms
Modernisation of firms
Support new/small firms
Support network/cluster
Other
0% 20% 40% 60% 80% 100%
AT
BE
CZ
DE
DK
EE
ES
FI
FR
GR
HU
IE
IT
LT
LV
NL
PL
PT
SE
SI
SK
UK
Attraction of firms
Modernisation of firms
Support new/small firms
Support network/cluster
Other
Figures A6-A10: RDA strategy patterns. Number of organisations (N = 670). Source: RDA survey 2007 database. A6: Strategy and economic profile (west) A7: Strategy and economic profile (CEE) A8: Strategy and regional governance A9: Strategy and national designation A10: Strategy and member states
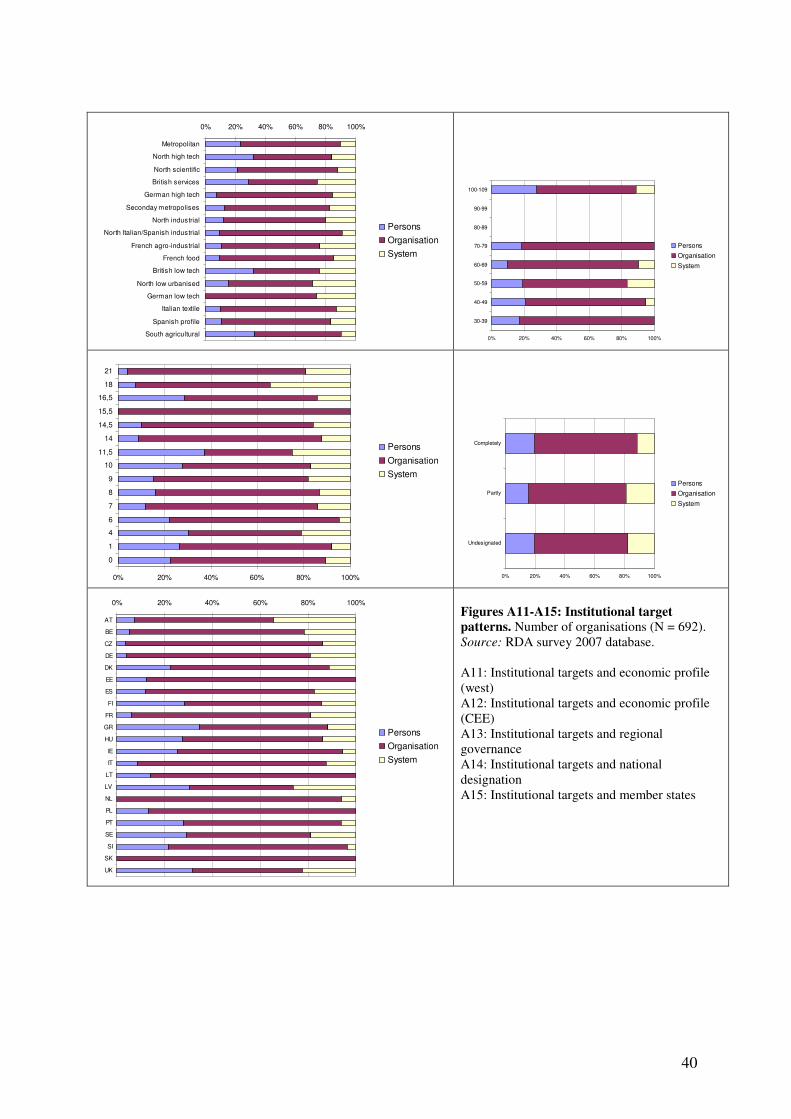
40
0% 20% 40% 60% 80% 100%
Metropolitan
North high tech
North scientific
British services
German high tech
Seconday metropolises
North industrial
North Italian/Spanish industrial
French agro-industrial
French food
British low tech
North low urbanised
German low tech
Italian textile
Spanish profile
South agricultural
Persons
Organisation
System
0% 20% 40% 60% 80% 100%
30-39
40-49
50-59
60-69
70-79
80-89
90-99
100-109
Persons
Organisation
System
0% 20% 40% 60% 80% 100%
0
1
4
6
7
8
9
10
11,5
14
14,5
15,5
16,5
18
21
Persons
Organisation
System
0% 20% 40% 60% 80% 100%
Undesignated
Partly
Completely
Persons
Organisation
System
0% 20% 40% 60% 80% 100%
AT
BE
CZ
DE
DK
EE
ES
FI
FR
GR
HU
IE
IT
LT
LV
NL
PL
PT
SE
SI
SK
UK
Persons
Organisation
System
Figures A11-A15: Institutional target
patterns. Number of organisations (N = 692). Source: RDA survey 2007 database. A11: Institutional targets and economic profile (west) A12: Institutional targets and economic profile (CEE) A13: Institutional targets and regional governance A14: Institutional targets and national designation A15: Institutional targets and member states
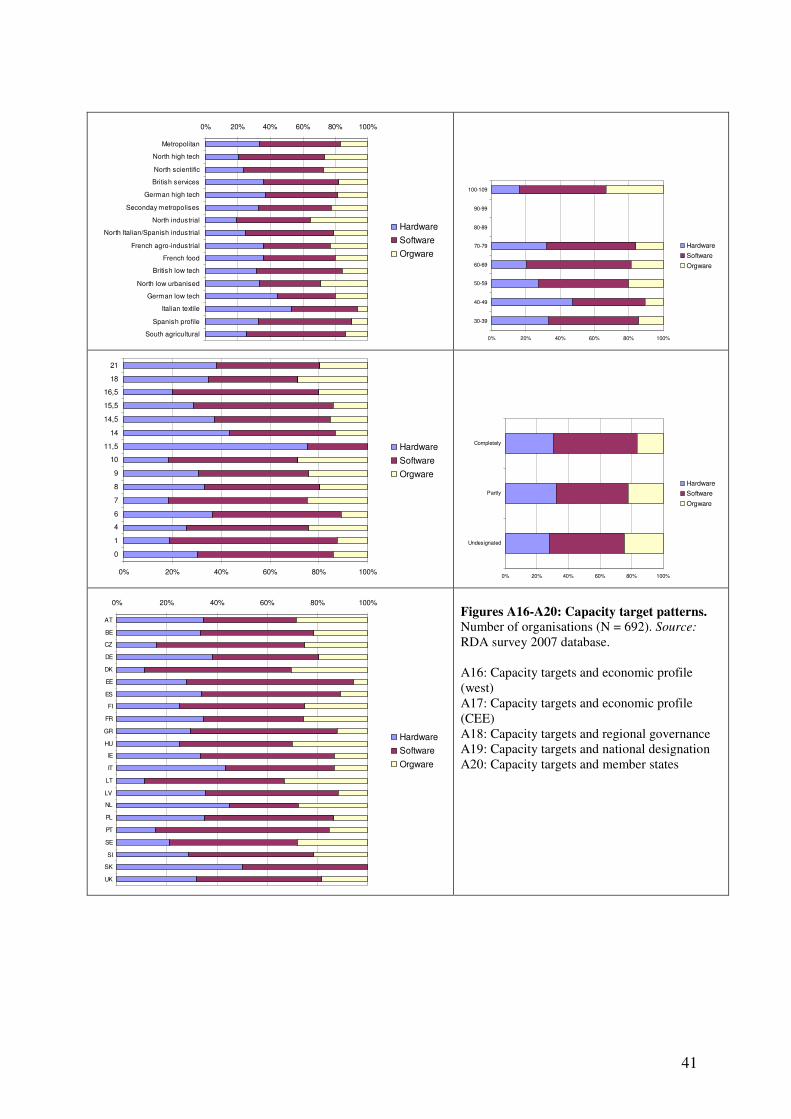
41
0% 20% 40% 60% 80% 100%
Metropolitan
North high tech
North scientific
British services
German high tech
Seconday metropolises
North industrial
North Italian/Spanish industrial
French agro-industrial
French food
British low tech
North low urbanised
German low tech
Italian textile
Spanish profile
South agricultural
Hardware
Software
Orgware
0% 20% 40% 60% 80% 100%
30-39
40-49
50-59
60-69
70-79
80-89
90-99
100-109
Hardware
Software
Orgware
0% 20% 40% 60% 80% 100%
0
1
4
6
7
8
9
10
11,5
14
14,5
15,5
16,5
18
21
Hardware
Software
Orgware
0% 20% 40% 60% 80% 100%
Undesignated
Partly
Completely
Hardware
Software
Orgware
0% 20% 40% 60% 80% 100%
AT
BE
CZ
DE
DK
EE
ES
FI
FR
GR
HU
IE
IT
LT
LV
NL
PL
PT
SE
SI
SK
UK
Hardware
Software
Orgware
Figures A16-A20: Capacity target patterns. Number of organisations (N = 692). Source: RDA survey 2007 database. A16: Capacity targets and economic profile (west) A17: Capacity targets and economic profile (CEE) A18: Capacity targets and regional governance A19: Capacity targets and national designation A20: Capacity targets and member states
42
0% 20% 40% 60% 80% 100%
Metropolitan
North high tech
North scientific
British services
Germand high tech
Seconday metropolises
North industrial
North Italian/Spanish industrial
French agro-industrial
French food
British low tech
North low urbanised
German low tech
Italian textile
Spanish profile
South agricultural
Authority
Finance
Information
Organisation
0% 20% 40% 60% 80% 100%
30-39
40-49
50-59
60-69
70-79
80-89
90-99
100-109
Authority
Finance
Information
Organisation
0% 20% 40% 60% 80% 100%
0
1
4
6
7
8
9
10
11,5
14
14,5
15,5
16,5
18
21
Authority
Finance
Information
Organisation
0% 20% 40% 60% 80% 100%
Undesignated
Partly
Completely
Authority
Finance
Information
Organisation
0% 20% 40% 60% 80% 100%
AT
BE
CZ
DE
DK
EE
ES
FI
FR
GR
HU
IE
IT
LT
LV
NL
PL
PT
SE
SI
SK
UK
Authority
Finance
Information
Organisation
Figures A21-A25: Policy resource patterns. Number of organisations (N = 692). Source: RDA survey 2007 database. A21: Policy resources and economic profile (west) A22: Policy resources and economic profile (CEE) A23: Policy resources and regional governance A24: Policy resources and national designation A25: Policy resources and member states
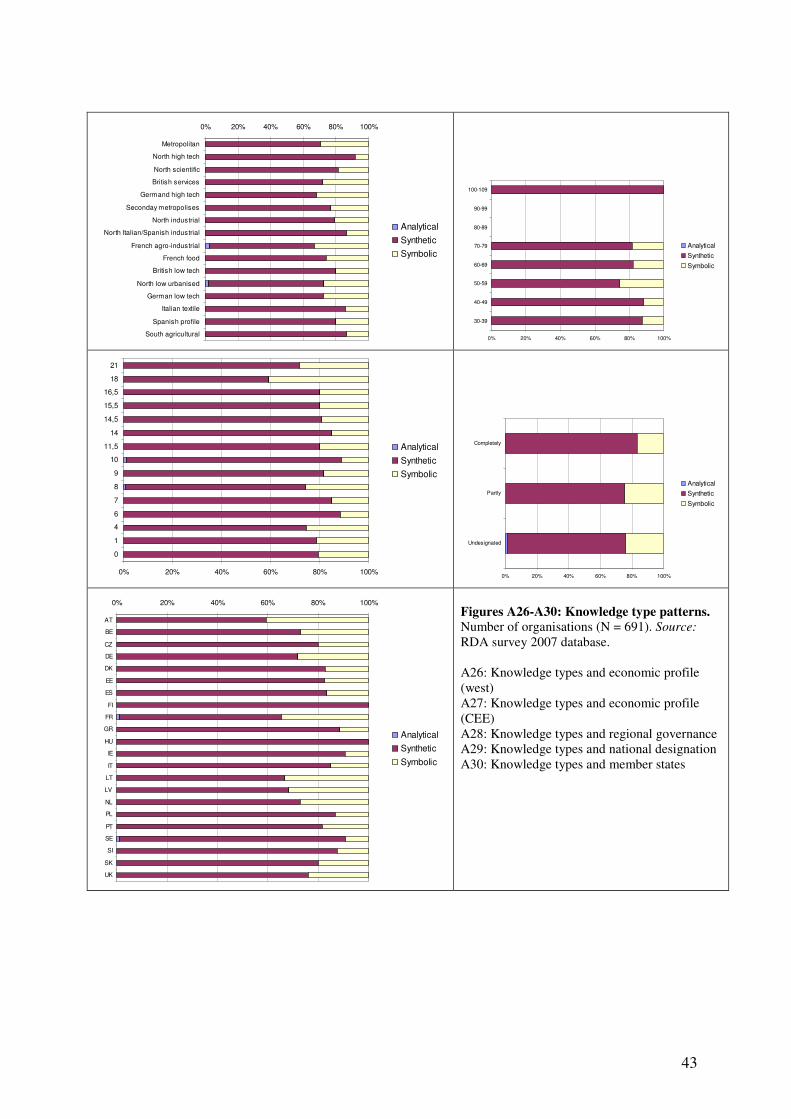
43
0% 20% 40% 60% 80% 100%
Metropolitan
North high tech
North scientific
British services
Germand high tech
Seconday metropolises
North industrial
North Italian/Spanish industrial
French agro-industrial
French food
British low tech
North low urbanised
German low tech
Italian textile
Spanish profile
South agricultural
Analytical
Synthetic
Symbolic
0% 20% 40% 60% 80% 100%
30-39
40-49
50-59
60-69
70-79
80-89
90-99
100-109
Analytical
Synthetic
Symbolic
0% 20% 40% 60% 80% 100%
0
1
4
6
7
8
9
10
11,5
14
14,5
15,5
16,5
18
21
Analytical
Synthetic
Symbolic
0% 20% 40% 60% 80% 100%
Undesignated
Partly
Completely
Analytical
Synthetic
Symbolic
0% 20% 40% 60% 80% 100%
AT
BE
CZ
DE
DK
EE
ES
FI
FR
GR
HU
IE
IT
LT
LV
NL
PL
PT
SE
SI
SK
UK
Analytical
Synthetic
Symbolic
Figures A26-A30: Knowledge type patterns. Number of organisations (N = 691). Source: RDA survey 2007 database. A26: Knowledge types and economic profile (west) A27: Knowledge types and economic profile (CEE) A28: Knowledge types and regional governance A29: Knowledge types and national designation A30: Knowledge types and member states

44
9. Appendix 3: European and regional survey results compared
0
10
20
30
40
50
60
70
80
Regional Central Local Multi
European survey Regional survey
0
10
20
30
40
50
60
70
Persons Organisations System
European survey Regional survey
0
10
20
30
40
50
60
Hardware Software Orgware
European survey Regional survey
0
10
20
30
40
50
60
Authority Finance Information Organisation
European survey Regional survey
0
10
20
30
40
50
60
70
80
Mandatory Conditional Unconditional
European survey Regional survey
0
10
20
30
40
50
60
70
80
90
Analytic Synthetic Symbolic
European survey Regional survey
0
20
40
60
80
100
120
Exploration Examination Exploitation
European survey Regional survey
Figures A31-A37: European and regional survey results compared. Relative prominence of characteristics in per cent. Source: RDA survey 2007 database. A31: Sponsorship A32: Target institutions A33: Target capabilities A34: Policy resources A35: Policy rules A36: Knowledge types A37: Knowledge moments
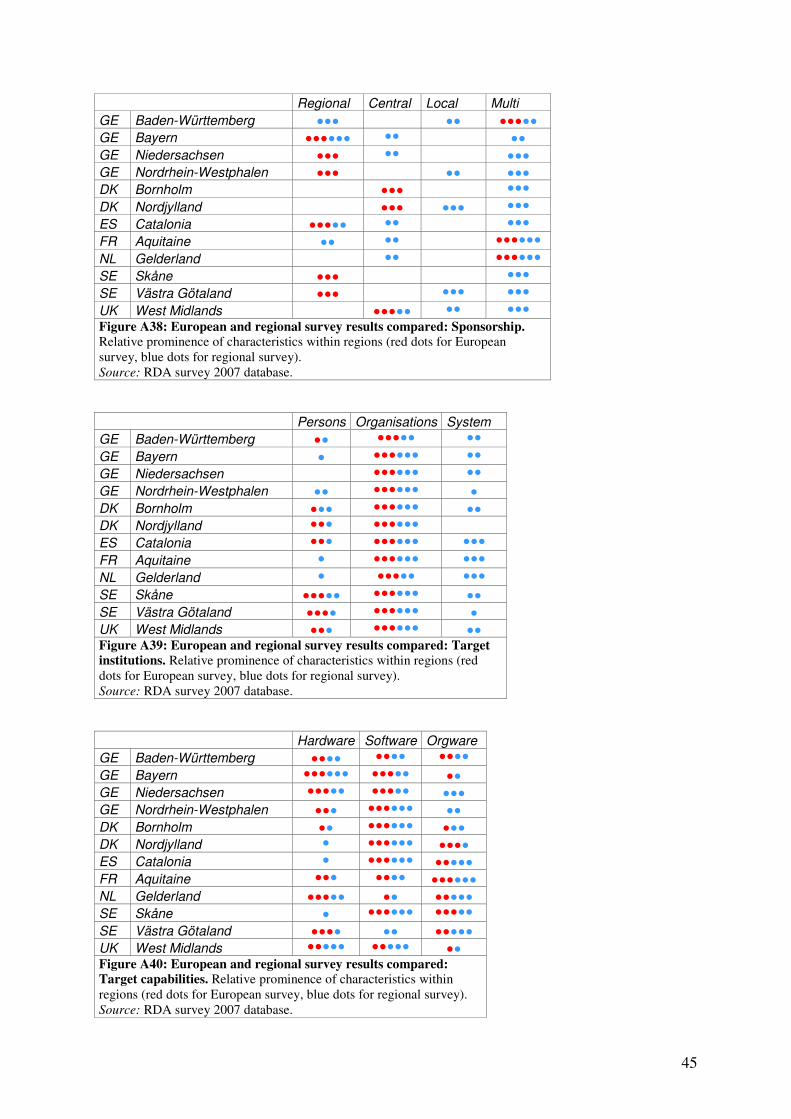
45
Regional Central Local Multi
GE Baden-Württemberg ●●● ●● ●●●●●
GE Bayern ●●●●●● ●● ●●
GE Niedersachsen ●●● ●● ●●●
GE Nordrhein-Westphalen ●●● ●● ●●●
DK Bornholm ●●● ●●● DK Nordjylland ●●● ●●● ●●● ES Catalonia ●●●●● ●● ●●● FR Aquitaine ●● ●● ●●●●●● NL Gelderland ●● ●●●●●● SE Skåne ●●● ●●● SE Västra Götaland ●●● ●●● ●●● UK West Midlands ●●●●● ●● ●●● Figure A38: European and regional survey results compared: Sponsorship. Relative prominence of characteristics within regions (red dots for European survey, blue dots for regional survey). Source: RDA survey 2007 database.
Persons Organisations System
GE Baden-Württemberg ●● ●●●●● ●● GE Bayern ● ●●●●●● ●● GE Niedersachsen ●●●●●● ●● GE Nordrhein-Westphalen ●● ●●●●●● ●
DK Bornholm ●●● ●●●●●● ●●
DK Nordjylland ●●● ●●●●●●
ES Catalonia ●●● ●●●●●● ●●● FR Aquitaine ● ●●●●●● ●●● NL Gelderland ● ●●●●● ●●● SE Skåne ●●●●● ●●●●●● ●●
SE Västra Götaland ●●●● ●●●●●● ●
UK West Midlands ●●● ●●●●●● ●● Figure A39: European and regional survey results compared: Target
institutions. Relative prominence of characteristics within regions (red dots for European survey, blue dots for regional survey). Source: RDA survey 2007 database.
Hardware Software Orgware
GE Baden-Württemberg ●●●● ●●●● ●●●● GE Bayern ●●●●●● ●●●●● ●●
GE Niedersachsen ●●●●● ●●●●● ●●●
GE Nordrhein-Westphalen ●●● ●●●●●● ●●
DK Bornholm ●● ●●●●●● ●●●
DK Nordjylland ● ●●●●●● ●●●●
ES Catalonia ● ●●●●●● ●●●●●
FR Aquitaine ●●● ●●●● ●●●●●●
NL Gelderland ●●●●● ●● ●●●●●
SE Skåne ● ●●●●●● ●●●●● SE Västra Götaland ●●●● ●● ●●●●●
UK West Midlands ●●●●● ●●●●● ●● Figure A40: European and regional survey results compared:
Target capabilities. Relative prominence of characteristics within regions (red dots for European survey, blue dots for regional survey). Source: RDA survey 2007 database.
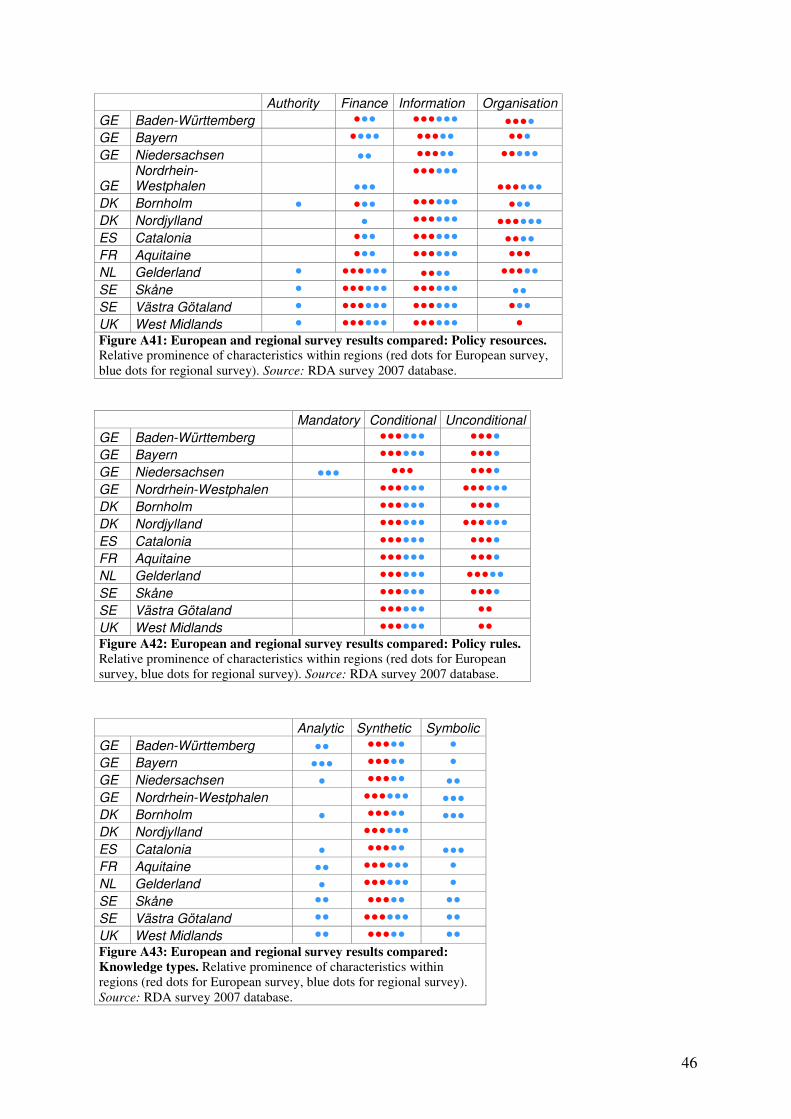
46
Authority Finance Information Organisation
GE Baden-Württemberg ●●● ●●●●●● ●●●●
GE Bayern ●●●● ●●●●● ●●● GE Niedersachsen ●● ●●●●● ●●●●●
GE Nordrhein-Westphalen ●●●
●●●●●● ●●●●●●
DK Bornholm ● ●●● ●●●●●● ●●●
DK Nordjylland ● ●●●●●● ●●●●●●
ES Catalonia ●●● ●●●●●● ●●●●
FR Aquitaine ●●● ●●●●●● ●●● NL Gelderland ● ●●●●●● ●●●● ●●●●● SE Skåne ● ●●●●●● ●●●●●● ●●
SE Västra Götaland ● ●●●●●● ●●●●●● ●●● UK West Midlands ● ●●●●●● ●●●●●● ● Figure A41: European and regional survey results compared: Policy resources. Relative prominence of characteristics within regions (red dots for European survey, blue dots for regional survey). Source: RDA survey 2007 database.
Mandatory Conditional Unconditional
GE Baden-Württemberg ●●●●●● ●●●● GE Bayern ●●●●●● ●●●● GE Niedersachsen ●●● ●●● ●●●● GE Nordrhein-Westphalen ●●●●●● ●●●●●● DK Bornholm ●●●●●● ●●●● DK Nordjylland ●●●●●● ●●●●●● ES Catalonia ●●●●●● ●●●● FR Aquitaine ●●●●●● ●●●● NL Gelderland ●●●●●● ●●●●● SE Skåne ●●●●●● ●●●● SE Västra Götaland ●●●●●● ●● UK West Midlands ●●●●●● ●● Figure A42: European and regional survey results compared: Policy rules. Relative prominence of characteristics within regions (red dots for European survey, blue dots for regional survey). Source: RDA survey 2007 database.
Analytic Synthetic Symbolic
GE Baden-Württemberg ●● ●●●●● ● GE Bayern ●●● ●●●●● ● GE Niedersachsen ● ●●●●● ●●
GE Nordrhein-Westphalen ●●●●●● ●●●
DK Bornholm ● ●●●●● ●●●
DK Nordjylland ●●●●●●
ES Catalonia ● ●●●●● ●●●
FR Aquitaine ●● ●●●●●● ● NL Gelderland ● ●●●●●● ● SE Skåne ●● ●●●●● ●● SE Västra Götaland ●● ●●●●●● ●● UK West Midlands ●● ●●●●● ●● Figure A43: European and regional survey results compared:
Knowledge types. Relative prominence of characteristics within regions (red dots for European survey, blue dots for regional survey). Source: RDA survey 2007 database.

47
Exploration Examination Exploitation
GE Baden-Württemberg ●●● ●●● ●●●●● GE Bayern ●● ●●●●●● GE Niedersachsen ● ●●● ●●●●●● GE Nordrhein-Westphalen ●● ●●●●●● DK Bornholm ● ●● ●●●●●● DK Nordjylland ●●●●●● ES Catalonia ●● ●● ●●●●●● FR Aquitaine ●●● ●●● ●●●●●● NL Gelderland ●● ●●● ●●●●●● SE Skåne ●●● ●●● ●●●●●● SE Västra Götaland ●● ●●● ●●●●●● UK West Midlands ●● ●●● ●●●●●● Figure A44: European and regional survey results compared: Knowledge
moments. Relative prominence of characteristics within regions (red dots for European survey, blue dots for regional survey). Source: RDA survey 2007 database.

48
10. Appendix 4: RDA policies and WP8 hypotheses
Hypothesis RDA survey conclusions
Limited policy attention accorded to symbolic forms of knowledge
Partly supported, as synthetic knowledge still predominates. The most important involvement of symbolic knowledge is related to its use in connection with general place marketing initiatives (promotion of inward investment) while examination or production of new symbolic knowledge is virtually absent.
Limited policy attention accorded to the consumption side of economic knowledge processes
Confirmed, cf. the previous hypothesis.
Limited policy attention accorded to supporting combinatorial knowledge processes
Difficult to asses on the basis of the survey, but should be possible to illuminated on the basis of the seven WP8 Intermediate Reports.
Limited policy attention accorded to supporting extra-regional knowledge processes
Difficult to asses on the basis of the survey, but should be possible to illuminated on the basis of the seven WP8 Intermediate Reports.
An increasing importance of knowledge-intensive policy instruments
Confirmed to constitute the majority of current RDA policies, but trend in comparison with early 1990s less certain. The apparent lack of growth among RDA policies may reflect new divisions of labour between development organisations, if RDAs have become more prominent as policy organisations, then a relative growth in the role of knowledge-intensive policies will also have taken place.
The increasingly multi-level nature of policy-design and implementation
Confirmed.
The growing role of private KIBS (and freelancing academics) in policy design and implementation
Difficult to asses on the basis of the survey, but should be possible to illuminated on the basis of the seven WP8 Intermediate Reports.
The self-proclaimed gender-neutrality of most policies
Clearly evident: for more than 70 per cent of organisations surveyed no gender strategy has been identified, while mainstreaming (Sweden) or separate initiatives (UK, Ireland) prevail in only two member states.
Evidence-based policy-making is of increasing importance
Difficult to asses on the basis of the survey, but should be possible to illuminated on the basis of the seven WP8 Intermediate Reports.
Growing importance of regulatory pressure as creator of knowledge-intensive demand
Difficult to asses on the basis of the survey, but should be possible to illuminated on the basis of the seven WP8 Intermediate Reports.

49
References
Asheim, B. and L. Coenen (2005). "Knowledge Bases and Regional Innovation Systems:
Comparing Nordic Clusters." Research Policy 34(8): 1173-90. Asheim, B., L. Coenen, et al. (2007). "Face-to-Face, Buzz and Knowledge Bases: Socio-
spatial Implications for Learning, Innovation and Innovation Policy." Environment & Planning C: Government and Policy 25: 655-70.
Bachtler, J. (1997). New Dimensions of Regional Policy in Western Europe. The Political Economy of Regionalism. M. Keating and J. Loughlin. London, Frank Cass: 77-89.
Bachtler, J. and S. Taylor (1997). EU Regional Development Strategies: Comparisons and Contrasts Among Objective 2 Programmes. The Coherence of EU Regional Policy. Contrasting Perspectives on the Structural Funds. J. Bachtler and I. e. Turok. London, Jessical Kingsley: 219-45.
Bachtler, J. and I. Turok, Eds. (1997). The Coherence of EU Policy. Contrasting Perspectives on the Structural Funds. London, Jessica Kingsley Press.
Bachtler, J. and C. Wren (2006). "Special Issue: The Evaluation of EU Cohesion Policy." Regional Studies 40(2).
Bachtler, J. and D. Yuill (2007). "Regional Policy in Western Europe: Taking Stock of the Shift in Paradigm." RUFIS Beiträge zur Ballundsraumforschung 2007(10).
Benneworth, P. (2001). Regional Development Agencies - The Early Years. Seaford, RSA. Carrincazeaux, C., F. Gaschet, et al. (2007). Typology of European regions - Final report.
Birmingham, EURODITE, CURS, University of Birmingham. Cooke, P. (2005). Proximities, Knowledges and Innovation Biographies. RSA International
Conference. Aalborg. Cooke, P. and K. Morgan (1993). "The Network Paradigm: New Departures in Corporate and
Regional Development." Environment & Planning D 11: 543-64. Downes, R. (2000). EU and National Regional Policies in Austria. Governance, Institutional
Change and Regional Development. M. e. a. e. Danson. Aldershot, Ashgate: 246-65. Dunleavy, P. (1989). "The Architecture of the British Central State. Part I: Framework for
Analysis." Public Administration 67: 249-75. EURADA (1995). Reflections on the Creation, Development and Management of RDAs.
Brussels, EURADA. Florida, R. (1995). "Towards the Learning Region." Futures 27: 527-36. Halkier, H. (2006). Institutions, Discourse and Regional Development. The Scottish
Development Agency and the Politics of Regional Policy. Brussels, PIE Peter Lang. Halkier, H. (2008). Regional Development Policies and Structural Reform in Denmark. From
Policy Segmentation towards Strategic Synergy? Towards New Nordic Regionalism. Politics, Administration and Regional Development. O. Bukve, H. Halkier and P. d. Souza. Aalborg, Aalborg University Press: 201-25.
Halkier, H. (2009). Knowledge typologies - A Brief note on knowledge types. Aalborg: 4. Halkier, H. and M. Danson (1997). "Regional Development Agencies in Europe: A Survey of
Key Characteristics and Trends." European Urban and Regional Studies 4(3): 243-56. Hassink, R. (2001). "The Learning Region: A Fuzzy Concept or a Sound Theoretical Basis for
Modern Regional Innovation Policies?" Zeitschrift für Wirtschaftsgeographie 45(3-4): 219-30.
Hassink, R. (2005). "How to Unlock Regional Economies from Path Dependency? From Learning Region to Learning Cluster." European Planning Studies 13(4): 521-35.
50
Hooghe, L. and M. Keating (1994). "The Politics of European Union Regional Policy." Journal of European Public Policy 1(3): 369-92.
Hooghe, L., G. Marks, et al. (2008). "Regional Authority in 42 Countries, 1950-2006: A Measure and Five Hypotheses." Regional & Federal Studies 18(2-3).
Hudson, R. e. a. (1997). "Developing Regional Strategies for Economic Success: Lessons from Europe's Economically Successful Regions." European Urban and Regional Studies 4(4): 365-73.
Lagendijk, A. (2000). Learning in Non-core Regions: Towards "Intelligent Clusters" Adressing Business and Regional Needs. Learning Regions: Theory, Policy and Practice. R. Rutten. London, Edward Elgar. 90.
MacLeod, G. (2000). "The Learning Region in an Age of Austerity: Capitalising on Knowledge, Entrepreneurialism, and Reflexive Capitalism." Geoforum 31(2): 219-36.
Markusen, A. (1999). "Fuzzy Concepts, Scanty Evidence, Policy Distance: The Case for Rigour and Policy Relevance in Critical Regional Studies." Regional Studies 33(9): 869-84.
Morgan, K. (1997). "The Learning Region: Institutions, Innovation and Regional Renewal." Regional Studies 31(5): 491-504.
Nauwelaers, C. (2001). Path-dependency and the Role of Institutions in Cluster Policy Generation. Cluster Policies - Cluster Development. Å. e. Mariussen. Stockholm, Nordregio: 93-108.
Rutten, R. and F. Boekema, Eds. (2007). The Learning Region. Foundations, State-of-the Art, Future. Cheltenham, Edward Elgar.
Svensson, B. and A. Östholl (2002). "From Government to Governance: Regional Partnerships in Sweden." Regional & Federal Studies 11(2): 25-42.
Windhoff-Héritier, A. (1987). Policy-Analyse - Eine Einführung. Frankfurt, Campus. Wishlade, F. G. (2008). "Competition and Cohesion - Coherence or Conflict? European
Union Regional State Aid Reform Post-2006." Regional Studies 42(5): 753-65. Wren, C. (1996). "Grant Equivalent Expenditure on Industrial Subsidies in the Post-War UK."
Oxford Bulletin of Economics and Statistics 58(2): 317-53. Yuill, D., Ed. (1982). Regional Development Agencies in Europe. Aldershot, Gower. Yuill et al. (1981-99). European Regional Incentives, 1981-99. London, Bowker-Saur.