aalborg universitet real-time hybrid simulation...
TRANSCRIPT

Aalborg Universitet
Real-time hybrid simulation technique for performance evaluation of full-scalesloshing dampers in wind turbinesZhang, Zili; Basu, Biswajit; Nielsen, Søren R. K.
Published in:Journal of Physics: Conference Series
DOI (link to publication from Publisher):10.1088/1742-6596/753/8/082021
Creative Commons LicenseCC BY 3.0
Publication date:2016
Document VersionPublisher's PDF, also known as Version of record
Link to publication from Aalborg University
Citation for published version (APA):Zhang, Z., Basu, B., & Nielsen, S. R. K. (2016). Real-time hybrid simulation technique for performanceevaluation of full-scale sloshing dampers in wind turbines. Journal of Physics: Conference Series, 753(8),[082021]. DOI: 10.1088/1742-6596/753/8/082021
General rightsCopyright and moral rights for the publications made accessible in the public portal are retained by the authors and/or other copyright ownersand it is a condition of accessing publications that users recognise and abide by the legal requirements associated with these rights.
? Users may download and print one copy of any publication from the public portal for the purpose of private study or research. ? You may not further distribute the material or use it for any profit-making activity or commercial gain ? You may freely distribute the URL identifying the publication in the public portal ?
Take down policyIf you believe that this document breaches copyright please contact us at [email protected] providing details, and we will remove access tothe work immediately and investigate your claim.
Downloaded from vbn.aau.dk on: august 30, 2018

Journal of Physics: Conference Series
PAPER • OPEN ACCESS
Real-time hybrid simulation technique forperformance evaluation of full-scale sloshingdampers in wind turbinesTo cite this article: Zili Zhang et al 2016 J. Phys.: Conf. Ser. 753 082021
View the article online for updates and enhancements.
Related contentA frequency response analysis approachfor quantitative assessment of actuatortracking for real-time hybrid simulationTong Guo, Cheng Chen, WeiJie Xu et al.
-
This content was downloaded from IP address 130.225.198.245 on 02/01/2018 at 09:06
Real-time hybrid simulation technique for performance evaluation of full-scale sloshing dampers in wind turbines
Zili Zhang1, Biswajit Basu2 and Søren R.K. Nielsen3 1Department of Engineering, Aarhus University, 8000 Aarhus C, Denmark 2Department of Civil, Structural & Environmental Engineering, Trinity College Dublin, Dublin 2, Ireland 3Department of Civil Engineering, Aalborg University, 9000 Aalborg, Denmark
Email: [email protected]
Abstract. As a variation of the pseudodynamic testing technique, the real-time hybrid simulation (RTHS) technique is executed in real time, thus allowing investigation of structural systems with rate-dependent components. In this paper, the RTHS is employed for performance evaluation of full-scale liquid sloshing dampers in multi-megawatt wind turbines, where the tuned liquid damper (TLD) is manufactured and tested as the physical substructure while the wind turbine is treated as the numerical substructure and modelled in the computer using a 13-degree-of-freedom (13-DOF) aeroelastic model. Wind turbines with 2 MW and 3 MW capacities have been considered under various turbulent wind conditions. Extensive parametric studies have been performed on the TLD, e.g., various tuning ratios by changing the water level, TLD without and with damping screens (various mesh sizes of the screen considered), and TLD with flat and sloped bottoms. The present study provides useful guidelines for employing sloshing dampers in large wind turbines, and indicates huge potentials of applying RTHS technique in the area of wind energy.
1. Introduction Recent development in the wind energy industry aims at obtaining more economic and productive configurations in order to compete in the energy sector. Multi-megawatt wind turbines are designed with increasingly larger rotors and higher towers, in order to capture more energy throughout their life time and thus reduce the cost of energy. As wind turbines grow in size, the stiffness of the blades and the tower are not increased proportionally, rendering the structural components more susceptive to dynamic loads such as turbulent winds and ocean waves. The large amplitude vibrations may significantly shorten fatigue life of the components and lower the operational efficiency in converting wind energy to electrical power.
The flap-wise blade vibration and fore-aft tower vibration in wind turbines are normally highly damped owning to the strong aerodynamic damping as long as the flow is attached at the blades. In contrast, edgewise blade vibration and lateral tower vibration are characterized by insignificant aerodynamic damping, and hence these modes of vibrations may be prone to large amplitude vibrations. Due to mechanical couplings of the edgewise vibration- lateral tower vibration- drivetrain torsional vibration, the unfavorable tower and blade vibrations will also increase the fluctuations of the generator torque and hence the quality of the generated power.
The Science of Making Torque from Wind (TORQUE 2016) IOP PublishingJournal of Physics: Conference Series 753 (2016) 082021 doi:10.1088/1742-6596/753/8/082021
Content from this work may be used under the terms of the Creative Commons Attribution 3.0 licence. Any further distributionof this work must maintain attribution to the author(s) and the title of the work, journal citation and DOI.
Published under licence by IOP Publishing Ltd 1
Structural control techniques (by means of passive, semi-active and active control devices), which have achieved significant success in mitigating vibrations of civil engineering structures, are drawing more and more attention from wind energy community [1-3]. The tuned liquid damper (TLD) or sloshing damper [4,5], as one of the most cost-effective passive control devices, has the advantages of easy fabrication/installation, minimal maintenance after installation and broader band-width comparing with TMD-like devices due to the nonlinear wave breaking effect. Therefore, it becomes a natural candidate for vibration control of large flexible wind turbines.
The main difficulties associated with TLDs arise from the nonlinear nature of the sloshing liquid, which makes modeling and designing these devices challenging. Since all the previously-proposed theoretical models have errors in capturing the real dynamic characteristics of the TLD-structure system, it is necessary to carry out experimental studies on it. In the present paper, a state-of-the-art testing technique, the real-time hybrid simulation (RTHS) [6,7], is applied for evaluating the performance of TLD in suppressing lateral tower vibrations. The fundamental idea of RTHS is to split the entire system into two parts: a numerical substructure and a physical substructure, and they are synchronized by real-time controllers. By means of RTHS, full-scale testing of the physical substructure becomes applicable (eliminating the scale effect) and various realistic load conditions (normally difficult to realize in lab conditions) can be achieved as accurately as possible by computer simulations.
A full scale TLD is manufactured and tested as the physical substructure, while a highly-coupled 13-degree-of-freedom (13-DOF) aeroelastic wind turbine model is employed as the numerical substructure. Dynamic responses of the wind turbine system are numerically calculated in real-time using the 13-DOF model formulated in Matlab/Simulink. Both 3 MW and 2 MW wind turbines have been considered. Extensive parametric studies have been performed on the tested TLD, e.g., various tuning ratios by changing the water level, TLD without and with damping screens (various mesh sizes of the screen considered), and TLD with flat and sloped bottoms. Guidelines for designing and applying sloshing dampers in wind turbines are to be established. The applicability of employing RTHS technique in the area of wind energy is also to be highlighted.
2. Real-time hybrid simulation of the wind turbine –TLD system
2.1. Implementation of the hybrid model
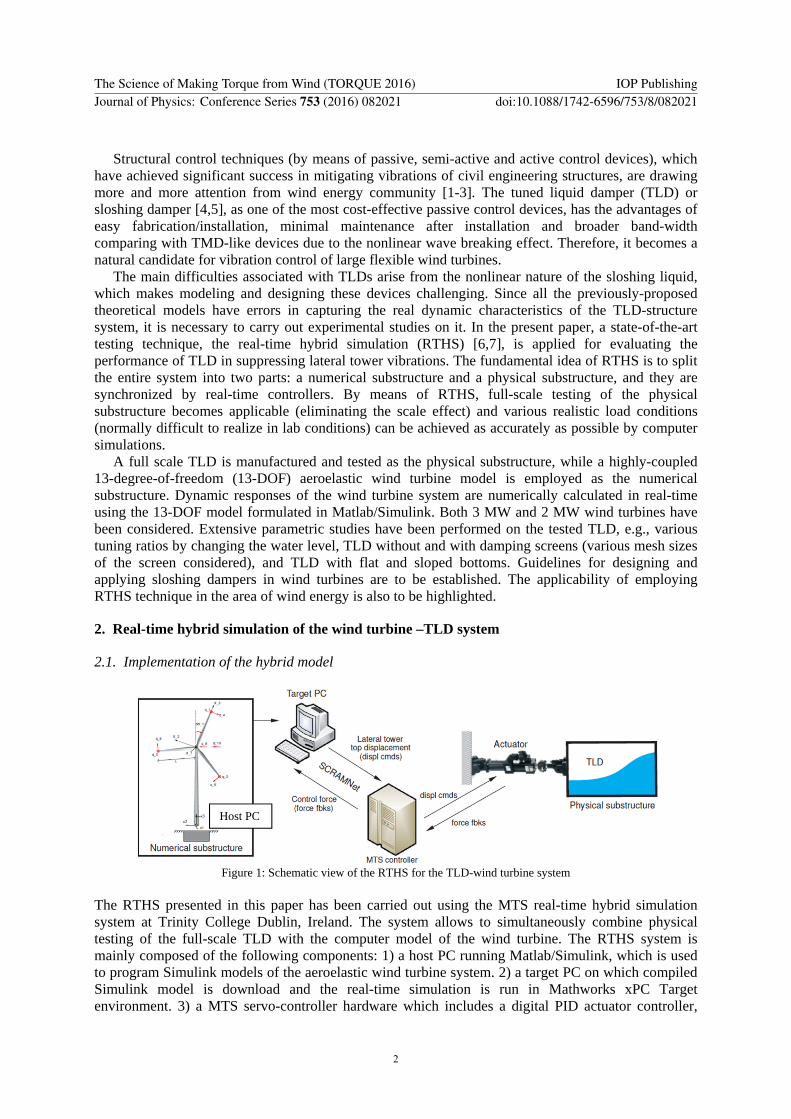
Figure 1: Schematic view of the RTHS for the TLD-wind turbine system
The RTHS presented in this paper has been carried out using the MTS real-time hybrid simulation system at Trinity College Dublin, Ireland. The system allows to simultaneously combine physical testing of the full-scale TLD with the computer model of the wind turbine. The RTHS system is mainly composed of the following components: 1) a host PC running Matlab/Simulink, which is used to program Simulink models of the aeroelastic wind turbine system. 2) a target PC on which compiled Simulink model is download and the real-time simulation is run in Mathworks xPC Target environment. 3) a MTS servo-controller hardware which includes a digital PID actuator controller,
Host PC
The Science of Making Torque from Wind (TORQUE 2016) IOP PublishingJournal of Physics: Conference Series 753 (2016) 082021 doi:10.1088/1742-6596/753/8/082021
2
signial conditioners, data acquisition system and interlock mechanisms. 4) a hydraulic actuator equipped with displacement and force sensors, which physically operate the desired command to the physical substructure and allows to measure the quantities of interest. Figure 1 shows the schematic diagram of the RTHS system developed in this study. At each time step, the discrete equations of motion of the 13-DOF model are solved on the target PC. The numerically obtained lateral tower displacement is sent as the command over the high-speed network ring SCRAMNet (shared common random access memory network). The MTS controller generates an appropriate signal for the servo-valve that moves the actuator to the commanded position. The actual displacement of the actuator and the interacting force (sloshing force) measured from the sensors are fed back to the SCRAMNet and accessed by the target PC. With this TLD-generated interacting force, the equations of motion of the wind turbine system, where a TLD is installed, are solved numerically, and the displacement command is sent to the controller again. This process is carried out in real-time.
Unlike the traditional pseudodynamic test technique, in RTHS the loading command is sent to the actuator in real-time, thus improving the accuracy of the tests by eliminating the hold phase and associated force relaxation. The rate-dependent behaviour of the physical substructure such as the TLD can thus be captured. In most of the recent RTHSs, the MTS controller runs at a sampling rate of 1024 Hz (1/1024 s sampling time) to control the motion of the servo-hydraulic actuator. When the integration time step of the numerical substructure is larger than 1/1024 s (for nonlinear finite element models), the predictor-corrector technique [8] has been widely employed to generate the displacement command at the required rate and to synchronize the hybrid simulation. In the present case, the integration time step of the wind turbine model is set to be equal to the sampling time of the MTS controller (1/1024 s), since no iterations are needed for solving the numerical model and the actual task execution time is less than 1/1024 s. Therefore synchronization is achieved without using the predictor-corrector technique. Further, an extrapolation-based delay compensation technique [7] is applied since there is an inherent lag in the displacement response of servo-hydraulic actuator versus the command displacement.
2.2. The numerical substructure
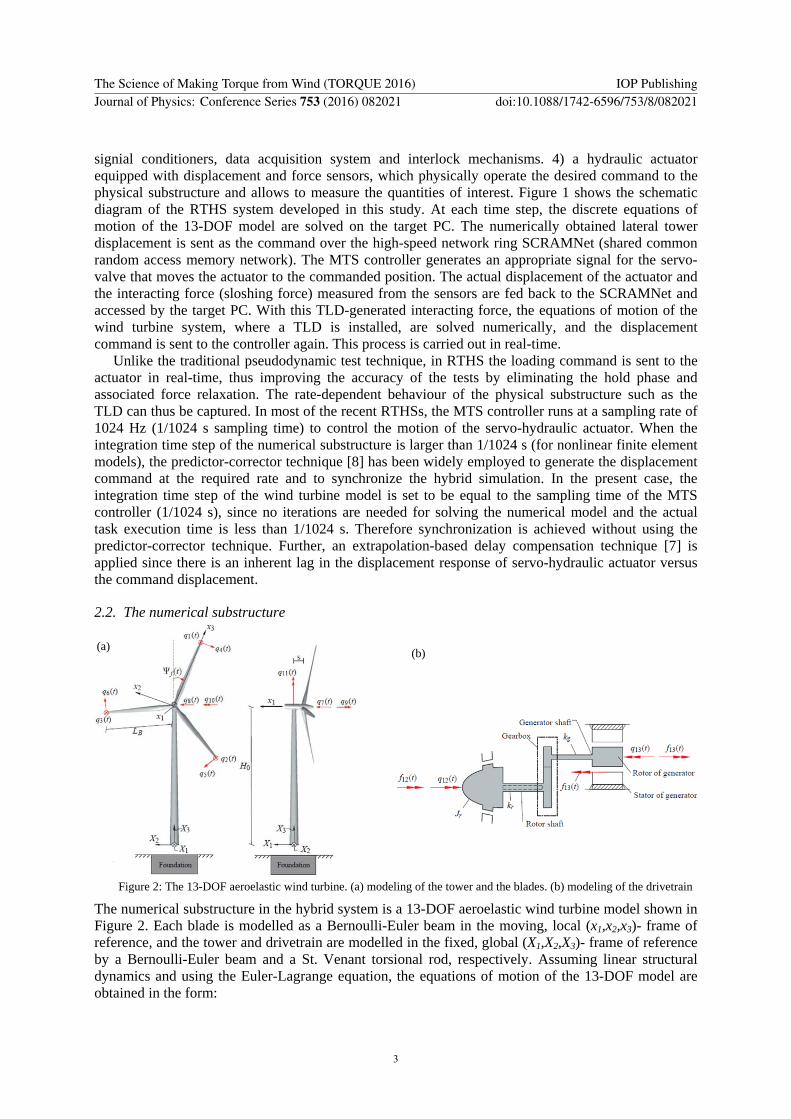
Figure 2: The 13-DOF aeroelastic wind turbine. (a) modeling of the tower and the blades. (b) modeling of the drivetrain
The numerical substructure in the hybrid system is a 13-DOF aeroelastic wind turbine model shown in Figure 2. Each blade is modelled as a Bernoulli-Euler beam in the moving, local (x1,x2,x3)- frame of reference, and the tower and drivetrain are modelled in the fixed, global (X1,X2,X3)- frame of reference by a Bernoulli-Euler beam and a St. Venant torsional rod, respectively. Assuming linear structural dynamics and using the Euler-Lagrange equation, the equations of motion of the 13-DOF model are obtained in the form:
(a) (b)
The Science of Making Torque from Wind (TORQUE 2016) IOP PublishingJournal of Physics: Conference Series 753 (2016) 082021 doi:10.1088/1742-6596/753/8/082021
3

( ) ( ) ( ) ( ) ( ) ( ) ( , , ) ( )a TLDt t t t t t q q t f t M q C q K q F H (1) where q(t) is the DOFs vector in which q8(t) is the DOF describing lateral tower top displacement. M(t) is the mass matrix, C(t) is the damping matrix including the structural and gyroscopic damping, and K(t) is the stiffness matrix including structural, geometric and gyroscopic stiffness. All these system matrices contain the azimuthal angle and are thus time-varying, due to the fact that the DOFs of the blades are modeled in the moving frame of reference while others are modeled in the fixed frame of reference. Detailed expressions of the matrices can be found in [9]. Since only the normal operational conditions are considered, the structural model of the wind turbine is assumed to be linear. Fa(q, ,t) is the nonlinear aerodynamic load vector work-conjugated to q(t), considering quasi-steady aeroelasticity.
( )TLDf t is the sloshing force generated by the TLD, which is measured by the actuator and sent to Simulink model in real-time. H is a vector indicating the location of the damper.
To obtain the aerodynamic loads Fa(q, ,t), turbulence field needs to be generated. The turbulence modeling is based on Taylor’s hypothesis of frozen turbulence, corresponding to a frozen field convected into the rotor plane in the global X1-direction with a mean velocity V0 and turbulence intensity I. The frozen field is assumed to be homogeneous and isotropic, with a covariance structure given by [10]. Calibrated from this theoretical covariance structure, the 1st order autoregressive (AR) model as proposed by [1] performs a 1st order filtering of the white noise input, resulting in continuous, non-differentiable sample curves of the turbulence field at the rotor plane. Nest, the turbulence encountered by the rotating blade is obtained by linear interpolation between the turbulence at different points in the global frame of reference, resulting in the rotational sampled turbulence. The aerodynamic loads along the blades are then calculated by the blade element momentum (BEM) method with Prandtl’s tip loss factor and Glauert correction. A full-span rotor-collective controller is also included in the model with time delay modelled by a first order filter. The pitch demand is modelled by a PI controller.
2.3. The physical substructure
Figure 3: Test setup. (a) the reaction frame and the physical substructure (the TLD). (b) control room
The test setup is shown in Figure 3. The full-size TLD is made up of a closed rectangular tank with an inner size of 1.93m (length) × 0.59m (width) × 1.2m (height). Since the width of the tank is much smaller than the length, it is expected that the sloshing of the water is predominately 2-dimensional, and the 3-dimensinal coupling effect can be neglected in the present study. The TLD is suspended to the top of the reaction frame by four steel cables in order to minimize friction when the tank is enforced to move by the actuator. The horizontal hydraulic actuator (MTS 244), with a load capacity of 150kN and a maximum stroke of ±125mm, is bolted to the left side of the TLD. A load cell and a linear variable displacement transducer (LVDT) are attached in the actuator for measuring the interaction force (the sloshing force) and the actuator displacement. Further, a capacitance wave gauge is installed close to the left of the tank for measuring water surface elevation.
Tank without and with damping screens have both been considered during the RTHS. Actually, the inherent viscous damping of the water is much less than the optimal damping required for the optimal performance of the TLD. The inclusion of damping screens significantly increases the damping ratio
The Science of Making Torque from Wind (TORQUE 2016) IOP PublishingJournal of Physics: Conference Series 753 (2016) 082021 doi:10.1088/1742-6596/753/8/082021
4

and energy dissipation of the water sloshing, thus improving the performance of the TLD. Damping screens with five different mesh sizes have been evaluated, i.e., 90mm×90mm, 75mm×75mm, 47mm×47mm, 22mm×22mm, 9.5mm×9.5mm, as shown in Figure 4. Optimal mesh size is determined for this TLD through the tests. For each of these configurations, two damping screens are installed inside the tank at 1/3L and 2/3L locations, respectively, where L is the length of the tank.
(a) (b) (c) (d) (e)
Figure 4: Damping screens used in the RTHS with different mesh sizes. (a) 90mm×90mm. (b) 75mm×75mm. (c) 47mm×47mm. (d) 22mm×22mm. (e) 9.5mm×9.5mm.
3. RTHS results and analysis
3.1. General description
Considering the size of the manufactured TLD, the suitable ratings of wind turbine could be 2MW and 3MW, and both of them have been established in Matlab/Simulink. Classical upscale/downscaling method has been used on the NREL-5MW reference turbine [11] to obtain data of these two turbines. The resulting system parameters are provided in Table 1.
Table 1: Parameters of the two wind turbines modeled in the Simulink model.
Parameter 3MW 2 MW Hub height [m] 67.9 55.4 Rotor rotational speed [rad/s] 1.63 2.00 Rotor moment of inertia [kg m2] 1.039·107 3.768·106 Blade radius [m] 49 40 Blade mass [kg] 8244.8 4488.0 Blade structural damping ratio [-] 0.005 0.005 Nacelle + hub mass [kg] 1.379·105 7.508·104 Tower mass [kg] 1.615·105 8.790·104 Tower structural damping ratio [-] 0.01 0.01 First lateral tower eigenfrequency [rad/s] 2.75 3.37
Tuning of the TLD is achieved by changing the mean water level, based on the following equation
from linear wave theory:
21 tanh( )
g h
L L
(2)
where 1 is first sloshing eigenfrequency, g is the gravitational acceleration, L is the length of the tank
and h is the mean water level. h is adjusted so that 1 is close to the first lateral tower frequency as shown in Table 1. For each wind turbine model, tests were taken using three different turbulent wind loads (V0=12m/s, I=0.08; V0=12m/s, I=0.1; V0=8m/s, I=0.1) and six different configurations of the damping screens (one case without damping screens). For most cases the tuning ratio (ratio between
1 and the first lateral tower frequency) is set to be 1.0, while for a few cases three different tuning ratios (1.0, 0.95, 1.05) have been considered. The duration of each RTHS was set to be 5 minutes.
3.2. Performance of TLD with flat bottom
The Science of Making Torque from Wind (TORQUE 2016) IOP PublishingJournal of Physics: Conference Series 753 (2016) 082021 doi:10.1088/1742-6596/753/8/082021
5

Table 2 shows the response reduction of lateral tower vibrations of the 2MW wind turbine by the TLD. Reductions of both the standard deviation (STD) and the peak value of the tower top displacement are presented. For performance evaluation of the TLD, the STD reduction is clearly a better index because it indicates the overall reduction of the response and thus the fatigue life improvement. Nevertheless, the peak reduction still gives an indication of the damper performance in the (ultimate limit state) ULS load conditions.
Table 2: Response reduction of lateral tower vibrations of the 3MW wind turbine by TLDs with different configurations. wind load scenario damping screens tuning ratio water level and water mass STD reduction peak reduction
V0=12m/s, I=0.08
None 1.0 31.6cm / 360.3kg 32% 18% 0.95 28.1cm / 319.8kg 28% 27%
1.05 35.6cm / 405.6kg 18% -3%
90mm×90mm 1.0 31.6cm / 360.3kg 43% 29%
75mm×75mm 1.0 31.6cm / 360.3kg 45% 32%
47mm×47mm 1.0 31.6cm / 360.3kg 45% 33%
22mm×22mm 1.0 31.6cm / 360.3kg 46% 32%
0.95 28.1cm / 319.8kg 19% 5%
1.05 35.6cm / 405.6kg 28% 13%
9.5mm×9.5mm 1.0 31.6cm / 360.3kg 41% 29%
V0=12m/s, I=0.1
None 1.0 31.6cm / 360.3kg 33% 24% 0.95 28.1cm / 319.8kg 33% 25%
1.05 35.6cm / 405.6kg 14% -5%
90mm×90mm 1.0 31.6cm / 360.3kg 41% 28%
75mm×75mm 1.0 31.6cm / 360.3kg 43% 30%
47mm×47mm 1.0 31.6cm / 360.3kg 44% 31%
22mm×22mm 1.0 31.6cm / 360.3kg 44% 31%
0.95 28.1cm / 319.8kg 22% 10%
1.05 35.6cm / 405.6kg 26% 10%
9.5mm×9.5mm 1.0 31.6cm / 360.3kg 41% 27%
V0=8m/s, I=0.1
None 1.0 31.6cm / 360.3kg 12% 3% 0.95 28.1cm / 319.8kg 10% 5%
1.05 35.6cm / 405.6kg 7% -5%
90mm×90mm 1.0 31.6cm / 360.3kg 31% 17%
75mm×75mm 1.0 31.6cm / 360.3kg 34% 22%
47mm×47mm 1.0 31.6cm / 360.3kg 34% 21%
22mm×22mm 1.0 31.6cm / 360.3kg 37% 29%
0.95 28.1cm / 319.8kg 13% 5%
1.05 35.6cm / 405.6kg 19% 12%
9.5mm×9.5mm 1.0 31.6cm / 360.3kg 35% 27%
From Table 2, the following observations are to be emphasized: (i) For all wind load scenarios and all TLD configurations, the damper is effective in reducing the
standard deviations and peak responses of the tower top displacement. Therefore, the dynamic response and fatigue life of the 3MW turbine tower can be successfully improved by the full-scale TLD designed in this study. Nevertheless, the absolute response reduction by the damper is quite different for different wind load scenarios, due to the stochastic nature of the turbulence.
(ii) The inclusion of damping screens significantly improves the performance of the TLD, for all wind load scenarios. When there are no damping screens installed, the TLD exhibits the worst performance due to its low energy dissipation capacity. For each wind load scenario, there exists an optimal mesh size that is close to 22mm×22mm. However, the performance of the damper is rather robust within the evaluated mesh sizes.
(iii) For the limited cases considered (no damping screens and damping screens with the size of 22mm×22mm), the optimal tuning ratio is always 1.0. Therefore for the 3MW turbine, the optimal
The Science of Making Torque from Wind (TORQUE 2016) IOP PublishingJournal of Physics: Conference Series 753 (2016) 082021 doi:10.1088/1742-6596/753/8/082021
6

design of the TLD turns out to be 1.0 tuning ratio and damping screens with the mesh size around 22mm×22mm.
Figure 5 shows the damping effect of the TLD on lateral tower vibrations of the 3MW turbine, for the case of V0=12m/s, I=0.1, tuning ratio=1.0. Figure 5(a) and (b) correspond to the TLD without and with damping screens (mesh size of 22mm×22mm, almost optimal), respectively. For both cases, the tower top displacement q8(t) is significantly suppressed by the TLD, while the inclusion of damping screens further improves the reduction effect. From the Fourier amplitude spectrum of q8(t) (not shown here), a clear peak corresponding to the first lateral tower frequency (2.75rad/s) can be observed due to very low aerodynamic damping in this mode. This peak is effectively suppressed by the damper, and is almost completely eliminated when damping screens are mounted.
Figure 5: Performance of the TLD in 3MW turbine. (a) without damping screens, (b) with damping screens (22mm×22mm)
Table 3: Response reduction of lateral tower vibrations of the 2MW wind turbine by TLDs with different configurations. wind loads damping screens tuning ratio water level and water mass STD reduction peak reduction
V0=12m/s, I=0.08
None 1.0 54.1cm / 621.8kg 40% 34% 0.95 46.7cm / 532.2kg 28% 35%
1.05 64.8cm / 737.9 kg 42% 15%
90mm×90mm 1.0 54.1cm / 621.8kg 43% 37%
75mm×75mm 1.0 54.1cm / 621.8kg 49% 42%
47mm×47mm 1.0 54.1cm / 621.8kg 44% 38%
22mm×22mm 1.0 54.1cm / 621.8kg 52% 48%
0.95 46.7cm / 532.2kg 31% 39%
1.05 64.8cm / 737.9 kg 50% 25%
9.5mm×9.5mm 1.0 54.1cm / 621.8kg 56% 55%
V0=12m/s, I=0.1
None 1.0 54.1cm / 621.8kg 43% 33% 0.95 46.7cm / 532.2kg 29% 37%
1.05 64.8cm / 737.9 kg 37% 10%
90mm×90mm 1.0 54.1cm / 621.8kg 44% 38%
75mm×75mm 1.0 54.1cm / 621.8kg 50% 44%
47mm×47mm 1.0 54.1cm / 621.8kg 46% 41%
22mm×22mm 1.0 54.1cm / 621.8kg 53% 49%
0.95 46.7cm / 532.2kg 33% 41%
1.05 64.8cm / 737.9 kg 50% 27%
9.5mm×9.5mm 1.0 54.1cm / 621.8kg 57% 57%
V0=8m/s, I=0.1
None 1.0 54.1cm / 621.8kg 21% 9% 0.95 46.7cm / 532.2kg 20% 15%
1.05 64.8cm / 737.9 kg 9% 2%
90mm×90mm 1.0 54.1cm / 621.8kg 31% 20%
75mm×75mm 1.0 54.1cm / 621.8kg 34% 17%
47mm×47mm 1.0 54.1cm / 621.8kg 32% 21%
22mm×22mm 1.0 54.1cm / 621.8kg 36% 17%
0.95 46.7cm / 532.2kg 26% 16%
1.05 64.8cm / 737.9 kg 25% 21%
9.5mm×9.5mm 1.0 54.1cm / 621.8kg 41% 19%
The Science of Making Torque from Wind (TORQUE 2016) IOP PublishingJournal of Physics: Conference Series 753 (2016) 082021 doi:10.1088/1742-6596/753/8/082021
7
Next, Table 3 shows the response reduction of lateral tower vibrations of the 2MW turbine by TLDs with different configurations. Comparing with Table 2, slightly different results have been obtained, with the following observations to be highlighted:
(i) The overall damping effect of the TLD is slightly better than the results in Table 2. Since the tower frequency of the 2MW turbine is increased to 3.37rad/s, the mean water level (for tuning the sloshing frequency) and thus the water mass of the TLD are increased accordingly, resulting in larger mass ratio of the damper for the 2MW turbine. Again, the absolute response reduction by the damper is quite diverse for different wind load scenarios.
(ii) For all wind load scenarios, the inclusion of damping screens significantly improves the performance of the TLD, and the best performance is always achieved when mesh size of the attached damping screens is 9.5mm×9.5mm. This implies a need for a larger energy dissipation capacity for the TLD installed in 2MW turbines, since the mass ratio of the damper is increased and larger amount of water is sloshing.
(iii) Similar to the results in Table 2, the optimal tuning ratio for all the considered cases is always 1.0 in terms of the STD reduction. Therefore for the 2MW turbine, the optimal TLD is the one with 1.0 tuning ratio and with the mesh size of 9.5mm×9.5mm.
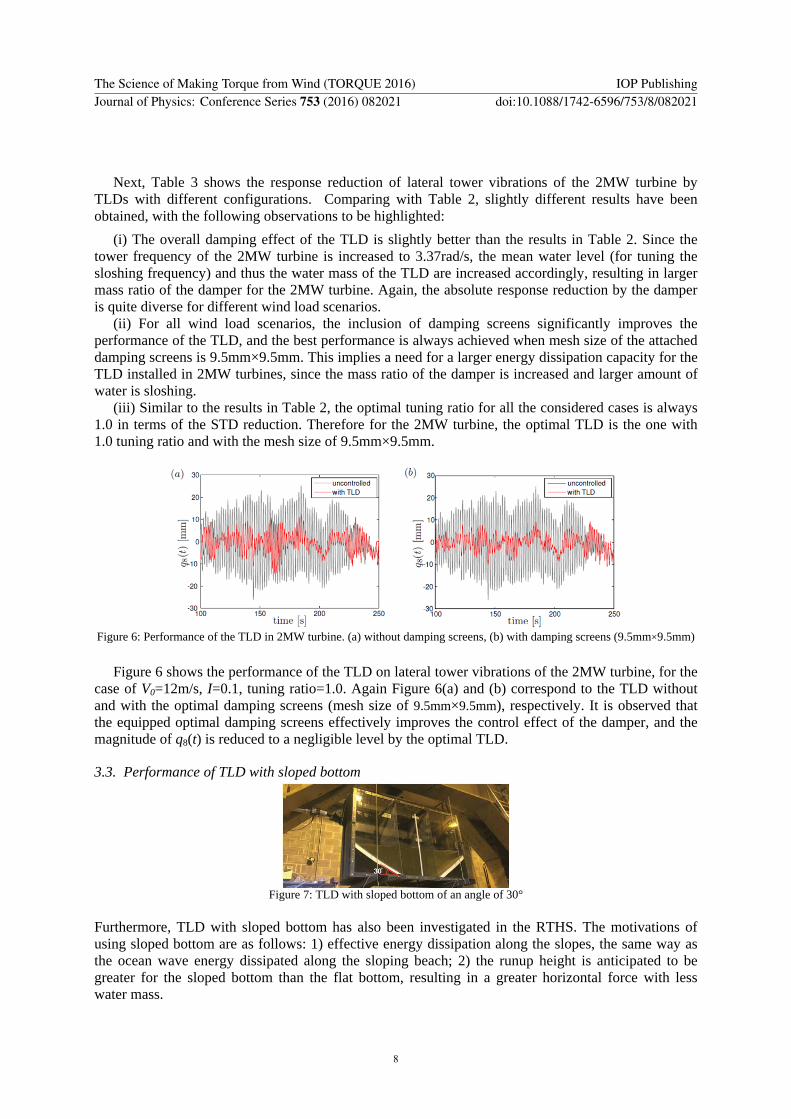
Figure 6: Performance of the TLD in 2MW turbine. (a) without damping screens, (b) with damping screens (9.5mm×9.5mm)
Figure 6 shows the performance of the TLD on lateral tower vibrations of the 2MW turbine, for the
case of V0=12m/s, I=0.1, tuning ratio=1.0. Again Figure 6(a) and (b) correspond to the TLD without and with the optimal damping screens (mesh size of 9.5mm×9.5mm), respectively. It is observed that the equipped optimal damping screens effectively improves the control effect of the damper, and the magnitude of q8(t) is reduced to a negligible level by the optimal TLD.
3.3. Performance of TLD with sloped bottom
Figure 7: TLD with sloped bottom of an angle of 30°
Furthermore, TLD with sloped bottom has also been investigated in the RTHS. The motivations of using sloped bottom are as follows: 1) effective energy dissipation along the slopes, the same way as the ocean wave energy dissipated along the sloping beach; 2) the runup height is anticipated to be greater for the sloped bottom than the flat bottom, resulting in a greater horizontal force with less water mass.
The Science of Making Torque from Wind (TORQUE 2016) IOP PublishingJournal of Physics: Conference Series 753 (2016) 082021 doi:10.1088/1742-6596/753/8/082021
8

In this study, the sloped bottom was achieved by fastening two foam boards with an angle of 30° to the horizontal plane. The projected length of each foam board on the horizontal bottom is 0.65m, leaving the remaining horizontal length to be 0.63m in the middle. No other cases with different slopes were examined.
Table 4: Comparison of TLDs with flat bottom and sloped bottom, 3MW wind turbine.
wind loads bottom type damping screens water level water mass 1st sloshing freq STD reduction
V0=12m/s, I=0.08
Flat None 31.6 cm 360.3 kg 2.75 rad/s 32% 22mm×22mm 31.6 cm 360.3 kg 2.75 rad/s 46%
Sloped None 41.0 cm 323.4 kg 2.77 rad/s 34% None 40.0 cm 312.0 kg 2.73 rad/s 38% None 39.0 cm 300.6 kg 2.70 rad/s 42%
Sloped
22mm×22mm 41.0 cm 323.4 kg 2.77 rad/s 41% 22mm×22mm 40.0 cm 312.0 kg 2.73 rad/s 45% 22mm×22mm 39.0 cm 300.6 kg 2.70 rad/s 47%
V0=12m/s, I=0.1
Flat None 31.6 cm 360.3 kg 2.75 rad/s 33% 22mm×22mm 31.6 cm 360.3 kg 2.75 rad/s 44%
Sloped None 41.0 cm 323.4 kg 2.77 rad/s 31%
None 40.0 cm 312.0 kg 2.73 rad/s 36%
None 39.0 cm 300.6 kg 2.70 rad/s 40%
Sloped 22mm×22mm 41.0 cm 323.4 kg 2.77 rad/s 39%
22mm×22mm 40.0 cm 312.0 kg 2.73 rad/s 43%
22mm×22mm 39.0 cm 300.6 kg 2.70 rad/s 45%
V0=8m/s, I=0.1
Flat None 31.6 cm 360.3 kg 2.75 rad/s 12% 22mm×22mm 31.6 cm 360.3 kg 2.75 rad/s 37%
Sloped None 41.0 cm 323.4 kg 2.77 rad/s 18%
None 40.0 cm 312.0 kg 2.73 rad/s 23%
None 39.0 cm 300.6 kg 2.70 rad/s 28%
Sloped 22mm×22mm 41.0 cm 323.4 kg 2.77 rad/s 32%
22mm×22mm 40.0 cm 312.0 kg 2.73 rad/s 36%
22mm×22mm 39.0 cm 300.6 kg 2.70 rad/s 37%
Table 4 shows the comparison of the performance of TLDs with sloped bottom and with flat
bottom, for the 3MW turbine. The mesh size of damping screens was chosen to be 22mm×22mm. Three different mean water levels have been considered for the sloped-bottom TLD, and the 1st sloshing frequency in each case has been identified from the measured time history of the water surface elevation during free vibration tests (due to the lack of analytical models). From Table 4, the following observations are to be highlighted:
(i) For all wind load scenarios, the sloped-bottom TLD performs better than its flat-bottom counterpart, even though the water mass is less. This leads to a more effective but lighter damper, which is quite favourable in terms of installation and maintenance.
(ii) Similar with the results in Tables 2 and 3, the inclusion of damping screens improves the performance of the sloped-bottom TLD. Therefore for TLD with any configurations, it is always favourable to have flow restriction devices (such as the damping screens) installed.
(iii) The optimal tuning of the sloped-bottom TLD in the present study is achieved when the 1st sloshing frequency is 2.70rad/s (tuning ratio=0.982) corresponding to the water level of 39.0cm and water mass of 300.6kg (much less amount of water than all the other cases). However due to the lack of analytical models for the sloped-bottom TLD, more extensive parametric studies need to be carried out in the future for the optimal design.
4. Conclusions In this paper, RTHS technique has been applied for performance evaluation of a full-scale TLD in damping lateral tower vibrations of multi-megawatt wind turbines. A numerical substructure (the 13-DOF aeroelastic wind turbine model) and a physical substructure (the full-scale TLD) are
The Science of Making Torque from Wind (TORQUE 2016) IOP PublishingJournal of Physics: Conference Series 753 (2016) 082021 doi:10.1088/1742-6596/753/8/082021
9
synchronized with each other by real-time controllers. Extensive parametric studies have been carried out on the TLD, and various turbulent wind conditions have been considered. It is observed that the TLD is very effective in suppressing the lightly damped lateral tower vibrations for both the 3MW and 2MW turbines. The inclusion of damping screens always improves the performance of the damper, and the optimal mesh size of the damping screen is 22mm×22mm for the 3MW turbine and 9.5mm×9.5mm for the 2MW turbine. Further, it is interesting to see that by using sloped bottom, a more effective TLD is obtained with less amount of water comparing with its flat- bottom counterpart. More extensive parametric studies need to be carried out on the sloped-bottom TLD for a deeper understanding and a better design.
In the RTHS, different environmental conditions (combined wind, wave and current) can be simulated as accurate as possible in the computer together with the numerical model of the structural, while certain crucial part of the structure (of great importance and interest) or the extra vibration control device is constructed in full-scale and tested as the physical substructure. Therefore, it has huge potential to apply RTHS in the area of wind energy, e.g., new control devices for wind turbines, soil-structure interaction of the foundation and fatigue evaluation of the joints in support structures of offshore wind turbines.
References [1] Krenk S, Svendsen M N and Høgsberg J 2012 Resonant vibration control of three-bladed wind
turbine rotors AIAA J. 50 148-161 [2] Staino A, Basu B and Nielsen S R K 2012 Actuator control of edgewise vibrations in wind
turbine blades J. Sound Vibr. 331 1233-1256 [3] Zhang Z, Li J, Nielsen S R K and Basu B 2014 Mitigation of edgewise vibrations in wind
turbine blades by means of roller dampers J. Sound Vibr. 333 5283-5298 [4] Fujii K, Tamura Y, Sato T and Wakahara T 1990 Wind-induced vibration of tower and practical
applications of tuned sloshing damper J. Wind Eng. Ind. Aerodyn. 33 263-272 [5] Zhang Z, Nielsen S R K, Basu B and Li J 2015 Nonlinear modeling of tuned liquid dampers
(TLDs) in rotating wind turbine blades for damping edgewise vibrations J. Fluids Struct. 59 252-269
[6] Nakashima M and Kato H 1992 Development of real-time pseudo dynamic testing Earthq. Eng. Struct. Dyn. 21 79-92
[7] Horiuchi T, Inoue M, Konno T and Namita Y 1999 Real-time hybrid experimental system with actuator delay compensation and its application to a piping system with energy absorber Earthq. Eng. Struct. Dyn. 28 1121-1141
[8] Nkashima M and Masaoka N 1999 Real-time on-line test for MDOF systems. Eng. Struct. Dyn. 28 393-420
[9] Zhang Z, Nielsen S R K, Blaabjerg F and Zhou D 2014 Dynamics and control of lateral tower vibrations in offshore wind turbines by means of active generator torque. Energies 7 7746-7772
[10] Batchelor GK 1953 The theory of Homogeneous Turbulence. Cambridge University Press [11] Jonkman J, Butterfield S, Musial W and Scott G 2009 Definition of 5-MW reference wind
turbine for offshore system develpment. National Renewable Energy Laboratory, Technical Report, NREL/TP-500-38060, Golden, Colorado
The Science of Making Torque from Wind (TORQUE 2016) IOP PublishingJournal of Physics: Conference Series 753 (2016) 082021 doi:10.1088/1742-6596/753/8/082021
10