aalborg universitet distribution and orientation of steel fibres in
TRANSCRIPT

Aalborg Universitet
Distribution and Orientation of Steel Fibres in UHPFRC
Nezhentseva, Anastasia; Sørensen, Eigil Verner; Andersen, Lars Vabbersgaard; Schuler,Frank
Publication date:2013
Document VersionPublisher's PDF, also known as Version of record
Link to publication from Aalborg University
Citation for published version (APA):Nezhentseva, A., Sørensen, E. V., Andersen, L. V., & Schuler, F. (2013). Distribution and Orientation of SteelFibres in UHPFRC. Aalborg: Department of Civil Engineering, Aalborg University. DCE Technical Reports, No.151
General rightsCopyright and moral rights for the publications made accessible in the public portal are retained by the authors and/or other copyright ownersand it is a condition of accessing publications that users recognise and abide by the legal requirements associated with these rights.
? Users may download and print one copy of any publication from the public portal for the purpose of private study or research. ? You may not further distribute the material or use it for any profit-making activity or commercial gain ? You may freely distribute the URL identifying the publication in the public portal ?
Take down policyIf you believe that this document breaches copyright please contact us at [email protected] providing details, and we will remove access tothe work immediately and investigate your claim.
Downloaded from vbn.aau.dk on: februar 12, 2018

ISSN 1901-726X
DCE Technical Report No. 151
Distribution and Orientation
of Steel Fibres in UHPFRC
Anastasia Nezhentseva
Eigil V. Sørensen
Lars V. Andersen
Frank Schuler*
* University of Kaiserslautern, Germany
Institute of concrete structures and structural engineering

DCE Technical Report No. 151
Distribution and Orientation
of Steel Fibres in UHPFRC
by
Anastasia Nezhentseva
Eigil V. Sørensen
Lars V. Andersen
Frank Schuler
April 2013
© Aalborg University
Aalborg University Department of Civil Engineering
Division for Structures, Materials and Geotechnics

Scientific Publications at the Department of Civil Engineering
Technical Reports are published for timely dissemination of research results and scientific work
carried out at the Department of Civil Engineering (DCE) at Aalborg University. This medium
allows publication of more detailed explanations and results than typically allowed in scientific
journals.
Technical Memoranda are produced to enable the preliminary dissemination of scientific work by
the personnel of the DCE where such release is deemed to be appropriate. Documents of this kind
may be incomplete or temporary versions of papers—or part of continuing work. This should be
kept in mind when references are given to publications of this kind.
Contract Reports are produced to report scientific work carried out under contract. Publications of
this kind contain confidential matter and are reserved for the sponsors and the DCE. Therefore,
Contract Reports are generally not available for public circulation.
Lecture Notes contain material produced by the lecturers at the DCE for educational purposes. This
may be scientific notes, lecture books, example problems or manuals for laboratory work, or
computer programs developed at the DCE.
Theses are monograms or collections of papers published to report the scientific work carried out at
the DCE to obtain a degree as either PhD or Doctor of Technology. The thesis is publicly available
after the defence of the degree.
Latest News is published to enable rapid communication of information about scientific work
carried out at the DCE. This includes the status of research projects, developments in the
laboratories, information about collaborative work and recent research results.
Published 2013 by
Aalborg University
Department of Civil Engineering
Sohngaardsholmsvej 57,
DK-9000 Aalborg, Denmark
Printed in Aalborg at Aalborg University
ISSN 1901-726X
DCE Technical Report No. 151

PREFACE
The technical report “Distribution and Orientation of Steel Fibres in UHPFRC” is a part of a larger
research project entitled “Design of Transition Pieces for Bucket Foundations for Offshore Wind
Turbines”. This report is divided into five numbered sections, and a list of references, situated after
the last section.
The work within this report has only been possible with highly appreciated support and
collaboration with Contec ApS, Technical University of Kaiserslautern and Fraunhofer ITWM,
Kaiserslautern, Germany. We would personally like to acknowledge Mr. Bo Serwin from Contec
ApS for supplying the CRC® material for testing, Mr. Franz Schreiber from Fraunhofer ITWM,
Kaiserslautern, Germany, for his highly appreciated help with performing Computed Tomography
(CT) scanning and analysis of the concrete samples, Mr. Frank Schuler and Dr. Jürgen Schnell,
from Technical University of Kaiserslautern, Germany, for their consultative and advisory role to
this report. Their contribution to this work is sincerely acknowledged.
Aalborg, April 11, 2013 Anastasia Nezhentseva, Eigil V. Sørensen, Lars V. Andersen
Contents
PREFACE
1. INTRODUCTION ..................................................................................................................................... 1
1.1 Background ........................................................................................................................................ 1
1.2 Research problem formulation .......................................................................................................... 2
1.3 Focus and objectives of the current research ..................................................................................... 4
2. HPC, UHPC and UHPFRC: MATERIAL PROPERTIES ........................................................................ 4
2.1 The matrix material: HPC and UHPC ............................................................................................... 4
2.2 The matrix material: UHPFRC .......................................................................................................... 7
2.3 Uniaxial tensile response of UHPFRC ............................................................................................ 10
3. UHPFRC SPECIMEN PREPARATION ................................................................................................ 13
3.1 Matrix material, mixing and casting ................................................................................................ 13
3.2 Mixing and casting of UHPFRC specimens for fibre orientation analysis ...................................... 19
3.3 Specimen types for CT-scanning ..................................................................................................... 21
4. CT SCANNING ...................................................................................................................................... 25
4.1 Results ............................................................................................................................................. 25
4.2 Computed Tomography (CT) .......................................................................................................... 26
4.3 Fibre distribution ............................................................................................................................. 30
4.4 Cracks and air voids ........................................................................................................................ 34
5. CONCLUSION ....................................................................................................................................... 39
References ....................................................................................................................................................... 41
1
1. INTRODUCTION
1.1 Background
Lately, the suction caisson (bucket) foundation has been introduced as the new technology for
offshore wind turbine foundations. This concept, which is a hybrid of a monopile and a gravity-
based foundation, is believed to be an economically attractive environmentally-friendly alternative
to offshore wind turbines foundations used nowadays primarily in shallow waters. The bucket
foundation has been widely used for installation of anchors in the offshore oil and gas industry in
the North Sea for more than 30 years. However, the loading on the bucket foundations used for
offshore wind turbines is more complex and will dramatically differ from the loading conditions
(wave and current loading) observed on suction caisson foundations employed in oil and gas
industry which are primarily subjected to compression−tension.
New generation of offshore wind turbines (with 6−7 MW already under consideration) will
require taller and larger support structures. Consequently, exceptional structural strength and
stiffness will be required for these structures in order to carry additional weight of the wind turbine,
as well as to resist higher wind and wave forces acting on deeper water depths. In order to provide
these characteristics, larger cross sectional diameters of the support structures will also become
essential. This can, however, create difficulties with transportation of the wind turbine elements
using public transportation system currently limited to transporting units of ~4.5 m in diameter [1]
as well as lifting during installation. Development of segmented structural elements can help to
solve both problems; however, it will create additional challenges at the joints between the
individual segments. This together with other positive features discussed further can contribute to
making concrete a competitive material for the production of the structural elements for offshore
wind turbines. Concrete has many advantages such as high performance, low maintenance, high
fatigue resistance and dynamic performance, low environmental impact, configuration, construction
and mix design flexibility, as well as cost-competiveness [1]. Additionally, complex or curved
concrete elements can be cast in-situ which can be an effective solution. Moreover, according to the
specific strength requirements and application, the properties of concrete can be easily adjusted and
utilized better (compared to e.g. steel) from normal structural grade to very high performance grade
by using conventional concrete (plain, reinforced or prestressed), High Performance Concrete
(HPC), Ultra-High-Performance Concrete (UHPC) or Ultra-High-Performance Fibre-Reinforced
Concrete (UHPFRC).
The main challenge for the offshore concrete structures is the corrosive external
environment due to seawater. Generally, lack of norms and internationally accepted standards for
design of the structures made of special types of HPCs limits application of these materials for wind

2
turbine structures. Until now, concrete has already been used in the production of the following
structures for onshore and offshore wind turbines: wind turbine foundations (on-shore, offshore
gravity based foundations and pile caps (a large concrete block with heads of the piles cast into it)
[1−3]), wind turbine towers made of prefabricated or cast in-situ reinforced, prestressed (onshore)
[1,2] or UHPFRC (offshore) concrete elements [4], as well as high-strength grouted connections of
monopile foundations [5]. An overview of international standards and guidelines as well as current
design of concrete support structures for offshore wind turbines is discussed and presented, among
others, by Klose [6]. As a conclusion, making project specific considerations and using engineering
judgment, knowledge and experience was suggested while combination of standards should be
avoided [6]. Moreover, dense concrete cover is normally required in order to protect the
reinforcement steel against corrosion. For the bucket (caisson) foundations a special examination
should be made of its floating stability during transportation and safety against uplift during
installation at the construction site [6]. Comparison of the steel and concrete wind turbine towers for
onshore and offshore applications is presented in [1,2].
1.2 Research problem formulation
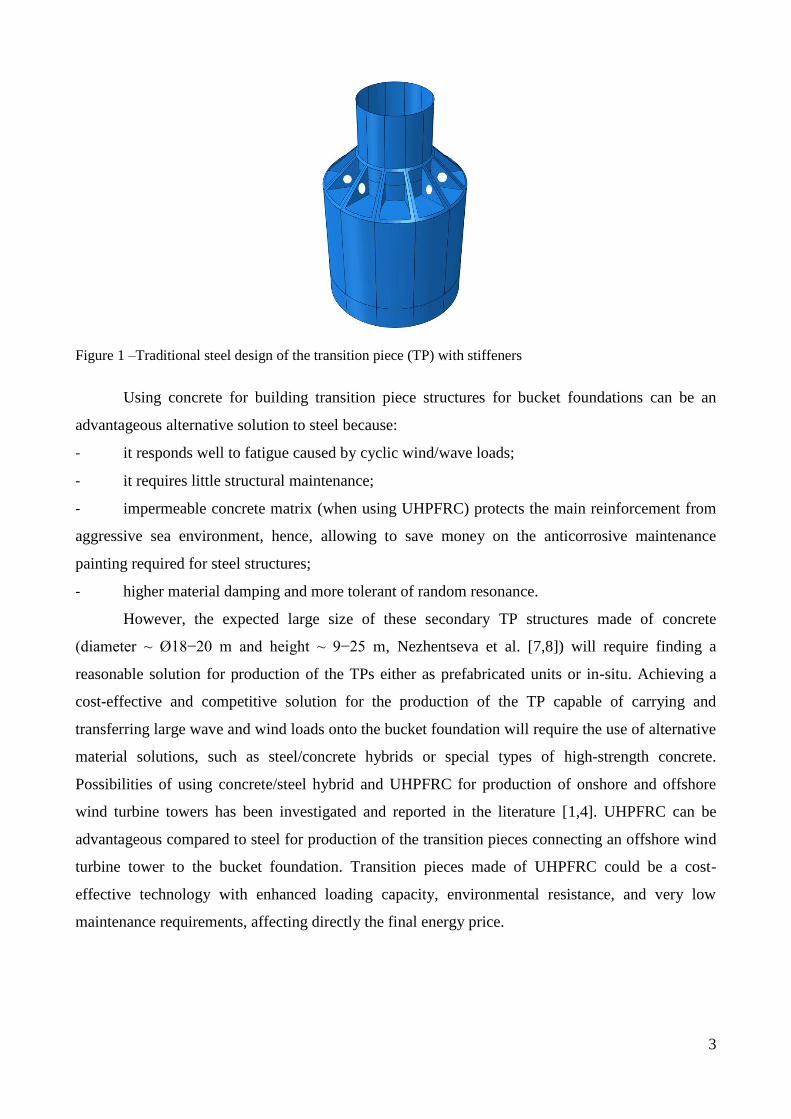
The focus of the current project is on the design of the structural element called “transition piece”
(TP), connecting the offshore wind turbine tower to the bucket foundation. Transition piece
structures for bucket foundations are currently made of triangular steel flange-reinforced shear
panels (stiffeners or bracings) with flanges on top and sometimes with cutaways (circular holes) in
the middle (for saving some extra material) as shown in Figure 1. These stiffeners are radially
positioned and welded to the bucket lid. This solution is, however, believed to have several
shortcomings. Production and corrosion protection of the steel TPs is rather expensive, labour-
intensive and time-consuming due to the complex geometries and multiple welded connections.
Moreover, when exposed to cyclic loading produced by the combined action of wind and waves,
fatigue may occur at the welded joints of the TP.
3
Figure 1 –Traditional steel design of the transition piece (TP) with stiffeners
Using concrete for building transition piece structures for bucket foundations can be an
advantageous alternative solution to steel because:
- it responds well to fatigue caused by cyclic wind/wave loads;
- it requires little structural maintenance;
- impermeable concrete matrix (when using UHPFRC) protects the main reinforcement from
aggressive sea environment, hence, allowing to save money on the anticorrosive maintenance
painting required for steel structures;
- higher material damping and more tolerant of random resonance.
However, the expected large size of these secondary TP structures made of concrete
(diameter ~ Ø18−20 m and height ~ 9−25 m, Nezhentseva et al. [7,8]) will require finding a
reasonable solution for production of the TPs either as prefabricated units or in-situ. Achieving a
cost-effective and competitive solution for the production of the TP capable of carrying and
transferring large wave and wind loads onto the bucket foundation will require the use of alternative
material solutions, such as steel/concrete hybrids or special types of high-strength concrete.
Possibilities of using concrete/steel hybrid and UHPFRC for production of onshore and offshore
wind turbine towers has been investigated and reported in the literature [1,4]. UHPFRC can be
advantageous compared to steel for production of the transition pieces connecting an offshore wind
turbine tower to the bucket foundation. Transition pieces made of UHPFRC could be a cost-
effective technology with enhanced loading capacity, environmental resistance, and very low
maintenance requirements, affecting directly the final energy price.

4
1.3 Focus and objectives of the current research
When casting TPs in-situ, providing efficient vibration could be challenging. Therefore, it would be
preferable to find a material with a good workability which can be cast without vibration. This will
result in a solution with a high paste volume and relatively high autogenous shrinkage leading to
fine cracks along the rebar negatively affecting load carrying capacity and durability. Avoiding
these problems requires certain features of the UHPFRC material, i.e. providing a good bond
between matrix and rebar for the load carrying system to work, and avoiding the surface cracks,
which have been studied and documented in the present report. Moreover, a TP structure must
transfer large stresses from the wind tower to the bucket foundation. Thus, the following UHPFRC
properties are of special importance to the TP structures:
1) mix design vs. workability (to achieve a self-compacting material);
2) fibre distribution (homogeneity);
3) fibre orientation (minimize microcrack width for sufficient stress transfer between
matrix and rebars, and for sufficient durability);
4) fibre type;
5) casting procedure.
The objective of the present study is to investigate workability and compressive strength of
UHPFRC, to inspect the cracks using destructive testing method and visual observation, to study
fibre distribution, concentration, orientation and presence of voids/cracks using a non-destructive
technique − X-ray Computed Tomography (CT).
2. HPC, UHPC and UHPFRC: MATERIAL PROPERTIES
2.1 The matrix material: HPC and UHPC
Production of the taller, larger in diameter and more slender structural elements (towers, transition
pieces, foundations) for the upcoming generations of the offshore wind turbines requires such
material properties as high strength, durability, low maintenance, fatigue resistance, avoidance of
resonance problems and resistance to the aggressive environmental impacts. In this respect,
concrete has shown a promising potential and numerous benefits as a high performance structural
material to be used offshore. Owing the exceptional challenging aggressive environmental
conditions existing offshore and extra loads from combined wind, wave and current action, careful
consideration should be given to alternative concrete mix designs that will have the above
mentioned properties and that will be competitive with materials currently used for offshore
structural elements.
5
Unreinforced concrete material is a complex non-homogeneous (i.e. heterogeneous)
structure consisting of different phases (solid−cement paste plus aggregates, water and air filled
voids or pores), all having various mechanical properties. However, in conventional structural
design non-homogeneous microstructure of concrete is normally disregarded and considered
continuous. When compression load is applied, differences in the mechanical properties of the
aggregates and the cement paste material contribute to appearance of stress concentration, resulting
further in formation of multiple microcracks in the interfacial transition zone (ITZ) between the
hardened cement paste and the aggregate. When subjected to loading independently, cement paste
and aggregates will demonstrate so-called brittle elastic behaviour, i.e. linear deformation followed
by a sudden failure. Quite the opposite, concrete as a composite material will show a quasi-ductile
behaviour characterized by increase of the load bearing capacity of the material beyond the linear
elastic stage, primarily owing to microcracking phenomenon in the ITZ. In their study, Richard &
Cheyrezy [9] have shown that the size of the microcracks is directly proportional to the diameter of
aggregates.
High Performance Concrete (HPC) is a series of specialized concretes made of high-quality
ingredients according to an optimized mixture design using a low ratio of water to cementitious
material, leading to a higher strength compared to conventional concrete, i.e. a design compressive
strength at 28 days of 70 MPa and higher [10]. The strength of the aggregates utilized in HPC is an
essential factor affecting the final strength of a high-strength concrete. Moreover, adequate bond
between the aggregates and the paste is also important. Using rougher angular crushed-stone
aggregates rather than smooth and rounded gravel aggregates of the same size has been shown to
provide a better adhesion between the paste and the aggregates, thus, resulting in higher
compressive strength of HPC [10]. Furthermore, the optimum strength of high-strength concretes
has been achieved at nominal maximum-size aggregates of 9.5−12.5 mm [10].
Compared to conventional concrete, HPCs have several advantages such as: high
workability, high early strength, high ultimate strength, low permeability, chemical, freeze/thaw and
abrasion resistance, high durability in severe environments, volume stability, compaction without
segregation, reduced maintenance, inhibition of bacterial and mold growth, and extended life cycle.
The main materials used in HPC include, see e.g. [10]:
1) Cement/cementing materials: Portland cement, fly ash, slag, and possibly silica fume;
2) Optimal graded aggregates − to improve workability;
3) Admixtures: superplasticizers (High-Range Water-Reducing Admixtures, synthetic
surface active agents) − for extra flowability and for reducing the water/binder (W/B)
ratio.
6
Like conventional concrete, HPC exhibits tensile strengths (~ 5 MPa, see e.g. [11]) which
are only a small fraction of the compressive strengths, and, consequently, reinforcing steel bars
(rebar) must be placed in the tensile zone of the HPC structural members. Normally, HPC has lower
porosity, oxygen permeability, as well as a low W/B ratio of 0.20−0.35 by mass [10] than
conventional concrete. Lower W/B ratio helps to avoid bleeding in HPC, whereas adding
superplasticizers making the HPC mixture more fluid and increasing its workability contributes to a
dense packing of the cement particles. However, some segregation can be observed in some HPC
mixtures typically caused by excessive amounts of superplasticizers. For most HPC applications
adequate workability is provided with a slump of ~200 mm [10,12] with majority of HPCs placed at
slumps of 180−220 mm with some vibration applied [10].
Adding ultra-fine particles of silica fume (microsilica powder) to a concrete mixture can
help to achieve a very dense packing of the particles in the binder phase resulting in a very high
compared to HPC compressive strength ( ≥ 150 MPa, [13−15]). This new concrete material having
also a more outstanding durability that HPC was called Ultra High Performance Concrete (UHPC).
UHPC has normally a low W/B ratio of 0.18−0.25 [10]. Typically, smaller and stronger aggregates
are used in UHPC compared to HPC, with the maximum aggregate size of ≤ 7 mm [15,16], or even
sometimes ≤ 2,5 mm according to the Japanese recommendations [14], which can considerably
decrease the size of microcracks forming in the ITZ when the load is applied [9]. Moreover, UHPC
is a more homogeneous material due to the smaller difference between the stiffness of the
aggregates and the cement paste.
A cement-based UHPC material called DSP (“Densified Systems containing
homogeneously arranged, ultra-fine Particles”) developed in 1978 by H.H. Bache and his
colleagues at Aalborg Portland, Denmark, has even a smaller water/cement + fine powder ratio of
0.12−0.18 by weight [17]. This UHPC made with ordinary natural aggregates (quartz sand ~
0,1−1,5 mm and crushed granite of ~2−5 mm) has a compressive strength of 120−160 MPa or even
up to 180−200 MPa, when utilizing exceptionally strong natural aggregates (see e.g. Bache, [18]).
Reaching even higher compressive strengths (typically in the range of 220−270 MPa, [18]) is
possible using stronger aggregates, such as e.g. calcined bauxite. Tensile strength of the UHPC lies
within ~6 MPa [11]. However, UHPC has a very brittle behavior which is generally unacceptable in
structures. In order to avoid this problem, various types of reinforcement in the form of fibres, bars
and wires can be incorporated in the UHPC matrix. This will assure high fracture energy absorption
and, as a result, greater ductility of the structural members.

7
2.2 The matrix material: UHPFRC
In order to fully utilize the high compressive strength of HPC – and UHPC – a large amount of steel
is required in the tensile zone of a structural member. This may lead to small distances between
neighbouring reinforcing bars, and to cracking and spalling of the brittle UHPC material in the
tensile zone during loading of the member. To avoid that situation to occur the mortar fraction of
the UHPC may be reinforced by addition of steel fibres which drastically increases the ductility of
the material – which is then termed Ultra High-Performance Fibre-Reinforced Concrete (UHPFRC).
Having an insufficient structural ductility, large unreinforced UHPFRC can demonstrate a brittle
behaviour characterized by appearance of local cracks and sudden failure. Solution to this problem
is adding a higher dosage of fibres as well additional main reinforcement (conventional or high-
strength) to the section. This has been implemented, for instance, in a Compact Reinforced
Composite (CRC®), also called “The New Concrete”, invented by Bache at the Cement and
Concrete Laboratory of Aalborg Portland A/S in 1986 [17−19] and subsequently produced by Hi-
Con A/S. Different other types of UHPFRC currently presented on the market are described in
details by, e.g. Spasojević [15].
Advantages of UHPFRC matrix material and reinforced UHPFRCs:
- provides higher compressive and tensile strength, durability, and increased tensile ductility
(fibre dependent) compared to UHPC;
- allows utilization of 5−10 times more main reinforcement (compared to conventional
concrete), thus, resulting in much stronger structures;
- minimization of the overall wall thickness due to small cover thickness (5–15 mm vs.
50 mm for the conventional concrete) and dense arrangement of the rebar in order to provide
the necessary degree of reinforcement for the loads in question;
- has a low chloride permeability due to highly dense microstructure with possible “clogging”
effect over time;
- initially expensive formwork can be reused over long production of structural elements,
therefore, giving lower costs per unit.
Until now, UHPFRC has been primarily used for production of slender structures (balcony
slabs, staircases, walkways), pavements, industrial floors, cargo ships [20,21], architectural concrete
and slabs-on-grade, in-situ cast joints between prefabricated structures, and strengthening steel
bridges with strong, ductile steel−UHPFRC hybrid constructions [22]. In the onshore and offshore
wind industry ultra-high performance grouting mortars (e.g. Ducorit® [23] and
MASTERFLOW®9500 [24−36]) have been applied for grouted connections between transition
pieces and monopiles, tripiles, tripods and jacket foundations resulting in high bearing capacity and

8
very good corrosion protection. Prefabricated UHPFRC structures can be joined in-situ with the so-
called CRC® JointCast which, compared to conventional joints, has a smaller joint width and an
anchorage length of ~5−10 times the diameter of the reinforcement bars [5]. This technology can be
used for joining prefabricated elements made of UHPFRC, conventional concrete, as well as steel.
The above mentioned outstanding material properties of the reinforced UHPFRCs are of
special importance to the offshore TP structures for bucket foundations. Therefore, the following
concerns related to the production of the TPs made of UHPFRC are being addressed in the present
project:
- Fabrication: providing adequate workability of the mixture;
- Transfer of (large) stresses in the structure: fiber distribution (to provide homogeneity) and
fibre orientation (to minimize microcrack width for sufficient stress transfer between the
matrix and the rebar, and for adequate durability).
Different types of binders can be used in UHPFRCs, such as Densit® (invented by Bache in
1978, [17−19] and further utilized in steel rebar reinforced CRC®), BSI-Ceracem© by Sika-Eiffage
[28] and Ductal® by Lafarge and Bouygues [29−31], among others. In general, the binder has lower
effect on the compressive strength of UHPFRC compared to the type, size, composition and quality
of the aggregates, as well as adding additional fibres. According to Contec ApS, a supplier of
Secutec 6 binder for UHPFRC, using bauxite as an aggregate allows to reach a compressive
strength of 180-240 MPa depending on the water content, compaction, amount and type of fibres
etc.
Generally, enhancement of the strength and durability of UHPFRC can be partially
explained by the greater homogeneity of its matrix material microstructure compared to
conventional and high-strength concretes. A further insight into the composition and the material
properties of UHPFRC is given on the example of CRC® composite material with high
concentration af main steel reinforcement, based on the Densit® matrix material [17−19]. An
extremely ductile CRC® has a high potential to be used in structures with large dimensions (with
spans of 500−1000 meter) exposed to strong compressive and tensile forces (see, e.g. [22]). The
higher packing density of Densit® binder particles (e.g. cement and microsilica) compared to a
conventional concrete binder (70−75 vs. 30−50 % per vol., see Bache [18]) provides a much
stronger fixation of the fibres, which, together with a higher percentage per volume of main
reinforcement and fibres in the CRC®, leads to a different mechanism of fracture behaviour. When
subjected to tension, a local fracture zone with large visible cracks will appear in the tension zone of
the element made of conventional concrete. However, a global fracture zone with small multiple
microcracks propagating throughout the element will be observed in CRC® with no visible cracks

9
in the tension side [22]. Moreover, tests on CRC® panels performed with grenade explosives
showed that structures made of CRC® can well resist very heavy impact loads, e.g. earthquakes.
CRC® matrix has typically a water/binder (W/B) ratio of 0.13−0.18 and a large content of
microsilica (see, e.g. [32]). Lower W/B ratio in the CRC® matrix means that there is a large
number of unhydrated cement particles which will react with the water in cracks, thereby, helping
to heal them [32]. Moreover, the CRC® matrix is very dense with a low porosity of ~ 1.5 % and
capillary porosity of ~ 0.2 %, and extremely low permeability [33]. The results of tests performed
on loaded beams in salt water showed that the rate of chloride penetration decreased over time due
to a “clogging” effect. No corrosion was observed even when adding salt in the mixing water
because of the lack of capillary porosity limiting transportation of oxygen and water [33].
Furthermore, closing and filling up of the cracks with hydration products was observed after
exposing the beams preloaded up to yielding with noticeable cracks to salty water environment. The
unhydrated cement particles reacted with the water entering the crack and protected it from rebar
corrosion. This phenomenon was confirmed after 3−4 years of exposure and various testing
conditions at Force Institutterne in Denmark and Instituto Eduardo Torroja in Spain [33].
CRC® matrix combines large contents of 0,15×6 mm or 0,4×12,5 mm steel fibres (typically
2−6 vol. %) and closely spaced main reinforcement made of high strength steel, traditional rebar,
carbon etc. (5−20 %). Adding fibres to concrete can increase its tensile strength, decrease micro
cracks, and help to control cracking caused by drying (or autogeneous) shrinkage. Normally, the
CRC® matrix contains aggregates with a diameter up to 1/3 of the space between the main
reinforcement. A cover layer of 10−15 mm and a comparable distance between individual rebar are
used in CRC®. Compared to conventional concrete, 2−5 times more reinforcement can be utilized
in CRC® [18]. In this respect, structures made of CRC® will have mechanical properties
comparable to steel structures, but weigh only about a half [22]. Moreover, such typical problems
affecting durability of the steel structures such as corrosion and fatigue are not of concern for
structures made of CRC®. Material properties of the UHPFRC Densit® matrix and the heavily
reinforced CRC® are summarized in Table 1.

10
Table 1 – Properties of UHPFRC Densit® matrix material and reinforced CRC® developed by Bache et al.
at Aalborg Portland, Denmark (adapted and translated from Table 1.1, see Bache [18]))
UHPFRC
concrete/matrix material (Densit®) CRC®
0 − 2% fibres 4 – 12% fibres
Compressive strength, MPa
Tensile strength, MPa
Flexural strength, MPa
Shear strength, MPa
120−270
6−15
160−400
10−30
160−400
100−300
100−400
15−150
Density, kg/m3 2500-2800 2600−3200 3000−4000
E-modulus, GPa 60−100 60−110
2.3 Uniaxial tensile response of UHPFRC
As mentioned previously, steel fibres increase fracture energy and ductility, compressive and tensile
strength while reducing the tendency for cracking. Adding 2 % steel fibres by vol. will provide
satisfactory increase in the tensile strength of the UHPFRC matrix, as reported by Markovic [34].
Large contents of fibres might, however, have a negative effect on workability and homogeneity of
the mix. In general, adding steel fibres to UHPC matrix will results in a tensile behaviour which can
be divided into three main stages and shown in Figure 2 (see e.g. Spasojević [15], Li and Fischer
[35]):
1) Linear-elastic response – This stage takes place until the point when the stress level
in the UHPFRC matrix corresponds to the matrix tensile strength and a first microcrack appears.
2) Pseudo strain hardening – During this stage no real plastic microstructural changes
happen, therefore, it is also called “pseudo plastic”. On the contrary, deformations continue to
increase intensely as a result of formation of the numerous tiny cracks (or microcracks ~ 1 µm,
[15]) in the matrix, whereas the uniaxial tensile stress does not change a lot, or increases
considerably slower compared to the linear-elastic stage. The process of multiple microcracking
with uniformly distributed openings tied together by fibres in UHPFRC is similar to strain
hardening or plastic behaviour, thereby, giving the name to this stage. The stage continues until the
maximum deformation is achieved (normally ~ 2–3 ‰, depending on the fibre content and
properties [15]). Macrocracks can also start to develop during this stage.
3) Strain softening – this stage starts when one of the sections of the matrix (the
weakest) fails to transfer the average stress of the same intensity, meaning that the strain hardening
capacity of UHPFRC matrix is reached. During this stage local deformations in the weakest section

11
occur, leading to macrocracks, along with general decrease of the stresses and deformations taking
place in other parts of the matrix. Moreover, the macrocracks will start opening governed by the
fibre action. This will lead eventually to reaching the deformation capacity, normally addressed as
half the length of the longest fibre [15].
In the FEM analysis performed in ABAQUS by Nezhentseva et al. [7,8] the behaviour of the
CRC® matrix material was modelled separately for the Densit® matrix and the steel reinforcement
bars using the Damaged Plasticity Model [36]. This was performed in order to model more
accurately the development of stresses and strains in various parts of this composite material. The
distribution and orientation of steel fibres in the CRC® matrix was modelled uniform in all
directions, i.e. isotropic. Due to the lack of information available on the tensile behaviour of the
CRC® matrix, tensile properties of a comparable UHPFRC material called BSI-Ceracem© (by
Sika-Eiffage) with 0,16×20 mm steel fibres 2.4% vol. were taken from the results of the
experiments carried out by Redaelli and Muttoni [28] (as summarized in Table 3, Nezhentseva et al.
[7]) .
CC
Strain, deformation
Te
nsi
le s
tres
s
ECC
FRC, HSFRC
UHPFRC
Pseudo strain hardening(multiple microcracking,
appearance of macrocracks)
Strain softening (local deformations,
macrockracks start opening)
Li n
ear -
e las t
i c r
espon
se
Figure 2 – Response of UHPFRC in uniaxial tensile stress state compared to conventional (CC), fibre-
reinforced normal or high-strength concrete (FRC, HSFRC), as well as engineered cementitious composites
(ECC) with short polymeric (PE, PVA) fibres (adapted from Spasojević [15], Li and Fischer [35])
In accordance with the CRC® Patent [37], the concept of cracks can be divided into two
categories: surface cracks and cracks passing/not passing the reinforcement. The definition
“reinforcement” is used for the main reinforcement (such as steel bars), while the CRC® material
also contains matrix reinforcement in the form of fibres which reinforce the base matrix. Thus, there
are distinguished two possible types of cracks passing (or not passing) the main reinforcement [37]:
1) a base matrix crack – passing the fibres, which are still able to transfer the load
across the crack.
12
2) a complete crack – when the fibre-reinforced matrix does not transfer any tensile
forces due to the fibres in the matrix being either broken or pulled out;
Moreover, passing the main reinforcement a crack of a size smaller/equal (at the worse) to
the distance between the very fine, rigid and strong steel fibres can still be capable of transferring
the tensile loads due an increased combined strain capacity of the base matrix material, fibres and
main reinforcement. For this reason CRC® is also known as a material with a fine crack-free
behaviour even at very large loads [37]. Short fibres can control and bridge microcracks around the
reinforcement, while long fibres can be beneficial when bridging large macrocracks appearing at
higher loads. On the other hand, long fibres can potentially cause workability problems due to
“balling”.
Fibre orientation is known to have a large effect on tensile and flexural characteristics of
UHPFRC. The results of the research on the fibre orientation in UHPFRC carried out by Barnett et
al. [38] and supported by X-ray CT imaging, has shown that fibres tend to align perpendicular to the
flow of the concrete. Moreover, they have addressed that the behavior of the longer fibres,
commonly used in UHPFRC, can be expected to differ from the behavior of the shorter fibres.
Besides, considerable differences in fibre orientation based on the ways of casting of UHPFRC,
either parallel or perpendicular to the flexural tension, were discovered by Kim et al. [39]. The best
distribution and orientation of fibres has been achieved for the samples cast in the flexural tension
direction. It has also been confirmed that for larger flow distance from the points of casting the
fibres are likely to align perpendicular to the flow. Research done by Pansuk et al. [40] based on the
analysis of the fibre orientation numbers has showed, however, a conflicting tendency. It has been
observed that the fibres tend to arrange themselves in the direction parallel to the concrete flow.
This effect has been, however, more obvious for the longer fibres and longer flow distances.
Motivation of the present study is, therefore, to assess the fibre orientation and to check the
validity of the above mentioned observations based on the CRC® samples. Desired outcome and
purpose will be as follows:
- Uniform fibre distribution, fibre orientation and fibre volume in the CRC®
specimens;
- No air pockets and adequate fibre orientation around main reinforcement bars;
- Reduction/elimination of surface cracks by use of shorter fibres and/or various ways
of casting (based on naked-eye observations of the specimens);
- Recommendations on surface crack protection in case of cracks observed.

13
3. UHPFRC SPECIMEN PREPARATION
3.1 Matrix material, mixing and casting
The focus of the work in the present section was to provide the following characteristics of the
UHPFRC mixture and samples:
- Satisfactory workability of the mixture;
- Sufficient compressive strength.
Workability of concrete is highly affected by the amount of water added to the mixture. For
UHPFRC, however, increase of the w/c ratio is not possible, since it will worsen the properties of
the final product. Therefore, sufficient workability of paste phase is achieved by using large dosages
of superplasticizing admixtures. Additionally, workability is also affected by the shape, angularity
and surface texture of the particles of the mixture (i.e. fine and coarse aggregates). Geometric
properties of the particles influence the particle size distribution of the fine and coarse aggregates in
the mixture (“grading”). Generally, smooth and rounded particles will tend to pack together better
than rough angular or subangular ones, thus, assuring the best workability. Typically, particles of
different sizes are used in concrete in order to ensure better filling of the spaces between the larger
particles by the smaller particles, i.e. better packing. On the other hand, workability will decrease if
the aggregate particles are packed too tight, since the cement paste volume will be limited to
separate the aggregates properly. Furthermore, increasing the size of the aggregates in the concrete
is known to have a positive effect on workability as less cement will be required in a mixture. This
solution, however, has a limited application in UHPFRCs as the maximum aggregate size is
restrained. As a result, it is essential to find a balance between the workability and the efficient
(optimal or ideal) grading (aggregate packing).
Initially, sieve analysis was performed for both coarse and fine aggergates. Coarse and fine
aggregate samples were first dried in a drying oven at 105º C to a constant weight. Furthermore,
they were shaken through a set of sieves of various diameters with a sieve having the largest
openings placed on top, and a finest sieve positioned at the bottom. After sieving was performed,
masses of material retained at each sieve and in the bottom pan were obtained, and the total initial
weight of the samples was controlled. Besides, percent collected on each sieve and total percent of
each sample passing every single sieve were calculated. The results are shown graphically on a
grading chart (grading curve) in Figure 3.

14
Figure 3 −Grading curves based on the sieve analysis of sand and coarse aggregates
Following, natural packing porosities of sand, coarse aggregates (CA) and their mixtures
were measured. The natural packing porosity is a dimensionless quanity of the material calculated
as the ratio between the pore (void) volume, Vp, and the total volume Vt of the natural packed
material expressed either as a fraction or as a percentage. For concrete mixes it is especially
important to evaluate the volume of voids between the solid aggregate particles (CA and sand) that
can be filled with cement paste material. When the combined void content of the components of the
concrete increases, more of the expensive cement paste will be required to fill the voids between the
aggregates. Also, autogeneous and drying shrinkage are lower when the paste content is lower.
Thus, it is desirable to find a good combination between the coarse and the fine aggregates to keep
the void content as low as possible.
Total porosity is, generally, larger for soils and materials with fine texture (e.g. silt or clay),
whereas, it is lower for coarser materials (e.g. sand, gravel, coarse aggregates). Normally,
evaluation of the pore volume, i.e. the volume of water required to completely saturate the sample
material, is rather complicated. In this research, porosity was measured using the following
procedure: at first, coarse and fine aggregates were weighed and dried in a drying oven at 105º C
until a constant mass was achieved. Next, the specimens were cooled in air and further placed in
preweighed graduated glass cylinders to fill them to a mark indicating a total volume, Vt. Moreover,
combination of the two aggregate materials (sand +CA) in different ratios specified in Table 2 was
0.063 0.125 0.25 0.5 1 2 4 80
10
20
30
40
50
60
70
80
90
100
Mesh aperture [mm]
Perc
enta
ge p
assin
g [
%]
Grading curves
CA 2-5 mm
Sand 0.1-1.5 mm
60% sand/40% CA
40% sand/60% CA
15
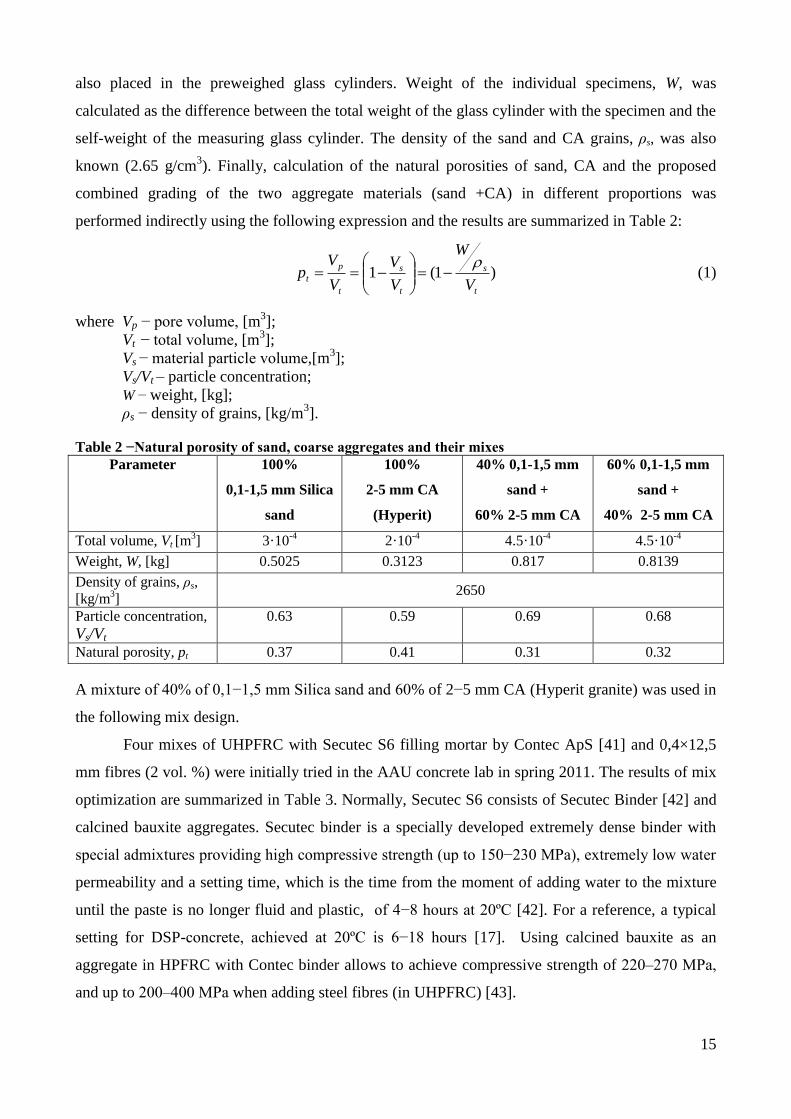
also placed in the preweighed glass cylinders. Weight of the individual specimens, W, was
calculated as the difference between the total weight of the glass cylinder with the specimen and the
self-weight of the measuring glass cylinder. The density of the sand and CA grains, ρs, was also
known (2.65 g/cm3). Finally, calculation of the natural porosities of sand, CA and the proposed
combined grading of the two aggregate materials (sand +CA) in different proportions was
performed indirectly using the following expression and the results are summarized in Table 2:
)1(1t
s
t
s
t
p
tV
W
V
V
V
Vp
(1)
where Vp − pore volume, [m3];
Vt − total volume, [m3];
Vs − material particle volume,[m3];
Vs/Vt – particle concentration;
W − weight, [kg];
ρs − density of grains, [kg/m3].
Table 2 −Natural porosity of sand, coarse aggregates and their mixes
Parameter 100%
0,1-1,5 mm Silica
sand
100%
2-5 mm CA
(Hyperit)
40% 0,1-1,5 mm
sand +
60% 2-5 mm CA
60% 0,1-1,5 mm
sand +
40% 2-5 mm CA
Total volume, Vt [m3] 3·10
-4 2·10
-4 4.5·10
-4 4.5·10
-4
Weight, W, [kg] 0.5025 0.3123 0.817 0.8139
Density of grains, ρs,
[kg/m3]
2650
Particle concentration,
Vs/Vt
0.63 0.59 0.69 0.68
Natural porosity, pt 0.37 0.41 0.31 0.32
A mixture of 40% of 0,1−1,5 mm Silica sand and 60% of 2−5 mm CA (Hyperit granite) was used in
the following mix design.
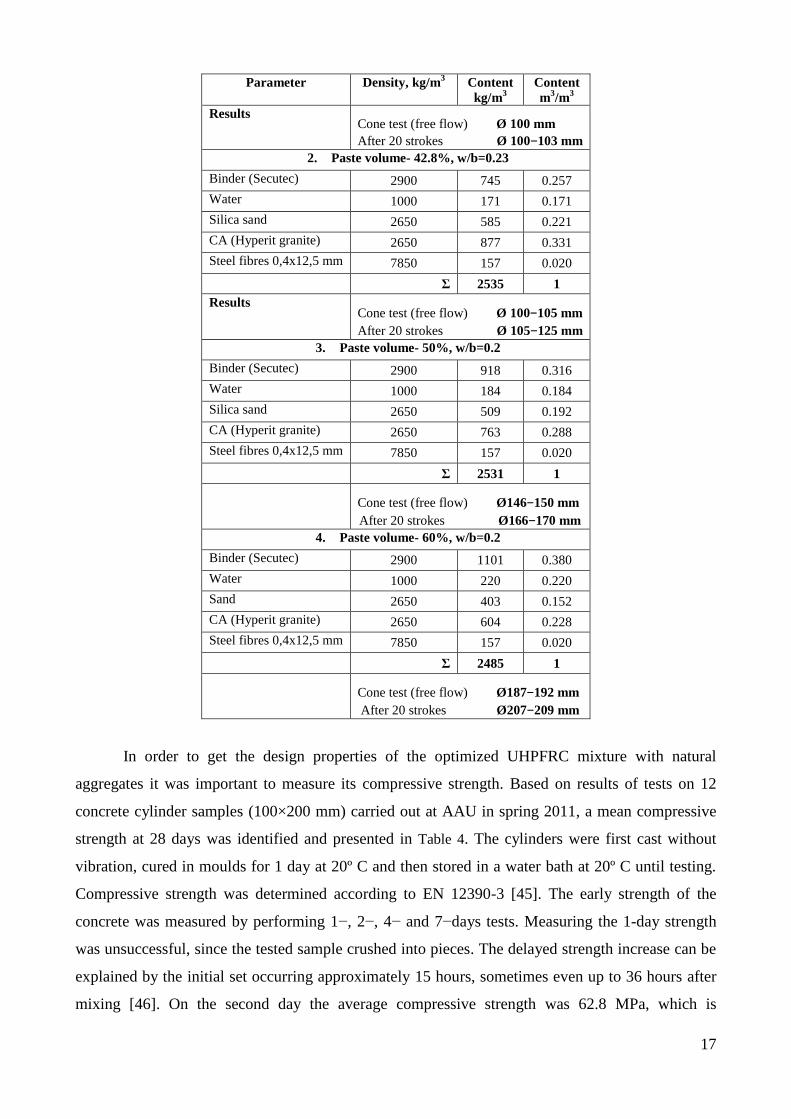
Four mixes of UHPFRC with Secutec S6 filling mortar by Contec ApS [41] and 0,4×12,5
mm fibres (2 vol. %) were initially tried in the AAU concrete lab in spring 2011. The results of mix
optimization are summarized in Table 3. Normally, Secutec S6 consists of Secutec Binder [42] and
calcined bauxite aggregates. Secutec binder is a specially developed extremely dense binder with
special admixtures providing high compressive strength (up to 150−230 MPa), extremely low water
permeability and a setting time, which is the time from the moment of adding water to the mixture
until the paste is no longer fluid and plastic, of 4−8 hours at 20ºC [42]. For a reference, a typical
setting for DSP-concrete, achieved at 20ºC is 6−18 hours [17]. Using calcined bauxite as an
aggregate in HPFRC with Contec binder allows to achieve compressive strength of 220‒270 MPa,
and up to 200‒400 MPa when adding steel fibres (in UHPFRC) [43].

16
In this study in order to reduce the cost of the final UHPFRC product bauxite aggregates
were replaced by cheaper local silica sand and natural Hyperit granite aggregates. Hyperit granite of
2−5 mm used in this study can be characterized as a CA material having subangular, rough and
flaky grains which means that it can negatively affect the workability. The initial mix was
performed according to Contec ApS’s recipe with w/b=0.18 and a paste volume of 42.8 %. Mixing
was performed in accordance with procedure described by the manufacturer [41]. The UHPFRC
Secutec S6 castable was mixed for 4 minutes in a pan-type mixer before the steel fibres were added.
Then, the mixture was mixed additionally for 3 minutes.
Workability of UHPFRC mixes was measured using the cone test method according to
ASTM C230 [44]. The cone mould with top and bottom diameters of 63 and 102 mm, respectively,
and a height of 52 mm was used. The cone mould was placed on the middle of the wooden plate of
the flow table apparatus and filled during slight compaction performed by using a tamping rod.
Then the cone mould was removed by lifting it vertically, thus, allowing the concrete to flow freely.
The diameter of the resulting horizontal spread of concrete was measured in two perpendicular
directions and presented in Table 3. As recommended in the technical data sheet of Contec ApS
[41], workability can be slightly improved by vibration. Thus, the vibration flow table was
subjected to jolting by lifting it up and dropping 20 times. This further caused the concrete to flow
and the horizontal projection of the spread was measured and documented one more time (see Table
3), and the relative evaluation of workability of the concrete mixes was performed.
The observed workability of the first mix was very low (see Table 3). A second trial mix had
a higher w/b ratio (w/b=0.23) with the same paste volume. This solution helped to increase the
workability, but the results were still not quite satisfactory. According to Contec ApS, the typical
w/b range for Secutec S6 lies within 0.19−0.21. Therefore, in the third and fourth trial mixes the
w/b ratio was lowered to 0.20 while the paste volume was increased to 50 and 60 %,
correspondingly, as shown in Table 3. Based on the results summarized in Table 3, the third mix
was selected for further investigation with a paste volume of 50% and a water/binder ratio w/b=0.2.
Table 3 − Optimization of the standard Secutec S6 concrete mix (manufacturer: Contec ApS)
Parameter Density, kg/m3 Content
kg/m3
Content
m3/m
3
1. Paste volume- 42.8%, w/b=0.18
Binder (Secutec) 2900 816 0.281
Water 1000 147 0.147
Silica sand 2650 585 0.221
CA (Hyperit granite) 2650 877 0.331
Steel fibres 0,4x12,5 mm 7850 157 0.020
Σ 2582.0 1
17
Parameter Density, kg/m3 Content
kg/m3
Content
m3/m
3
Results Cone test (free flow) Ø 100 mm
After 20 strokes Ø 100−103 mm
2. Paste volume- 42.8%, w/b=0.23
Binder (Secutec) 2900 745 0.257
Water 1000 171 0.171
Silica sand 2650 585 0.221
CA (Hyperit granite) 2650 877 0.331
Steel fibres 0,4x12,5 mm 7850 157 0.020
Σ 2535 1
Results Cone test (free flow) Ø 100−105 mm
After 20 strokes Ø 105−125 mm
3. Paste volume- 50%, w/b=0.2
Binder (Secutec) 2900 918 0.316
Water 1000 184 0.184
Silica sand 2650 509 0.192
CA (Hyperit granite) 2650 763 0.288
Steel fibres 0,4x12,5 mm 7850 157 0.020
Σ 2531 1
Cone test (free flow) Ø146−150 mm
After 20 strokes Ø166−170 mm
4. Paste volume- 60%, w/b=0.2
Binder (Secutec) 2900 1101 0.380
Water 1000 220 0.220
Sand 2650 403 0.152
CA (Hyperit granite) 2650 604 0.228
Steel fibres 0,4x12,5 mm 7850 157 0.020
Σ 2485 1
Cone test (free flow) Ø187−192 mm
After 20 strokes Ø207−209 mm
In order to get the design properties of the optimized UHPFRC mixture with natural
aggregates it was important to measure its compressive strength. Based on results of tests on 12
concrete cylinder samples (100×200 mm) carried out at AAU in spring 2011, a mean compressive
strength at 28 days was identified and presented in Table 4. The cylinders were first cast without
vibration, cured in moulds for 1 day at 20º C and then stored in a water bath at 20º C until testing.
Compressive strength was determined according to EN 12390-3 [45]. The early strength of the
concrete was measured by performing 1−, 2−, 4− and 7−days tests. Measuring the 1-day strength
was unsuccessful, since the tested sample crushed into pieces. The delayed strength increase can be
explained by the initial set occurring approximately 15 hours, sometimes even up to 36 hours after
mixing [46]. On the second day the average compressive strength was 62.8 MPa, which is

18
comparable to 70 MPa reported e.g. by Graybeal [46]. A mean compressive strength of 114.4 MPa
was achieved for the cylinders tested after 28 days (see Table 4). Consequently, the mean
compressive strength of the UHPFRC matrix was approximately one half of that of the comparable
Densit® matrix with stronger artificial aggregates used for CRC® (see e.g. Table 1) or UHPFRC
with Secutec S6 filling mortar and bauxite aggregates by Contec ApS [43]. Based on the results of
the cylinder tests a strength development curve was plotted as shown in Figure 4.
a)
b)
Figure 4 – Compressive strength development curve: a) linear time scale; b) log time-scale (paste volume
50 %, W/B= 0.2)
0 4 8 12 16 20 24 280
20
40
60
80
100
120
Age(days)
Com
pre
ssiv
e s
trength
[M
Pa]
2 4 8 16 32 64 1000
20
40
60
80
100
120
Age(days)
Com
pre
ssiv
e s
trength
[M
Pa]
Strength gain curve

19
Table 4 − Compressive strength for the Secutec S6 mix with a paste volume of 50% and w/b=0.2
Compressive strength, MPa
Curing time/# of
specimens tested
1 day
(25.03.2011)
2 days
(26.03)
4 days
(28.03)
7 days
(31.03)
13 days
(6.04)
28 days
(21.04)
1 2 3 2 2 2
1 0 70.16 82.12 81.11 105.93 112.94
2
55.51 72.45 93.33 73.98 115.86
3
89.13
Mean 62.84 81.23 87.22 89.96 114.4
3.2 Mixing and casting of UHPFRC specimens for fibre orientation
analysis
For the proper functioning of the TP structure it is important to have:
- Uniform fibre distribution, fibre orientation and fibre volume in the UHPFRC specimens;
- No large air pockets and adequate fibre orientation around main reinforcement bars;
- Reduction/elimination of surface cracks by use of shorter fibres and/or various ways of
casting (based on naked-eye observations of the specimens).
To investigate this, two types of additional tests on UHPFRC with main reinforcement were
carried out:
- Destructive with steel main reinforcement − for visual inspection of cracks;
- Non-destructive tests (CT-scanning) with FiReP®REBAR FRP main reinforcement [48] –
for analysis of fibre orientation, fibre concentration, and presence of voids/cracks.
First, an UHPFRC sample was cast with 2 vol. % steel fibres 0,4×12,5 mm and the
dimensions 480×480×90 mm as shown in Figure 5. The wall thickness of the sample corresponded
to the representative wall thickness of the full-scale TP structures based on the FEM analysis
calculations carried out by Nezhentseva et al. [7,8]. The panel was cast in a mould with a very high
concentration of steel rebar Ø 16 mm closely tied together and arranged in two layers in the
horizontal direction and one layer in the vertical direction. The horizontal rebar was located closer
to the surface, while the vertical rebar was centrally positioned in the middle of the formwork. The
distance between the centres of the neighbouring bars was 60 mm, i.e. there were 7 rows of
reinforcement in each direction [7,8]. Casting was performed vertically without vibration by
continually filling the formwork along the top. A transparent front side of the formwork made of
Plexiglas allowed to monitor the flow of the mixture during the casting.
After removing the formwork, several hairline surface cracks were observed along the
horizontal reinforcement bars. These cracks are feared to potentially create a threat of corrosion of
the main reinforcement when exposed to aggressive sea water conditions. In order to further inspect

20
possible cracks or voids inside the body of the specimen, two cylindrical samples were drilled out
from the top and the bottom parts of the sample where the hairline surface cracks were observed.
The drilled cores are shown in Figure 6. The specimens split into smaller fragments alongside the
main reinforcement after an attempt was made to saw them in halves. Having these samples
inspected with the naked eye, multiple cracks were detected around the reinforcement bars inside
the body of the top sample (Figure 6, marked in red). A possible origin of these cracks could be
from disturbance caused by drilling and further sawing of the samples. Yet, based on these
observations a decision to investigate this problem in more detail was made using a non-destructive
testing technique (CT scanning). Additionally, fibre orientation, fibre distribution and actual fibre
volume could be studied in different parts of the specimens (i.e. above, around and underneath the
rebar).
a)
Dimensions are [mm]
b) c)
Figure 5 − UHPFRC sample with steel reinforcement cast at AAU in spring 2011: a) formwork; b) casting;
c) final product with positions of the drills: sample 1 (bottom) and sample 2 (top).

21
a) b)
c)
Figure 6 − a) sample 1 (bottom); b) sample 2 (top); c) cracks in sample 2 (top)
3.3 Specimen types for CT-scanning
Two types of steel fibres, longer − 0,4×12,5 mm and shorter − 0,16×6 mm were selected for casting
a batch of UHPFRC samples at AAU in spring of 2012 and for further non-destructive examination
of voids and cracks using CT-scanning. The same mix composition was selected for simplicity as
described in Section 3.1, Table 3 (mix 3) maintaining a fibre dosage of 2 vol. %. The workability
and the flow of the new mix with shorter fibres were not measured but were simply judged visually
to be adequate to perform casting without vibration. A decision to replace the main steel
reinforcement by fibre-glass (aligned glass fibres held together by a polymer) FiReP®REBAR FRP
reinforcement [48] of Ø20 mm was made as the main reinforcement made of steel would
«consume» excessive energy when performing X-ray CT-scanning, thus, severely disturbing the
analysis. The samples were cast in horizontal and vertical moulds of various sizes with FRP
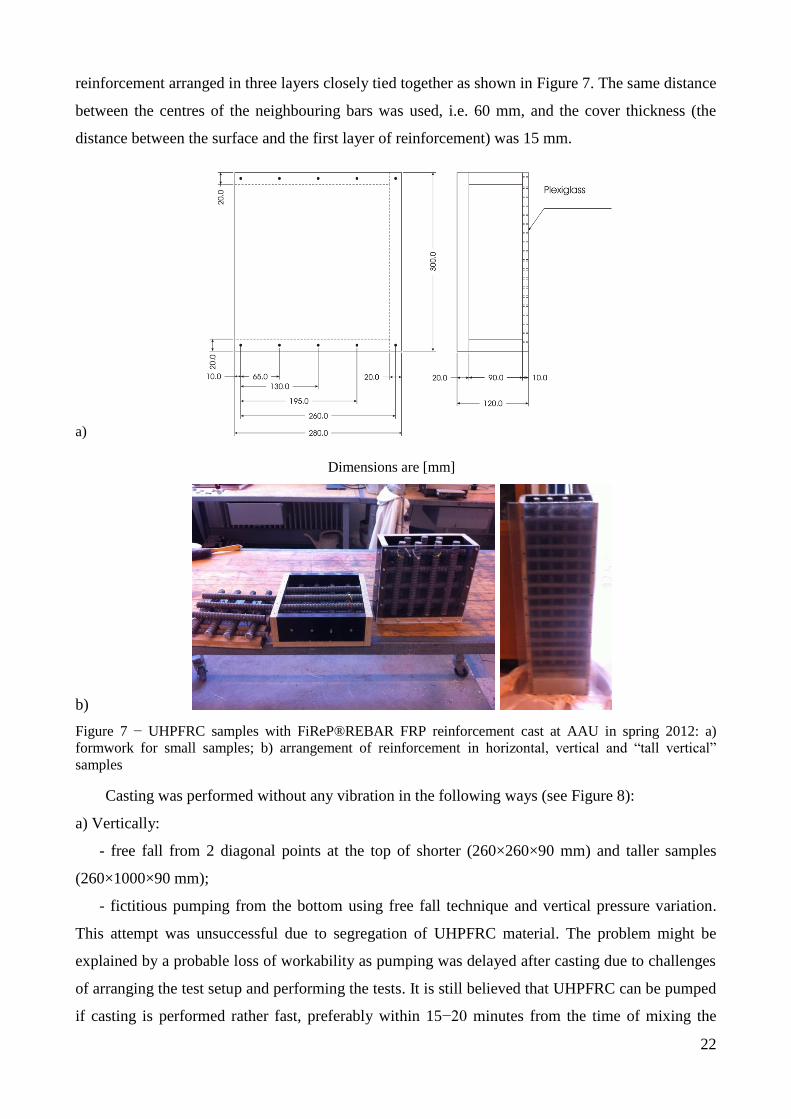
22
reinforcement arranged in three layers closely tied together as shown in Figure 7. The same distance
between the centres of the neighbouring bars was used, i.e. 60 mm, and the cover thickness (the
distance between the surface and the first layer of reinforcement) was 15 mm.
a)
Dimensions are [mm]
b)
Figure 7 − UHPFRC samples with FiReP®REBAR FRP reinforcement cast at AAU in spring 2012: a)
formwork for small samples; b) arrangement of reinforcement in horizontal, vertical and “tall vertical”
samples
Casting was performed without any vibration in the following ways (see Figure 8):
a) Vertically:
- free fall from 2 diagonal points at the top of shorter (260×260×90 mm) and taller samples
(260×1000×90 mm);
- fictitious pumping from the bottom using free fall technique and vertical pressure variation.
This attempt was unsuccessful due to segregation of UHPFRC material. The problem might be
explained by a probable loss of workability as pumping was delayed after casting due to challenges
of arranging the test setup and performing the tests. It is still believed that UHPFRC can be pumped
if casting is performed rather fast, preferably within 15−20 minutes from the time of mixing the

23
product, as the major loss of workability will occur shortly after casting [49,50]. As a result, this
sample was discarded.
b) Horizontally by filling a 260×260×90 mm sample from two diagonally located points.
a)
b)
c)
Figure 8 − Casting of the UHPFRC samples with FiReP® reinforcement (AAU, spring 2012): a) 2 point
casting of a vertical sample; b) finished vertical sample cast vertically from 2 points (shown in red); c) 2
point casting of a horizontal sample.
24
a) b)
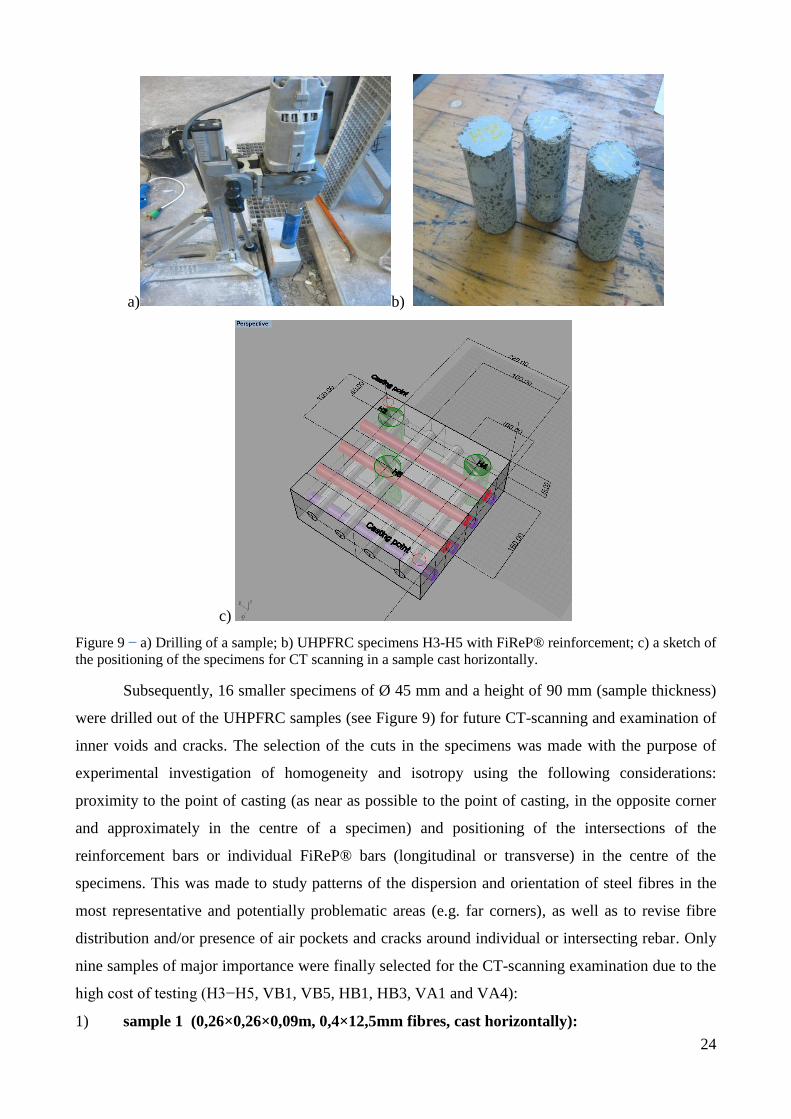
c)
Figure 9 − a) Drilling of a sample; b) UHPFRC specimens H3-H5 with FiReP® reinforcement; c) a sketch of
the positioning of the specimens for CT scanning in a sample cast horizontally.
Subsequently, 16 smaller specimens of Ø 45 mm and a height of 90 mm (sample thickness)
were drilled out of the UHPFRC samples (see Figure 9) for future CT-scanning and examination of
inner voids and cracks. The selection of the cuts in the specimens was made with the purpose of
experimental investigation of homogeneity and isotropy using the following considerations:
proximity to the point of casting (as near as possible to the point of casting, in the opposite corner
and approximately in the centre of a specimen) and positioning of the intersections of the
reinforcement bars or individual FiReP® bars (longitudinal or transverse) in the centre of the
specimens. This was made to study patterns of the dispersion and orientation of steel fibres in the
most representative and potentially problematic areas (e.g. far corners), as well as to revise fibre
distribution and/or presence of air pockets and cracks around individual or intersecting rebar. Only
nine samples of major importance were finally selected for the CT-scanning examination due to the
high cost of testing (H3−H5, VB1, VB5, HB1, HB3, VA1 and VA4):
1) sample 1 (0,26×0,26×0,09m, 0,4×12,5mm fibres, cast horizontally):

25
a) next to the point of casting (H3),
b) in the opposite corner (H4),
c) almost in the middle of the specimen (H5)
2) sample 2 (0,26×0,26×0,09m, 0,4×12,5mm fibres, cast vertically):
a) at the top next to the point of casting (V6),
b) at the bottom in the opposite corners (V4 and V3),
c) approximately in the middle of the specimen (V5),
d) long specimen along the vertical rebar (V1)
3) sample 3 (0,26×0,09×1m, 0,4×12,5mm fibres, cast vertically):
a) at the top next to the point of casting (VB1),
b) at the bottom in the corner (VB5)
4) sample 4 (0,26×0,26×0,09m, 0,16x×6mm fibres, cast horizontally):
a) next to the point of casting (HB1),
b) in the opposite corner (HB3)
5) sample 5 (0,26×0,09×1m, 0,16×6mm fibres, cast vertically):
a) at the top in the middle (VA1),
b) at various heights in the middle of the specimen (VA2, VA3,VA4).
4. CT SCANNING
4.1 Results
Several surface cracks were observed in the UHPFRC samples cast vertically different from the
horizontally cast specimens. This could partially be explained by a smaller fibre concentration
closer to the surface (i.e. in the cover layer) due to a smaller effect of the matrix fibres (see, e.g.
CRC® Patent [37]). Perry et al. [50] addressed the importance of the mould design on the initial
autogeneous (drying) shrinkage of the fresh UHPFRC material not yet being able to achieve internal
tensile capacity. The results of their experiments indicated that filling vertical (or nearly vertical)
specimens from the bottom would assure the best results of the surface of the UHPFRC [50].
The biggest concern is, however, how far these visible surface cracks have actually
penetrated into the main body of the samples, and whether they pass the main reinforcement. This is
particularly significant for the TP structures of special importance where no surface cracks are
acceptable, and therefore should be avoided.
26
4.2 Computed Tomography (CT)
Non-destructive testing (NDT) methods currently used for evaluation of fibre distribution in
concrete include:
- microscopic examination of polished sections and manual counting of fibres (see, e.g. Tue et
al. [51]);
- electrical measurement methods: electrical resistivity (see Lataste et al. [52]) and Alternate
Current Impedance Spectroscopy (AC-IS) (Ozyurt et al. [53], Woo et al. [54] );
- magnetic inductive method (Ferrara et al. [55,56], Torrents et al. [57])
- X-ray CT investigations (Schnell et al. [58,59])
Electrical resistivity is a NDT technique providing information about steel fibre distribution
and local orientation of steel fibres based on the identification of more or less electrically resistant
regions within an UHPFRC specimen. Testing is performed by means of two electrodes introducing
a low frequency electrical signal of a predefined value to a concrete sample. When the current
passes through the UHPFRC material a potential difference will be generated. This potential
difference will further be detected and measured by two additional electrodes. Electrical resistivity
method was used, for example, for characterisation of fibre distribution in Ductal® (by Lafarge)
UHPFRC concrete with 2 vol. % steel fibres performed by Lataste et al. [52].
AC-Impedance Spectroscopy is a new electrical measurement method for non-destructive
monitoring of orientation and arrangement of conductive fibers in both fresh and hardened fibre-
reinforced cement-based materials [53,54]. AC-IS is a promising technique based on the intrinsic
conductivity approach. An excitation voltage with a range of frequencies is initially applied to a
specimen. The magnitude and the phase of the current are further measured. Each frequency
generates a single point of the real and imaginary values of impedance converted from the acquired
data and further presented on special plots [53,54]. This technique is, however, sensitive to the
dispersion of fibres, i.e. clumping, segregation and orientation of fibres.
Magnetic inductive non-destructive testing technique [55−57] is based on the principle of
ferromagnetic induction and ferromagnetic properties of steel fibres modifying by their presence the
magnetic field lines. Apart from being easy to use, having a good sensitivity and relying on simple
equipment, this method allows determination of content and orientation of steel fibres in the
concrete matrix regardless of its age and moisture content. However, this method can only detect
steel fibres and is not able to provide information about other components in the concrete matrix.
According to Schnell et al. [58] CT scanning technique is advantageous to the other methods
as it allows analysing and investigating the fibre-orientation and the fibre-distribution in the entire
volume of a specimen without a need for sample preparation. Moreover, it is also possible to

27
examine and describe local fibre qualities and micro crack propagation. On the other hand, high-
resolution CT scanners for testing microstructure of civil engineering materials (soil, cement,
reinforced concrete, rock, asphalt) are large, very expensive, and require special safety measures to
operate. This results in a high price of a single sample scan.
X-ray Computerized Tomography (XCT), Computed Tomography or CT scan, is a non-
destructive imaging procedure developed initially for medical diagnosis of internal organs by G.
Hounsfield in 1970 [60,61]. XCT combines two-dimensional (2D) or three-dimensional (3D or
volumetric) X-ray projections with powerful computer algorithms. It is based on penetrating
electromagnetic radiation in terms of computer-processed X-rays having a wavelength in the range
0.01−10 nm to obtain tomographic high-resolution images for volumetric inspection of a tested
sample from inside. If required, information about crystal structure, chemical composition, and
physical properties of particular materials comprising the sample can also be obtained. CT scanning
is performed by making numerous 2D “slices” (images) of single planes of the specimen taken
around a specified rotational axis followed by a digital geometry processing procedure to create a
volumetric image [62], see e.g. Figure 10. These images are created by means of measuring the
scattered intensity of X-rays passing through matter, reaching different material components, e.g.
steel fibres, coarse aggregates and FRP reinforcement in UHPFRC, and partly being absorbed in
transmission. X-rays penetrate through an object and interact with atoms and molecules of different
materials in various ways depending on the energy of the X-rays and material composition [63].
Figure 10 − Three-dimensional computer tomography – a schematic view (adapted from Schnell et al.[59])
The Beer-Lambert law [64,65] describes the relationship between absorption of X-ray
photons (particular light particles on the atomic level) produced by an X-ray tube and the properties
of the media through which the X-ray photons are travelling (see, e.g. Köser et al. [66]):
28
)(
0
)(
0
* xx eIeII (2)
where I0 – the rate of the incident radiation intensity (photon beam);
I – the rate of the transmitted (emerging) radiation intensity (photon beam);
µ– linear attenuation coefficient of a certain material characterizing how easily the X-ray
photon can penetrate medium, i.e. the photon absorption or scatter per unit length (cm-1
);
µ*– mass attenuation coefficient, measurement of how strongly a certain material
absorbs or scatters X-ray photon light at a given wavelength, per unit mass (cm2
g-1
);
ρ – material density (g cm-3
);
x – material thickness or distance travelled (cm).
µ*=µ/ρ (3)
Different CT scanners have various photon energy spectra, which can be normalized in
Hounsfield units:
water
waterH
1000 (3)
where H – Hounsfield units (HU) or CT numbers (for water –0 HU, air – 1000 HU);
µwater – linear attenuation coefficient for water.
Normally, different densities of components of UHPFRC matrix correspond to a range of CT
numbers (or Hounsfield units (HU)) assigned to each single point of the matrix (pixel) in various
intensities or shades of gray scale. Higher CT numbers will normally be associated with white
regions, and vice versa.
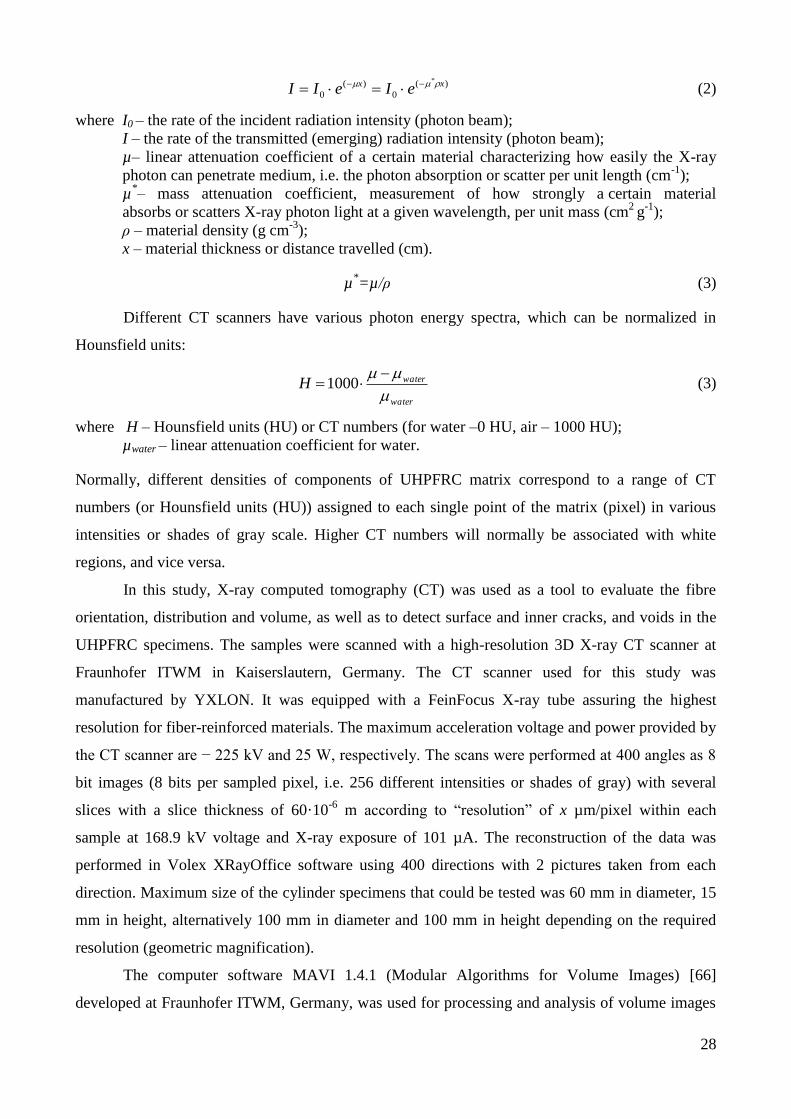
In this study, X-ray computed tomography (CT) was used as a tool to evaluate the fibre
orientation, distribution and volume, as well as to detect surface and inner cracks, and voids in the
UHPFRC specimens. The samples were scanned with a high-resolution 3D X-ray CT scanner at
Fraunhofer ITWM in Kaiserslautern, Germany. The CT scanner used for this study was
manufactured by YXLON. It was equipped with a FeinFocus X-ray tube assuring the highest
resolution for fiber-reinforced materials. The maximum acceleration voltage and power provided by
the CT scanner are − 225 kV and 25 W, respectively. The scans were performed at 400 angles as 8
bit images (8 bits per sampled pixel, i.e. 256 different intensities or shades of gray) with several
slices with a slice thickness of 60·10-6
m according to “resolution” of x µm/pixel within each
sample at 168.9 kV voltage and X-ray exposure of 101 µA. The reconstruction of the data was
performed in Volex XRayOffice software using 400 directions with 2 pictures taken from each
direction. Maximum size of the cylinder specimens that could be tested was 60 mm in diameter, 15
mm in height, alternatively 100 mm in diameter and 100 mm in height depending on the required
resolution (geometric magnification).
The computer software MAVI 1.4.1 (Modular Algorithms for Volume Images) [66]
developed at Fraunhofer ITWM, Germany, was used for processing and analysis of volume images

29
produced by micro computed tomography. As the X-rays propagated through each pixel of the
image of the sample, they were scattered or absorbed in various ways depending on the density and
the atomic number of the material they passed. This corresponded to different gray levels in the CT
scanned images. In order to separate steel fibres, air pockets around the rebar and cracks from the
concrete matrix, so-called threshold images had to be used in the segmentation process. This was
performed by setting a threshold level in such a way that a total number of the isolated pixels in
each phase was minimized. As for the steel fibres, pixels having higher gray values (white regions
corresponding to the areas with higher CT numbers) were interpreted as belonging to the fibre
phase, whereas the threshold levels (dark regions with lower CT values) were interpreted as
belonging to the concrete phase.
Raw 3D image data from the CT scanning was imported to MAVI. In order to reduce the
size of the raw data, cropping of the scanned images was performed on three coordinate axes in
such a way, that both the top and the bottom of each specimen were included, while the circular
sides of the scanned cylindrical specimens were cropped and the specimens turned into 3D
rectangular prisms (see Figure 11).
Dimensions are [mm]
Figure 11 – Cropping of the UHPFRC specimens in MAVI (dimensions in mm).
Furthermore, morphological transformation of the cropped image was performed using an
opening filter. Generally, filtering (opening) can be used to remove small objects, to reduce the
noise and to enhance image contrast of gray value images. Moreover, a binary operation of
subtraction was performed for the cropped and the filtered images. This operation allowed taking
pixel values from both images, computing the difference of their grey values and later on writing
the result in the output image. The result of subtraction was further subjected to segmentation.
Meanwhile, an input file containing grey values was transformed into an output binary image
containing only zeros and ones as values depending on whether the pixel´s value lied within the

30
given range (global thresholding). The threshold value was selected using trial and error technique
until a desired averaged diameter of the steel fibres was achieved (i.e. 0,4 mm and 0,16 mm). The
accuracy of the results of the fibre thickness measurements was further validated. After the CT-
analysis of a single specimen was performed, an additional CT-analysis was completed for the same
specimen turned 180º (upside down) in the CT scanner. A common source of error would be
underestimation of the fibre thickness due to an indistinguishable transition of the gray values from
the matrix to the fibre phase due to the poor quality of binarisation. However, working directly on a
gray value image would help to solve this potential source of error [58].
Quantitative geometric analysis of the steel fibres was performed using an Open Foam and
Field Features tools. The following characteristics were determined: mean diameter of the edge
(Open Foam Feature), volume density, surface area, specific fibre length, length of total projections
corresponding to the directions of the projections (Field Feature). For selected images, several
additional actions were performed with the binary image in order to show a better quality image of
the steel fibre distribution. Initially, a simple linear transformation called “spreading” was carried
out which allowed to transform the range from minimum to maximum value presented in the input
2-value binary image (the dynamic range) to the full range of the output image (GRAY8 image).
The final step was to remove the noise from the spread image using a smoothing filter called Mean
Filter with a filter mask size 3. Lastly, volume rendering view allowed visualization of the 3D-data
presented in the following section.
4.3 Fibre distribution
Fibre distribution in the 0,26×0,26×0,09m and 0,26×0,09×1m UHPFRC specimens cast
horizontally and vertically, respectively, with both short and long fibres is represented in Figures
12−13. Furthermore, fibre orientation and fibre volume in the UHPFRC specimens based on the
quantitative geometric analysis performed in MAVI is summarized in Table 5. A fibre orientation
number, ηφ (see e.g. Schnell et al. [59]), was defined as:
VL
L
V
p
,
(4)
where Lp,φ − total projected fibre length on the corresponding direction φ (corresponding to axis x,
y or z), [m];
LV − specific fibre length, or total fibre length per unit of volume, [m/m3];
V − total volume of the specimen, [m3].
31
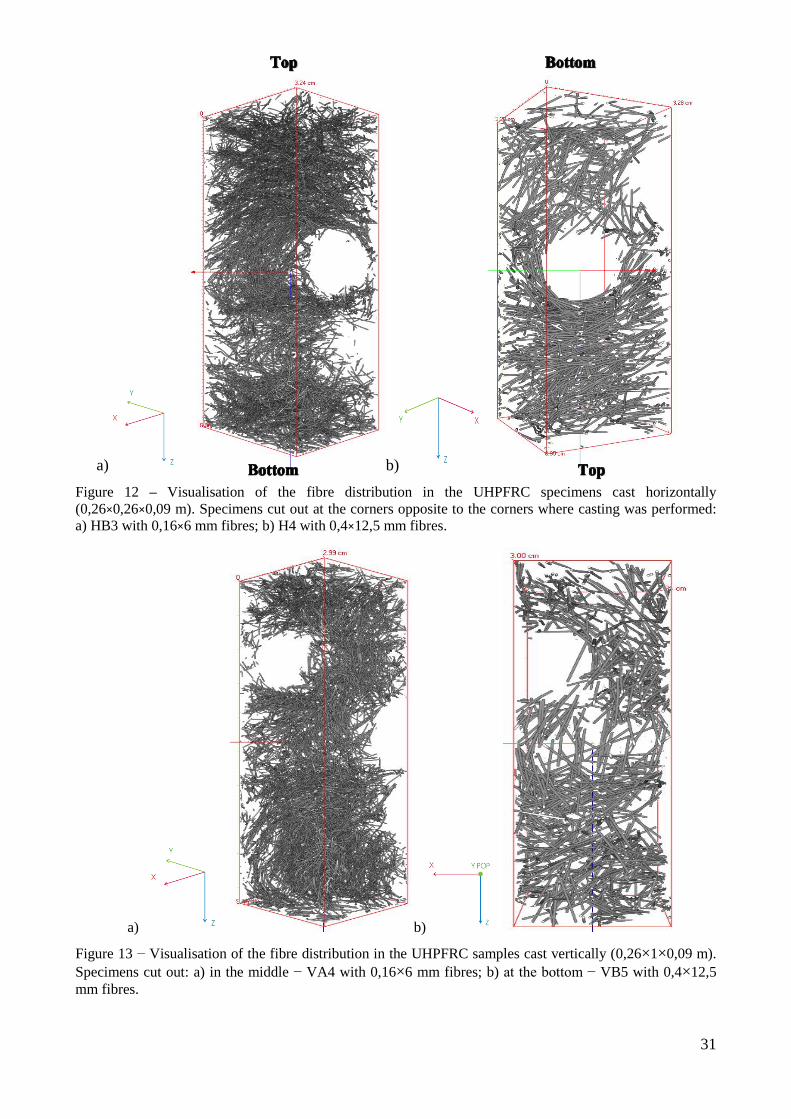
a) b)
Figure 12 – Visualisation of the fibre distribution in the UHPFRC specimens cast horizontally
(0,26×0,26×0,09 m). Specimens cut out at the corners opposite to the corners where casting was performed:
a) HB3 with 0,16×6 mm fibres; b) H4 with 0,4×12,5 mm fibres.
a) b)
Figure 13 − Visualisation of the fibre distribution in the UHPFRC samples cast vertically (0,26×1×0,09 m).
Specimens cut out: a) in the middle − VA4 with 0,16×6 mm fibres; b) at the bottom − VB5 with 0,4×12,5
mm fibres.

32
Table 5 − Fibre orientation and fibre volume in the UHPFRC specimens
Specimen fibre orientation number (ηφ) fibre volume, %
x y z
H3 (next to the point of casting)
(cast horizontally (0,26×0,26×0,09 m, 0,4×12,5 mm fibres))
-complete 0.63 0.54 0.33 1.45
-top (bottom) 0.62 0.60 0.24 2.30
-bottom (top) 0.64 0.54 0.30 1.82
-rebar 0.62 0.51 0.37 1.25
H4 (in the opposite corner)
(cast horizontally (0,26×0,26×0,09 m, 0,4×12,5 mm fibres))
-complete 0.51 0.61 0.35 1.66
-top (bottom) 0.56 0.61 0.29 1.93
-bottom (top) 0.51 0.68 0.27 2.40
-rebar 0.49 0.56 0.44 1.34
H5 (in the middle)
(cast horizontally (0,26×0,26×0,09 m, 0,4×12,5 mm fibres))
-complete 0.55 0.63 0.30 1.38
-top (bottom) 0.53 0.72 0.23 2.28
-bottom (top) 0.58 0.62 0.25 2.04
-rebar 0.51 0.60 0.39 0.90
HB1 (next to the point of casting) (cast horizontally (0,26×0,26×0,09 m, 0,16×6 mm fibres))
-complete 0.57 0.54 0.39 1.47
-top 0.65 0.52 0.33 2.23
-bottom 0.47 0.68 0.35 1.58
-rebar (middle) 0.50 0.50 0.51 0.96
HB3 (in the opposite corner)
(cast horizontally (0,26×0,26×0,09 m, 0,16×6 mm fibres))
-complete 0.50 0.62 0.38 1.36
-top 0.50 0.66 0.34 1.92
-bottom 0.53 0.59 0.40 1.96
-rebar (middle) 0.47 0.60 0.45 0.91
VB1 (3 cm from top, next to the point of casting) (cast vertically (0,26×0,09×1 m, 0,4×12,5 mm fibres))
-complete 0.52 0.56 0.42 1.40
-top 0.51 0.65 0.33 2.06
-bottom 0.47 0.57 0.46 1.73
-rebar (middle) 0.60 0.48 0.42 0.88
VB5 (3 cm from bottom, in the corner)
(cast vertically (0,26×0,09×1 m, 0,4×12,5 mm fibres))
-complete 0.48 0.57 0.44 1.48
-top 0.37 0.79 0.29 1.74
-bottom 0.54 0.54 0.44 1.89
-rebar (middle) 0.46 0.52 0.52 1.10
VA1 (6 cm from top, in the middle) (cast vertically (0,26×0,09×1 m, 0,16×6 mm fibres))
-complete 0.48 0.48 0.55 1.62
-top 0.50 0.59 0.42 1.66
-bottom 0.51 0.48 0.52 1.90

33
Specimen fibre orientation number (ηφ) fibre volume, %
x y z
-rebar (middle) 0.46 0.45 0.58 1.45
VA4 (15 cm from the bottom,~ in the middle of the sample)
(cast vertically (0,26×0,09×1 m, 0,16×6 mm fibres))
-complete 0.53 0.52 0.46 1.32
-top 0.48 0.64 0.39 1.60
-bottom 0.53 0.52 0.46 1.66
-rebar (middle) 0.55 0.46 0.49 0.80
The calculated fibre orientation number ranges between "0" and "1", where = 1 means
that all the fibres are aligned with the direction φ (axis x, y or z), = 0 indicates that all fibres are
directed perpendicular to this direction. Fibre orientation number and fibre volume were initially
calculated for the whole volume of the specimen (“complete” in Table 5), as well as for the smaller
subareas each specimen was subdivided into, namely: “top” (the upper area just before
reinforcement), “bottom” (the bottom area below reinforcement), and “rebar” (the area including
reinforcement bars crossing a specimen). Position of the horizontal samples H3−H5 was flipped
180º (upside down) in the CT−scanner (Figure 12 b)) compared to their initial casting position in
the formwork indicated in brackets (bottom, top) in Table 5.
Fibre volume distribution for all the specimens at the top and bottom locations was within
1.58−2.40 % with generally higher values observed for the specimens cast horizontally. Calculation
of the complete fibre volume concentration was affected by the area around rebar where the fibre
volume was at its lowest value, which could also mean that the fibre volume would be close to 2%
if that was taken into consideration. Indeed, fibre volume in the top and the bottom part of the
samples was not disturbed by the presence of the main reinforcement and was close to 2%, which
gives credibility to the CT method. A slightly lower fibre volume concentration was observed in the
specimens VA4 and VB5 (cut out ca. in the middle and at the bottom of the vertical samples)
compared to the specimens VA1 and VB1 from the top of the samples in the middle and next to the
point of casting.
Based on the data provided in Table 5, the average fibre orientation numbers for various
axes and the average fibre volume were calculated and summarized in Table 6 for the specimens
with the same fibre type, cast either horizontally (i.e. H3−H5 and HB1−HB), or vertically (i.e.
VB1,VB5 and VA1,VA4). The area around the rebar and the complete area of the sample (which
also included the rebar layer) were included in the results of the calculations, which resulted in a
reduction of the value of the fibre volume. According to Table 6, fairly uniform fibre distribution
was observed for the specimens cast in both directions regardless of the fibre type with a slight
tendency to a perpendicular alignment in the direction of the vertical axis z for the horizontal

34
specimens. Moreover, slight deviations were observed in different parts of the specimens (i.e. top,
bottom and around rebar, see Table 5). Generally, no obvious fibre alignment in any direction was
observed based on the ways of casting, thus, resulting in a fairly uniform fibre orientation in the cast
samples.
Table 6 – Averaged fibre orientation and fibre volume in the UHPFRC specimens
Specimen fibre orientation number (ηφ) fibre volume, %
ηx ηy ηz
Cast horizontally:
H3−H5
0.56 0.60 0.31 1.73
HB1, HB3
0.52 0.59 0.39 1.55
Cast vertically:
VB1, VB5 0.49 0.59 0.42 1.54
VA1, VA4 0.44 0.52 0.48 1.50
4.4 Cracks and air voids
Interpretation of the gray images will be more comprehensive if the corresponding CT numbers
associated with each component of the UHPFRC matrix (air voids, cracks, CA, steel fibres and FRP
rebar) could be recalculated into real densities. In this study this was done by correlating the X-ray
densities of the matrix materials to the real densities (kg·m-3
) and associating them with a user-
defined non-linear colour scale (as shown in Figures 14−20):
1) Air voids/cracks (black) – 1000;
2) FRP reinforcement (red) – 2100;
3) CA (Hyperit granite) (green) – 2650;
4) Steel fibres (blue) – 7850.
Since high density of small steel fibres lead to absorption of energy during CT scanning,
disruption of other density signals was observed in the specimens. Therefore, X-ray densities
corresponding to the real densities of the matrix materials had to be adjusted for every specimen as
a range of values rather than a certain value indicated above. As a result, in addition to the fibre
orientation and fibre volume investigation, presence of air voids, air pockets and cracks was
monitored in the specimens and presented in Figures 14−21. Linear dimensions of the samples are
shown for each specimen in the notation to Figures 14−20 in brackets. During CT scanning all
specimens were “sliced” into ~500 slices in two perpendicular directions (XZ and YZ). Only one
direction (YZ plane) was chosen for comparison of all the samples (shown in the middle of the
specimen VA1 in Figure 14−1). Direction of the X axis was pointing out of plane YZ (POP) and
was not displayed in Figures 14−20. For each sample a section with the most dangerous
combination of cracks and voids was selected to be presented in Figures 14−20. Generally, for each

35
specimen only approximately 10 “slices” out of ~500 contained such problematic areas. Thus, the
results can be understood as warning rather than characteristic. For example, air pockets and voids
are believed to be a warning sign and can theoretically lead to crack formation threatening the load
transfer in the material.
In the vertical specimens VA1 and VA4 (0,16×6mm steel fibres) multiple air pockets were
traced around rebar, as well as a few discrete pores (air voids) of different size were observed in the
entire body of the specimen (Figures 14,15). Knowing the size of the specimens, the size of these
pores was measured to be ~5 and 4 mm for the specimens VA1 and VA4, respectively.
Furthermore, multiple almost through-going cracks were initiated in the body of the vertical
specimen VB1 (0,4×12,5 mm steel fibres) close to the main reinforcement, as well as hairline
surface cracks were observed on the left-hand side of Figure 16−1,2. Suggested possible crack
location in the specimen VB1 is shown in black in Figure 21. Besides, large air voids were observed
on the ribs of the FRP rebar and in the body of the specimen VB1 (~6 mm), as well as between
interconnecting longitudinal and vertical rebar (~8 mm). Specimen VB5 cut out at the bottom of the
vertical sample (0,26×0,09×1m, 0,4×12,5mm fibres) had only a few small air voids in the body of
the specimen (Figure 17).
Similarly to the specimen VB5, only a few small air bubbles were traced in the specimen H3
cast horizontally (0,4x12,5mm steel fibres) and cut out next to the point of casting (see Figure
16−1). As for the specimens H4 and H5 drilled out from the opposite to the point of casting corner
and in the middle of the same sample cast horizontally, respectively, several small and larger air
voids (up to ~5 mm) were observed, both around rebar and in the body of the specimens (Figure
16−2,3). In the horizontal specimens HB1 air pockets were observed around the rebar, whereas in
the specimen HB3 (0,16x6mm steel fibres) a few small air voids were observed in the body of the
specimen (Figures 19,20), which is believed to be normal. The post-processing picture for this
specimen looks blurry due to a high energy absorption caused by the large amount of small steel
fibres.

36
Y
Figure 14 –Specimen VA1 (3,0×3,1×9,0cm) cast vertically (0,16×6 mm fibres): Black regions indicate
cracks and air voids, green regions – coarse aggregates (Hyperit), red regions – RFP reinforcement, and
blue regions – steel fibres. Recalculated densities are shown on the colour scales to the left (kg m-3
)
Figure 15 – Specimen VA4 (3,0×2,9×9,0cm) cast vertically (tall, 0,16×6 mm fibres): Recalculation of CT
numbers into densities of material components of the UHPFRC specimen. Black regions indicate cracks and
air voids, green regions – coarse aggregates (Hyperit), red regions – RFP reinforcement, and blue regions –
steel fibres. Recalculated densities are shown on the colour scales to the left (kg m-3
)
1)
2)
Figure 16 –Specimen VB1 (2,6×3,2×9,0cm) cast vertically (tall, 0,4×12,5 mm fibres): 1), 2) Two slices in
YZ direction. Recalculation of CT numbers into densities of material components of the UHPFRC specimen.
Black regions indicate cracks and air voids, green regions – coarse aggregates (Hyperit), red regions – RFP
reinforcement, and blue regions – steel fibres. Recalculated densities are shown on the colour scales to the
left (kg m-3
)
0
2200
4400
6600
8800
11000
0
2000
4000
6000
8000
10000
0
2000
4000
6000
8000
10000
0
2200
4400
6600
8800
11000
Z
Z
Y
Z
Y

37
Figure 17 –Specimen VB5 (2,8×3,0×9,0cm); cast vertically (tall, 0,4×12,5 mm fibres): Recalculation of CT
numbers into densities of material components of the UHPFRC specimen. Black regions indicate cracks and
air voids, green regions – coarse aggregates (Hyperit), red regions – RFP reinforcement, and blue regions –
steel fibres. Recalculated densities are shown on the colour scales to the left (kg m-3
)
1)
2)
3)
Figure 18 –Specimens cast horizontally (0,4×12,5 mm fibres): 1) H3 (3,3×3,3×9,0cm); 2) H4
(3,3×3,3×9,0cm); 3) Specimen H5 (3,3×3,3×9,0cm): Recalculation of CT numbers into densities of material
components of the UHPFRC specimen. Black regions indicate cracks and air voids, green regions – coarse
aggregates (Hyperit), red regions – RFP reinforcement, and blue regions – steel fibres. Recalculated
densities are shown on the colour scales to the left (kg m-3
).
0
2800
5600
8400
11200
14000
0
3600
7200
10800
14400
18000
0
3400
6800
10200
13600
17000
0
3600
7200
10800
14400
18000
Z
Z
Y
Z
Y

38
Figure 19 –Specimen HB1 (2,8×3,1×8,8cm) cast horizontally (0,16×6 mm fibres).
Figure 20 – Specimen HB3 (2,9×3,2×9,0cm) cast horizontally (0,16×6 mm fibres). Recalculation of CT
numbers into densities of material components of the UHPFRC specimens. Black regions indicate cracks and
air voids, green regions – coarse aggregates (Hyperit), red regions – RFP reinforcement, and blue regions –
steel fibres. Recalculated densities are shown on the colour scales to the left (kg m-3
).
1)
2)
Figure 21 –Specimen VB1 (2,6×3,2×9,0cm) cast vertically (tall, 0,4×12,5 mm fibres): suggested possible
crack location
0
2800
5600
8400
11200
14000
0
2800
5600
8400
11200
14000
0
2000
4000
6000
8000
10000
0
2200
4400
6600
8800
11000
Z
Y
Z
Y

39
5. CONCLUSION
The purpose of the present study was to investigate the suitability of UHPFRC material for
construction of TPs for bucket foundation for offshore wind turbines as an alternative to the current
welded steel structure solution. One of the prerequisites for the successful application of UHPFRC
is that it is possible to use a very high concentration of large reinforcing bars with a durable and
crack-free cover layer. Hence, fairly high fibre content is required in the UHPFRC matrix, and the
fibres must be able to prevent surface cracking in the TP because of the aggressive marine service
environment, as well as to secure adequate reinforcement of the matrix around the main reinforcing
bars in order to prevent debonding.
With the purpose of securing a simple placement procedure suited for in-situ casting, the
UHPFRC material was designed to have a good workability and cohesion to make the material self-
compacting, allowing it to be cast without any need for vibration. The developed UHPFRC material
was cast into samples using various placement procedures, and the fibre distribution and orientation
was subsequently studied using CT scanning technique. CT scanning is a relatively new method for
examination and analysis of volume images of complex microstructures, such as fibre reinforced
composites. The CT scanning method yielded excellent results and provided direct pictures of the
fibre distribution in the specimens, characterized by the fibre orientation numbers and the fibre
volume. Moreover, the calculated fibre content numbers were very close to the real one (2 %)
confirming reliability of this method. Also, this technique allowed seeing surface and inner cracks
and air voids in the body of a specimen.
Overall, uniform fibre distribution and fibre volume were observed in all the UHPFRC
specimens. No particular fibre alignment based on the way of casting was detected with a slight
tendency to a perpendicular alignment in the direction of the vertical axis (z-direction) for the
specimens cast horizontally. Fairly uniform fibre distribution was detected for all specimens in all
directions. Moreover, the fibre volume at various sections of the specimen was not affected by the
fibre type and the way of casting. The behaviour of longer fibres (0,4×12,5mm) was not remarkably
different from the behaviour of the shorter steel fibres (0,16×6mm).
A few normally occurring air pores and relatively large air pockets were traced in some of
the tested specimens (with less than 10% of all the pictures of the specimens containing any flaws).
“Hairline cracks” were only observed on the surface of the specimen VB1 positioned at the top of
the tall sample 3 cast vertically, which could be explained by possible drying of the concrete surface
and insufficient hydration caused by water evaporation due to inadequate sealing with plastic
sheets. These cracks remained, however, on the surface, i.e. neither did they penetrate deep into the
main body of the sample, nor did they cross the main reinforcement. As for the other specimens,

40
absence of these surface cracks indicated, as expected, that the fine randomly oriented fibre
distribution in the cover layer prohibited the occurrence of such cracks. Moreover, should a surface
hairline crack appear anyway, its bridging is believed to be taken care of by the fibers crossing the
crack plane parallel to the normal of the crack plane or to a lesser extent by the inclined (oblique)
steel fibres. Finally, exceptionally durable UHPFRC material can be a promising material for future
TP construction.
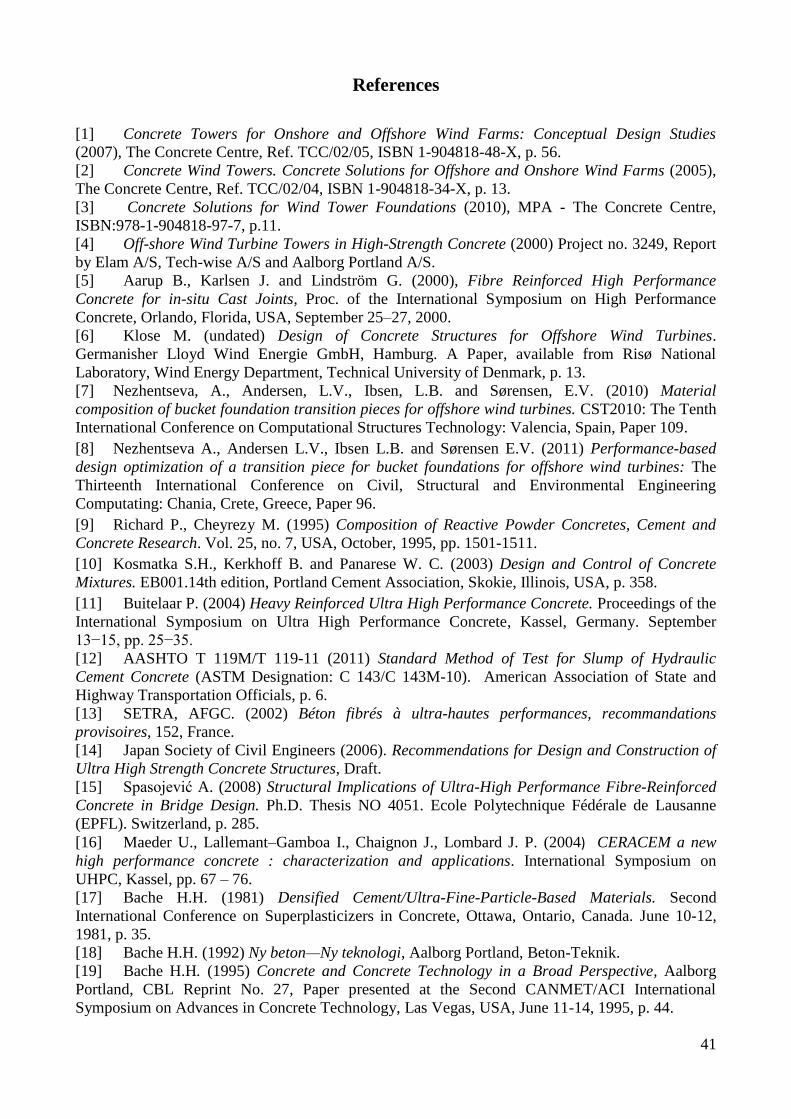
41
References
[1] Concrete Towers for Onshore and Offshore Wind Farms: Conceptual Design Studies
(2007), The Concrete Centre, Ref. TCC/02/05, ISBN 1-904818-48-X, p. 56.
[2] Concrete Wind Towers. Concrete Solutions for Offshore and Onshore Wind Farms (2005),
The Concrete Centre, Ref. TCC/02/04, ISBN 1-904818-34-X, p. 13.
[3] Concrete Solutions for Wind Tower Foundations (2010), MPA - The Concrete Centre,
ISBN:978-1-904818-97-7, p.11.
[4] Off-shore Wind Turbine Towers in High-Strength Concrete (2000) Project no. 3249, Report
by Elam A/S, Tech-wise A/S and Aalborg Portland A/S.
[5] Aarup B., Karlsen J. and Lindström G. (2000), Fibre Reinforced High Performance
Concrete for in-situ Cast Joints, Proc. of the International Symposium on High Performance
Concrete, Orlando, Florida, USA, September 25–27, 2000.
[6] Klose M. (undated) Design of Concrete Structures for Offshore Wind Turbines.
Germanisher Lloyd Wind Energie GmbH, Hamburg. A Paper, available from Risø National
Laboratory, Wind Energy Department, Technical University of Denmark, p. 13.
[7] Nezhentseva, A., Andersen, L.V., Ibsen, L.B. and Sørensen, E.V. (2010) Material
composition of bucket foundation transition pieces for offshore wind turbines. CST2010: The Tenth
International Conference on Computational Structures Technology: Valencia, Spain, Paper 109.
[8] Nezhentseva A., Andersen L.V., Ibsen L.B. and Sørensen E.V. (2011) Performance-based
design optimization of a transition piece for bucket foundations for offshore wind turbines: The
Thirteenth International Conference on Civil, Structural and Environmental Engineering
Computating: Chania, Crete, Greece, Paper 96.
[9] Richard P., Cheyrezy M. (1995) Composition of Reactive Powder Concretes, Cement and
Concrete Research. Vol. 25, no. 7, USA, October, 1995, pp. 1501-1511.
[10] Kosmatka S.H., Kerkhoff B. and Panarese W. C. (2003) Design and Control of Concrete
Mixtures. EB001.14th edition, Portland Cement Association, Skokie, Illinois, USA, p. 358.
[11] Buitelaar P. (2004) Heavy Reinforced Ultra High Performance Concrete. Proceedings of the
International Symposium on Ultra High Performance Concrete, Kassel, Germany. September
13−15, pp. 25−35. [12] AASHTO T 119M/T 119-11 (2011) Standard Method of Test for Slump of Hydraulic
Cement Concrete (ASTM Designation: C 143/C 143M-10). American Association of State and
Highway Transportation Officials, p. 6.
[13] SETRA, AFGC. (2002) Béton fibrés à ultra-hautes performances, recommandations
provisoires, 152, France.
[14] Japan Society of Civil Engineers (2006). Recommendations for Design and Construction of
Ultra High Strength Concrete Structures, Draft.
[15] Spasojević A. (2008) Structural Implications of Ultra-High Performance Fibre-Reinforced
Concrete in Bridge Design. Ph.D. Thesis NO 4051. Ecole Polytechnique Fédérale de Lausanne
(EPFL). Switzerland, p. 285.
[16] Maeder U., Lallemant–Gamboa I., Chaignon J., Lombard J. P. (2004) CERACEM a new
high performance concrete : characterization and applications. International Symposium on
UHPC, Kassel, pp. 67 – 76.
[17] Bache H.H. (1981) Densified Cement/Ultra-Fine-Particle-Based Materials. Second
International Conference on Superplasticizers in Concrete, Ottawa, Ontario, Canada. June 10-12,
1981, p. 35.
[18] Bache H.H. (1992) Ny beton—Ny teknologi, Aalborg Portland, Beton-Teknik.
[19] Bache H.H. (1995) Concrete and Concrete Technology in a Broad Perspective, Aalborg
Portland, CBL Reprint No. 27, Paper presented at the Second CANMET/ACI International
Symposium on Advances in Concrete Technology, Las Vegas, USA, June 11-14, 1995, p. 44.

42
[20] Buitelaar P. (1999) Ultra thin white toppings using high strength high performance
concretes. (in Dutch). Cement 1999 nr. 7.
[21] Buitelaar, P. (2002) Ultra Thin Heavy Reinforced High Performance Concrete Overlays. 6th
International Symposium on Utilization of High Strength / High Performance Concrete, Leipzig,
Germany.
[22] Bache A.M. (2005) New Concrete Technology – New Architectural Form. Visions for a New
Architechtural Form using New Concrete Technology in giant structures.
[23] Ducorit® Data sheet ITW Densit ApS www.densit.com 2.10.2012 [24] MASTERFLOW®9500 Fatigue Resistant Exagrout – Study Results. Brochure by BASF The
Chemical Company, pp.8. [25] MASTERFLOW®9500 Ultra-high strength offshore windmill grout. Brochure by BASF The
Chemical Company, pp.12. [26] MASTERFLOW® Well-founded expertise for wind power. Brochure by BASF The Chemical
Company, pp.12. [27] Gutiérrez E. et al. (2003) A wind turbine tower design based on the use of fibre-reinforced
composites. MEGAWIND FP5 Project, ENK5-CT-2000-00328, EUR 20664 EN, European
Communities, p. 163.
[28] Redaelli D. and Muttoni A. (2007), Tensile Behaviour of Reinforced Ultra-High
Performance Fibre Reinforced Concrete Elements. Proc. of fib Symposium: Concrete Structures:
Stimulators of Development, Dubrovnik, Croatia, May 20–23, 2007, pp. 267-274.
[29] Perry V. H. and Seibert P. J. (2011), Lafarge Working with Ductal Ultra-High Performance
Concrete. CPI−Concrete Plant International. North America Edition. Special Print/ Concrete
Technology. Nr.1, February 2011, p.5.
[30] Perry V. H. and Seibert P. J. (2011), Lafarge Equipment and Production Techniques with
UHPC. CPI−Concrete Plant International. North America Edition. Special Print/ Concrete
Technology. Nr.2, April 2011, p.5.
[31] Perry V. H. and Seibert P. J. (2011), Lafarge Manufacturing Ultra-High Performance
Concrete Structural Products. CPI−Concrete Plant International. North America Edition. Special
Print/ Concrete Technology. Nr. 3, June 2011, p.6.
[32] Aarup B. Fibre Reinforced High Performance Concrete for Precast Applications.
[33] CRC®−durability. CRC® Technology. http://www.CRC®-tech.com/Files/Billeder/CRC®-
tech_uk/docs/CRC®_durability.pdf 11.03.2013
[34] Markovic I. (2006) High-Performance Hybrid-Fibre Concrete. Development and
Utilisation, PhD Thesis, DUP Science, Delft University Press, Netherlands, January.
[35] Li V. C., Fischer G. (2002) Reinforced ECC – An Evolution from Materials to Structures,
Proceedings of the 1st fib congress - Concrete Structures in the 21st Century, Osaka, pp. 105 -122.
[36] ABAQUS Analysis. User’s Manual. Version 6.9 (2009), Dessault Systèmes Simulia Corp,
Providence, RI, USA.
[37] United States Patent No. 4,979,992 (1990) Compact Reinforced Composite. Inventor –
Bache H.H., Klokkerholm, Denmark. Issued on December 25, 1990.
[38] Barnett S. J., Lataste J.-F., Parry T., Millard S.G. and Soutsos M. N. (2010) Assessment of
Fibre Orientation in Ultra High Performance Fibre Reinforced Concrete and its Effect on Flexural
Strength. Material and Structures, Vol. 43, No. 7, pp. 1009-1023.
[39] Kim S.W, Kang S.T., Park J.J. and Ryu G.S. (2008) Effect of Filling Method on Fibre
Orientation & Dispersion and Mechanical Properties of UHPC. Proceedings of Second
International Symposium on Ultra High Performance Concrete, Kassel, Germany. March 2008
(Kassel University Press), pp. 185-192.
[40] Pansuk W., Sato H., Sato Y. and Shionaga R. (2008) Tensile Behaviors and Fibre
Orientation of UHPC. Proceedings of Second International Symposium on Ultra High Performance
Concrete, Kassel, Germany. March 2008 (Kassel University Press), pp. 161-168.
[41] Secutec S6. Industrial Castables. Technical Data by Contec ApS, Højbjerg, Denmark.
Product No. 02.02.

43
[42] Secutec Binder. Cementitious binders. Technical Data by Contec ApS, Højbjerg, Denmark.
Product No. 01.04.
[43] Contec ApS Our technology http://www.contec-aps.com/our-technology.html 22.03.2013.
[44] ASTM C230/C230M – 08 (2008) Standard Specification for Flow Table for Use in Tests of
Hydraulic Cement, July, 2008, p.6.
[45] BS EN 12390-3:2002 (2002) British Standard. Testing hardened concrete – Part 3:
Compressive strength of test specimens. British Standards Institution, p.16.
[46] Graybeal B. A. (2007) Compressive Behavior of Ultra-High-Performance Fiber-Reinforced
Concrete. ACI Materials Journal. Vol. 104, No. 2, March-April 2007, pp. 146-152.
[47] Toutlemonde F. and Resplendino J. (2011) Designing and Building with UHPFRC State of
the Art and Development. Proceedings of UHPFRC symposium in Marseille (France), November
17-18, 2009, London, p. 814.
[48] FiReP® Product Brochure – Durability for the future. http://www.tunnels-
directory.co.uk/adverts/ITD10852wpb.pdf 11.03.2013
[49] Report on tests of UHPFRC in the laboratory - Part A. (2005) SAMARIS. Sustainable and
Advanced MAterials for Road InfraStructure WP 14: HPFRCC (High Performance Fibre
Reinforced Cementitious Composites) for rehabilitation. Deliverable D18 – Part A. Document
number: SAM_GE_DE18v02_01, Version: 2, 01.02.2005, p.212.
[50] Perry V.H., Vicenzino E., Culham G., Zakariasen D. and Chow T.S. (2005) First Use of
UHPFRC in Thin Precast Concrete Roof Shell for Canadian LRT Station. PCI Journal. September-
October 2005, pp. 50-67.
[51] Tue, N. V., Henze, S., Küchler, M., Schenck G. and Wille K. (2006) Ein optoanalytisches
Verfahren zur Bestimmung der Faserverteilung und -orientierung in stahlfaserverstärktem UHFB,
Beton- und Stahlbetonbau, Volume 102, Issue 10, October 2007, pp. 674–680.
[52] Lataste J.F., Behloul M. and Breysse D. (2008) Characterisation of fibres distribution in a
steel fibre reinforced concrete with electrical resistivity measurements. NDT&E International, Vol.
41, Issue 8, December 2008, pp. 638-647.
[53] Ozyurt N., Woo L.Y., Mason T.O. and Shah S.P. (2006) Monitoring Fiber Dispersion in
Fiber-Reinforced Cementitious Materials: Comparison of AC-Impedance Spectroscopy and Image
Analysis. ACI Materials Journal, Volume 103, No. 5, September-October 2006, pp. 340–347.
[54] Woo L.Y., Wansom S., Ozyurt N., Mu B., Shah S.P., Mason T.O. (2005) Characterizing
fiber dispersion in cement composites using AC Impedance Spectrometry. Cement and Concrete
Composites, Volume 27, Issue 6, July 2005, pp. 627–636.
[55] Ferrara L., Faifer M. and Toscani S. (2012) A magnetic method for non destructive
monitoring of fiber dispersion and orientation in steel fiber reinforced cementitious composites—
part 1: method calibration, Materials and Structures, Volume 45, Issue 4, April 2012, pp. 575–589.
[56] Ferrara L., Faifer M., Muhaxheri M. and Toscani S. (2012) A magnetic method for non
destructive monitoring of fiber dispersion and orientation in steel fiber reinforced cementitious
composites. Part 2: Correlation to tensile fracture toughness, Materials and Structures, Volume 45,
Issue 4, April 2012, pp. 591–598.
[57] Torrents J.M., Blanco A., Pujadas P., Aguado A., Juan-Garcia P. and Sánchez-Moragues
M.À. (2012) Inductive method for assessing the amount and orientation of steel fibers in concrete,
Materials and Structures, Volume 45, Issue 10, October 2012, pp. 1577-1592.
[58] Schnell J., Breit W. and Schuler F. (2011) Use of Computer-Tomography for the Analysis of
Fibre Reinforced Concrete, fib Symposium, Prague, Session 2B-8: Construction Technology, pp.
583-586.
[59] Schnell J., Schladitz K. and Schuler F. (2010) Richtungsanalyse von Fasern in Betonen auf
Basis der Computer-Tomographie. Beton- und Stahlbetonbau, Volume 105, Issue 2, February
2010, pp. 72−77.
[60] Kak A. C. and Slaney M. (1988) Principles of Computerized Tomographic Imaging. IEEE
Press.

44
[61] Cho Z. H., Jones J. P. and Singh, M. (1993) Foundations of Medical Imaging. John Wiley
and Sons. New York, p. 586. [62] Herman G. T. (2009) Fundamentals of computerized tomography: Image reconstruction
from projection, 2nd edition, Springer.
[63] Wang C.H., Willis D.L., Loveland W.D. (1975) Characteristics of Ionizing radiation,
Radiotracer Methodology in the Biological Environmental. And Physical Sciences, Prentice-Hall,
Englewood Cliffs, NJ, pp. 39−74. [64] Lambert J.H. (1760) Photometria sive de mensura et gradibus luminis, colorum et
umbrae (Photometry, or, On the measure and gradations of light, colors, and shade) (Augsburg
("Augusta Vindelicorum"), Germany: Eberhardt Klett. See especially p. 391
[65] Beer (1852) Bestimmung der Absorption des rothen Lichts in farbigen
Flüssigkeiten (Determination of the absorption of red light in colored liquids), Annalen der Physik
und Chemie, vol. 86, pp. 78–88.
[66] Köser C., Hansen S.B., Andersen L.V., Rasmussen M.R. and Thøgersen L. (2012)
Evaluation of Computed Tomography as a Tool for Characterizing Homogenization and Hydration
Process of a Bentonite Seal. Applied Clay Science.
[67] MAVI – Modular Algorithms for Volume Images V1.4.1, , Fraunhofer ITWM, Image
Processing Department, April 2012. http://www.itwm.fraunhofer.de/en/departments/image-
processing/microstructure-analysis/mavi.html 16.04.2013.
[68] Strategic Targeted Research Project (2009) Recommendations for the Use of UHPFRC in
Composite Structural Members Rehabilitation. Log Èezsoski Bridge Arches. Assessment and
Rehabilitation of Central European Highway Structures, Deliverable D14, Document number:
ARCHES-05-DE14, Date: 27.11.2009, pp. 59.