aae 451 aircraft design critical design review bolierxpress team members oneeb bhutta, matthew...
TRANSCRIPT

AAE 451 Aircraft Design
Critical Design ReviewBolierXpress
Team MembersOneeb Bhutta, Matthew Basiletti , Ryan Beech, Mike Van
Meter

11ft
6ft
3-D Views

Aerodynamic Design Issues
Lift
• Low Reynolds Number Regime
• Slow Flight Requirements
Drag
• Power Requirements
• Accurate Performance Predications
Stability and Control
• Trimmability
• Roll Rate Derivatives

Low Reynolds Number Challenges
•Laminar Flow -more Prone to Separation
•Airfoil Sections designed for Full-sized Aircraft don’t work well for below Rn=800,000
•Our Aircraft Rn=100,000-250,000
Separation Bubble-to be avoided!

Airfoil Selection
Wing:Selig S1210
CLmax = 1.53 Incidence= 3 deg
Tail sections:flat plate for Low ReIncidence = -5 deg
Re = 150e3
0
0.01
0.02
0.03
0.04
0.05
0.06
-0.2 0 0.2 0.4 0.6 0.8 1 1.2 1.4 1.6 1.8 2 2.2
Cl
Cd
FX63-137
S1210
S1223
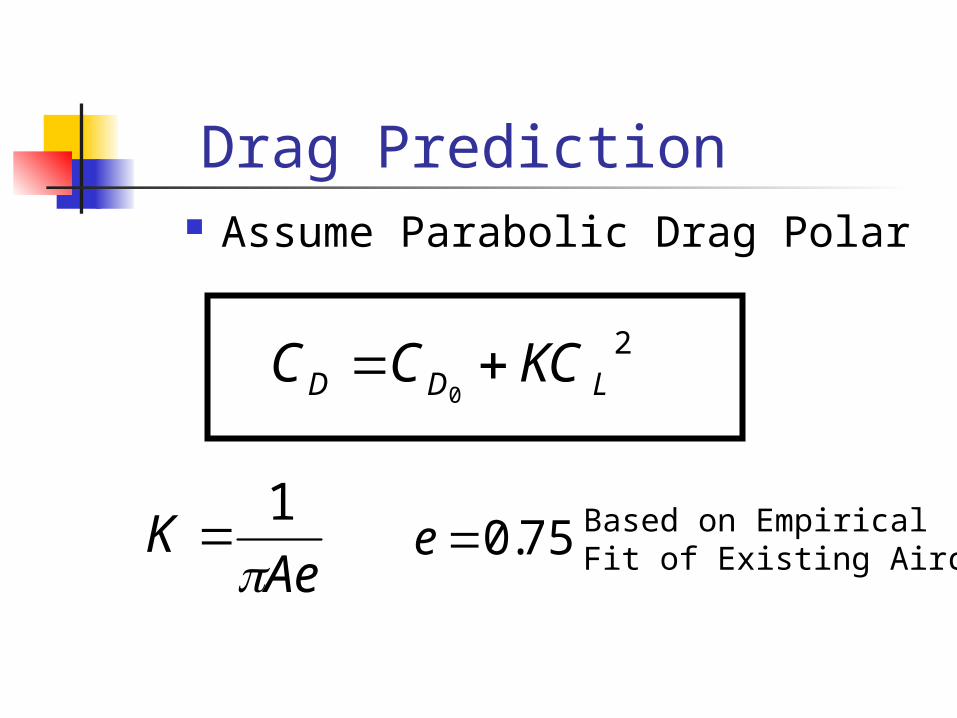
Drag Prediction Assume Parabolic Drag Polar
2
0 LDD KCCC
AeK
1
75.0e Based on Empirical Fit of Existing Aircraft

Parasite Drag
ref
wetfDo S
QFFSCC
(Ref. Raymer eq.12.27 & eq.12.30)
58.2(Re)10log
455.02.1fC
Drag Build-up Method of Raymer
Blasius’ Turbulent Flat Plate- Adjusted for Assumed Surface Roughness

Drag Polar
0.2 0.4 0.6 0.8 1 1.2 1.4 1.6 1.80
0.02
0.04
0.06
0.08
0.1
0.12
0.14
0.16
Aircraft Drag Polar
CL
CD CDiCDo

Power Required
15 20 25 30 35 4016
18
20
22
24
26
28
30
32
Velocity [ft/s]
Po
wer
Req
uir
ed [
ft-l
b/s
]
Predict:• Power required for cruise
• Battery energy for cruise

Aerodynamic Properties
Wetted area = 44.5 sq.ft.Span Efficiency Factor = 0.75CL=5.3 / rad
CL e = 0.4749 /radL/Dmax = 15.5Vloiter = 24 ft/sCLmax = 1.53CLcruise = 1.05Xcg = 0.10-0.38 (% MAC)Static Margin = 0.12 at Xcg = 0.35

Stability Diagram
elev deflect=-8 deg
-4
0
4
8
0 0.2 0.4 0.6 0.8 1 1.2 1.4 1.6 1.8-0.4
-0.3
-0.2
-0.1
0
0.1
0.2
0.3
CL
Cm
cg
elev deflect=-8 deg
-4
0
4
8

Flow Simulation
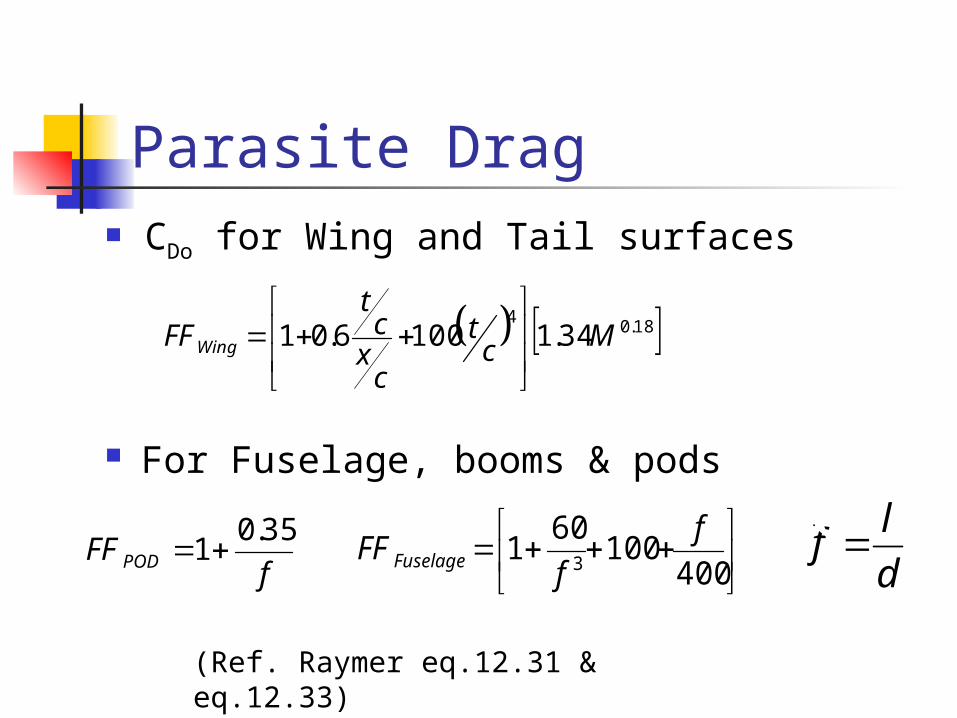
Parasite Drag CDo for Wing and Tail surfaces
18.04
34.11006.01 Mct
cx
ct
FFWing
d
lf
400100
601
3
f
fFFFuselagef
FFPOD
35.01
(Ref. Raymer eq.12.31 & eq.12.33)
For Fuselage, booms & pods

Tail GeometryHorizontal Tail:Area = 2.2Span = 3.0ft Chord = 0.73ftVh = 0.50
Sc
Sxv hh
h
Vertical Tail- 25% added
Area = 1.75 sq.ftSpan = 1.63 ft Chord = 0.60 ftVv = 0. 044
Sb
SXV vv
v

Control Surface Sizing:Elevator
Area Ratio = 0.30 Chord = 2.7 in.
Rudder Area Ratio = 0.40
Single rudder of chord = 7.5 in.
AileronsArea Ratio = 0.10Aileron chord = 3 in.

Equipment Layout & CG.
Rotation angle = 10deg
Tip Back angle= 15deg
Controls equipmentPropulsion componentAirframe component
17.54 in.
Miscellaneous Weight

Equipment Layout (3-D)

Landing Loads
Vland=1.3Vstall=25ft/s
lbinVKe vertgW 6.72
21
kkSdsWorkd
5.00
For d = 1 in., k = 15.2 lb/in
= -5 degVvert=2.2ft/s
For 1 inch strut travel, peak load = 15.2 lb
spar = 240 psi on landing

Static Margin, Aerodynamic Center, and c.g.
Xac = 0.46
Xcg = 0.35
SM = 0.11
cgac XXSM

Horizontal and Vertical Tail Sizing
v
refvv x
bSVS
h
refhh x
cSVS
Vh - Horizontal tail volume coefficient = 0.50Vv - Vertical tail volume coefficient = 0.044
22.2 ftSh 275.1 ftSv

Control Surface Sizing Based on historical data from
Roskam Part II Tables 8.1 and 8.2.
ref
a
S
S
v
r
S
S
h
e
S
S
Homebuilts Single Engine
0.095 0.08
0.42 0.36
0.44 0.42

Control Surface Sizing (cont.) Sa = 1.35ft2
Sr = 0.80ft2
Se = 1.00ft2
Max. surface deflection is 15 deg.
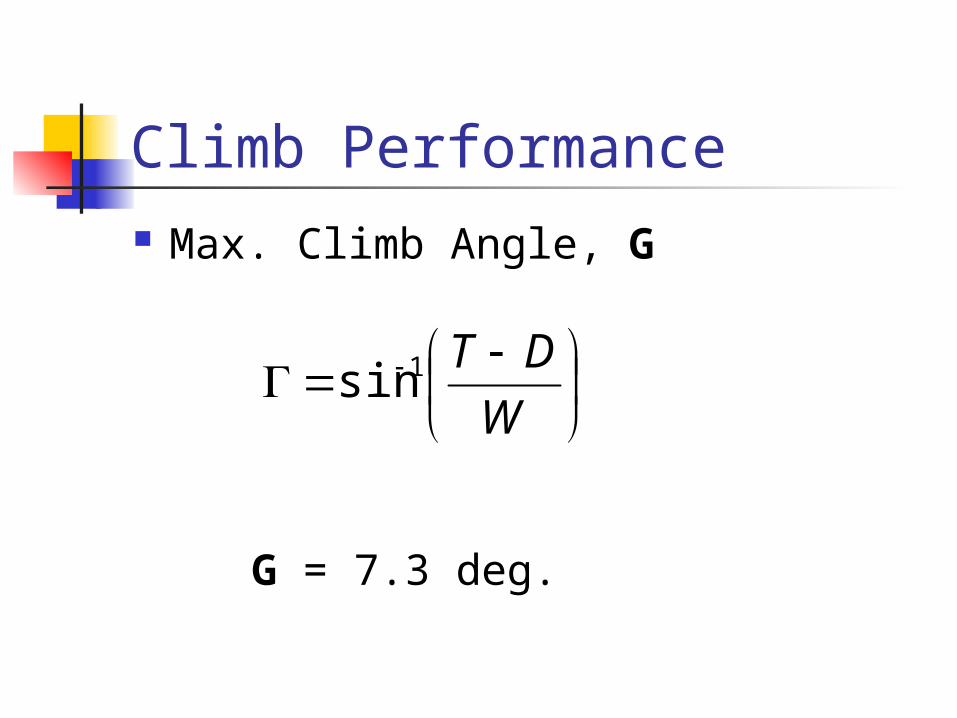
Climb Performance Max. Climb Angle, G
W
DT1sin
G = 7.3 deg.

Turning Performance Maximum turn rater = 50ft
Vmax = 28ft/s
Y= 0.28 rad/s

Propulsion Design Issues
PowerPower requiredPower available
EnduranceCan we complete the mission
VerificationMotor test to take place this week

Power
Power required is determined by aircraftPower available comes from the motor 15 20 25 30 35 40 45 50
15
20
25
30
35
40
45
50
55
Velocity [ft/s]
Pow
er R
equi
red
[ft-
lb/s
]
Power Required Power Available

System EfficienciesPropeller
60-65%
Gearbox95%
Motor90%
Speed Controller95%
Total System Efficiency
50.7%

System Components
PropellerFreudenthaler 16x15 and 14x8 folding
Gearbox“MonsterBox” (6:1,7:1,9.6:1)
MotorTurbo 10 GT (10 cells)
Speed ControllerMX-50

Economics
Preliminary Design525 man-hours @ $75 = $39,375
Testing50 man-hours @ $75 = $3,750$81.70 in materials

Economics
Prototype Manufacturing300 man-hours @ $75 = $22,500$417.35 in materials
Flight Testing$900
Prototype manufacturing budget$200 max

The Budget

Total Project Cost The Bottom Line
$67,024.05

Questions?