a2dominion powerpoint template
TRANSCRIPT

Investor Update
November 2018

Overview

Page 3 Investor Update – November 2018Confidentiality
A2Dominion Group – A Reminder
• Over 37,000 units in London and the South East
• Social/affordable
• LCHO
• Supported/sheltered
• Student accommodation
• Private rented and private sale
• Working across 81 local authorities, with schemes in development pipeline exceeding 300 units in 11 LAs.
• Member of the G15
• A major developer and facilities manager with long track-record
• Around 7,800 units in development pipeline (2,000 through Joint Ventures)
• Compliant grades G1 / V2 HCA rating
• 99.2% of units compliant with Decent Homes standard
• Circa 930 staff operating from 4 key offices

Page 4 Investor Update – November 2018Confidentiality
Key Strategic Changes 2017/18
• Board Consolidation
• Ian Cox appointed new Group Chair with effect from 01/08/17
• Anne Waterhouse appointed to the Board and appointed Deputy Chief Executive
• Entered partnership talks with Radian
• Subsequently mutually agreed that partnership not viable due to respective ongoing ‘’change’’ programmes.
• Embedding our “Fit for the Future” change programme:
• New premises secured with dedicated personnel.
• Procurement process for new IT system completed.
• £20m investment over 3 years.
• Overhaul of employee reward system
• Alignment of employee performance to business strategy.
Page 5 Investor Update – November 2018Confidentiality
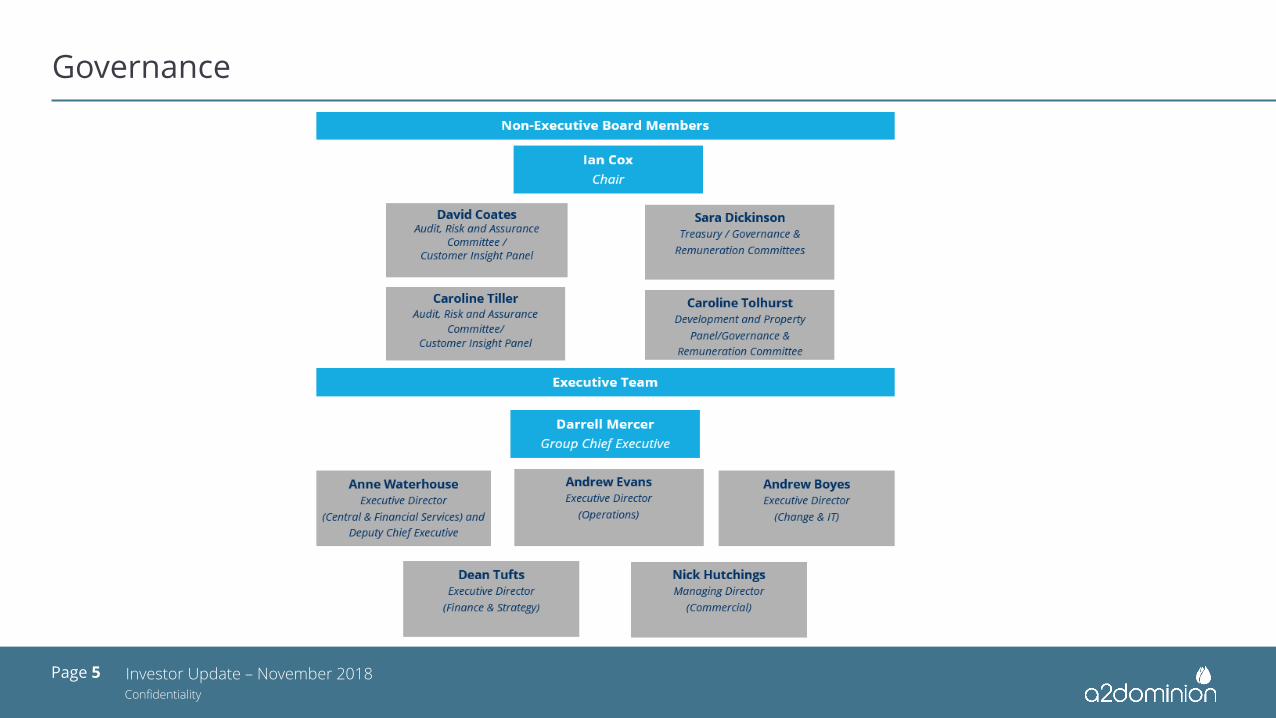
Governance

Page 6 Investor Update – November 2018Confidentiality
Group Structure

Page 7 Investor Update – November 2018Confidentiality
Achievements in 2017/18
• Delivered 954 new homes with a variety of tenures – affordable and private rented, shared ownership and private sale.
• Formed Strategic Partnership with the GLA to provide 1,900 affordable homes as part of the 2016/21 London Affordable Homes programme.
• Achieved total efficiency savings of £11.2m in 2018 as a result of procurement activity and long term efficiency savings.
• Secured £5.8m for our customers in extra housing benefits, grants and charity payments.
• Post March 2018 - Arranged new loan facilities of approx.£235m with four new lenders to the Group – two £50m RCF bank facilities, one £60m unsecured FRN, and an uncommitted facility of $100m for a future note issue.
• Several Awards:
• Hana Awards 2018: Winner of Best Risk Management
• Evening Standard New Homes Award 2018 : Highly Commended for Queens Wharf Hammersmith
• Oxfordshire Property Awards 2018: Winner of Best Housing Development.
• What House? Awards 2017: Winner of Best Sustainable Development.

Page 8 Investor Update – November 2018Confidentiality
Financial Performance 2018
• Operating Surplus of £100.2m for 2017/18 (2016/17: £119.9m), Net Surplus of £92.5m before adjusting items (2016/17:£84.1m), Operating margin of 28.9% (2016/17: 28.6%).
• Sales (of both new and existing properties) contributing profit of £63.5m (2016/17: £45.0m) for reinvestment in new and existing homes:
2017/18 2016/17
Sale of Fixed Assets £13.4m £13.7m
First Tranche Sales £5.2m £ 6.1m
Outright Sale £3.7m £26.4m
Joint Ventures £41.2m (£1.2m)
Totals £63.5m £45.0m
• £24.7m spent on planned and major repairs (of which £12.0m capitalised)
• Good performance against financial covenants:
• Interest cover: A2D South - 241% (limit > 110%)
A2D Homes - 286% (limit > 110%)
• Gearing: A2D South – 50%, (limit < 80%)
A2D Homes – 43% (limit < 65%)

Page 9 Investor Update – November 2018Confidentiality
Financial Performance – Half Year Unaudited Results – September 2018
6 Months to 6 Months to
30-Sep-18 30-Sep-17
£m £m
Turnover 197.8 133.2
Rent 111.2 109.2
Sales 73.9 11.6
Social Housing Grant Amortisation 8.3 7.9
Other Income 4.4 4.5
Operating Surplus 52.2 56.3
Operating M argin 26.4% 42.3%
Share of Joint Venture Surplus 2.4 16.7
Interest (23.5) (26.0)
Surplus for the Period 31.1 47.0
Sep-18 Mar-18
£m £m
Fixed Assets 3,243.0 3,174.6
Current Assets 652.1 568.2
Creditors (2,925.4) (2,803.5)
Net Assets 969.7 939.3
Revenue Reserves 962.6 932.6
Other Reserves 7.1 6.7
Net Equity 969.7 939.3
Management Accounts Consolidated Statement of
Comprehensive Income
Management Accounts Consolidated Statement of
Financial Position

Stock

Page 11 Investor Update – November 2018Confidentiality
Stock Profile & Geography
• 37,248 units owned and managed spread across 81 local authorities
• In regions of
• high property value, &
• high market rents
• Continued strong demand
• 141 applications/bids on average per property
let (2017: 109)

Page 12 Investor Update – November 2018Confidentiality
Stock Type & Age

Benchmarking

Page 14 Investor Update – November 2018Confidentiality
Performance Indicators
Operational performance area Performance indicator Target
performance
2018
Actual
performance
2018
Actual
performance
2017
Provide new quality homes and placesSales receipts against projection £57.9m £57.6m £129.8m
New homes completed over past two years 1,800 1,708 1,881
Customer led services Satisfaction with Customer Services Centre>85% 82.5% 82.8%
Satisfaction with responsive repairs service >85% 86.2% 83.0%
Repair chaser calls <25% 18.5% 33%
Rental arrears – general needs homes <3.52% 3.35% 3.52%
Invest in homes and local communitiesNo. of homes refurbished (planned works) 1,363 622 692
Decent Homes compliance 100.0% 99.2% 98.6%
No. of homes with a valid gas safety record 100.0% 99.8% 99.8%
Strengthen our business
Interest cover (excluding sales and surplus from
joint venture) >120% 172.0% 180.5%
Results vs. budget – net surplus > Budget Yes Yes
Staff turnover <13.0% 14.5% 15.1%
Staff sickness levels <7.0 days 4.8 days 6.6 days

Page 15 Investor Update – November 2018Confidentiality
Operating Efficiencies
2018 2017 g15 average
Overall social housing cost per unit (£) 3,551 3,748 4,725
Management cost per unit (£) 1,151 1,083 1,299
Service charge cost per unit (£) 739 748 660
Maintenance cost per unit (£) 858 1,115 1,096
Major repairs cost per unit (£) 346 272 1,039
Other social Housing costs per unit (£) 457 531 631
Rent collected 99.6% 100.4% 99.8%

Welfare Reform

Page 17 Investor Update – November 2018Confidentiality
Welfare Reform Update
• The Welfare Reform working group continues to monitor and report regularly on the effects of welfare reform and the effectiveness of A2D’s action plans:
• Number of tenants affected by the bedroom tax is 862 (2017: 862);
• General needs rent arrears at March 2018 were 3.35% (2017: 3.52%);
• The number of general needs tenants paying via direct debit has increased to 33.73% (2017: 30%, 2016: 26.83%);
• Tenancy sustainment team helped tenants secure £4.0m in Housing Benefit from applications and renewals received;
• Phased roll out of Universal Credit is continuing – currently 946 live UC claims, all of which are being actively monitored;
• A2D awarded Trusted Partner status by DWP to help claimants manage direct payment of their rent.
• Key challenges for the future include:
• Accelerated rollout of UC in local authorities;
• Specific UC issues including ‘5 week no payment’ & sanctions on claimants;
• Increases in tribunals, Employment and Support Allowance (ESA) appeals and council tax complications.

Page 18 Investor Update – November 2018Confidentiality
Direct Payment of Benefits / Paying Relationship
• 62.7% of A2D’s rental income is paid directly by residents
• 81.1% of residents pay all, or part of their rent
Tenure% of tenancies
receiving HB
General needs/affordable 48.87%
Supported/housing for older people 67.80%
Shared ownership 1.45%
Key worker 0.97%
Temporary accommodation 36.26%
Market Rented 1.94%
Student Accommodation 0.0%
Total HB Tenants 31.63%

Development Plan

Page 20 Investor Update – November 2018Confidentiality
Development Activities & Track Record
• A2Dominion has a strong track record in developing property. In the last 10 years we have developed around 9,500 units.
• In-house developer keeps direct costs low.
• Strong relationships with LAs and other developers/house builders.
Year Social RentIntermediate/Private Rent
Shared Ownership
Private Sale Other Totals
2008/9 820 0 626 78 29 1,553
2009/10 719 165 224 73 72 1,253
2010/11 664 134 137 131 41 1,107
2011/12 432 35 386 247 1 1,101
2012/13 387 0 130 119 0 636
2013/14 141 0 121 216 103 581
2014/15 304 0 69 206 0 579
2015/16 333268
196 330 0 1,127
2016/17 322 182 71 179 0 754
2017/18 221 148 101 406 78 954
Totals 4,343 932 2,061 1,985 324 9,645

Page 21 Investor Update – November 2018Confidentiality
Development Strategy & Bids
• Strategy for 2015 – 2020 is to develop between 900 and 1,200 units each year.
• Emphasis on location and ROI rather than quantity.
• Tenure split to be 40% Private Sale, 20% Shared Ownership, 20% Affordable Rent and 20% Private Rent.
• Regional split of 50% London and 50% South East (outside London).
Grant Secured (2015-18 programme)
• GLA: 290 Rented, 60 Shared Ownership
• HCA: 135 Rented, 19 Shared Ownership
• Total grant secured: £18.1m
Grant Secured (2018-21 programme)
• GLA: We have formed a strategic partnership with the GLA, agreeing to deliver 60% of affordable homes across our London programme, securing over £70m of grant funding to provide 1,900 affordable homes.
• HCA: 120 Shared Ownership homes
• Total grant secured: £73.8m
Grant Secured (specialised programmes)
• Homes England: 37 bed spaces for vulnerable adults in Oxford, total grant secured £1.7m

Page 22 Investor Update – November 2018Confidentiality
Development Controls
• The board and management team have put controls and appraisal checks in place to manage the risk of this activity.
• A2D approaches development with the following guiding principles:
• Affordable Housing development in London/South East requires capital subsidy;
• The subsidy must be provided from surpluses generated elsewhere in the Group;
• Maintaining A2D’s financial strength, requires a limit to the level of subsidy;
• There must be a balance between growth in Affordable Housing and the need to maintain and improve financial strength.

Page 23 Investor Update – November 2018Confidentiality
Development & Sales Summary
FY 2019 FY 2020 FY 2021 FY 2022 FY 2023
Units developed for rent
Social and affordableApproved 160 196 157 235 316
Blue Sky 0 0 30 78 0
Market rentApproved 337 0 211 0 0
Blue Sky 0 0 30 78 0
TotalApproved 497 196 368 235 316
Blue Sky 0 0 60 156 0
Units sold
Shared ownership - first tranche
Approved 79 205 172 78 225
Blue Sky 0 0 30 78 0
Private saleApproved 355 217 50 420 372
Blue Sky 0 0 63 159 0
JV Sales Approved 99 379 396 74 473
TotalApproved 533 801 618 572 1070
Blue Sky 0 0 93 237 0
Note - Both approved and blue sky developments are incorporated into the base case business plan.

Page 24 Investor Update – November 2018Confidentiality
Market Rent Update
• The key objective for A2D’s market rent programme is to achieve a commercial return for social reinvestment purposes.
• In addition, the flexibility in market rent compared to social tenures will assist A2D to better manage the financial risk of the overall property portfolio.
• A2D has continued to add to its market rent portfolio, with a further 226 units developed or acquired during 17/18.
• Current PRS portfolio has achieved 15.3% growth in value over the financial year.
• Target of a further 180 – 240PRS units each year.
• Target yield is 5.5% gross and 3.5% net on average across the portfolio, net yield FYE 2018 was 4.6%.
• To be developed in A2D core areas and/or in locations that are within a 20 mile radius of a key worker management office.

Page 25 Investor Update – November 2018Confidentiality
Market Rent Development Activities – Scheme Update
Current Committed Schemes Area Cost £m Value £m Completed FY 2019 FY 2020 FY 2021 FY 2022 Total
Commercial Rd London 29.2 39.9 95 95
Harbourside Bristol 10.4 13.9 46 46
Gun Wharf London 4.8 4.9 15 15
Green Man Lane London 23.6 25.3 63 63
City Wharf London 36.9 36.8 65 65
The Panorama Ashford 13.1 14.9 111 111
Sinclair House, Ealing London 3.7 3.6 11 11
Centenery Quay Southampton 18.8 18.5 110 110
Hibiscus House Feltham 3.8 4.3 21 21
Maternity Hospital Ashford 11.3 14.3 59 59
Cannons Gate Bristol 23.8 31.4 101 101
City Rd Winchester 1.5 2.2 8 8
London Road, Hounslow London 10.8 11.2 40 40
High Street, Hounslow London 0.9 1.0 5 5
Uxbridge Road, Ealing London 4.0 3.6 10 10
Subtotal 196.6 225.8 760 760
Redcliff Bristol 71.8 7.6* 27 101 118 246
Keybridge House London 101.3 n/a 0 159 159
Geron Way London 17.1 n/a 0 51 51
Brooklands Ashford 27.1 n/a 0 73 26 99
York Rd London 74.1 n/a 0 128 128
Longley House Crawley 17.2 n/a 0 83 83
Simon House Oxford 12.5 n/a 0 30 30
Gibbs House Oxford 18.4 n/a 0 60 60
Total 339.5 787 311 118 231 169 1,616
* Partial valuation based on completed units only (cost based on entire scheme)

Debt, Cash & Treasury Management

Page 27 Investor Update – November 2018Confidentiality
Debt Portfolio Summary
• Over 52% of our current drawn debt portfolio is bank loans, with margins ranging from 0.225% (plus LIBOR) to 6.52% (fixed).
• Weighted average margin on drawn loan facilities, at Mar 2018, is 4.64%.
• 19,386 properties are charged to lenders.
• Over 10,000 housing properties are unencumbered, of which 7,600 are available to be charged.
As at 31 March 2018 Facility size Drawn %
Total loans £1,126.1m £795.7m 51.8%
Total bonds (including “Club” bonds) £739.0m £739.0m 48.2%
Total debt £1,865.1m £1,534.7m
Less Cash (£126.1m)
Net Debt £1,408.6m
Variable rate borrowing £167.8m 11.0%
Index Linked £2.2m 0.1%
Fixed rates > 12 months £1,163.0m 75.8%
Variable with ISDA swaps > 12 months £201.7m 13.1%
Total £1,534.7m 100.0%

Page 28 Investor Update – November 2018Confidentiality
Asset Values & Security
• All social housing stock is valued annually, on EUV-SH basis, the total value of which is currently £2.4bn.
• Non-social housing is valued at Fair Value – currently £438m.
• Total value of our completed stock at MV-VP is £8.8bn.
• Properties are charged to lenders on either EUV-SH or MV-T basis
• The estimated value of unencumbered properties at EUV-SH is £1.1bn*
Units
Units owned 31,439
Housing units owned 30,094
Charged to lenders 19,386
Unencumbered units 10,708
Average EUV-SH value (March 2018)* £105,000*
Average MV-T value £162,000
*Note – EUV-SH values are based on March 2018 figures. Average EUV-SH value is of unencumbered housing units.

Appendices

Page 30 Investor Update – November 2018Confidentiality
i. Group Structure

Page 31 Investor Update – November 2018Confidentiality
ii. Group Structure - JVs

Page 32 Investor Update – November 2018Confidentiality
iii. Dormant Entities