a year of delivery sets up barrick tanzania for the future
TRANSCRIPT

A year of delivery sets up Barrick Tanzania for the future
Core Shed Bulyanhulu

Cautionary statement onforward looking information…
Certain information contained or incorporated by reference in this presentation, including any information as to our strategy, projects, plans, or future financial or operating performance, constitutes “forward-looking statements”. All statements, other than statements of historical fact, are forward-looking statements. The words “sets up”, “on track”, “progress”, “implementation”, “plan”, “long term”, “continue”,“improve”, “opportunities”, “prospective”, “optimization”, “target”, “scout drilling”, “expected”, “motivate”, “to ensure”, “transition”, “focus”, “future”, “development”, “a look at”, “commitment”, “new”, “will” and “could”and similar expressions identify forward-looking statements. In particular, this presentation contains forward-looking statements including, without limitation, with respect to: production targets; improvements toNorth Mara’s life of mine and the implementation of its water management plan; scheduled production from Bulyanhulu; cost improvements; progress being made towards resolution of legacy land issues;progress being made towards compliance with environmental permits and local content legislation; the potential for North Mara and Bulyanhulu to become a Tier One complex and potential expansions to the lifeof mine; planned exploration, potential discoveries and growth initiatives; expected drilling results, mining and processing optimization work; Barrick’s safety and health and environmental performance inTanzania; the resolution of legacy land management issues; technological improvements; skills and workforce training; and partnerships and contributions to the local economy.
Forward-looking statements are necessarily based upon a number of estimates and assumptions including material estimates and assumptions related to the factors set forth below that, while consideredreasonable by the Company as at the date of this presentation in light of management’s experience and perception of current conditions and expected developments, are inherently subject to significantbusiness, economic, and competitive uncertainties and contingencies. Known and unknown factors could cause actual results to differ materially from those projected in the forward-looking statements, andundue reliance should not be placed on such statements and information. Such factors include, but are not limited to: fluctuations in the spot and forward price of gold, copper, or certain other commodities (suchas silver, diesel fuel, natural gas, and electricity); the speculative nature of mineral exploration and development; changes in mineral production performance, exploitation, and exploration successes; risksassociated with projects in the early stages of evaluation, and for which additional engineering and other analysis is required; failure to comply with environmental and health and safety laws and regulations;timing of receipt of, or failure to comply with, necessary permits and approvals; uncertainty whether some or all of targeted investments and projects will meet the Company’s capital allocation objectives andinternal hurdle rate; changes in national and local government legislation, taxation, controls or regulations and/ or changes in the administration of laws, policies and practices, expropriation or nationalization ofproperty and political or economic developments in Tanzania and other jurisdictions in which the Company or its affiliates do or may carry on business in the future; damage to the Company’s reputation due tothe actual or perceived occurrence of any number of events, including negative publicity with respect to the Company’s handling of environmental matters or dealings with community groups, whether true or not;risks associated with new diseases, epidemics and pandemics, including the effects and potential effects of the global Covid-19 pandemic; litigation and legal and administrative proceedings; employee relationsincluding loss of key employees; increased costs and physical risks, including extreme weather events and resource shortages, related to climate change; and availability and increased costs associated withmining inputs and labor. Barrick also cautions that its guidance may be impacted by the unprecedented business and social disruption caused by the spread of Covid-19. In addition, there are risks and hazardsassociated with the business of mineral exploration, development and mining, including environmental hazards, industrial accidents, unusual or unexpected formations, pressures, cave-ins, flooding and goldbullion, copper cathode or gold or copper concentrate losses (and the risk of inadequate insurance, or inability to obtain insurance, to cover these risks).
Many of these uncertainties and contingencies can affect our actual results and could cause actual results to differ materially from those expressed or implied in any forward-looking statements made by, or onbehalf of, us. Readers are cautioned that forward-looking statements are not guarantees of future performance. All of the forward-looking statements made in this presentation are qualified by these cautionarystatements. Specific reference is made to the most recent Form 40-F/Annual Information Form on file with the SEC and Canadian provincial securities regulatory authorities for a more detailed discussion ofsome of the factors underlying forward-looking statements and the risks that may affect Barrick’s ability to achieve the expectations set forth in the forward-looking statements contained in this presentation.
Barrick disclaims any intention or obligation to update or revise any forward-looking statements whether as a result of new information, future events or otherwise, except as required by applicable law.

To be world class, we need to be global…
i In Q1 2020, Barrick sold its stake in Massawa to Teranga Gold (“Teranga”) and retained an 11% equity interest in Teranga. In February 2021, Endeavour Mining and Teranga merged.
ii
ii In Q1 2021, Barrick announced the sale of Lagunas Norte to Boroo Ptd Ltd (Singapore).

Barrick…bringing mining consolidation and exploration back to Africa
BARRICK – RANDGOLD mergerTanzania…Barrick – Acacia buyoutSenegal…Sale of Massawa to Teranga
Massawai Kibali (45%)
Jabal Sayid (50%)
Lumwana (100%)
Loulo-Gounkoto (80%)
Tongon (89.7%) North Mara (84%)Bulyanhulu (84%)Buzwagi (84%)
Gold productionProjectsCopper production
LakeVictoria
Tanzania
DemocraticRepublic of
Congo
Central AfricanRepublic
Kibali
South Sudan
Kenya
Uganda
Bulyanhulu
Ngayu Belt
North Mara
Buzwagi
500km
Gold depositsExploration focus
Greenstone BeltArchean GranitoidPhanerozoicProterozoicArchean Gneiss
N
Active greenfields exploration programmes have commenced on priority targets Next phase of permit consolidation underway at North MaraCountry-scale prospectivity assessment has begun to generate new targets in Tanzania
Tanzania
i In Q1 2020, Barrick sold its stake in Massawa to Teranga Gold (“Teranga”) and retained an 11% equity interest in Teranga. In February 2021, Endeavour Mining and Teranga merged.

Timeline of mining in Tanzania…
1909 First Gold mine established in Sekenke, Singida
1971All mines were nationalised
1997 Mineral Policy 1997 adopted - Gave way for Private Sector to take lead in Exploration, Mine Development, Mining, Mineral Beneficiation, and Marketing. The Government became the facilitator, regulator and administrator. Aimed at increasing GDP contribution from 2% to 10% by 2025.
1998 - 2009Gold Mines EstablishedGolden Pride (Resolute); Geita (AngloGold Ashanti); Bulyanhulu (Barrick); North Mara (Placer Dome); Tulawaka (Barrick); Buzwagi (Barrick)
2009Mineral Policy 2009 adopted - A vision of having an effective mineralsector, contributing significantly to the acceleration of social-economic development through sustainable development and utilization of mineral resources in Tanzania by 2025
2017
2012 Operations at Tulawaka (Barrick) ceased; New Luika Gold Mine Established
Golden Pride mine closed2014
Overhaul of Mining Act 2010Enactment of Natural Wealth and Resources (Permanent Sovereign) Act
2018 Establishment of Ministry of Minerals
Twiga Minerals Corp. established to manage Bulyanhulu, Buzwagi and North Mara – a joint venture between Barrick Gold Corporation (84%) and the Government of Tanzania (16%)
2019
2021 Kabanga Nickel Corp. established – A joint venture between LZ Nickel Ltd (84%) and the Government of Tanzania (16%)
Solid Q4 production performances at North Mara and Bulyanhulu, resulted in both mines delivering near the top end of production guidance
Paid the first tranche of $100m of the settlement agreement
Barrick Tanzanian operations paid a maiden interim cash dividend of $250m on October 13, 2020
UG production successfully restarted at Bulyanhulu in Q4, with the plant recommencing processing of UG ore
Q4 marked a record quarter on throughput at North Mara supporting a vastly improved LOM production profile and unlocking operating cost efficiencies
Following development of 10 year plans to deliver a potential Tanzanian Tier 1 asset1 (North Mara and Bulyanhulu combined), solid progress has been made to bring the mines into lower-half of cost curve
Expansion of the water treatment and water management structures to further mitigate the environmental risks at the North Mara TSF, while implementation of comprehensive water management plan remained on track
Obtained full authorization for the next stage of TSF construction at Bulyanhulu
Bulyanhulu mine plan and optimisation well underway, to produce a long-term value driven mine
Successful change-over of social team at North Mara continues to strengthen relationship with the community
Buzwagi closure remains on track with closure plan submitted to Government
Delivering on the 2020 Business Plan…

1 Lost Time Injury (LTI) recorded at Bulyanhulu in Q4 2020; LTIFR2 of 0.28 per million hours worked vs. 0.38 in Q4 2019
4 LTIs recorded for the year; LTIFR of 0.31 per million hours worked for the region vs 0.35 in 2019
7 Total Recordable Injuries (TRIs) occurred in Q4 2020; TRIFR3 of 1.95 per million hours vs 1.13 in Q4 2019
23 TRIs occurred in 2020; TRIFR of 1.87 per million hours worked for the region vs 1.42 in 2019
All incidents investigated and corrective actions shared with employees and sister operations as part of the Group’s Journey to Zero Harm drive
Safety incident reporting improved during the year
Safety, Health and Environment…
0,0
0,5
1,0
1,5
2,0
2,5
Q4-2020 Q4-2019 YTD-2020 YTD-2019
Quarterly and annual comparison of LTIFR and TRIFR
LTIFR TRIFR
SafetySafety

HIV/AIDS prevention actions taken mainly at North Mara - 1257 VCTsi
conducted in 2020 with a positivity rateii of 1.19% vs 1538 VCTs in 2019 with a positivity rate of 1.63%HIV/AIDS programme will be extended to the local communities at all Barrick’s Tanzanian operations in 2021
Safety, Health and Environment…YTD
i Voluntary Counselling and Testing ii Based on positive cases as a percentage of the number of tests
0%
2%
4%
6%
8%
10%
12%
14%
Q4-2020 Q4-2019 YTD-2020 YTD-2019
Malaria Incidence and HIV Positivity Rate 2019 vs 2020
Malaria Incidence HIV Positivity Rate
HIV / AIDS
Malaria
Covid-19
Malaria incident rate (MIR) of 1.32% for Q4 2020 and 12.14% for the year compared to 1.62% for Q4 2019 and 11.07% for 2019 Despite relatively low incidence rate, extension of the malaria control measures to surrounding local communities being investigated
Covid-19 pandemic preparedness plan developed and implemented with more emphasis on hand hygiene, face masks and social distancing Covid-19 travel disclosure form implemented to prevent importation of cases into the mines/country Daily electronic self assessment form filled by employees before going to workAll legal requirements being followedCompany supported government's efforts to fight Covid-19 through donations of medical consumables, equipment and infrastructureSupport also provided to local communities
HIV / AIDS
Malaria
Covid-19
Environmental Performance…
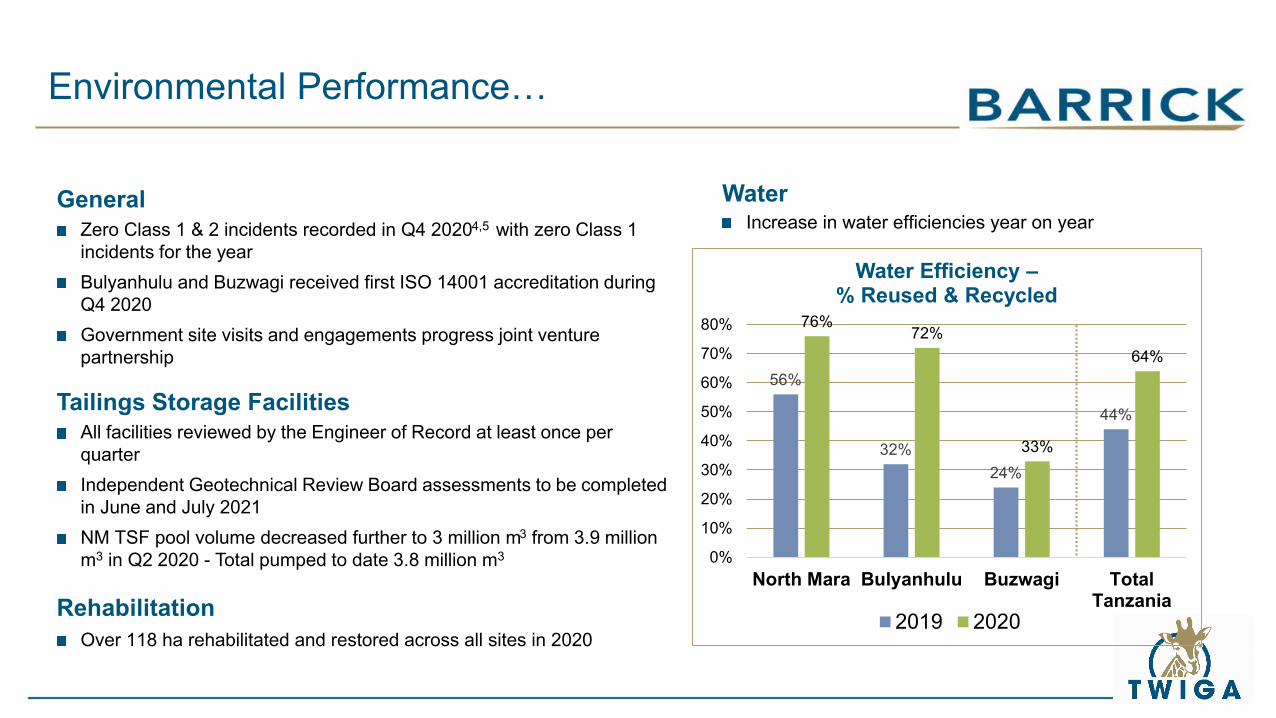
WaterIncrease in water efficiencies year on year
56%
32%24%
44%
76%72%
33%
64%
0%
10%
20%
30%
40%
50%
60%
70%
80%
North Mara Bulyanhulu Buzwagi TotalTanzania
Water Efficiency –% Reused & Recycled
2019 2020
Zero Class 1 & 2 incidents recorded in Q4 20204,5 with zero Class 1 incidents for the yearBulyanhulu and Buzwagi received first ISO 14001 accreditation during Q4 2020Government site visits and engagements progress joint venture partnership
Over 118 ha rehabilitated and restored across all sites in 2020
All facilities reviewed by the Engineer of Record at least once per quarterIndependent Geotechnical Review Board assessments to be completed in June and July 2021NM TSF pool volume decreased further to 3 million m3 from 3.9 million m3 in Q2 2020 - Total pumped to date 3.8 million m3
General
Tailings Storage Facilities
Rehabilitation

Since assuming operational control, Barrick has delivered on short-term water management commitments and TSF freeboard was successfully restored
Upgrade of the existing Water Treatment Plant (WTP) from 2.5MLDi to 28.6MLD through a number of phases throughout the year - full output capacity achieved in Jan 2021
Reconfiguring existing plant and repurposing a polishing RO to effectively double output to 5MLDInstallation of phase 2 adding 2.5MLD in August 2020Installation of phase 3 adding 7.5MLD completed in October 2020Installation of phase 4 adding 13.6MLD - completed December 2020 and fully ramped up in January 2021
Next step is to construct the brine treatment plant to be commissioned in May 2021 – fulfilling our long-term water commitments
Since May 2020, over 4 million m3 of water removed from the TSF
800
North Mara…Water Management
i Minimal Liquid Discharge
December 20202019

Improved understanding of orebodies has resulted in a review of more efficient mining methods with some additional opportunities identified to extend LOM
North Mara transitioned to underground mining during the year and significant improvements made to improve costs and operational effectiveness
Inherited a legacy maintenance backlog and significant skills gap addressed - knowledge transfer and optimisation continuing into 2021
Covid-19 pandemic impacted Q2 progress but improvements and development turnaround shown in Q3 resulted in improved tonnes in Q4
Bulyanhulu commenced processing in Q4 as planned and expected to be in full operation by end H1 2021 after ramp-up
Focusing on fleet improvements to drive efficiency and automation
800
Mining…update
271 228 222
263
12
80
-
100
200
300
Q1 2020 Q2 2020 Q3 2020 Q4 2020
UG Ore Tonnes6
North Mara Bulyanhulu
1 375
982 1 313
1 127
111 236
-
500
1 000
1 500
Q1 2020 Q2 2020 Q3 2020 Q4 2020
Development Metres6
North Mara Bulyanhulu

Mining…Investing in the Future

Delivered on gold production…
Full year production of 462koz - well within 2020 guidanceProcessing of fresh underground material commenced at Bulyanhulu during Q4 2020, following successful refurbishment of the shaft and process plantNorth Mara plant throughput optimisation resulted in record throughput in Q4, with the improvements running into the LOM extending the production profile
77 81 79 73
9 8 8 27 27 24 24
25
Q1 2020 Q2 2020 Q3 2020 Q4 2020
Gold Production6 koz
North Mara Bulyanhulu Buzwagi

2.8 kmWest EastGOKONA GENA
2.5-55-10>10
Au g/t
Conceptual New GokonaUG Access
2020 Gena OP 100%Deposit Reserve Pushback7:Probable Reserves4.6Mt @ 1.71g/t for 0.25Moz
Gokona UG Conversion Panels
2020 Gokona OP 100% DepositResource Pushback7:Mea: 8.3Mt @ 3.39g/t for 0.91MozInd: 0.97Mt @ 2.03g/t for 0.063MozInf: 5.3Mt @ 1.5g/t for 0.25Moz
Gokona UG Mineral Resource
North Mara…geological understanding delivers mineral resource and reserve growth
2020 North Mara P&P reserves grow by +356koz (on a 100% basis), net of depletion2020 Gokona UG and Gokona OP pushback provide substantial mineral resource growth with potential to significantly extend the LOM

North Mara…operating resultsAchieved production of 261koz (311koz 100%) in the upper-end of 2020 guidanceThrough the year…
Significant improvements made to improve costs and underground productivityAddressed a significant legacy maintenance backlog and skilled labour gapOptimization of the plant resulted in record throughput in Q4, expected to persist through the LOM
2021 production guidance of 240 to 270kozPer ounce costs impacted by mill feed sequencing
North Mara (84%)8 Q4 2020 Q3 2020 2020 2019Ore tonnes processed (000) 677 622 2,546 1,829
Average grade processed (g/t) 3.08 3.59 3.45 4.50
Recovery rate (%) 91% 93% 92% 94%
Gold produced (oz 000) 61 67 261 251
Gold sold (oz 000) 63 69 269 248
Income ($ millions) 49 72 214 112
EBITDA ($ millions)9 66 89 290 187
Capital expenditures ($ millions) 27 17 87 42
Minesite sustaining 11 6 57 36
Project 16 11 30 6
Cost of sales ($/oz)10 1,073 903 992 953
Total cash costs ($/oz)11 799 649 702 646
AISC ($/oz)11 989 758 929 802
Next StepsImproving mill recovery with a new oxygen plant and cyclone cluster upgradeDeep, lateral extension of Gokona orebody could increase the LOM for North Mara by adding potential resourcesBring North Mara and Bulyanhulu into the lower half of the cost curve and deliver a combined Tier One complex in Tanzania

Bulyanhulu…ramp up of UG mining and processing on track
2,00
0m W-E
BGMDDD0073Ai
True width 2.2m @ 10.6g/t Au
East Mine
Haulage Level
Deep West
Surface Portal and Shaft
Drillholes - results pending
Conceptual Deep West Mine Design
M&I Resource Area
2020 Campaign Feed Area:96% plant
reconciliation
2020 Bulyanhulu 100%Total Mineral Resource7:
Ind: 14Mt @ 9.75g/t for 4.3MozInf: 33Mt @ 7.8g/t for 8.3Moz
iRefer to Appendix A for additional details including assay results for the significant intercepts. All mineral resources include reserves

Bulyanhulu and Buzwagi…operating results
Ramp-up of underground mining and processing operations on-track2021 attributable production guidance of 170 to 200koz
Ramp-up through H1 2021Reach annualized steady-state production by 2022
Feasibility study for the optimized mineplan continues to advance, including drilling the high-grade Deep West zone and geotechnical analysis
Bulyanhulu
BuzwagiExpected to enter care and maintenance starting from Q3 2021, in-line with previous disclosures2021 production guidance of 30 to 40koz, currently all expected in H1
Bulyanhulu (84%)8 Q4 2020 Q3 2020 2020 2019Gold produced (oz 000) 23 7 44 27
Gold sold (oz 000) 20 46 103 27
Cost of sales ($/oz)10 1,181 1,502 1,499 1,207
Total cash costs ($/oz)11 610 874 832 676
AISC ($/oz)11 664 913 895 773
Buzwagi (84%) 8 Q4 2020 Q3 2020 2020 2019Gold produced (oz 000) 21 21 84 83
Gold sold (oz 000) 21 73 174 81
Cost of sales ($/oz)10 1,314 907 1,021 1,240
Total cash costs ($/oz)11 1,267 687 859 1,156
AISC ($/oz)11 1,283 693 871 1,178

Recruitment ongoing, specifically at the Bulyanhulu restart project with over 600 new workers appointed since January 2020Continued engagement on employment and transition plans with the Mining Commission to ensure local empowerment and developmentWorld-leading talent appointed in critical areas of the business to ensure Barrick culture and essential skills transfer is made within the regionImprovement in communication with authoritiesMore can be done for skills transfer and empowerment of the local workforce96% of total workforce made up of local employeesEngagement on equitable separation underway with the closure of Buzwagi
National workforce commitment…
Tanzania Headcount Q4 2020
Company Expats58 (2%)
Contractor Expats59 (2%)
Company Nationals1,286 (38%)
Contractor Nationals2,092 (58%)

Local contractors and supply strategy…
Key achievements - 2020:$290 million spent on local contractors and suppliers in 2020 and $85 million during Q4 2020
Local content plans approved by the Mining Commission for all operations
Successful transition to Tanzanian Security Service company Nguvu Moja - committed to driving change in security
Tanzanian civil contractors awarded tender for Buzwagi TSF lift and rehabilitation work
Tanzanian supply chain partner, TCL Services, responsible for all procurement for Tanzania operations
Training programs initiated on Local Content Regulations to drive ownership and compliance from end-users and to identify opportunities
Drilling partners have formed new entities with a 20% Indigenous Tanzanian Company shareholding

In-country investments…
290
338
40
100 30 2
Investment $ million
Local Supplier Contribution TaxesDividends FWA SettlementSalaries CSR
$800m paid in country in form of taxes, dividends, permits, infrastructure, salaries and payments to local suppliers Of $290m local spend, $168m fulfils Mining Commission criteria for an indigenous company. Proportion of indigenous spend as part of local spend improved from 42% in Q4 2019 to 58% in 202069% of all spend in Tanzania has been with local companies
Maiden interim cash dividend of $250m paid on October 13, 2020
Capital and exploration exceeded $180m in 2020 of which half relates to growth projects with investment continuing into 2021Significant CSR projects undertaken

Regaining Social License To Operate through effective Stakeholder Engagement Resolving past, long outstanding grievances through the reviewed and approved Grievance Mechanism – 84 outstanding in September 2019 to 6 current legacy grievancesAddressing Land Legacy Issues – TSF#2 land compensation has been completed in a joint effort between the mine, the authorities and the community – setting the standard for the futureEstablishing a Community Development Committee representing all 11 villages – putting the community at the center of decision makingImplementing Community Development Projects focused on Education, Health, Water and livelihood Funded and implemented Sustainable Agribusiness projects –Kemanyanki Youth Poultry Project which sells its produce to the mine’s caterers Increased focus and revision of the local procurement of goods and services – increase in local suppliers in 2020 - $290 million spent on local procurementCompletion of past commitments associated with the Village Benefits Agreement (VBA) commitments at North Mara
CSR…key focus areas
Tanzania…a look at 2021
Deep, lateral extension of Gokona orebody could increase the LOM for North Mara by adding potential resourcesIncrease throughput at the processing plant at North Mara (+390tph) to minimise overall $/t costImprove North Mara plant recovery by 1% by installing the new 20t oxygen plant and upgrade cyclone clusterRe-tendering numerous contracts and negotiating improved rates to further reduce costsImprove ore re-handling and crusher feeding by adding new 992K loader, improving flexibility and reliability
Bulyanhulu process flow optimisation on doré / concentrate production
Greater safety and training coverage to fast track the upskilling of national workers
Continue enhancing partnership with communities
Complete long-term water management commitments at North Mara
Continued investment in new discoveries and mine development

Power of People and Partnerships…
Successful partnerships in host countries are key to finding, developing and running world class minesExamples of this are reflected in the success of our operations in Africa where we’ve delivered long term value for all our stakeholders
Mining Companies
and Investors
Governments NGOs and Regulators
Employees and
Communities

Endnotes…1. A Tier One Gold Asset is an asset with a reserve potential to deliver a minimum 10-year life, annual production of at least 500,000 ounces of gold and total cash costs per ounce over the mine life that are in the lower half of the
industry cost curve.
2. Loss time injury frequency rate (LTIFR) is a ratio calculated as follows: number of loss time injuries x 1,000,000 hours divided by the total number of hours worked.
3. Total reportable incident frequency rate (TRIFR) is a ratio calculated as follows: number of reportable injuries x 1,000,000 hours divided by the total number of hours worked. Reportable injuries include fatalities, lost time injuries, restricted duty injuries, and medically treated injuries.
4. Class 1 - High Significance is defined as an incident that causes significant negative impacts on human health or the environment or an incident that extends onto publicly accessible land and has the potential to cause significant adverse impact to surrounding communities, livestock or wildlife.
5. Class 2 - Medium Significance is defined as an incident that has the potential to cause negative impact on human health or the environment but is reasonably anticipated to result in only localized and short-term environmental or community impact requiring minor remediation.
6. On a 100% basis.
7. Estimated in accordance with National Instrument 43-101 - Standards of Disclosure for Mineral Projects as required by Canadian securities regulatory authorities. Estimates are as of December 31, 2020, unless otherwise noted. Proven reserves of 280 million tonnes grading 2.37 g/t, representing 21 million ounces of gold, and 350 million tonnes grading 0.39%, representing 3,000 million pounds of copper. Probable reserves of 990 million tonnes grading 1.46 g/t, representing 47 million ounces of gold, and 1,100 million tonnes grading 0.39%, representing 9,700 million pounds of copper. Measured resources of 530 million tonnes grading 2.11 g/t, representing 36 million ounces of gold, and 600 million tonnes grading 0.36%, representing 4,800 million pounds of copper. Indicated resources of 2,800 million tonnes grading 1.41 g/t, representing 130 million ounces of gold, and 2,500 million tonnes grading 0.36%, representing 20,000 million pounds of copper. Inferred resources of 980 million tonnes grading 1.4 g/t, representing 43 million ounces of gold, and 440 million tonnes grading 0.2%, representing 2,200 million pounds of copper. Mineral resources are reported inclusive of mineral reserves. Complete mineral reserve and mineral resource data for all mines and projects referenced, including tonnes, grades, and ounces, can be found on pages 137-144 of Barrick’s Fourth Quarter and Year-End 2020 Report.
8. Formerly part of Acacia Mining plc. On September 17, 2019, Barrick acquired all of the shares of Acacia it did not already own. The results presented are on a 63.9% basis until September 30, 2019 (notwithstanding the completion of the Acacia transaction on September 17, 2019, we consolidated our interest in Acacia and recorded a non-controlling interest of 36.1% in the income statement for the entirety of the third quarter of 2019 as a matter of convenience); on a 100% basis from October 1, 2019 to December 31, 2019; and on a 84% basis starting January 1, 2020, the date the GoT’s 16% free carried interest was made effective.
9. EBITDA is a non-GAAP financial measure, which excludes the following from net earnings: income tax expense; finance costs; finance income; and depreciation. Management believes that EBITDA is a valuable indicator of our ability to generate liquidity by producing operating cash flow to fund working capital needs, service debt obligations, and fund capital expenditures. Management uses EBITDA for this purpose. Adjusted EBITDA removes the effect of impairment charges; acquisition/disposition gains/losses; foreign currency translation gains/losses; other expense adjustments; and the impact of the income tax expense, finance costs, finance income and depreciation incurred in our equity method accounted investments. We believe these items provide a greater level of consistency with the adjusting items included in our Adjusted Net Earnings reconciliation, with the exception that these amounts are adjusted to remove any impact on finance costs/income, income tax expense and/or depreciation as they do not affect EBITDA. We believe this additional information will assist analysts, investors and other stakeholders of Barrick in better understanding our ability to generate liquidity from our full business, including equity method investments, by excluding these amounts from the calculation as they are not indicative of the performance of our core mining business and not necessarily reflective of the underlying operating results for the periods presented. EBITDA and adjusted EBITDA are intended to provide additional information only and do not have any standardized meaning under IFRS and may not be comparable to similar measures of performance presented by other companies. They should not be considered in isolation or as a substitute for measures of performance prepared in accordance with IFRS. For further details on these non-GAAP measures, please refer to pages 122-123 of the MD&A accompanying Barrick’s fourth quarter 2020 financial statements filed on SEDAR at www.sedar.com and on EDGAR at www.sec.gov.

Endnotes…10. Cost of sales applicable to gold per ounce is calculated using cost of sales applicable to gold on an attributable basis (removing the non-controlling interest of 38.5% of Nevada Gold Mines (including 63.1% of South Arturo), 40%
of Pueblo Viejo, 20% of Loulo-Gounkoto, 10.3% of Tongon, and 16% of North Mara, Bulyanhulu and Buzwagi from cost of sales and including our proportionate share of cost of sales attributable to our equity method investment in Kibali), divided by attributable gold ounces sold. Cost of sales applicable to copper per pound is calculated using cost of sales applicable to copper including our proportionate share of cost of sales attributable to our equity method investments in Zaldívar and Jabal Sayid, divided by consolidated copper pounds sold (including our proportionate share of copper pounds sold from our equity method investments).
11. “Total cash costs” per ounce, “All-in sustaining costs” per ounce and "All-in costs" per ounce are non-GAAP financial performance measures. “Total cash costs” per ounce starts with cost of sales related to gold production and removes depreciation, the non-controlling interest of cost of sales, and includes by product credits. “All-in sustaining costs” per ounce start with “Total cash costs” per ounce and add further costs which reflect the expenditures made to maintain current production levels, primarily sustaining capital expenditures, sustaining leases, general & administrative costs, minesite exploration and evaluation costs, and reclamation cost accretion and amortization. "All-in costs" per ounce starts with "All-in sustaining costs" per ounce and adds additional costs that reflect the varying costs of producing gold over the life-cycle of a mine, including: project capital expenditures and other non-sustaining costs. Barrick believes that the use of “Total cash costs” per ounce, “All-in sustaining costs” per ounce and "All-in costs" per ounce will assist investors, analysts and other stakeholders in understanding the costs associated with producing gold, understanding the economics of gold mining, assessing our operating performance and also our ability to generate free cash flow from current operations and to generate free cash flow on an overall Company basis. “Total cash costs” per ounce, “All-in sustaining costs” per ounce and "All-in costs" per ounce are intended to provide additional information only and do not have any standardized meaning under IFRS. Although a standardized definition of all-in sustaining costs was published in 2013 by the World Gold Council (a market development organization for the gold industry comprised of and funded by gold mining companies from around the world, including Barrick), it is not a regulatory organization, and other companies may calculate this measure differently. These measures should not be considered in isolation or as a substitute for measures prepared in accordance with IFRS .For further details on these non-GAAP measures, please refer to pages 100-120 of the MD&A accompanying Barrick’s fourth quarter 2020 financial statements filed on SEDAR at www.sedar.com and on EDGAR at www.sec.gov.
Technical InformationThe scientific and technical information contained in this presentation has been reviewed and approved by Simon Bottoms, CGeol, MGeol, FGS, FAusIMM, Mineral Resources Manager, Africa and Middle East; and Rob Krcmarov, FAusIMM, Executive Vice President, Exploration and Growth - each a “Qualified Person” as defined in National Instrument 43-101 – Standards of Disclosure for Mineral Projects.
All mineral reserve and mineral resource estimates are estimated in accordance with National Instrument 43-101 - Standards of Disclosure for Mineral Projects. Unless otherwise noted, such mineral reserve and mineral resource estimates are as of December 31, 2020.

Bulyanhulu Deep West Drilling – Q4 2020
Location Type Drill Holeii Azimuth Local Dip Interval (m) Width (m) True Width (m) Au (g/t)
Deep West DDH BGMDD0069 171.66 -67.68 2,126.50 2,133.00 6.5 2.77 33
Deep West DDH BGMDD0069B 174.14 -43.45 2,242.00 2,252.00 10 7.9 10.3
Deep West DDH BGMDD0070 176.71 -28.41 2,154.40 2,160.00 5.6 4.7 38.2
Deep West DDH BGMDD0071 147.08 -69.84 2,236.00 2,242.40 6.4 4.5 11.3
Deep West DDH BGMDD0072 187 -40.88 2,123.10 2,125.35 2.25 1.9 110.9
Deep West DDH BGMDD0073 194.75 -35.2 2,052.64 2,055.25 2.61 2.2 14.6
Deep West DDH BGMDD0073A 178.65 -24.24 2,007.70 2,010.20 2.5 2.15 10.6
i. Capping at 300 g/t Au on the raw data, with minimum of 1m intercept, with at least 60% of the resulting intercepts above 2 g/t Au cut-off.
ii. Bulyanhulu – drill hole nomenclature: BGM = Bulyanhulu Gold Mines, followed by type of drilling DD (Diamond Drilling).
The drilling results for the Bulyanhulu Mineral Resource definition program contained in this presentation have been prepared in accordance with National Instrument 43-101 – Standards of Disclosure for Mineral Projects. All drill hole assay information has been manually reviewed and approved by staff geologists and re-checked by the project manager. Sample preparation and analyses are conducted by SGS, an independent laboratory. Industry accepted best practices for preparation and fire assaying procedures are utilized to determine gold content. Procedures are employed to ensure security of samples during their delivery from the drill rig to the laboratory. The quality assurance procedures, data verification and assay protocols used in connection with drilling and sampling on the Bulyanhulu property conform to industry accepted quality control methods.
Appendix A: Bulyanhulu Deep West Significant Intercept Tablei, ii