a whole world of circuitry
TRANSCRIPT

Baltic J. Modern Computing, Vol. 9 (2021), No. 1, pp. 145–154https://doi.org/10.22364/bjmc.2021.9.1.09
A Whole World of CircuitryVisualizing Integrated Circuits using Geo Information Systems
Jannis STOPPE, Tino FLENKER
German Aerospace CenterInstitute for the Protection of Maritime Infrastructures
27572 Bremerhaven, Germany
Abstract Circuit visualisation is crucial to get an overview of the results of hardware synthesisprocesses. However, visualisation tools are often old, tailored to specific use cases and generallyhave to deal with the issue of extremely large datasets while providing a smooth and interactiveuser experience. In order to provide a smooth user experience and smooth learning curve forarbitrarily large circuits, this paper introduces an approach that utilizes workflows and tools fromthe geoinformation systems community, bridging the gap between integrated circuit synthesistools and state-of-the-art visualisation tools for large georeferenced datasets.
Keywords: EDA, GIS, Visualisation, Open Source
1 Introduction
The electronic design automation (EDA) industry is a broad umbrella term for compa-nies and products that provide software to design chips. The tasks of EDA are, amongothers, the creation of circuit diagrams – especially when designing printed circuitboards – but also the design of state machines which are used in sequential circuitsto represent internal behavior/memory (Rabaey et al., 2008; Wang et al., 2009).
The automated techniques used for the layout and placement of the integrated cir-cuits (ICs), generate significantly large designs, which developers need to be able toinspect. Therefore, appropriate visualisation tools are crucial, which is the reason whyall EDA tools come with various methods to visualise and browse a given design – thisfunctionality is a core part to verify that a design was synthesized as expected.
In order to be able to properly understand a given design, the tools should pro-vide a smooth and ubiquitous user experience – being intuitively usable on any device.However, EDA tools often are quite the opposite, as they are built as large, monolithic,desktop applications and provide only a reasonably responsive user interface becausetrillions of parts have to be browsed often by the drawing components.

146 Stoppe and Flenker
Figure 1. Electric (Rubin, 2012) was initially released in 1983, with the latest release (currently9.07) being from 2016. Its C version was ported to Java in 2005.
Consequently, devices and workplaces are evolving in other directions: mobile com-puting has long become prevalent, giving people new interaction paradigms while atthe same time giving application developers much more limited resources to workwith. While other communities have long embraced these not-so-new-anymore devel-opments, EDA tools are still made to be used on large workstations, locking the abilityto browse designs in physical places and slowing down processes when people are else-where.
In this paper, we use geographic information system (GIS) tools to enable the visu-alisation of hardware designs that are not exclusively bound to workstations. The pur-pose is to provide a first proof-of-concept that EDA workflows may benefit from moremodern development paradigms, especially when it comes to the ubiquity of tools. Thiswork maps EDA data visualisation to modern GIS tools, allowing designers to browsetheir chips using state-of-the-art mapping applications from anywhere.
2 Circuit Visualisation
Circuit visualisation software is often old (Fourie and Volkmann, 2013; Fourie, 2018)and sparse. While there are several open source tools available, most of them date backtwo or more decades, often resulting in issues concerning portability, usability and buildprocesses. Examples of open source software packages that visualise ICs are shown inFigs. 1 through 4.
While there are more commercial tool sets than open source solutions (such as EA-GLE, CADSTAR, Allegro and more), they are often tied to licenses that are unsuit-able for academic usage and/or quite expensive. Generally though, they often share the
A Whole World of Circuitry 147
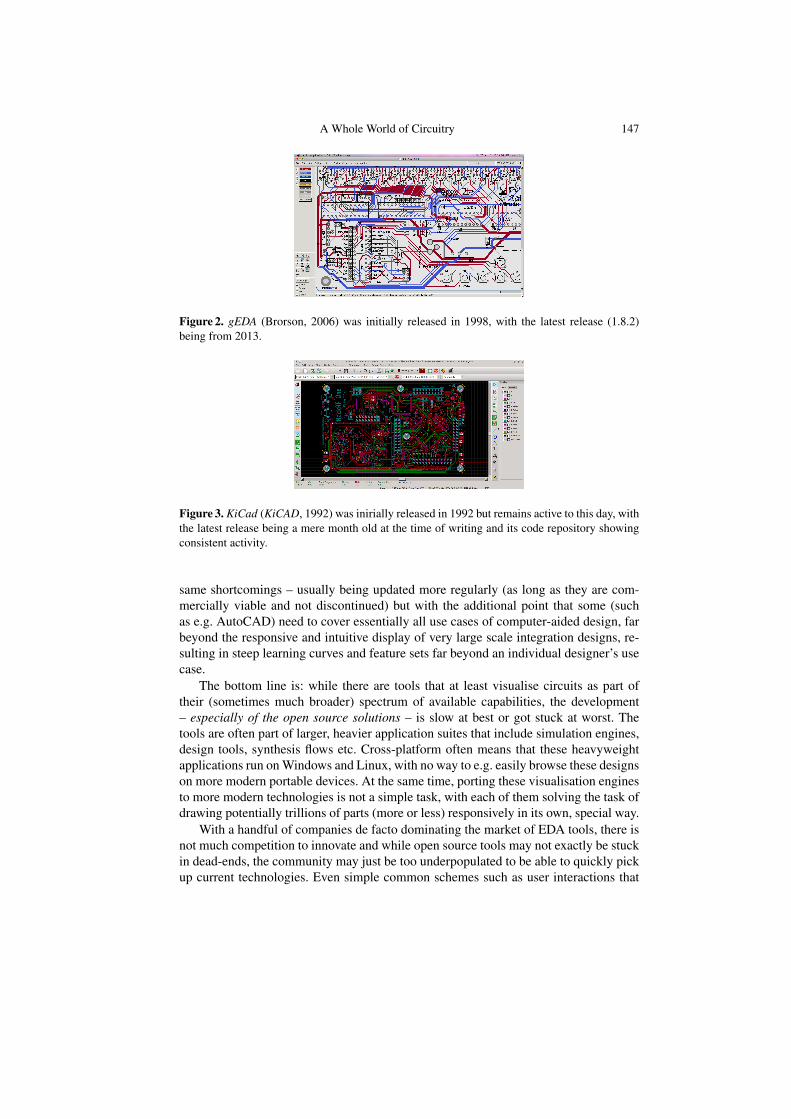
Figure 2. gEDA (Brorson, 2006) was initially released in 1998, with the latest release (1.8.2)being from 2013.
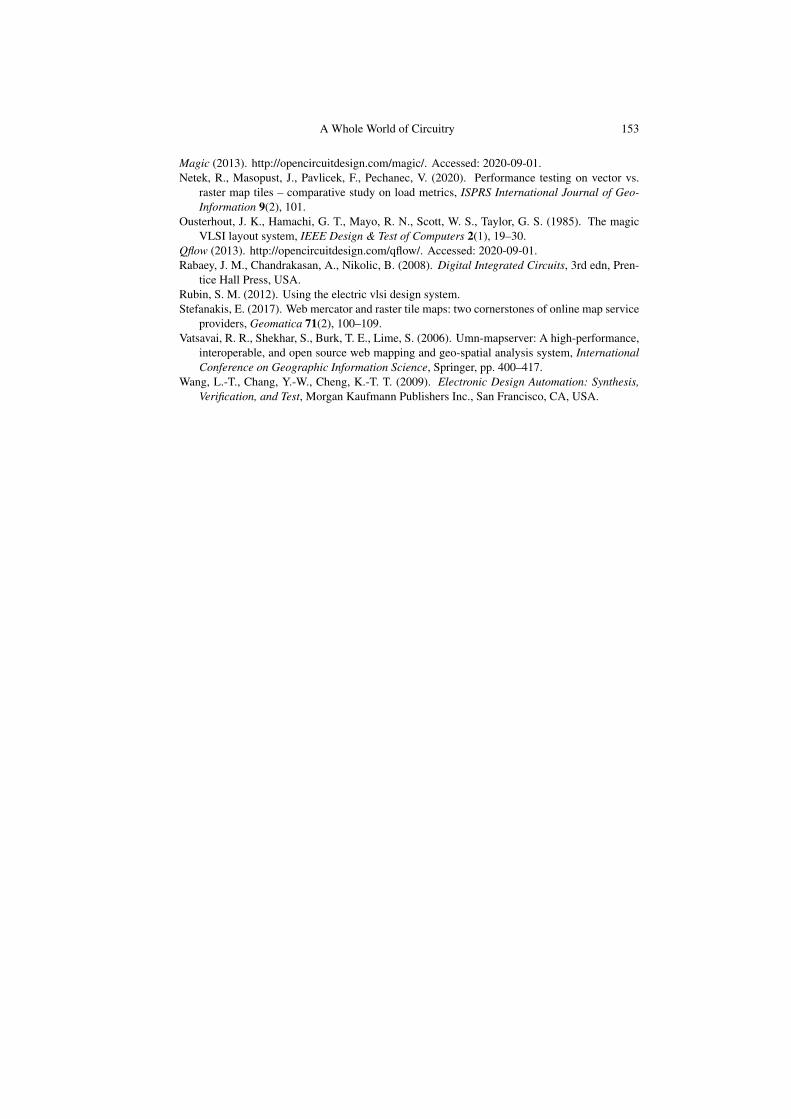
Figure 3. KiCad (KiCAD, 1992) was inirially released in 1992 but remains active to this day, withthe latest release being a mere month old at the time of writing and its code repository showingconsistent activity.
same shortcomings – usually being updated more regularly (as long as they are com-mercially viable and not discontinued) but with the additional point that some (suchas e.g. AutoCAD) need to cover essentially all use cases of computer-aided design, farbeyond the responsive and intuitive display of very large scale integration designs, re-sulting in steep learning curves and feature sets far beyond an individual designer’s usecase.
The bottom line is: while there are tools that at least visualise circuits as part oftheir (sometimes much broader) spectrum of available capabilities, the development– especially of the open source solutions – is slow at best or got stuck at worst. Thetools are often part of larger, heavier application suites that include simulation engines,design tools, synthesis flows etc. Cross-platform often means that these heavyweightapplications run on Windows and Linux, with no way to e.g. easily browse these designson more modern portable devices. At the same time, porting these visualisation enginesto more modern technologies is not a simple task, with each of them solving the task ofdrawing potentially trillions of parts (more or less) responsively in its own, special way.
With a handful of companies de facto dominating the market of EDA tools, there isnot much competition to innovate and while open source tools may not exactly be stuckin dead-ends, the community may just be too underpopulated to be able to quickly pickup current technologies. Even simple common schemes such as user interactions that

148 Stoppe and Flenker
Figure 4. Magic (Ousterhout et al., 1985) was initially released in 1980, with the latest releasebeing from 2017.
have been established over the last decade are often disregarded in tools that have beenaround much longer than that – with even basic interactions such as zooming out ordragging the viewport requiring the designer to read the documentation.
3 Geo Information Systems
Geographic information systems are an active field of both, research (Longley et al.,2010; Stefanakis, 2017; Netek et al., 2020) and commercial activities.
The rise of smart phones and location-based services has resulted in a large massmarket for mapping applications and a broad variety of both, big and small applicationsand companies in both, commercial and open source communities.
Clients themselves are more short-lived and development cycles are faster in theGIS than in the EDA community. That implies that technologies are usually more re-cent and adapt more state-of-the-art approaches than applications that carry decadesof history around. More importantly though, the short-livedness of the GIS tools hasmade a strict separation of concerns a necessity: servers that prepare and pass on the re-quired data are less in numbers than the various front-ends that display it, but are in fact(mostly) exchangeable. These servers solve issues like translating a broad range of datawith plethoras of different coordinate systems into data that can easily be processed byclients.
This smallest denominator – the prevalent separation of concerns in a server thatdistributes map data and a client (with potentially very limited resources) to consumeand display it – separates how most GIS tools work from most EDA tools around. Thedata that is being passed to the clients mostly consists of “tiles”: square-ish parts of theworld map at particular zoom levels. While there are various formats available up to 3Dmodels of terrain and cities (Kolbe et al., 2005), a lot of services merely hand out rastergraphics for given areas.
Open source servers such as geoserver (Iacovella, 2017), mapserver (Vatsavai et al.,2006) or deegree (Fitzke et al., 2004) allow geographical services to be hosted. Like-wise, open clients such as NASA’s WorldWind (Bell et al., 2007), cesium (Cozzi and

A Whole World of Circuitry 149
Figure 5. Pre-rendered tiles of circuits as they are generated and stored on the GIS back-end,zoom levels 1, 2 and 3 (respectively from left to right).
Bagnell, 2013) or leaflet (Crickard III, 2014), among others, allow the data that is servedby those to be displayed and handled.
4 Approach and Workflow
This section first briefly describes our motivation for this approach and then goes intothe workflow. It also goes into more detail about which tools were used and in whatway.
With GIS tools being a more active field, and especially clients adopting new tech-nologies (especially the web and mobile devices), this work illustrates how GIS tech-nology can be used to assist developers in browsing their designs. This technologyessentially solves the same problem as EDA visualisation tools – allowing users tobrowse large, location-referenced data sets that cannot be shown in their entirety due toboth, their size and their detail.
As designers have usually set up their tools the way they prefer them, the approachshould pick up these settings if possible. Instead of creating another new, incompletesolution, the chosen approach is to utilize the existing tools to generate the data thatGIS back-ends require to drive the respective front-ends.
These pre-rendered tiles consist of various zoom levels that are transferred to themapping tools as required. Examples of different resolutions of a part of a small countercircuit are shown in Fig. 5.
The approach currently utilizes the slippy map tiles standard (like Google or Open-StreetMap), which is usually used to store and deliver square raster map tiles from85.0511 degrees north to south. The chosen EDA tools are used to precompute thesetiles in the required format. In this way, the raster tiles can be easily handed out to arbi-trary clients which – being web-based, desktop application, or any other platform – canbe used to browse through the circuits.
For the proof-of-concept the following tools were used:
– Qflow (Qflow, 2013) for synthesis and layouting,– Magic (Magic, 2013) for IC visualisations and generation of the raster tiles,– apache (Apache, 1995) webserver for providing raster tiles to clients and

150 Stoppe and Flenker
synthesis,layout &placement
design
raster tilesgeneration
tiles towebserver
view &inspectdesigns
(1)
(2)
(3)
(4)
Figure 6. Suggested workflow to explore IC designs with GIS.
– leaflet (Leaflet, 2011) to access and browse through the circuits’ raster tiles.
The whole workflow is illustrated in Fig. 6. It relies solely on the combination andscripting of off-the-shelf open-source tools and should thus be easily reproducible andextensible.
1. The tool Qflow (Qflow, 2013) is open source, which provides a workflow for digitalsynthesis. It uses hardware in a high-level behavioral language and turns this intoa physical circuits layout. Input data are hardware descriptions in Verilog. This issynthesized into a lower level of abstraction (transistor level). Afterwards, a layoutand placement is done for the newly received hardware description. Here it is de-termined where in the real chip the transistors and lines are placed. The result isused by the next tool.
2. The open source tool Magic (Magic, 2013) is available for the visualisation of hard-ware descriptions that have been already placed and laid out. Magic can also zoominto the hardwares visualisation and create screenshots. Our approach uses rastertiles, since Magic only generates images and does not provide a way to get vectortiles. The designs are usually depicted with a quadratic shape and are therefore eas-ily transferable to the Mercator representation of map applications. Furthermore,Magic can be executed by scripts and thus performs the generation of the tiles. Thescript specifies the position and zoom level of the respective tile and helps to easilycreate a comprehensive set of tiles on multiple levels.

A Whole World of Circuitry 151
3. Next, we need a server that provides the generated tiles to the user as easily aspossible. A web server is well suited for this purpose, which usually works withthe slippy map tiles by default. We used Apache (Apache, 1995) for our proof-of-concept. In order to access the tiled visualisation, the generated tiles only had to beplaced in the directory intended for web pages.
4. Finally, for accessing and viewing the hardware visualisation, a web page has tobe created that can cope with the map data. For this task the tool Leaflet (Leaflet,2011) – widely known in the mapping community – was used.
Figure 7. An adder circuit on a mobile device
5 Results
The resulting visualisation can be accessed from any connected device with a webbrowser that can access the server. It generally results in a smooth experience evenon mobile devices with very limited resources. Examples of a visualisation of an adderfrom the École polytechnique fédérale de Lausanne (EPFL) benchmark set can be seenin Fig. 7.
The major advantage of this technology is that it outsources the computationallyintensive parts into the synthesis flow, allowing designers to quickly and easily browsethe circuits from anywhere, as long as the device has a good enough connectivity. This

152 Stoppe and Flenker
allows designers to check results of synthesis flows from a train, collaborate with col-leagues on bug finding from their home or check oddities in the design from a hotel –as long as a connection to the hosting system is available.
The system itself is a proof-of-concept that lacks a lot of functionality. While map-ping systems support the selective display of layers, they are not exported yet. Also,the system does not support any functionality besides viewing the circuit yet – no ele-ments can be selected or investigated further in any way. Still, the experience itself mayalready be considered a step into a new direction of browsing designs ubiquitously.
The most obvious room for improvement would be to generate required tiles on-the-fly instead of precomputing them. This is because the generation of raster tiles,especially in the higher zoom levels, takes a lot of time. The on-the-fly generation stripsoff the tedious pre-processing step. Only the tiles requested by clients must be gener-ated. This can cause delays, especially with the first calls, but it allows faster access tothe service for viewing a new circuit design.
6 Conclusion
This work uses open source software connecting tools from the EDA and GIS commu-nities to visualise IC designs. The EDA tools are used for raster tile generation whereasthe GIS tools display the visualisations. Our aim was to make the visualisation of anICs design easily accessible, especially on mobile devices, so we have proposed thesimplest approach with examples to achieve this.
References
Apache (1995). https://httpd.apache.org/. Accessed: 2020-09-01.Bell, D. G., Kuehnel, F., Maxwell, C., Kim, R., Kasraie, K., Gaskins, T., Hogan, P., Coughlan,
J. (2007). Nasa world wind: Opensource gis for mission operations, 2007 IEEE AerospaceConference, IEEE, pp. 1–9.
Brorson, S. (2006). Circuit design on your linux box using geda, Linux Journal 141(7).Cozzi, P., Bagnell, D. (2013). A webgl globe rendering pipeline, GPU Pro 4: Advanced Render-
ing Techniques 4, 39–48.Crickard III, P. (2014). Leaflet. js essentials, Packt Publishing Ltd.Fitzke, J., Greve, K., Müller, M., Poth, A. (2004). Building sdis with free software–the deegree
project, Proceedings of GSDI-7, Bangalore, India.Fourie, C. J. (2018). Digital superconducting electronics design toolsstatus and roadmap, IEEE
Transactions on Applied Superconductivity 28(5), 1–12.Fourie, C. J., Volkmann, M. H. (2013). Status of superconductor electronic circuit design soft-
ware, IEEE Transactions on Applied Superconductivity 23(3), 1300205–1300205.Iacovella, S. (2017). GeoServer Beginner’s Guide: Share Geospatial Data Using Open Source
Standards, Packt Publishing Ltd.KiCAD (1992). https://kicad-pcb.org/. Accessed: 2020-09-01.Kolbe, T. H., Gröger, G., Plümer, L. (2005). Citygml: Interoperable access to 3d city models,
Geo-information for disaster management, Springer, pp. 883 – 899.Leaflet (2011). https://leafletjs.com/. Accessed: 2020-09-01.Longley, P. A., Goodchild, M., Maguire, D. J., Rhind, D. W. (2010). Geographic Information
Systems and Science, 3rd edn, Wiley Publishing.
A Whole World of Circuitry 153
Magic (2013). http://opencircuitdesign.com/magic/. Accessed: 2020-09-01.Netek, R., Masopust, J., Pavlicek, F., Pechanec, V. (2020). Performance testing on vector vs.
raster map tiles – comparative study on load metrics, ISPRS International Journal of Geo-Information 9(2), 101.
Ousterhout, J. K., Hamachi, G. T., Mayo, R. N., Scott, W. S., Taylor, G. S. (1985). The magicVLSI layout system, IEEE Design & Test of Computers 2(1), 19–30.
Qflow (2013). http://opencircuitdesign.com/qflow/. Accessed: 2020-09-01.Rabaey, J. M., Chandrakasan, A., Nikolic, B. (2008). Digital Integrated Circuits, 3rd edn, Pren-
tice Hall Press, USA.Rubin, S. M. (2012). Using the electric vlsi design system.Stefanakis, E. (2017). Web mercator and raster tile maps: two cornerstones of online map service
providers, Geomatica 71(2), 100–109.Vatsavai, R. R., Shekhar, S., Burk, T. E., Lime, S. (2006). Umn-mapserver: A high-performance,
interoperable, and open source web mapping and geo-spatial analysis system, InternationalConference on Geographic Information Science, Springer, pp. 400–417.
Wang, L.-T., Chang, Y.-W., Cheng, K.-T. T. (2009). Electronic Design Automation: Synthesis,Verification, and Test, Morgan Kaufmann Publishers Inc., San Francisco, CA, USA.

154 Stoppe and Flenker
Appendix: Magic Script to Automate Tile Extraction
s e t viewbox [ view bbox ]box v a l u e s [ exp r [ l i n d e x $viewbox 0 ] / 4 ] [ exp r [ l i n d e x $viewbox 1 ] / 4 ] [ exp r [ l i n d e x
$viewbox 2 ] / 4 ] [ exp r [ l i n d e x $viewbox 3 ] / 4 ]
s e t d e p t h 7s e t s t a r t D e p t h 0
p roc pow { a rg1 a rg2 } {i f { $a rg2 == 0} { r e t u r n 1}s e t r e s u l t $a rg1f o r { s e t i 1} { $ i < $a rg2 } { i n c r i } {
s e t r e s u l t [ exp r $ r e s u l t * $a rg1 ]}r e t u r n $ r e s u l t
}
p roc squareBox {} {i f {
[ box h e i g h t ] < [ box wid th ]} t h e n {
box h e i g h t [ exp r [ box wid th ] / 4 ]} e l s e i f {
[ box h e i g h t ] > [ box wid th ]} {
box wid th [ exp r [ box h e i g h t ] / 4 ]}
}
view
f o r { s e t i $ s t a r t D e p t h } { $ i < $d ep t h } { i n c r i } {s e t b o x D i v i d e r [ pow 2 $ i ]box v a l u e s [ exp r [ l i n d e x $viewbox 0 ] / [ exp r 4* $ b o x D i v i d e r ] ] [ exp r [ l i n d e x
$viewbox 1 ] / [ exp r 4* $ b o x D i v i d e r ] ] [ exp r [ l i n d e x $viewbox 2 ] / [ exp r 4*$ b o x D i v i d e r ] ] [ exp r [ l i n d e x $viewbox 3 ] / [ exp r 4* $ b o x D i v i d e r ] ]
box p o s i t i o n [ exp r [ l i n d e x $viewbox 0 ] / 4 ] [ exp r [ l i n d e x $viewbox 1 ] / 4 ]squareBoxp u t s " Box s i z e i s now [ box v a l u e s ] "
f o r { s e t j 0} { $ j < [ pow 2 $ i ] } { i n c r j } {f o r { s e t k 0} { $k < [ pow 2 $ i ] } { i n c r k} {
p u t s " Rende r ing zoom l e v e l $ i a t $ j / $k "s e t s t e p w i d t h [ box wid th ]box p o s i t i o n [ exp r [ l i n d e x $viewbox 0 ] / 4 + [ exp r $ s t e p w i d t h
/ 4 * $ j ] ] [ exp r [ l i n d e x $viewbox 1 ] / 4 + [ exp r $ s t e p w i d t h/ 4 * $k ] ]
s e t i n v e r s e Y I n d e x [ exp r [ pow 2 $ i ] − $k −1]p l o t pnm $i −$j − $ i n v e r s e Y I n d e x 256
}}
}
Received December 18, 2020, revised February 19, 2021, accepted February 24,2021