a view from the trenches - federal reserve bank of chicago/media/others/events/2013/... ·...
TRANSCRIPT

A view from the trenches Federal Reserve Bank of Chicago 19th Annual Capital Markets Conference, December 10th 2013
The Science of Finance

About Markit
\ 3
We are a global, diversified financial information services company
We help our customers reduce risk, improve operational efficiency and benefit from enhanced transparency
Our customers include investment banks, hedge funds, asset managers, central banks, regulators, auditors, fund administrators and insurance companies
Who we are
2003 Founded
3,000+ Employees
3,000+ Customers
20+ Offices

\ 4
How we are organised
Solutions
Versatile and scalable software platforms and services allowing institutions to manage information, reduce risk and improve operational efficiency
We have over 40 products and services organised into three divisions
Information
Indices, pricing and reference data across asset classes, enabling our customers to price instruments, value portfolios and manage risk
Processing
Processing services for fx, loans and otc derivatives, streamlining workflow and improving connectivity
OTC activity trends

\ 6
Challenges of analyzing OTC activity data
— Sides versus trades
— Blocks vs splits
— Prime brokerage/back to back
— Novations
— Cleared alpha/beta/gamma
— Termination vs compression
— Notional vs tickets
\ 7
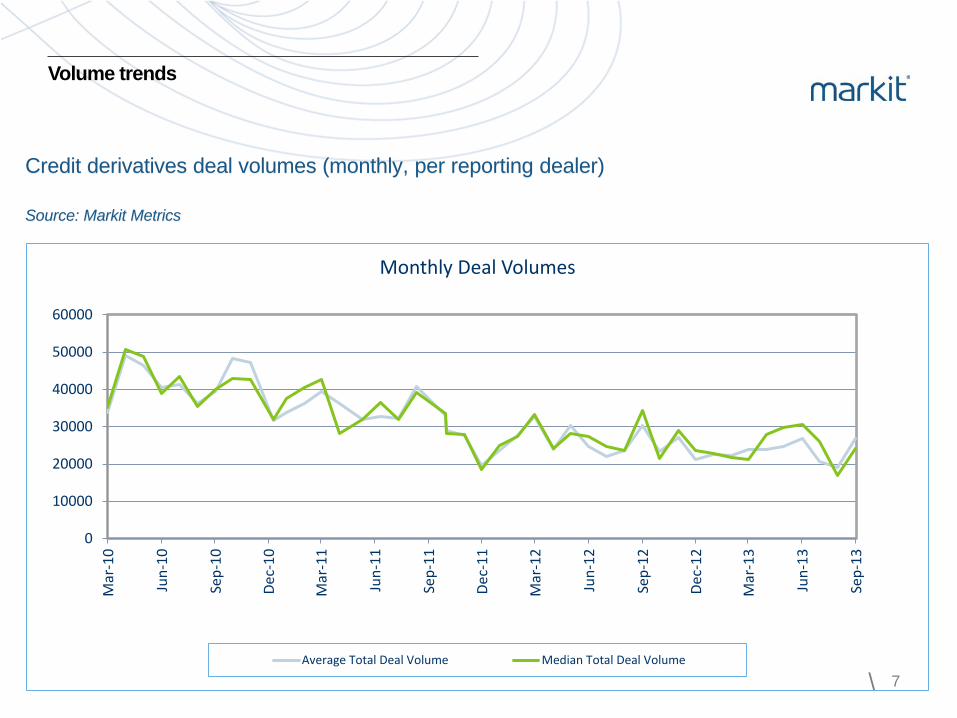
Volume trends
Credit derivatives deal volumes (monthly, per reporting dealer)
Source: Markit Metrics
0
10000
20000
30000
40000
50000
60000
Mar
-10
Jun-
10
Sep-
10
Dec-
10
Mar
-11
Jun-
11
Sep-
11
Dec-
11
Mar
-12
Jun-
12
Sep-
12
Dec-
12
Mar
-13
Jun-
13
Sep-
13
Monthly Deal Volumes
Average Total Deal Volume Median Total Deal Volume

\ 8
Volume trends
Equity derivatives deal volumes (monthly, per reporting dealer)
Source: Markit Metrics
0100020003000400050006000700080009000
Mar
-10
Jun-
10
Sep-
10
Dec-
10
Mar
-11
Jun-
11
Sep-
11
Dec-
11
Mar
-12
Jun-
12
Sep-
12
Dec-
12
Mar
-13
Jun-
13
Sep-
13
Monthly Deal Volumes
Average Total Deal Volume Median Total Deal Volume

\ 9
Volume trends
Interest rate derivatives deal volumes (monthly, per reporting dealer)
Source: Markit Metrics
05000
1000015000200002500030000350004000045000
Mar
-10
Jun-
10
Sep-
10
Dec-
10
Mar
-11
Jun-
11
Sep-
11
Dec-
11
Mar
-12
Jun-
12
Sep-
12
Dec-
12
Mar
-13
Jun-
13
Sep-
13
Monthly Deal Volumes
Average Total Deal Volume Median Total Deal Volume

\ 10
Notional vs Tickets – Interest Rates Swaps
Relative to Q1 2009 = 1
Source: trades processed by Markit derivatives
processing
Rates clearing
\ 12
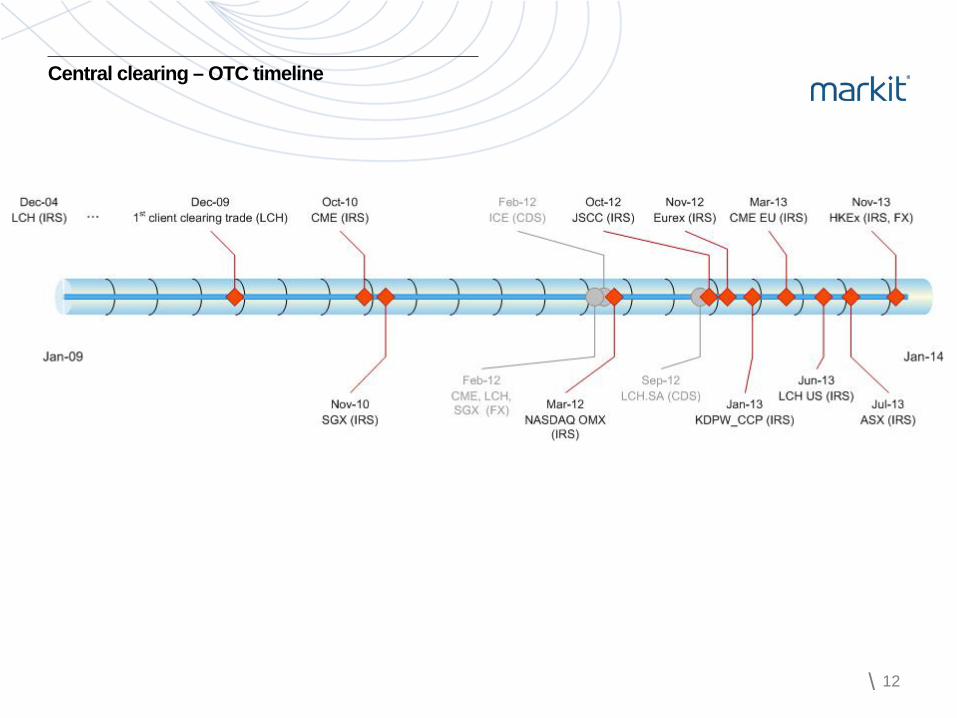
Central clearing – OTC timeline

\ 13
Central clearing
\ 14
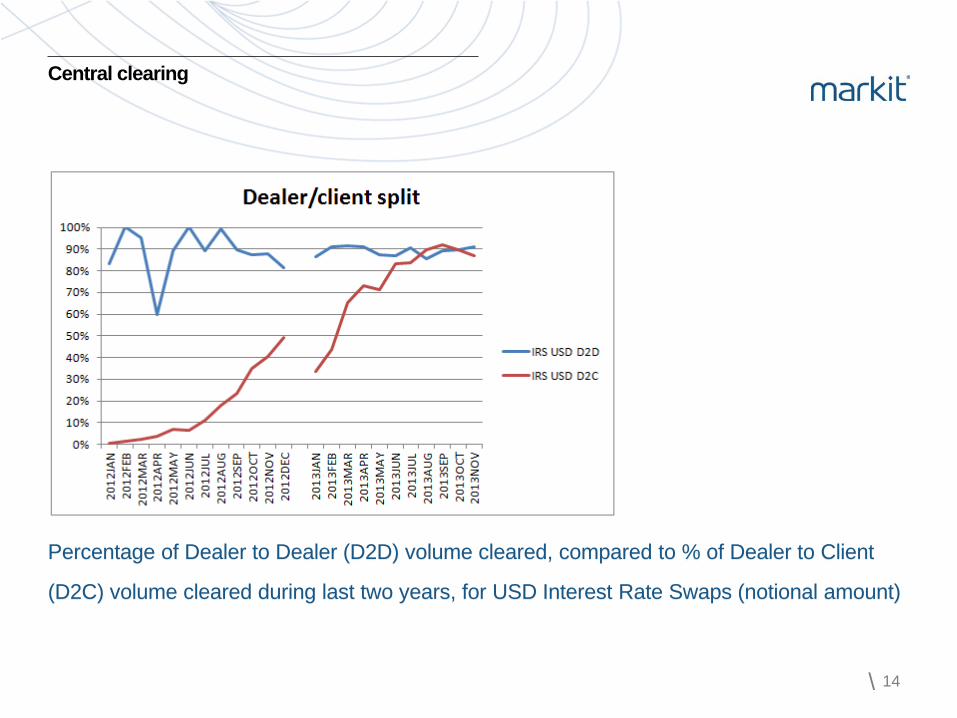
Central clearing
Percentage of Dealer to Dealer (D2D) volume cleared, compared to % of Dealer to Client
(D2C) volume cleared during last two years, for USD Interest Rate Swaps (notional amount)

\ 15
Central clearing
Percentage of Dealer to Dealer (D2D) volume cleared, compared to % of Dealer to Client
(D2C) volume cleared during last two years, for EUR Interest Rate Swaps (notional amount)

\ 16
Central clearing
Number of participants (group level) which cleared OTC rates trades per month
Sellside Buyside

\ 17
Central clearing
\ 18
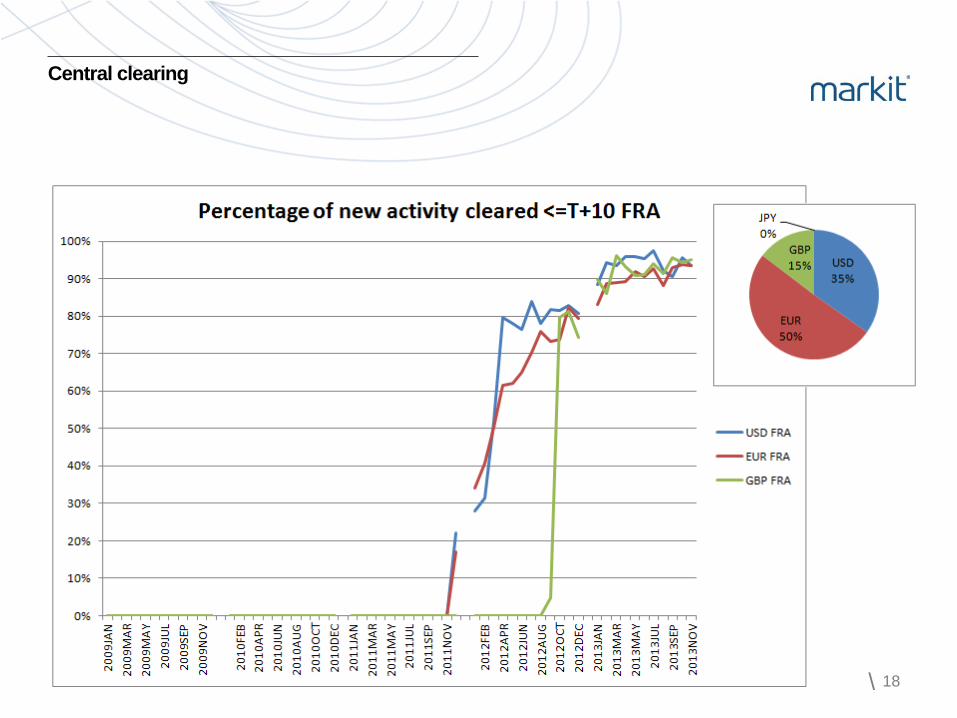
Central clearing

\ 19
Central clearing
\ 20
Central clearing
— Clearing charts show percentage of notional amount (local currency) where trades are
cleared within 10 days of recorded trade date, based on trades processed by Markit
derivatives processing (MarkitWire)
— Generally will exclude backloading, novations, compression activity

Cross border effects

\ 22
Cross border effects
Interest rates products – USD – Percentage of trades booked with either side entity type being one of four types (source: trades processed by Markit derivatives processing)
\ 23
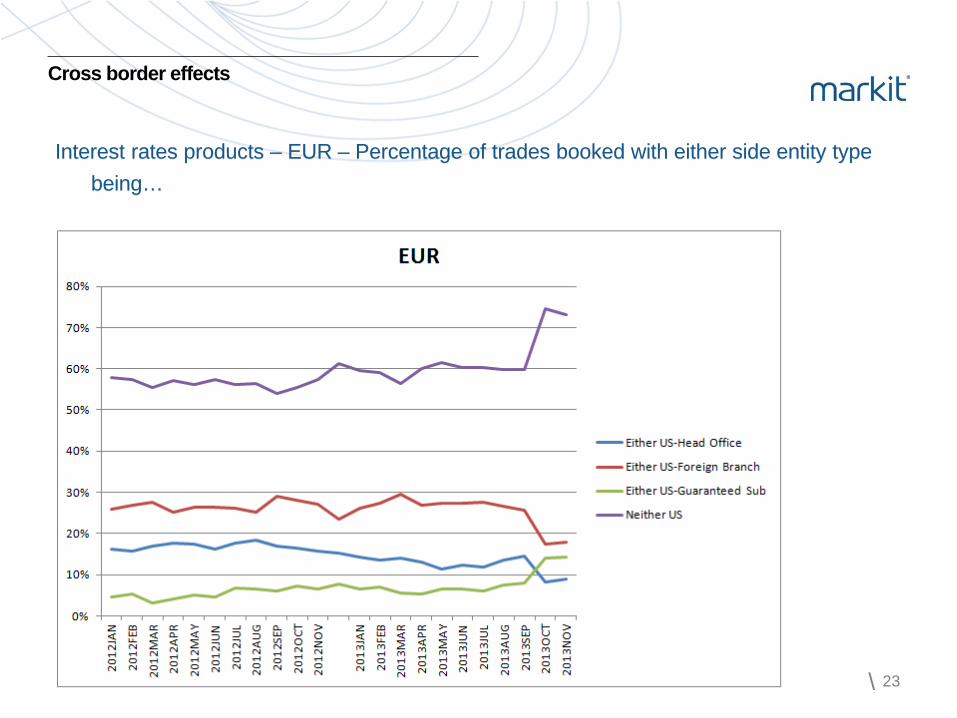
Cross border effects
Interest rates products – EUR – Percentage of trades booked with either side entity type being…
\ 24
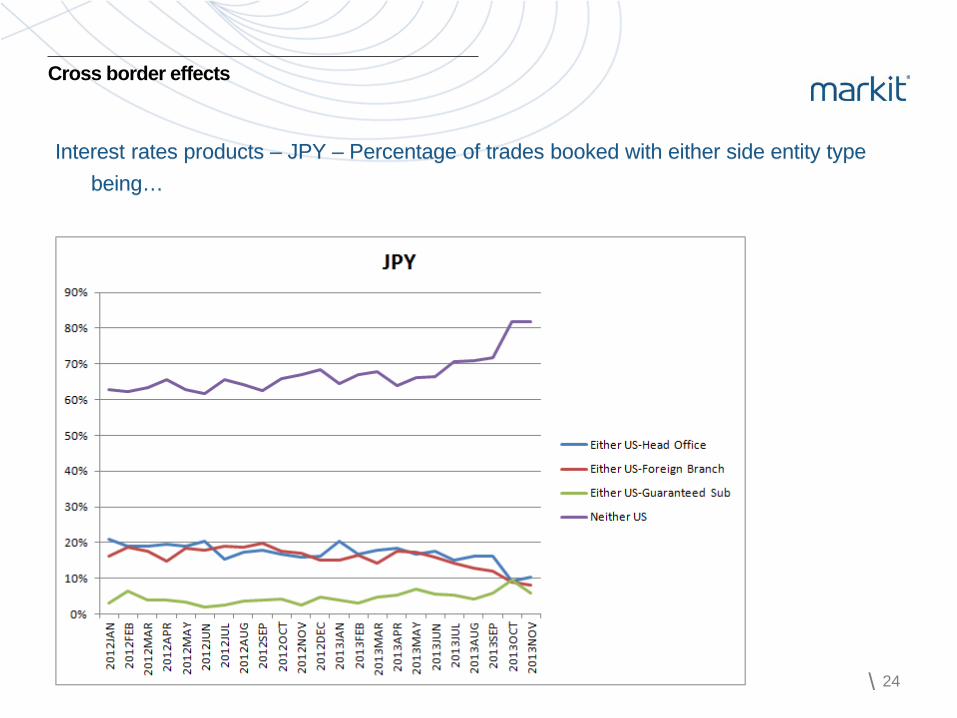
Cross border effects
Interest rates products – JPY – Percentage of trades booked with either side entity type being…

\ 25
Cross border effects
Interest rates products – Percentage of trades being booked with neither side US entity or US guaranteed sub – by currency

SEF activity

\ 27
SEF Activity
Source: Interest rates swaps transacted week of December 2nd 2013, processed via Markit
Percentage of new IRS trades booked on SEF vs. off-facility
SEF trade count by currency

\ 28
SEF Activity
Percentage of SEF trades (processed by Markit) where one, both or neither party is a US entity

Fragmentation challenges

\ 30
Data Aggregation
The Committee on Payment and Settlement Systems (CPSS) and the Technical Committee of the International Organization of Securities Commissions (IOSCO) have published their final report on the OTC derivatives data that should be collected, stored and disseminated by trade repositories (TRs) — By outlining a global framework for access and storage of data the intent is to allow
efficient aggregation of global OTC derivatives data reported to TRs.
— However, difficulties remain…

\ 31
Data Fragmentation
Each regime has adopted differing rules causing data fragmentation — The same trades are reported multiple times due to overlapping regulations, these are
reported to
— Multiple TRs
— With differing identifiers (Unique Trade Identifier)
— Containing differing data fields
— And are reported at different levels (entity versus branch)

\ 32
Different regimes have different TRs but also some regimes have approved multiple TRs, each with their own rulebooks and formats
Data Fragmentation – Multiple TRs

\ 33
Different trade identifiers are used across the various regimes
Data Fragmentation – Identifiers

\ 34
Data Fragmentation – Data Fields & Reporting Level
Each regime requires a different data set rather than following the CPSS-IOSCO guidelines — CFTC requires “all the terms of the trade”
— ESMA follows CPSS-IOSCO guidelines more closely
Each regime requires a different level of reporting — CFTC, ASIC, MAS, HKMA require entity level reporting
— ESMA and JFSA require branch level reporting, albeit using different branch identifiers BIC (JFSA) and Country Code (ESMA)

mines data pools intelligence surfaces information enables transparency builds platforms provides access scales volume extends networks & transforms business.
The information contained in this presentation is confidential. Any unauthorised use, disclosure, reproduction or dissemination, in full or in part, in any media or by any means, without the prior written permission of Markit Group Holdings Limited or any of its affiliates ("Markit") is strictly prohibited. Opinions, statements, estimates and projections in this presentation (including other media) are solely those of the individual author(s) at the time of writing and do not necessarily reflect the opinions of Markit. Neither Markit nor the author(s) has any obligation to update this presentation in the event that any content, opinion, statement, estimate or projection (collectively, "information") changes or subsequently becomes inaccurate. Markit makes no warranty, expressed or implied, as to the accuracy, completeness or timeliness of any information in this presentation, and shall not in any way be liable to any recipient for any inaccuracies or omissions. Without limiting the foregoing, Markit shall have no liability whatsoever to any recipient, whether in contract, in tort (including negligence), under warranty, under statute or otherwise, in respect of any loss or damage suffered by any recipient as a result of or in connection with any information provided, or any course of action determined, by it or any third party, whether or not based on any information provided. The inclusion of a link to an external website by Markit should not be understood to be an endorsement of that website or the site's owners (or their products/services). Markit is not responsible for either the content or output of external websites. Copyright ©2013, Markit Group Limited. All rights reserved and all intellectual property rights are retained by Markit.
Disclaimer