a very brief introduction to the concepts of marcus … very brief introduction to the concepts of...
TRANSCRIPT
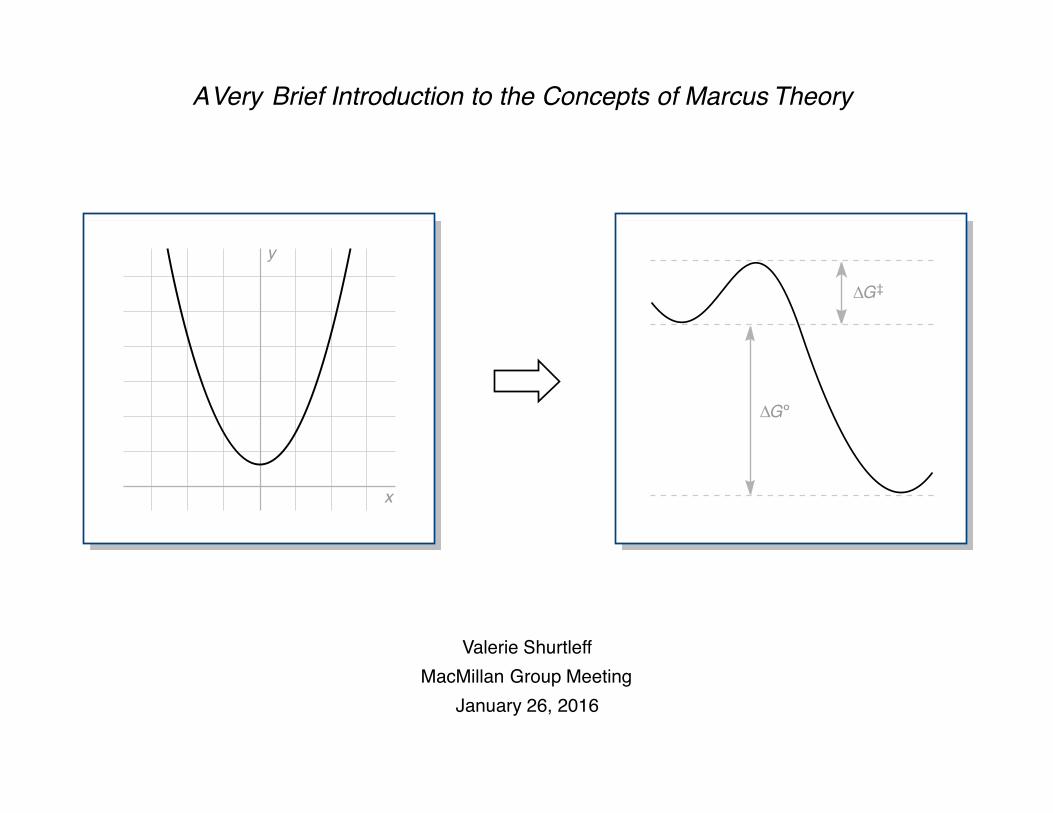
A Very Brief Introduction to the Concepts of Marcus Theory
Valerie ShurtleffMacMillan Group Meeting
January 26, 2016
x
y
∆Gº
∆G‡

Rudolph "Rudy" A. Marcus
■ Born July 21, 1923 in Montreal, Canada
California Institute of Technology. Rudolph A. Marcus. https://www.cce.caltech.edu/content/rudolph-a-marcus (accessed January 22, 2016).
■ B.Sc. in chemistry from McGill University, 1943
■ Ph.D. in chemistry from McGill University, 1946
■ Postdoctoral work at National Research Councilof Canada and University of North Carolina
■ Professor, University of Illinois at Urbana–Champaign, 1964–1978
■ Assistant Professor to Professor, PolytechnicInstitute of Brooklyn, 1951–1964
■ Arthur A. Noyes Professor of Chemistry, Caltech, 1978–2012
■ John G. Kirkwood and Arthur A. Noyes Professor of Chemistry, Caltech, 2013–present
■ Nobel Prize in Chemistry, 1992

Marcus Theory: Where Did It Come from, and What is It Good For?
Marcus theory
Originally introduced by R. A. Marcus in 1956 as a method for calculating rates ofelectron transfer in outer-sphere processes. It has since been extended and refined
significantly to address a variety of different types of transformations.
Where has this theory found the most utility?
■ electron transfer between inorganic, organometallic, and organic molecules
■ electron transfer in proteins
■ atom-transfer processes: hydrogen atom transfer, PCET
■ proton-transfer reactions
■ group-transfer reactions, e.g. SN2 reactions

Breaking Down a Reaction Coordinate Diagram
reactants
products
reaction coordinate reaction coordinate
What are the "wells" on apotential energy curve?
reactants
products

Breaking Down a Reaction Coordinate Diagram
reactants
products
ν = 0
ν = 1
ν = 2
ν = 3ν = 4
vibrationalenergy levels
parabolic shape in region of interest
simple diatomic system:wells are Morse potentials
complex system:wells represent surfaces,
composites of curves for eachavailable degree of freedom
E

Breaking Down a Reaction Coordinate Diagram
reactants
products
parabolic shape in region of interest
In Marcus theory:potential energy wells can be
geometry of parabolascan be used to calculate
kinetic barriers/reaction rates
E
represented by parabolas

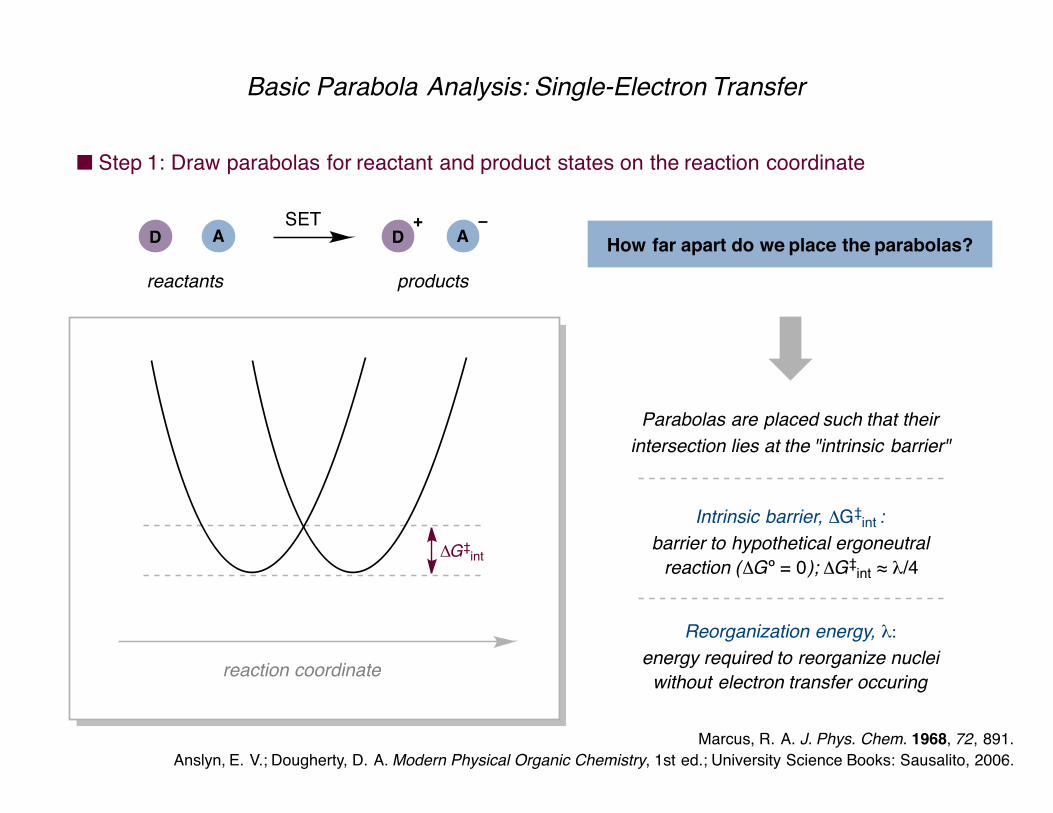
Basic Parabola Analysis: Single-Electron Transfer
■ Step 1: Draw parabolas for reactant and product states on the reaction coordinate
Anslyn, E. V.; Dougherty, D. A. Modern Physical Organic Chemistry, 1st ed.; University Science Books: Sausalito, 2006.
reaction coordinate
What is the "reaction coordinate?"
reactantstate
productstate
Reaction coordinate:represents the nuclear coordinatesof the entire system undergoing the
Nuclear coordinates:indicate bond distances and anglesangles between and within reactants
reaction, including solvation
D A D ASET
reactants products
+ –
Basic Parabola Analysis: Single-Electron Transfer
■ Step 1: Draw parabolas for reactant and product states on the reaction coordinate
Anslyn, E. V.; Dougherty, D. A. Modern Physical Organic Chemistry, 1st ed.; University Science Books: Sausalito, 2006.
reaction coordinate
How far apart do we place the parabolas?
Parabolas are placed such that theirintersection lies at the "intrinsic barrier"
Intrinsic barrier, ΔG‡int :barrier to hypothetical ergoneutral
reaction (ΔGº = 0); ΔG‡int ≈ λ/4
Reorganization energy, λ:energy required to reorganize nuclei
without electron transfer occuring
∆G‡int
Marcus, R. A. J. Phys. Chem. 1968, 72, 891.
D A D ASET
reactants products
+ –
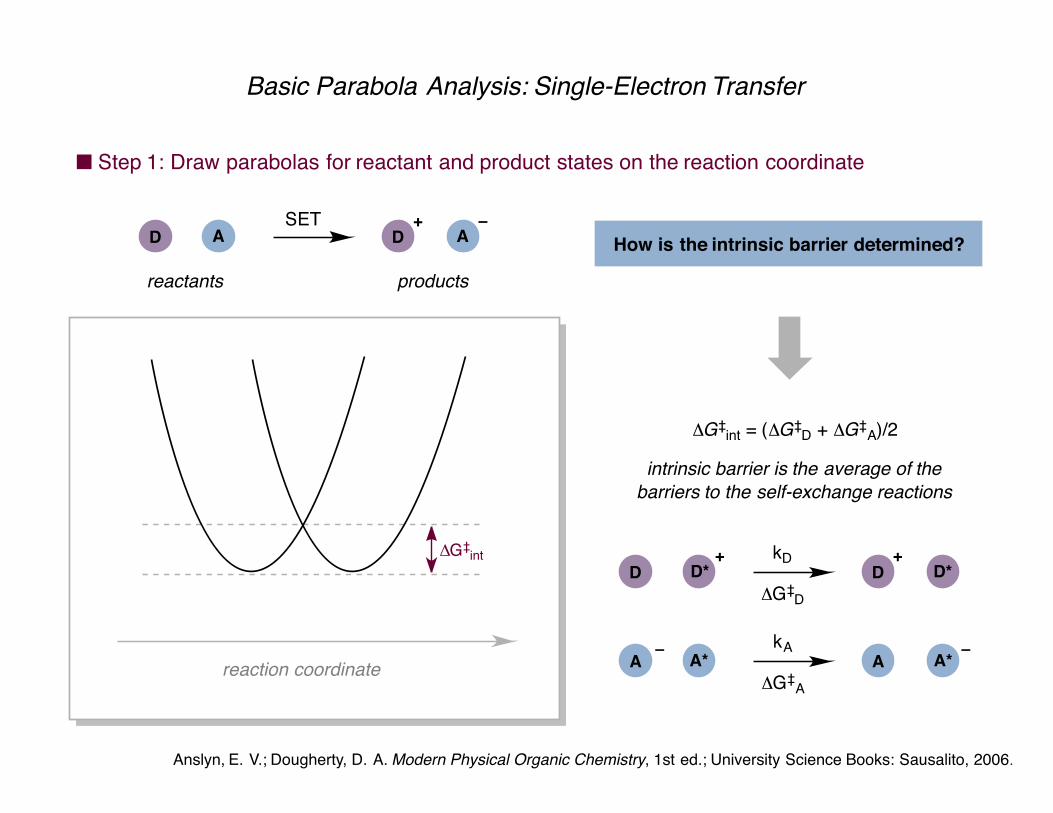
Basic Parabola Analysis: Single-Electron Transfer
■ Step 1: Draw parabolas for reactant and product states on the reaction coordinate
Anslyn, E. V.; Dougherty, D. A. Modern Physical Organic Chemistry, 1st ed.; University Science Books: Sausalito, 2006.
reaction coordinate
How is the intrinsic barrier determined?
ΔG‡int = (ΔG‡D + ΔG‡A)/2
intrinsic barrier is the average of the
D D* D D*kD
A A* A A*kA
barriers to the self-exchange reactions
ΔG‡D
ΔG‡A
∆G‡int +
–
+
–
D A D ASET
reactants products
+ –

Basic Parabola Analysis: Single-Electron Transfer
■ Step 2: Incorporate thermodynamic parameters by adjusting parabola height
Anslyn, E. V.; Dougherty, D. A. Modern Physical Organic Chemistry, 1st ed.; University Science Books: Sausalito, 2006.
reaction coordinate
Change parabola height to reflect ΔGº
Exergonic reaction:
∆G‡
lower product parabola to reflect ΔGº < 0
∆GºEndergonic reaction:
raise product parabola to reflect ΔGº > 0
λ
D A D ASET
reactants products
+ –

D A D ASET
reactants products
+ –
Basic Parabola Analysis: Single-Electron Transfer
■ Step 3: Calculate values of interest: ΔG‡, rate, lateness/earliness of transition state
Stubbe, J.; Nocera, D. G.; Yee, C. S.; Chang, M. C. Y. Chem Rev. 2003, 103 , 2167.
reaction coordinate
Overlapping parabolas map potential E curve
Calculation of kinetic barrier:
∆G‡
y-coordinate of point of intersection
∆Gº
(λ + ΔGº)2
4λΔG‡ =
Calculation of reaction rate:using the Eyring equation
kBTh
kET = κ exp–(λ + ΔGº)2
4λRT
λ

D A D ASET
reactants products
+ –
Basic Parabola Analysis: Single-Electron Transfer
■ Step 3: Calculate values of interest: ΔG‡, rate, lateness/earliness of transition state
Stubbe, J.; Nocera, D. G.; Yee, C. S.; Chang, M. C. Y. Chem Rev. 2003, 103 , 2167.
reaction coordinate
Overlapping parabolas map potential E curve
Earliness/lateness of transition state:
∆G‡
x-coordinate of point of intersection
∆Gº
λ+ΔGº
(2kλ)1/2x‡ =
λ
where k = composite force constant

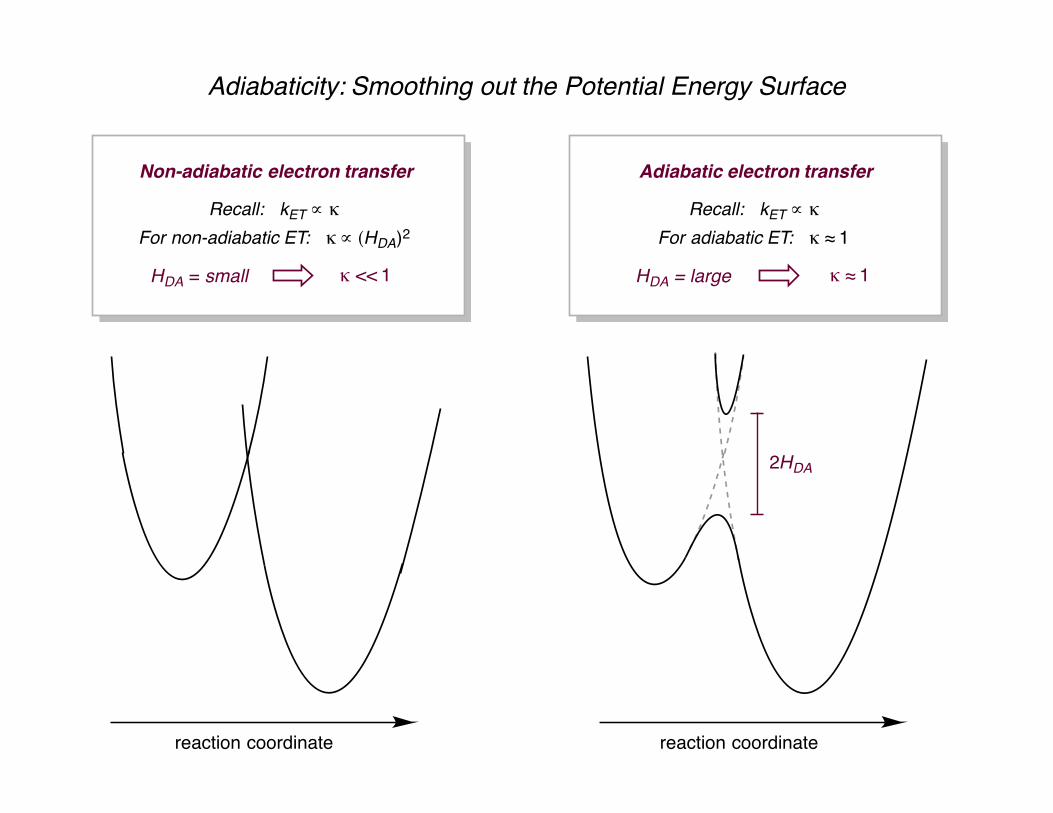
Adiabaticity: Smoothing out the Potential Energy Surface
reaction coordinatereaction coordinate
2HDA
Non-adiabatic electron transfer
Nuclei do not move during electrontransfer, jump between states required
HDA = electronic coupling = small
Adiabatic electron transfer
Nuclear motion is coupled to electronmotion, system remains on one surface
HDA = electronic coupling = large
Adiabaticity: Smoothing out the Potential Energy Surface
reaction coordinatereaction coordinate
2HDA
Non-adiabatic electron transfer
HDA = small
Adiabatic electron transfer
Recall: kET ∝ κ
For non-adiabatic ET: κ ∝ (HDA)2
κ << 1 HDA = large
Recall: kET ∝ κ
For adiabatic ET: κ ≈ 1
κ ≈ 1
reaction coordinate
ΔGº
ΔG‡
reaction coordinate
ΔGº
ΔG‡
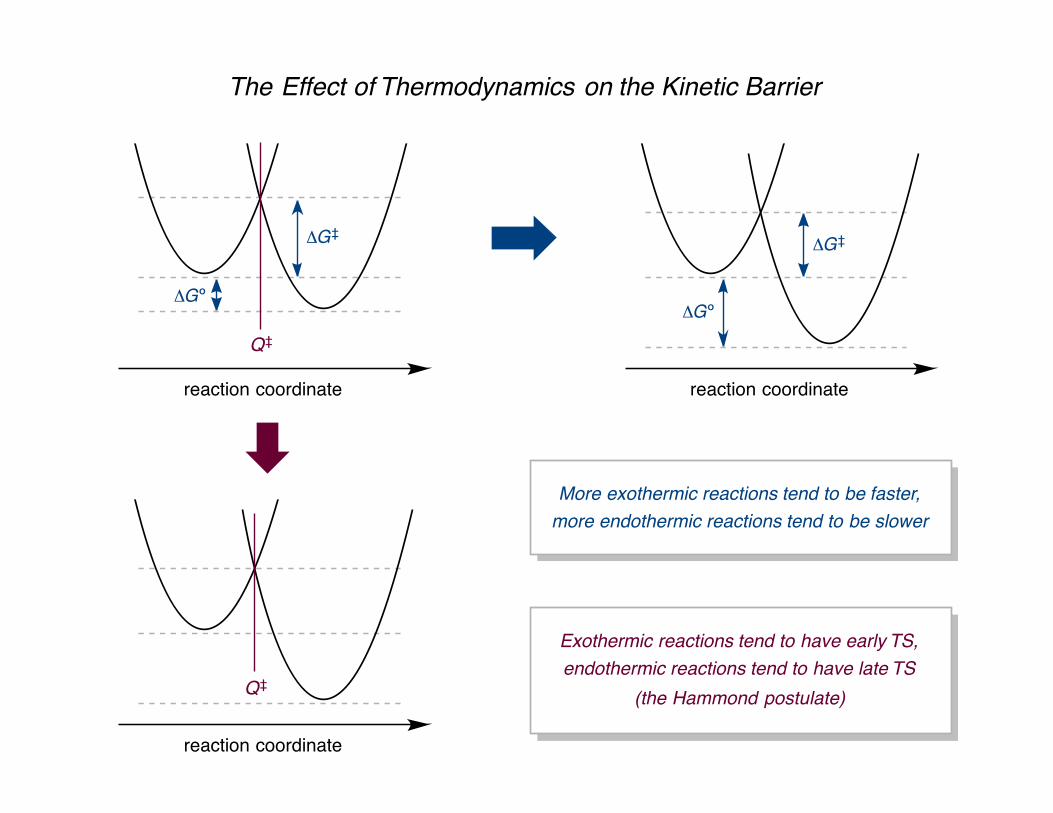
The Effect of Thermodynamics on the Kinetic Barrier
reaction coordinate
More exothermic reactions tend to be faster,more endothermic reactions tend to be slower
Q‡
Q‡
Exothermic reactions tend to have early TS,endothermic reactions tend to have late TS
(the Hammond postulate)
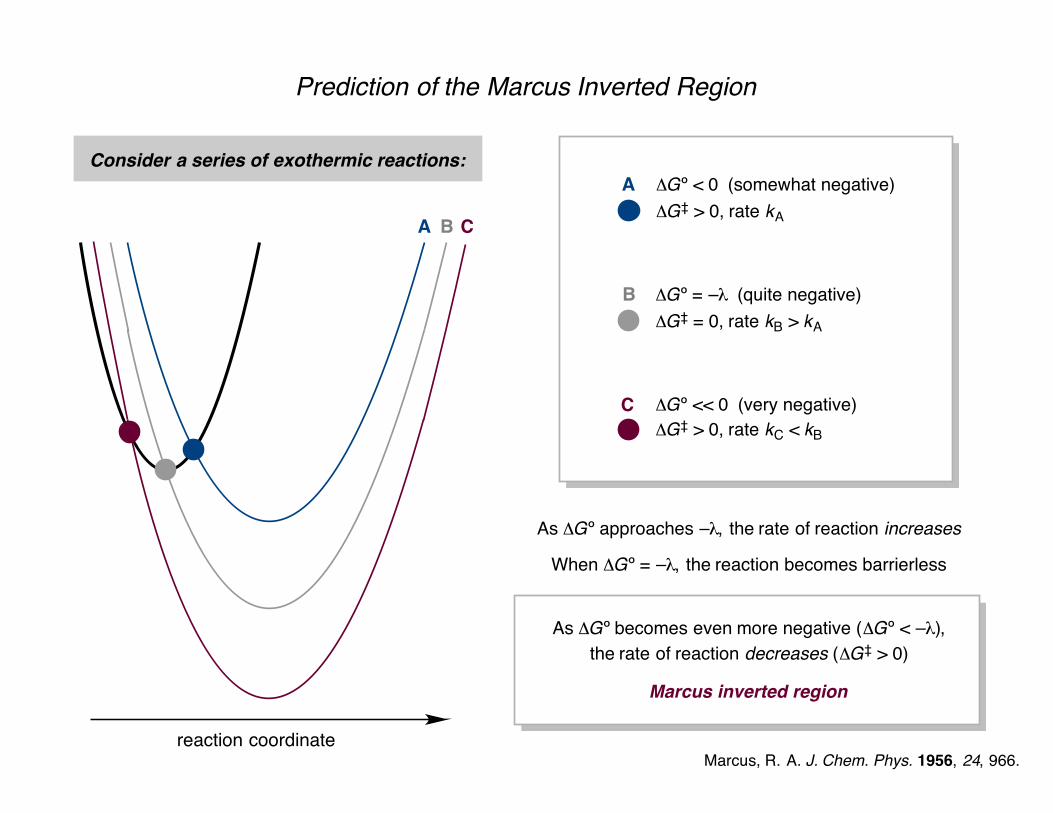
Prediction of the Marcus Inverted Region
reaction coordinate
Consider a series of exothermic reactions:ΔGº < 0 (somewhat negative)ΔG‡ > 0, rate kAA
A
As ΔGº approaches –λ, the rate of reaction increases
ΔGº = –λ (quite negative)ΔG‡ = 0, rate kB > kA
B
B
As ΔGº approaches –λ, the rate of reaction increases
When ΔGº = –λ, the reaction becomes barrierless
ΔGº << 0 (very negative)ΔG‡ > 0, rate kC < kB
C
C
Marcus inverted region
As ΔGº becomes even more negative (ΔGº < –λ),the rate of reaction decreases (ΔG‡ > 0)
As ΔGº approaches –λ, the rate of reaction increases
When ΔGº = –λ, the reaction becomes barrierless
Marcus inverted region
As ΔGº becomes even more negative (ΔGº < –λ),the rate of reaction decreases (ΔG‡ > 0)
Marcus, R. A. J. Chem. Phys. 1956, 24, 966.

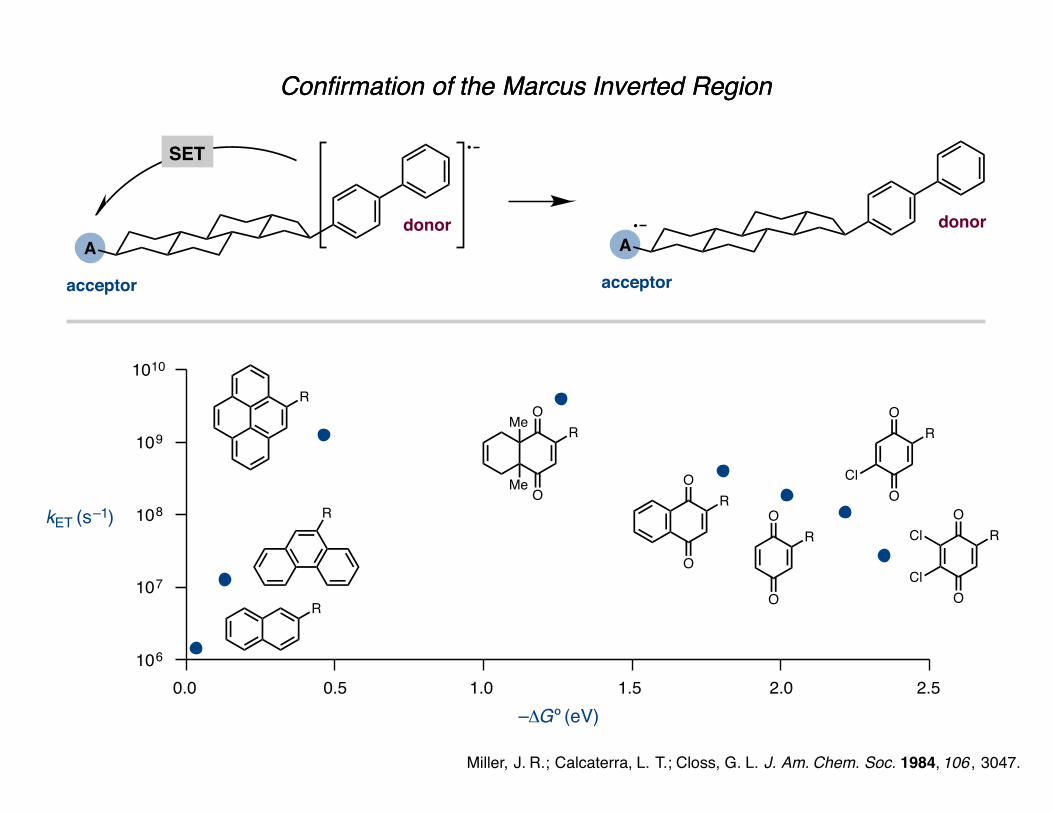
Confirmation of the Marcus Inverted Region
A
Miller, J. R.; Calcaterra, L. T.; Closs, G. L. J. Am. Chem. Soc. 1984, 106 , 3047.
donor
acceptor
SET
Adonor
acceptor
Closs and Miller, 1984pulse radiolysis study of intramoleculare– transfer between an electron donor
and a range of electron acceptors
Confirmation of the Marcus Inverted Region
kET (s–1)
–ΔGº (eV)
106
107
108
109
1010
R
R
RO
O
RMe
Me O
O
RO
O
RO
O
R
Cl
Cl
O
O
R
Cl
0.5 1.0 1.5 2.0 2.50.0
Confirmation of the Marcus Inverted Region
A
Miller, J. R.; Calcaterra, L. T.; Closs, G. L. J. Am. Chem. Soc. 1984, 106 , 3047.
donor
acceptor
SET
Adonor
acceptor

Confirmation of the Marcus Inverted Region
A
Miller, J. R.; Calcaterra, L. T.; Closs, G. L. J. Am. Chem. Soc. 1984, 106 , 3047.
donor
acceptor
SET
Adonor
acceptor
kET (s–1)
–ΔGº (eV)
106
107
108
109
1010
R
R
RO
O
RMe
Me O
O
RO
O
RO
O
R
Cl
Cl
O
O
R
Cl
0.5 1.0 1.5 2.0 2.50.0
Closs and Miller, 1984more negative ΔGº produces increase in
rate, then decrease in rate after maximum:evidence for the Marcus inverted reagion
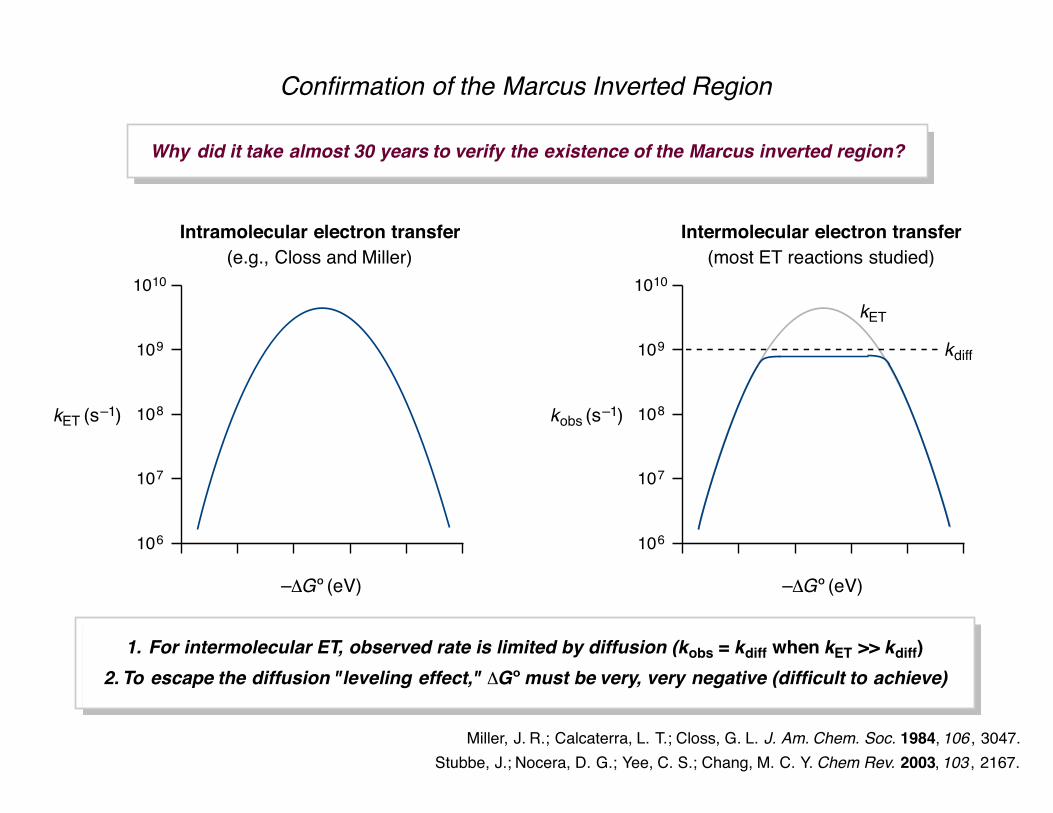
Confirmation of the Marcus Inverted Region
Why did it take almost 30 years to verify the existence of the Marcus inverted region?
Stubbe, J.; Nocera, D. G.; Yee, C. S.; Chang, M. C. Y. Chem Rev. 2003, 103 , 2167.
kET (s–1)
–ΔGº (eV)
106
107
108
109
1010
Miller, J. R.; Calcaterra, L. T.; Closs, G. L. J. Am. Chem. Soc. 1984, 106 , 3047.
Intramolecular electron transfer
kobs (s–1)
–ΔGº (eV)
106
107
108
109
1010
Intermolecular electron transfer(e.g., Closs and Miller) (most ET reactions studied)
kdiff
1. For intermolecular ET, observed rate is limited by diffusion (kobs = kdiff when kET >> kdiff)2. To escape the diffusion "leveling effect," ΔGº must be very, very negative (difficult to achieve)
kET
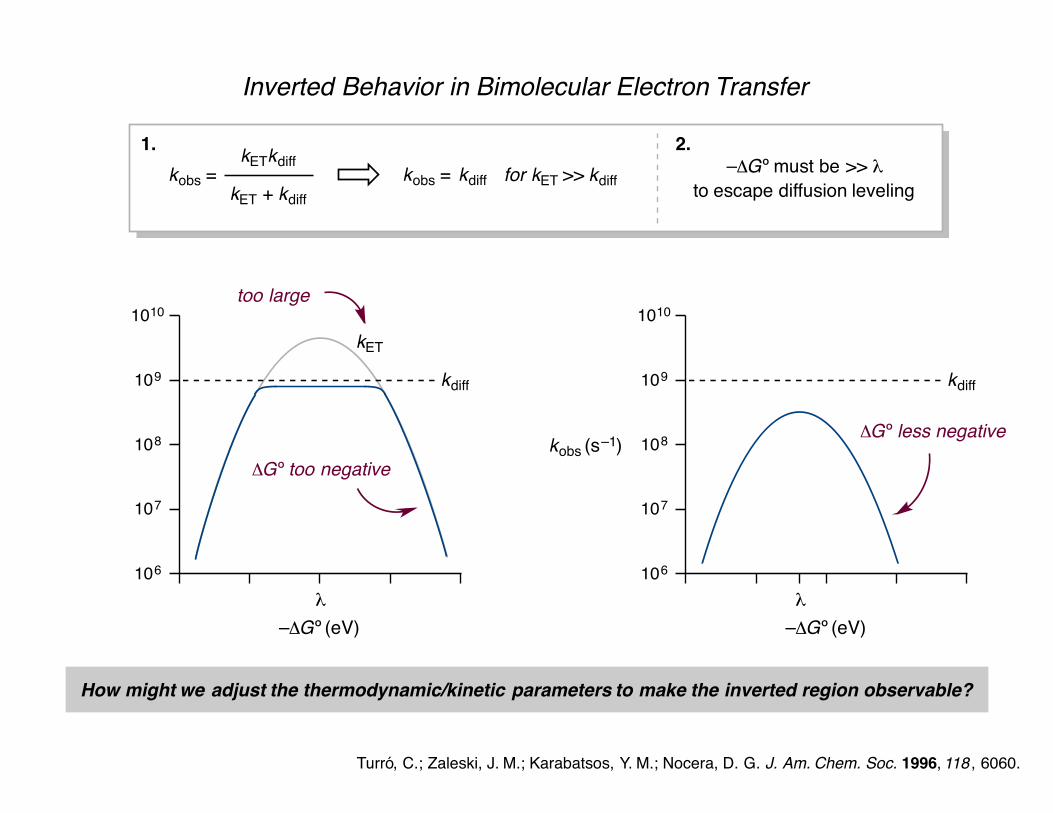
Inverted Behavior in Bimolecular Electron Transfer
Turró, C.; Zaleski, J. M.; Karabatsos, Y. M.; Nocera, D. G. J. Am. Chem. Soc. 1996, 118 , 6060.
–ΔGº (eV)
106
107
108
109
1010
kdiff
How might we adjust the thermodynamic/kinetic parameters to make the inverted region observable?
kET
too large
ΔGº too negative
kobs =kETkdiff
kET + kdiffkobs = for kET >> kdiffkdiff
1. 2.–ΔGº must be >> λ
to escape diffusion leveling
λ
–ΔGº (eV)
106
107
108
109
1010
kdiff
λ
ΔGº less negativekobs (s–1)
Select a system with modest reorganization energy and driving force

Inverted Behavior in Bimolecular Electron Transfer
Turró, C.; Zaleski, J. M.; Karabatsos, Y. M.; Nocera, D. G. J. Am. Chem. Soc. 1996, 118 , 6060.
RuII
N
N
NN
NN
RuL3*2+
*
oxidizing excited statecytochrome creduced form
SET
2Cl–
RuI
N
N
NN
NN
RuL3+
reduced statecytochrome coxidized form
Cl–
[FeII] [FeIII]
Cytochrome c
moderate reorganization energy mostly due to solvation effects,known to exhibit inverted region kinetics at ΔGº ≈ –1 V in fixed-distance ET
RuL3*2+
reduction potentials well-matched for SET with cytochrome c to provide ΔGº ≈ –1 V

RuII complex –ΔGº kobs (M–1s–1)
Ru(dOMephen)32+
Ru(dMephen)32+
Ru(phen)32+
Ru(dCF3bpy)32+
0.69 V0.40 V0.52 V1.32 V
5.68 × 10⁸
2.84 × 10⁸
4.36 × 10⁸
3.11 × 10⁸
diffusion limit = kdiff = 8.8 × 10⁸
kobs < kdiff in all cases
inverted region should be apparent
Inverted Behavior in Bimolecular Electron Transfer
Turró, C.; Zaleski, J. M.; Karabatsos, Y. M.; Nocera, D. G. J. Am. Chem. Soc. 1996, 118 , 6060.
RuII
N
N
NN
NN
RuL3*2+
*
oxidizing excited statecytochrome creduced form
SET
2Cl–
RuI
N
N
NN
NN
RuL3+
reduced statecytochrome coxidized form
Cl–
[FeII] [FeIII]
kdiff
kET
Indeed, inverted behavior is observed
flattening of curve is apparentdue to contribution of kdiff
dMephenphen
dOMephen
dCF3bpy
Rational tuning of thermodynamic andkinetic parameters allows providesdesired electron transfer behavior

The Influence of Donor-Acceptor Distance on Electron Transfer Rates
Ru2+ N
N
N
N
N N
Me
Me
Me
Me
Nn n
O
O
MeO
MeO
excitation;2 × SET
Ru2+ N
N
N
N
N N
Me
Me
Me
Me
Nn n
O
O
MeO
MeO
acceptor
donor
(SET)
charge-recombination
measure kETfor n = 1, 2, 3
Kuss-Petermann, M.; Wenger, O. S. J. Am. Chem. Soc. 2016, DOI: 10.1021/jacs.5b11953.
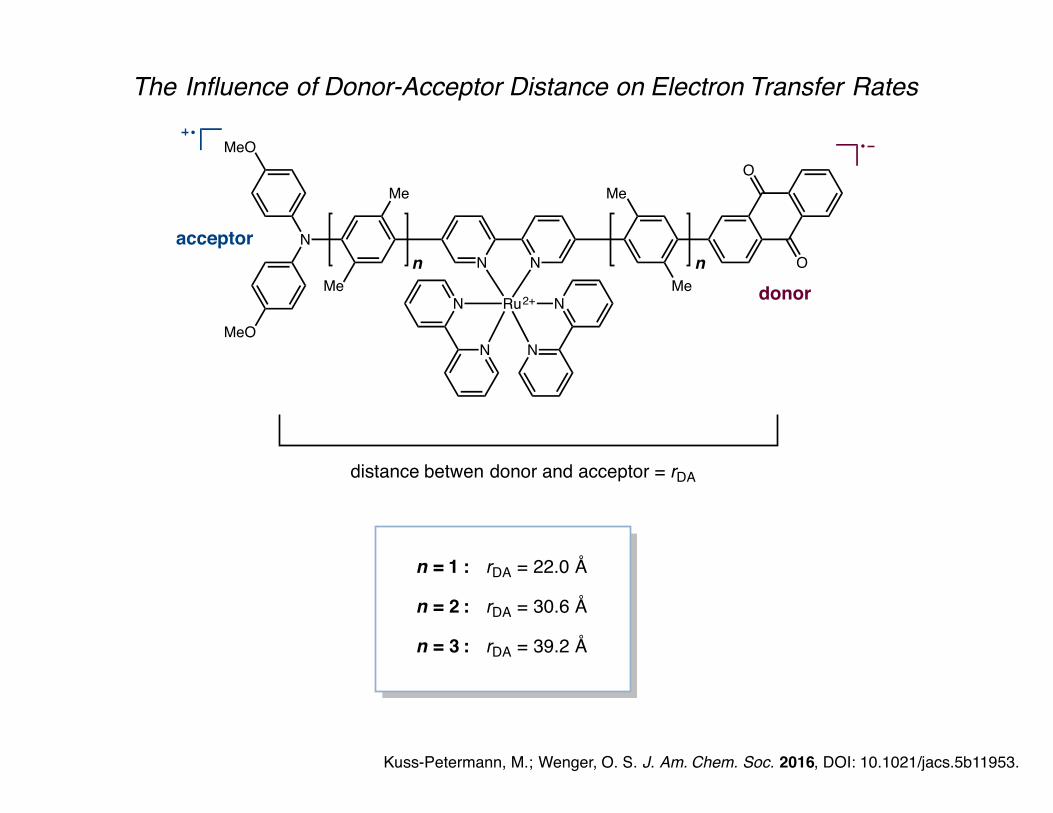
n = 1 : rDA = 22.0 Å
distance betwen donor and acceptor = rDA
n = 2 : rDA = 30.6 Å
n = 3 : rDA = 39.2 Å
The Influence of Donor-Acceptor Distance on Electron Transfer Rates
Ru2+ N
N
N
N
N N
Me
Me
Me
Me
Nn n
O
O
MeO
MeO
acceptor
donor
Kuss-Petermann, M.; Wenger, O. S. J. Am. Chem. Soc. 2016, DOI: 10.1021/jacs.5b11953.

The Influence of Donor-Acceptor Distance on Electron Transfer Rates
Ru2+ N
N
N
N
N N
Me
Me
Me
Me
Nn n
O
O
MeO
MeO
acceptor
donor
Kuss-Petermann, M.; Wenger, O. S. J. Am. Chem. Soc. 2016, DOI: 10.1021/jacs.5b11953.
Calculation of ΔGº from reduction potentials
E1/2red(D+/D) E1/2red(A/A–)
n = 1
n = 2
n = 3
0.63 V
0.59 V
0.58 V
–0.70 V
–0.70 V
–0.65 V
–ΔGº
1.33 V
1.29 V
1.23 V
Linker length does not significantly effect the thermodynamic driving force
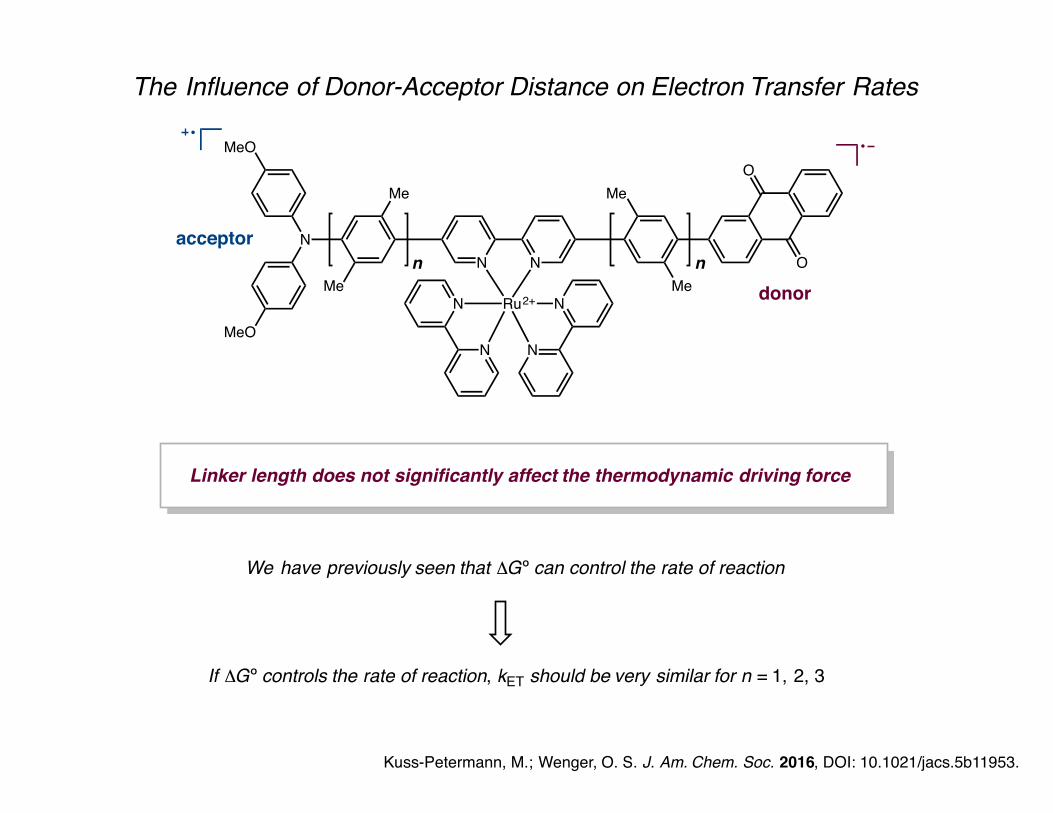
Linker length does not significantly affect the thermodynamic driving force
We have previously seen that ΔGº can control the rate of reaction
If ΔGº controls the rate of reaction, kET should be very similar for n = 1, 2, 3
The Influence of Donor-Acceptor Distance on Electron Transfer Rates
Ru2+ N
N
N
N
N N
Me
Me
Me
Me
Nn n
O
O
MeO
MeO
acceptor
donor
Kuss-Petermann, M.; Wenger, O. S. J. Am. Chem. Soc. 2016, DOI: 10.1021/jacs.5b11953.

The Influence of Donor-Acceptor Distance on Electron Transfer Rates
Kuss-Petermann, M.; Wenger, O. S. J. Am. Chem. Soc. 2016, DOI: 10.1021/jacs.5b11953.
We have previously seen that ΔGº can control the rate of reaction
If ΔGº controls the rate of reaction, kET should be very similar for n = 1, 2, 3
n = 1
n = 2
n = 3
linker length changes kET
by 1 to 2 orders of magnitude
parameters other than ΔGºinfluence the reaction rate
The Influence of Donor-Acceptor Distance on Electron Transfer Rates
Kuss-Petermann, M.; Wenger, O. S. J. Am. Chem. Soc. 2016, DOI: 10.1021/jacs.5b11953.
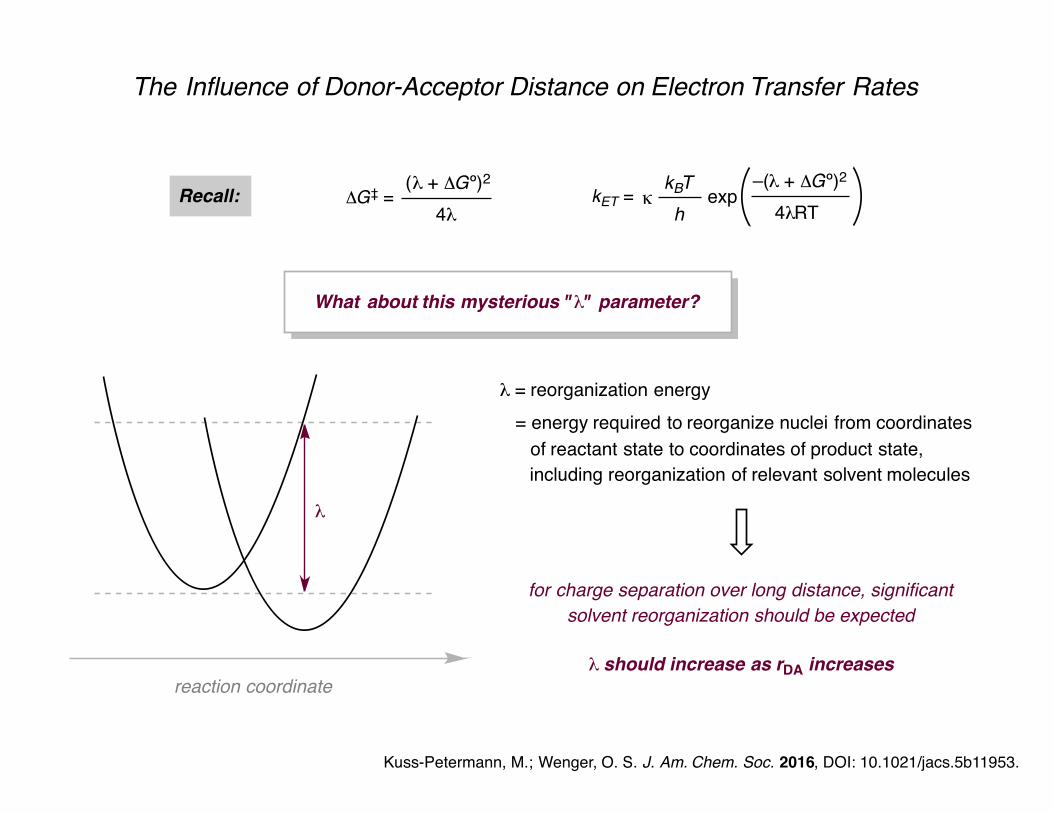
kBTh
kET = κ exp–(λ + ΔGº)2
4λRT(λ + ΔGº)2
4λΔG‡ =Recall:
What about this mysterious "λ" parameter?
λ = reorganization energy= energy required to reorganize nuclei from coordinates
of reactant state to coordinates of product state,
reaction coordinate
λ
including reorganization of relevant solvent molecules
for charge separation over long distance, significantsolvent reorganization should be expected
λ should increase as rDA increases

The Influence of Donor-Acceptor Distance on Electron Transfer Rates
Kuss-Petermann, M.; Wenger, O. S. J. Am. Chem. Soc. 2016, DOI: 10.1021/jacs.5b11953.
Why does kET increase from n = 1 to n = 2?
n = 1
n = 2
n = 3
(Shouldn't increasing rDA slow down the reaction?)

The Influence of Donor-Acceptor Distance on Electron Transfer Rates
Kuss-Petermann, M.; Wenger, O. S. J. Am. Chem. Soc. 2016, DOI: 10.1021/jacs.5b11953.
reaction coordinate
λ
ΔGº
reaction coordinate
λ
ΔGº
reaction coordinate
λ
ΔGº
n = 1, rDA = small n = 2, rDA = intermediate n = 3, rDA = largeinverted region barrierless reaction normal region
kET = 3.58 × 10⁵ s–1 kET = 2.87 × 10⁶ s–1 kET = 1.53 × 10⁴ s–1
ΔG‡ = 43 meV ΔG‡ = –2 meV ΔG‡ = 126 meV

In the inverted region, kET increases with increasing distance between donor and acceptor
The Influence of Donor-Acceptor Distance on Electron Transfer Rates
Kuss-Petermann, M.; Wenger, O. S. J. Am. Chem. Soc. 2016, DOI: 10.1021/jacs.5b11953.
Implications for solar energy conversion (and other applications?)
For efficient solar energy conversion:photoinduced ET must be fast, thermal charge recombination must be slow
Challenges:
1. photoinduced ET generally occurs in the normal region(donor and acceptor must be close together for efficient ET)
2. thermal charge recombination generally occurs in the inverted region(rate of ET increases as donor and acceptor diffuse, until they reach critical rDA)