a value chain analysis of the u.s. pork industry
TRANSCRIPT

DUKE UNIVERSITY Social Science Research Institute • 2024 W Main St • Bay B/Erwin Mill • Durham, NC 27705
http://www.cggc.duke.edu • Phone: (919) 681-6564 • Fax: (919) 681-4183
A Value Chain Analysis of the
U.S. Pork Industry Report Prepared for Environmental Defense Fund
Marcy Lowe and Gary Gereffi
Center on Globalization, Governance & Competitiveness Duke University October 3, 2008 CGGC Researchers: Gloria Ayee, Ryan Denniston, Jennifer Kim, Naiquan Sang The authors thank Greg Andeck of Environmental Defense Fund for valuable input on early drafts

2
Table of Contents I. Introduction ............................................................................................................................................. 3 II. Overview of Pork Industry ..................................................................................................................... 4
A. U.S. Market ......................................................................................................................................... 7 B. Hog Farming Characteristics ............................................................................................................. 9 C. Trends and Geography ..................................................................................................................... 10
III. U.S. Pork Industry Value Chain .......................................................................................................... 14 IV. U.S. Pork Industry: Economic actors and leverage ........................................................................... 18
A. Eliminated Boxes ............................................................................................................................. 20 B. Key Boxes ....................................................................................................................................... 23 C. Top Companies in Each Key Box ................................................................................................... 29
V. Company Profiles ................................................................................................................................. 35 List of Figures Figure 1. U.S. Consumption of Beef, Pork, Chicken and Fish, 1986-2006 .............................................. 8 Figure 2. U.S. per capita meat consumption, 1985-2017 projection ......................................................... 9 Figure 3. Number of U.S. Hog Operations1 and Hog Inventory, 1992-2004 ......................................... 11 Figure 4. Number of Large Hog Farms, by State, 2007 .......................................................................... 14 Figure 5. U.S. Pork Industry Value Chain ................................................................................................ 15 Figure 6. Comparison of U.S. Hog Farm Production Costs, by Farm type ............................................ 17 Figure 7. U.S. Pork Industry Value Chain, Multi-Segment Player: Tyson Foods, Inc. ......................... 18 Figure 8. U.S. Pork Industry Value Chain, Multi-Segment Player: Smithfield Foods, Inc. .................. 18 Figure 9. U.S. Pork Industry Value Chain, Key Boxes ........................................................................... 23 Figure 10. U.S. Grocery Market, 2002 and 2004 ..................................................................................... 27 Figure 11. Distribution of Pork Served in U.S. Restaurants .................................................................... 27 List of Tables Table 1. Production and Trade for Major Global Pork Producers in 2007, 1997-2007 ........................... 5 Table 2. Ten Largest Foreign Markets for U.S. Pork, January-June 2008, 2007 ..................................... 7 Table 3. U.S. Consumption of Beef, Pork, Chicken, and Fish, 1986-2006 .............................................. 8 Table 4. Hogs Life Cycle Timeline ........................................................................................................... 10 Table 5. Major Structural Changes in U.S. Hog Production, 1992-2004 ............................................... 12 Table 6. Characteristics of Top Hog Farming States (By Inventory), 1997 and 2007 ........................... 13 Table 7. Cost Structure of U.S. Hog Farms by Farm Type, 2006 ........................................................... 16 Table 8. U.S. Pork Industry: Economic Actors and Leverage ................................................................ 20 Table 9. Top 5 U.S. Compound Feed Producers ..................................................................................... 30 Table 10. Top 5 U.S. Hog Producers ...................................................................................................... 31 Table 11. Top U.S. Hog Packers/Processors ............................................................................................ 32 Table 12. Top U.S. Food Service Manufacturers ..................................................................................... 33 Table 13. Top U.S. Food Service Suppliers ............................................................................................. 34
3
I. Introduction The Center on Globalization, Governance & Competitiveness at Duke University has undertaken a series of value chain analyses of selected U. S. industries on behalf of the Corporate Partnerships Program of Environmental Defense Fund (EDF). EDF is known for collaborating with leading corporations to find solutions that make good business sense while achieving significant environmental benefits, thus effecting win-win change. Value chain analysis is a useful tool for finding such solutions, by understanding the relationships and challenges within a given industry and identifying the potential leverage points. Examples of EDF’s corporate partnerships over the past two decades include working with McDonald’s to eliminate polystyrene clamshell packaging, with FedEx to develop the first hybrid delivery trucks, and with DuPont to ensure the safe development of nanoscale products. EDF’s experience has shown that when it partners with a corporation that has a great deal of influence, this strategy can transform an entire industry, as in the case of McDonald’s, where many other fast-food companies followed McDonald’s lead and realized there was a compelling business case for eliminating polystyrene containers. This report will present a value chain analysis of the U.S. pork industry. As the world’s third largest pork producer—and second largest consumer, importer and exporter of pork and pork products—the United States had a 2007 inventory of some 67 million hogs. More than 80% of this inventory was on large farms containing at least 2,000 animals (USDA-NASS, 2008a). Several important environmental problems are associated with these concentrated operations and the resulting hog waste, including poor air quality, greenhouse gas emissions, nuisance impacts and water pollution. In this value chain study, however, we will specifically address an environmental issue that is more often associated with public health: the non-therapeutic use of antibiotics. As with other major animal feeding operations, large hog farms rely extensively on antibiotics to keep the animals healthy under crowded living conditions. When antibiotics are routinely used on animals as a preventative health measure—and often to promote faster growth—antibiotic-resistant bacteria can evolve in hogs’ digestive tracks and manure, eventually reaching humans via pork products or through groundwater. This poses the risk of conferring resistance to the same antibiotics that are used to treat human disease, for instance tetracycline, which is widely used in swine production (University of Illinois at Urbana-Champaign, 2007). In addressing the U.S. pork industry, EDF seeks to eliminate the non-therapeutic use of antibiotics in swine production, in other words, to avoid giving antibiotics to hogs that are not sick. Because of the economics of hog production, this proposition poses a challenge for farmers, however, since without routine use of antibiotics, the animals will become more vulnerable to disease, translating into larger losses to disease and mortality, along with the higher labor cost of constantly monitoring the animals’ health to detect disease. Hence it is important to understand the dynamics of the industry and its key players, to help inform decisions that could potentially reduce antibiotic use while making good business sense for hog producers and other players in the value chain who may be affected.

4
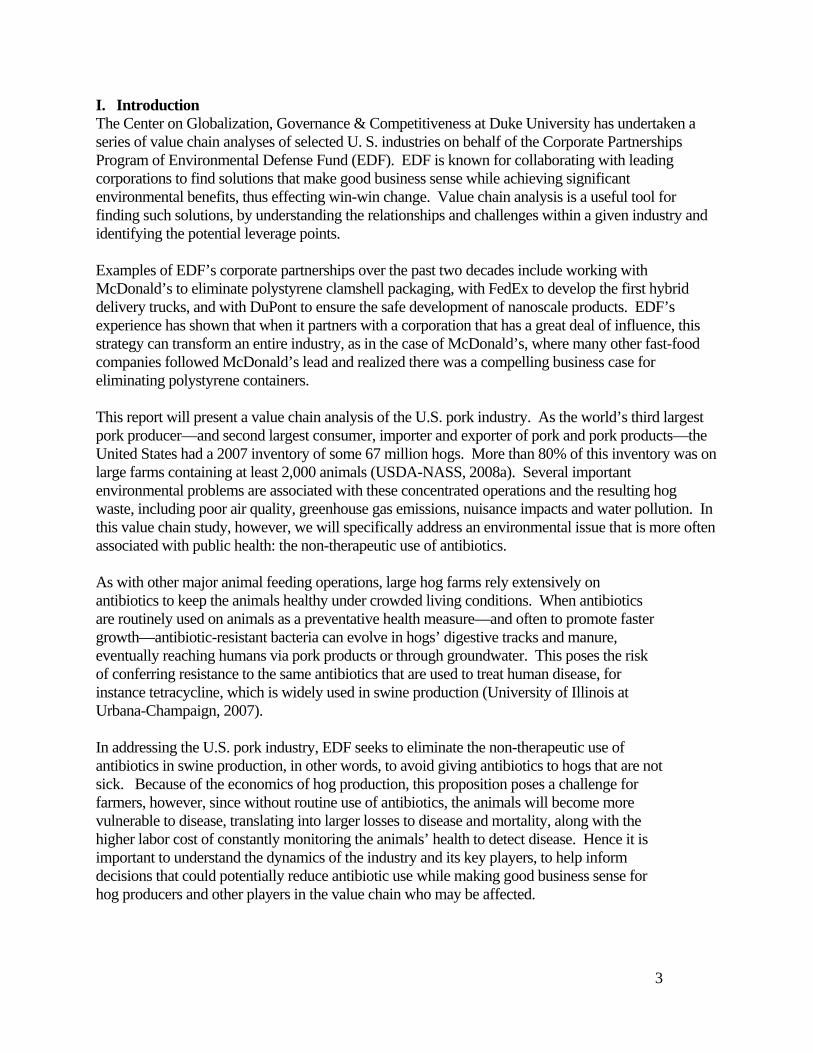
This report will begin with a brief overview of the size and nature of the U.S. pork industry, along with major dynamics of swine production. We will then present the value chain, emphasizing the roles of key industry players and the extent of their direct or indirect influence on hog farming practices, with particular attention to antibiotic use. We will identify key “boxes” in the value chain that have specific leverage, either through their linkages to swine farms or through their overall market position; we will identify and compare the top companies in each key box; and finally, we will present a full profile of one final company of interest selected from the top companies in each key box. Please note that although our analysis will begin with a general overview of the U.S. pork industry and its value chain, the later discussion of economic actors and leverage is framed specifically for the information needs of EDF’s Corporate Partnerships Program. Thus, our discussion will have specifically tailored results. For example, in order to determine which economic actors are designated as important leverage points, we will use a corporate lens—again, from EDF’s perspective—and this vantage point may yield conclusions that differ from a more general analysis of this agricultural sector. While we may identify veterinarians as an important player in the value chain with a major role in animal health, for instance, we may de-emphasize the veterinary “box” in the ensuing leverage analysis, which focuses instead on corporate entities that have direct or indirect impact on animal health management decisions. Thus, the discussion of economic actors and important leverage points should be viewed not as a general description of the dynamics within this sector of U.S. agriculture, but rather an analysis of key leverage points via major corporations with potential to effect industry-wide change. II. Overview of Pork Industry The United States accounts for 10% of global pork production, making it the world’s third largest pork producer, behind China (46%) and the European Union (24%). See
Table 1. Together with Viet Nam and Brazil, these top five pork producers account for 87% of global hog supply. Despite its position as third largest producer, the United States is the world’s largest exporter, accounting for 28% of global exports, surpassing the EU-27 ( 25%) and China (7%) (USDA-FAS, Production, Supply, and Disposition, 2007). There is very little international trade of live hogs, with the one notable exception being the United States’ import of live hogs from Canada. This trade amounted to 10 million head of swine in 2007 (5% of the total U.S. swine supply), accounting for 95% of total world trade in live swine (USDA-FAS, 2007).
5
Table 1. Production and Trade for Major Global Pork Producers in 2007, 1997-2007
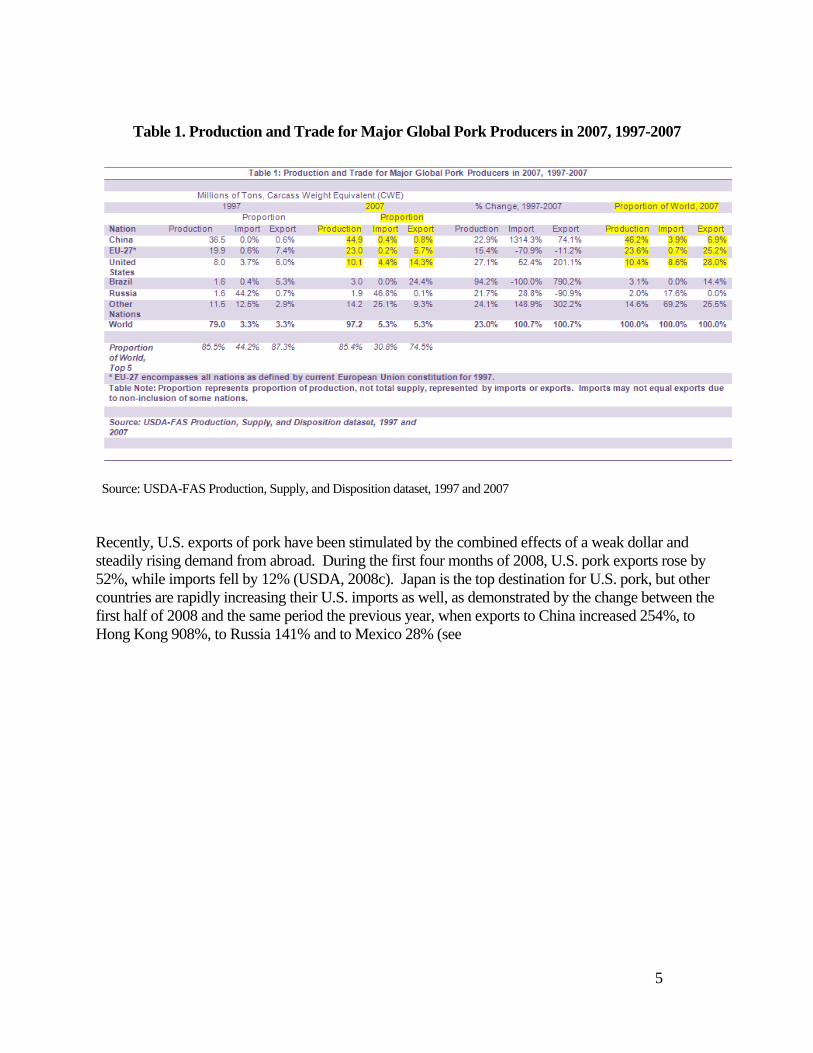
Source: USDA-FAS Production, Supply, and Disposition dataset, 1997 and 2007 Recently, U.S. exports of pork have been stimulated by the combined effects of a weak dollar and steadily rising demand from abroad. During the first four months of 2008, U.S. pork exports rose by 52%, while imports fell by 12% (USDA, 2008c). Japan is the top destination for U.S. pork, but other countries are rapidly increasing their U.S. imports as well, as demonstrated by the change between the first half of 2008 and the same period the previous year, when exports to China increased 254%, to Hong Kong 908%, to Russia 141% and to Mexico 28% (see

6
Table 2). The question has arisen about whether, as domestic pork prices rise, the United States is likely to import lower-priced pork from China. This would be highly unlikely. China is the world’s largest producer and consumer of pork, which accounts for nearly two-thirds of the country’s meat consumption, and it hardly even participates in the pork trade. In 2007 and 2008 the country experienced critical pork shortages, first caused by a disease crisis in domestic swine, then worsened by a severe snow storm in late January 2008 and the May 12 earthquake in Sichuan Province. Even before these shortages, China exported less than 1% of its pork production (see Table 1) and struggled to satisfy domestic demand. Thus, the United States will likely not import pork from China in the near future, but rather will continue to increase its own exports to China and other countries.
7
Table 2. Ten Largest Foreign Markets for U.S. Pork, January-June 2008, 2007
Source: USDA\ERS. http://www.ers.usda.gov/data/meattrade/
A. U.S. Market In 2007, hog farming produced $14.8 billion in income for U.S. farmers. The value of processing and distribution was estimated at $7.1 billion, and total retail value at $51.7 billion (USDA-ERS, 2008b, Table 90). In 2006, nearly 21 billion pounds of pork were processed from about 105 million hogs (National Pork Producers’ Council, 2008). Americans eat some eight ounces of meat per day, roughly double the global average (Bittman, 2008). Pork accounts for about one-fourth of this meat consumption (ERS Briefing Room, 2008), ranking third overall behind chicken and beef. Americans’ total consumption of animal protein has risen slowly and steadily since 1950. Within this upward trend, however, beef and poultry consumption have undergone dramatic changes over the past two decades, with beef falling sharply from 78.7 pounds per capita in 1986 to 65.6 pounds in 2006, and chicken rising steeply from 53.1 pounds in 1986 to 87.5 pounds in 2006. Pork consumption has fluctuated mildly during this period, ending in a slight increase from 48.6 pounds to 48.9 pounds, while fish consumption has increased fairly steadily from 15.4 pounds to 16.5 pounds (See Table 3 and Figure 1).

8
Table 3. U.S. Consumption of Beef, Pork, Chicken, and Fish, 1986-2006
Source: USDA/ERS, 2008b.
Figure 1. U.S. Consumption of Beef, Pork, Chicken and Fish, 1986-2006
Source: USDA/ERS, 2008b.

9
The United States Department of Agriculture (USDA) has prepared long-term projections for the livestock sector, reflecting expected adjustments as grain prices continue to rise in response to demand for corn-based ethanol. According to these projections, U.S. production of beef, pork and chicken will either grow more slowly or decline over the next several years, but after a period of adjustment, strong domestic and export demand should result in higher prices and hence encourage these sectors to resume expansion. Accordingly, the USDA projects that per-capita consumption of these three major meat categories will hit a low around 2012 but then rebound after the sector adjusts (See Figure 2). There are no similar projections for fish consumption; however, the National Oceanic and Atmospheric Administration (NOAA), has identified significant potential to increase commercial U.S. aquaculture production using today's technology. According to the agency’s estimates, domestic aquaculture production of all species could triple by 2025, rising from the current 0.5 million tons annually to 1.5 million tons per year (NOAA, 2008).
Figure 2. U.S. per capita meat consumption, 1985-2017 projection
B. Hog Farming Characteristics
Traditionally, farms raised hogs on farrow to finish operations (birth to slaughter), which encompassed the entire life cycle of hogs. For a variety of reasons described below, the industry has shifted toward specialized operations in distinct phases of the hog life cycle (see details on the hog life cycle in Table 4).

10
Table 4. Hogs Life Cycle Timeline
Sources: USDA, ERS, 2005a; Key and McBride, 2007 Today’s hog farms can be divided into the following five stages:
• Farrow to wean • Wean to feeder • Farrow to feeder • Feeder to finish • Farrow to finish
Farrow-to-finish operations have steadily declined as a proportion of hog operations, from 54% in 1992 to 31% in 2004. In contrast, feeder-to-finish operations have increased from 19% to 40% during the same period (Key and McBride, 2007). C. Trends and Geography1
During the past 15 years, the U.S. swine production industry has undergone two significant changes. First, production has become increasingly concentrated, with roughly the same number of hogs produced on fewer, but larger, farms (see Figure 3). Between 1992 and 2004, hog inventory remained relatively stable, while the number of hog operations declined from 240,000 to 70,000 (Key and McBride, 2007). More than 40,000 of these farms have fewer than 100 head—indicating that small farms still dominate in number—but they now account for less than one percent of total inventory. Today some 80 percent of the nation’s hogs and pigs are produced on farms with 2,000 head or more (USDA, NASS, 2008a).
1 For a thorough report based on the most recent available data from detailed USDA surveys of hog producers, see Key, Nigel and McBride, William. 2007. “The Changing Economics of U.S. Hog Production.” Economic Research Report No. ERR-52. Available online at the USDA-ERS web site, accessed July 31, 2008: http://www.ers.usda.gov/Publications/ERR52.

11
The second significant change in U.S. swine production is that farms have become increasingly specialized, moving away from traditional farrow-to-finish operations (which encompass the entire life cycle of hogs from birth to slaughter) in favor of farms that specialize in a single phase of production. Today specialized operations account for about 77% of the nation’s hog production (Key and McBride, 2007).
Figure 3. Number of U.S. Hog Operations1 and Hog Inventory, 1992-2004
Source: Key and McBride, 2007.
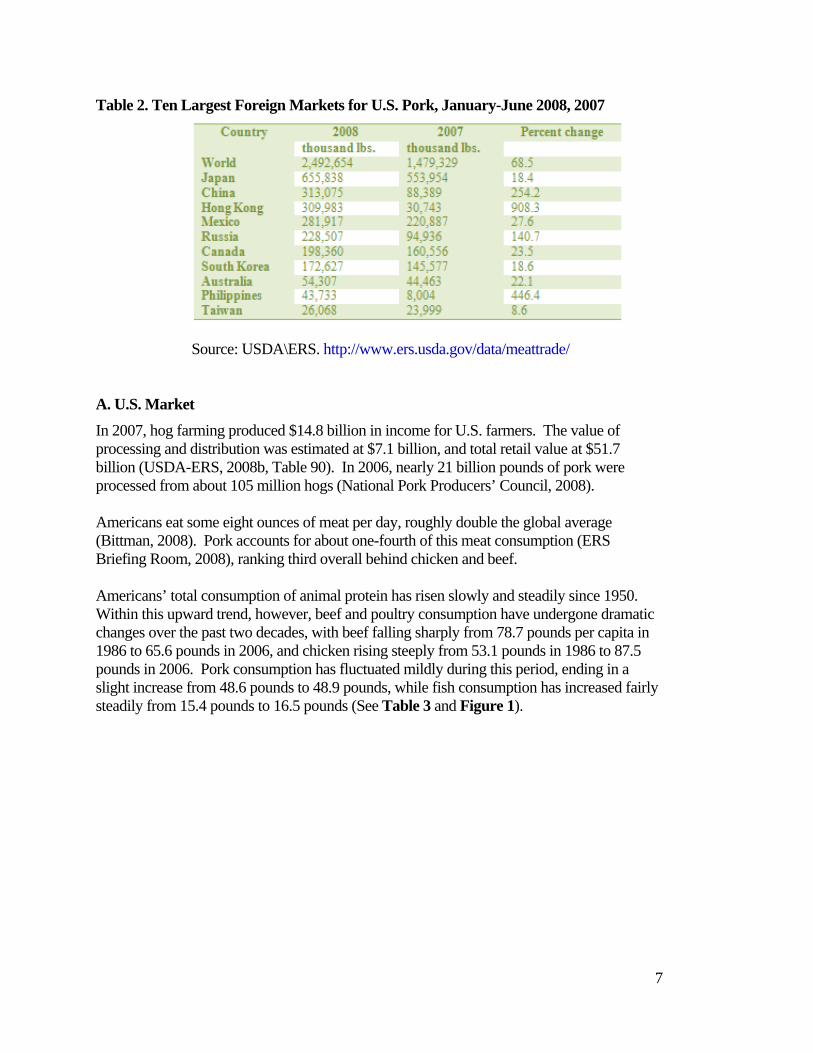
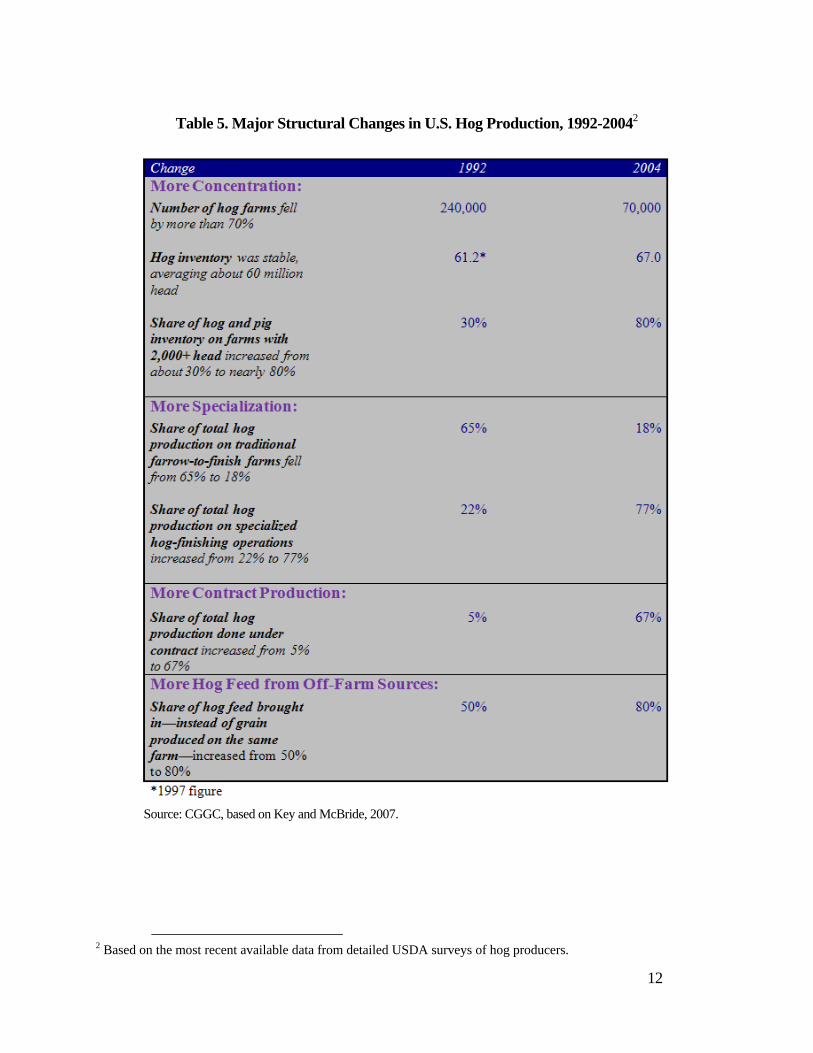
These trends toward larger, specialized farms have been accompanied by a rise in the use of contracts. A contractor, (hog owner) arranges for a producer (farmer) to care for the pigs on the producer’s farm for a fee. The contractor typically provides inputs and technical assistance. Many contractors are large packer/processors—such as Smithfield Foods, the world’s largest hog producer and pork processor. These packer/processors each contract with many different farmers, and the largest players own a high concentration of the nation’s hog inventory. In 2004, hog owners with 5,000 head or more owned 75 percent of total U.S. hogs; those with 50,000 or more head accounted for 54 percent; and the very largest owners, those with 500,000 or more head, accounted for 40 percent of all hogs slaughtered (Key and McBride, 2007). In contrast, traditional farrow-to-finish operations, which are typically smaller and have practically no contract production, have steadily decreased and now account for only 18 percent of U.S. hog production. All these structural changes are summarized in Table 5.
12
Table 5. Major Structural Changes in U.S. Hog Production, 1992-20042
Source: CGGC, based on Key and McBride, 2007.
2 Based on the most recent available data from detailed USDA surveys of hog producers.

13
The traditional center of the hog farming industry is the Corn Belt, where hog feed has long been cheap and abundant, including Iowa, Minnesota, Illinois, Indiana, and Missouri. These states remain dominant (see Table 6). During the 1980s and 1990s, however, hog production grew in other areas, mostly because of large contract operations. For example, as a result of such operations in North Carolina, the state doubled its hog inventory between 1987 and 1992—when it became the number two U.S. producer—and doubled it again by 1998. This rapid growth ended in 1997 when North Carolina’s state government responded to growing concern over environmental impacts by placing a moratorium on new or expanded farms with 250 or more hogs (Key and McBride, 2007).
Table 6. Characteristics of Top Hog Farming States (By Inventory), 1997 and 2007
Source: USDA, NASS.

14
The Southeast now accounts for about 20 percent of domestic pork production (ERS briefing room), and the Southern Seaboard is marked by a high concentration of large operations. The average head per hog farm in the Southern Seaboard in 2004 was 13,995, compared with the Heartland average of 5,106, and the West average of 1,859 (Key and McBride, 2007 ). Perhaps in response to the moratorium in North Carolina, hog inventory has quickly expanded in several states in the West, including Oklahoma, Colorado, Texas, and Utah (Key and McBride, 2007). A map of large U.S. hog farms, those with 2,000 or more head, appears in Figure 4.
Figure 4. Number of Large Hog Farms, by State, 2007
Source: CGGC, based on USDA/NASS, 2008a, p. 31.
III. U.S. Pork Industry Value Chain
The basic structure of the U.S. pork industry value chain is depicted in Figure 5. The chain begins with the first segment, “Inputs.” There are many varied inputs to the swine production process, but we chose to focus on feed, which represents the single largest production cost for all hog farms, accounting for 33% of production costs (USDA/ERS, 2008); genetics, which provides the foundation for all swine herds; and veterinary services, which encompass many aspects of the animals’ health, including antibiotic use.

15
Figure 5. U.S. Pork Industry Value Chain
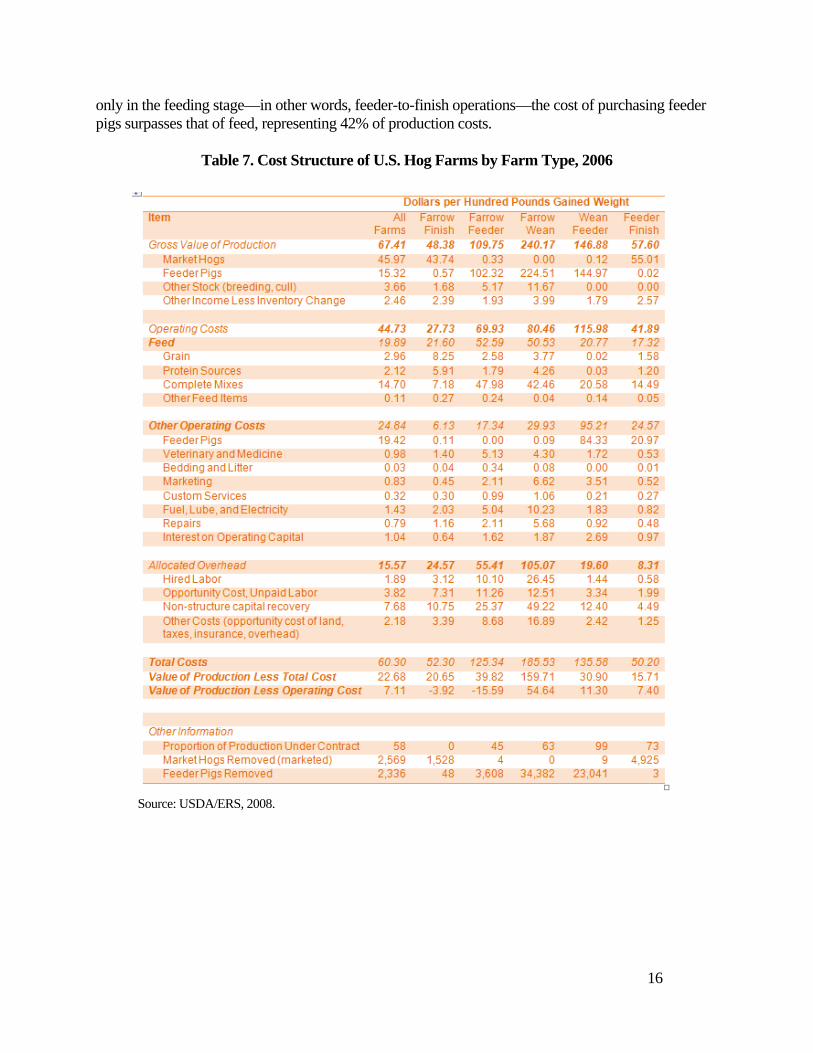
Source: CGGC. Value-added figures from USDA-ERS, 2008b, Table 90; USDA-NASS, 2007. After “Inputs,” next in the value chain is the “Production” segment, which is divided among the several types of specialized hog farms; here, we limit these types to the three most relevant categories: farrow-to-feeder and feeder-to-finish, which often produce under contract, and the traditional farrow-to-finish, which operates exclusively on spot markets and covers the pigs’ entire life cycle from birth to pre-slaughter. The different types of operation vary considerably in their production costs, as shown in Table 7. For example, farms that involve farrow to weaning—a stage involving health risks for pigs when they are young and fragile—have higher veterinary and capital recovery costs than farms involving the later stages of pigs’ life cycle. And traditional farrow-to-finish farms rely less on compound feed mixes than any of the specialized operations, spending roughly $7 per hundred pounds of gained weight, compared with $14.50 for feeder-to-finish farms and $48 for farrow-to-feeder farms. A breakdown of production costs by farm type (see Figure 6) yields at least two striking conclusions. First, feed accounts for 33% of production costs for all hog farms, and even more for traditional farrow-to-finish operations (41%) and farrow-to-feeder operations (42%). Second, for farms involved
16
only in the feeding stage—in other words, feeder-to-finish operations—the cost of purchasing feeder pigs surpasses that of feed, representing 42% of production costs.
Table 7. Cost Structure of U.S. Hog Farms by Farm Type, 2006
Source: USDA/ERS, 2008.

17
Figure 6. Comparison of U.S. Hog Farm Production Costs, by Farm type
Farrow-Feeder
Farrow-Finish
All Farms
Source: USDA, ERS, 2008 The “Processing & Distribution” segment includes companies involved in slaughtering hogs, packing and processing the meat, performing any further processing, and distributing the products to retailers and food supply companies. The “Marketing” segment is divided between in-home consumption of pork (supermarkets) and out-of-home consumption, (food services) which includes restaurants and companies involved to varying degrees in processing, distributing, and serving pork products to clients in non-commercial settings, such as university and corporate campuses, hospitals, and correctional facilities. In total, the pork industry represented some $52 billion in value added in 2007, including $15 billion in hog production, $7 billion in processing and distribution, and $30 billion in retail, restaurants, and other food service (USDA-ERS, 2008b).
This industry’s value chain is marked by several very large players that each have a footprint across two or more segments of activities. For example, Tyson Foods has a footprint in feed, production, packing, final product processing (e.g., bacon and cold cuts), and wholesale (See Figure 7). Smithfield Foods has an even larger footprint, with involvement in at least one box in every segment of the value chain,

18
including genetics, production of compound feed, hog production, packing/processing, final product processing, wholesale, and food service (see
Figure 8). Figure 7. U.S. Pork Industry Value Chain, Multi-Segment Player: Tyson Foods, Inc.
Source: CGGC.
Figure 8. U.S. Pork Industry Value Chain, Multi-Segment Player: Smithfield Foods, Inc.
Source: CGGC.
19
IV. U.S. Pork Industry: Economic actors and leverage
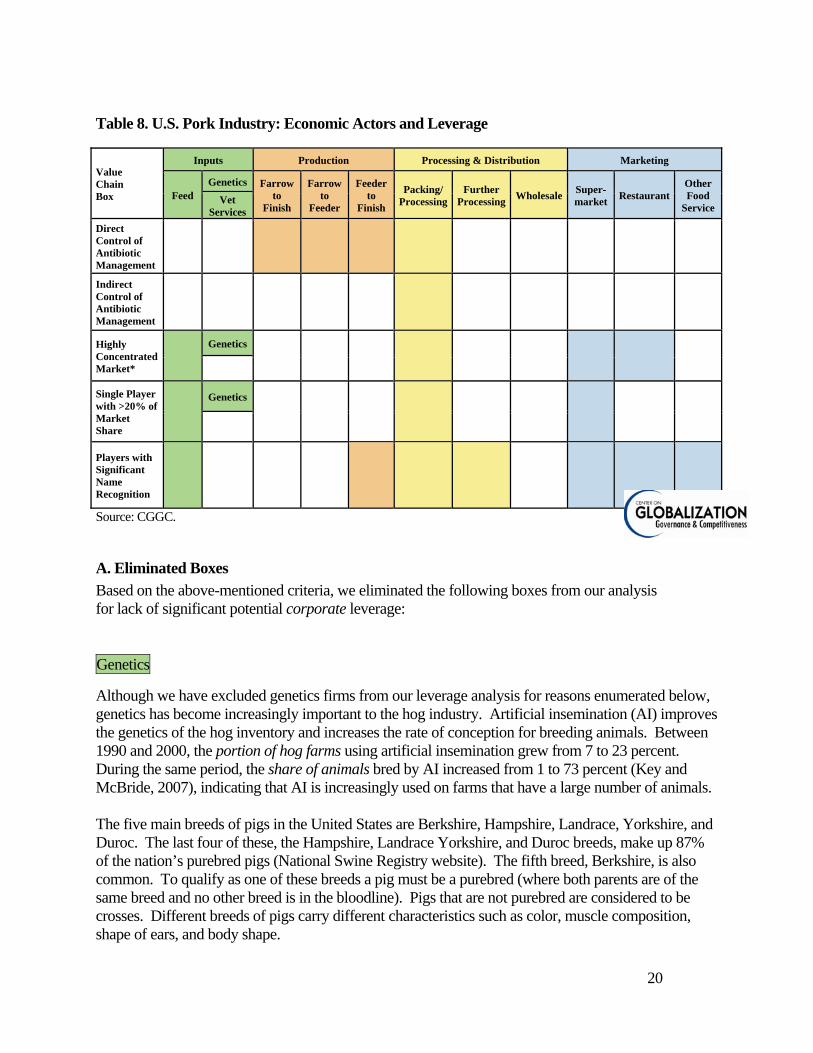
We analyzed each box in the value chain for the U.S. pork industry to determine the degree of leverage each economic actor has with hog farming operations, and hence the potential it might have to influence practices related to antibiotic use. Please note that this analysis emphasizes corporate entities that have direct or indirect impact on animal health management decisions. Thus, this discussion of economic actors and important leverage points should be viewed not as a general description of the dynamics within this sector of U.S. agriculture, but rather an analysis of key leverage points via major corporations with potential to effect industry-wide change. As shown in Table 8, we applied the following seven criteria to determine leverage:
• Segment includes firms with direct control over antibiotic management. The only economic
actors in this category are hog farms, which constitute the three specialized categories in the production column: farrow-to-feeder, feeder-to-finish, and farrow-to-finish.
• Segment includes firms with indirect control over antibiotic management. Players that have indirect influence over producers’ decisions about antibiotics management include those in the processing/distribution segment that have contract relationships with hog farmers. Additional indirect influence may be possible for players with significant purchasing power near the final end of the chain, including packer/processors, super markets and restaurants, as a result of market concentration.
• Highly concentrated market. We use the term “concentrated” here to indicate that the top five
firms in the segment control at least 50% of the market. This degree of consolidated market share may lead to important leverage over hog farmers’ decisions.
• Single player in the segment controls at least 20% of the market. This category also indicates the degree of market concentration within a segment, but distinguishes cases such as the genetics box, the packing/processing box, and the supermarket box, in which a single player still manages to stand out even in a market that is dominated by a handful of very large players.
• Segment includes players with significant name recognition. This category is intended to capture firms that have significant name recognition “on the street,” i.e., even among people not involved in the industry.
20
Table 8. U.S. Pork Industry: Economic Actors and Leverage
Value Chain Box
Inputs Production Processing & Distribution Marketing
Feed Genetics Farrow
to Finish
Farrow to
Feeder
Feeder to
Finish Packing/
ProcessingFurther
Processing Wholesale Super-market Restaurant
Other Food
Service Vet
Services Direct Control of Antibiotic Management
Indirect Control of Antibiotic Management
Highly Concentrated Market*
Genetics
Single Player with >20% of Market Share
Genetics
Players with Significant Name Recognition
Source: CGGC.
A. Eliminated Boxes Based on the above-mentioned criteria, we eliminated the following boxes from our analysis for lack of significant potential corporate leverage: Genetics Although we have excluded genetics firms from our leverage analysis for reasons enumerated below, genetics has become increasingly important to the hog industry. Artificial insemination (AI) improves the genetics of the hog inventory and increases the rate of conception for breeding animals. Between 1990 and 2000, the portion of hog farms using artificial insemination grew from 7 to 23 percent. During the same period, the share of animals bred by AI increased from 1 to 73 percent (Key and McBride, 2007), indicating that AI is increasingly used on farms that have a large number of animals. The five main breeds of pigs in the United States are Berkshire, Hampshire, Landrace, Yorkshire, and Duroc. The last four of these, the Hampshire, Landrace Yorkshire, and Duroc breeds, make up 87% of the nation’s purebred pigs (National Swine Registry website). The fifth breed, Berkshire, is also common. To qualify as one of these breeds a pig must be a purebred (where both parents are of the same breed and no other breed is in the bloodline). Pigs that are not purebred are considered to be crosses. Different breeds of pigs carry different characteristics such as color, muscle composition, shape of ears, and body shape.
21
The U.S. swine breeding industry is highly concentrated, with two major types of players: 1) multinational swine genetics companies such as PIC, which provides more boars and gilts worldwide than any other seed stock company, and 2) independent domestic breeders such as Whiteshire/Hamroc and Comparts Boar West. PIC North America is a subsidiary of the biotechnology company Genus plc, the largest of many PIC divisions all over the world. More than 90% of the company’s production is outsourced today through its global supplier network, using the variation available in 17 different line populations worldwide. PIC works closely with third party breeders/multipliers, producers and farmers to crossbreed animals possessing desirable traits and genes. PIC generates revenue through the sale of breeding animals and semen, and custom improvement programs for customers who seek further differentiation (PIC website). According to registrations at the National Swine Registry (NSR)3, Whiteshire Hamroc is the largest recorder of Yorkshire and Duroc, and the second largest recorder of Landrace swine in the United States. Of the top 100 registered for each breed, this company held 77 Yorkshire, 77 Duroc, and 45 Landrace. A merger with Waldo Farms in 2002 has increased Whiteshire’s herd size to 11,000 female breeding swine, allowing it to provide swine genetics to producers of various sizes in the United States and around the world. The company has been operating for more than 70 years (Whiteshire Hamroc website). The question was raised whether prominent genetics companies are involved in efforts to breed hogs for less dependence on antibiotics. In general, this can be considered one of the main objectives of swine genetics, since the science is intended to breed healthy animals that are less susceptible to disease. In addition, the U.S. leader, Whiteshire/Waldo Farms seeks to improve immunity by establishing a genetically closed herd, protecting animals with vaccines, and encouraging customers to isolate new animals for a temporary acclimation period during which blood tests can identify the presence of diseases and avoid exposing the rest of the herd (Waldo Farms website). The high degree of concentration in swine genetics implies a certain kind of leverage in the hog production industry; however, none of the major players have significant name recognition, nor do they have a footprint in multiple boxes in the value chain. It is worth noting, by contrast, that Smithfield Foods—which occupies four boxes across the value chain, accounts for 31% of U.S. hog production and owns 20% of the nation’s sow inventory—operates its own genetics firm, Smithfield Premium Genetics. According to InfoUSA, this firm “supports more than 700,000 sow production pyramids that supply roughly 13,000,000 lean market hogs annually” (OneSource).4 Thus, a logical way to gain access to the leverage inherent in swine genetics may be through the large producer/processor Smithfield Foods.
3 The National Swine Registry registers and promotes breeds and provides marketing assistance. Website: http://www.nationalswine.com/ 4 In contrast, Tyson Foods, the number two packer/processor, owns only 70,000 sows, and its owned hog operations represent less than 1% of the company’s pork production (Tyson Foods, Inc. 2008).

22
Veterinary Services
Veterinarians clearly play a crucial source in animal health for the pork industry. The veterinary service branch of the USDA is called the Animal and Plant Health Inspection Service (APHIS), which is responsible for protecting and improving the health and quality of the nation’s agricultural animals, animal products, and veterinary biologics. APHIS registers animal farming operations in its National Animal Identification System (NAIS), a network intended to foster collaboration among Federal and State animal health officials, colleges of veterinary medicine, and private veterinarians. From a corporate leverage standpoint, however, it is difficult to find a point of entry for partnering with veterinarians to effect change across the pork industry. The U.S. veterinary service sector is highly fragmented; the 50 largest companies hold less than 10 percent of the market. In 2007 there were an estimated 87,946 veterinarians, among which 58,240 were private clinical practices, 14,435 were public and corporate, 13,342 were employment unknown, and 1,919 were not listed (AVMA, 2007). Public and corporate veterinarians thus account for only 16% of the total, and most veterinary services are provided by private companies or individual clinics. Veterinary Centers of America (VCA) is the largest operator of animal hospitals and testing labs. The typical veterinary services company operates a single 4,000 square foot animal hospital with a staff of ten, including two veterinarians, and has annual revenue under $1 million (First Research, 2008). Farrow-to-feeder, Farrow-to-Finish All three types of farming operations—farrow to feeder, feeder to finish, and farrow to finish--have direct control over antibiotic use. Farrow to finish operations are oriented toward spot market production, which means they raise hogs independent of practices specified by contracts. By contrast, farrow to feeder and feeder to finish stages contain either a significant minority or a majority of operations that operate through production contracts (MacDonald and Kolb 2005). Production contracts provide farmers with a fee-for-service arrangement with other industry firms, and the complexity and specificity of these contracts may vary. The loosest form of contract may only dictate the raising of pigs to market weight, but more complex contracts may specify feed and other input suppliers, and even general practices, including antibiotic use. We estimate that farming activities amount to $14.8 billion in income for farmers, or 28.6% of total industry value (USDA-ERS 2008b, Table 90; USDA-NASS 2007). At the level of individual farms, farming is not a highly concentrated stage of production. Farms will not have significant name recognition, with the exception of farms owned by big-name firms such as Smithfield Foods (see “Hog Producers” discussion under Key Boxes, below). For these reasons, instead of focusing on the three types of swine production, we have chosen to emphasize the large corporations downstream in the value chain that have a concentrated effect on these operations through production contracts.

23
B. Key Boxes
The leverage table includes two categories that in most industries imply the greatest amount of influence: the “highly concentrated,” and the “single player” categories, which, in the case of the pork industry, include the top feed companies, genetics firms, the pork processor Smithfield Foods, Wal-Mart, and McDonald’s. However, these two categories are not the only measure of possible leverage; some fragmented industries also could include firms whose name recognition or market position could give them leverage. An example of this might be firms such as SYSCO or Bon Appétit in the food services industry. Taking these factors into account, we chose several key boxes in the pork industry value chain that have the most potential leverage. They are Compound Feed, Production, Packing/Processing, Food Service Manufacturers (referred to in the value chain as Further Processing) and Food Service Suppliers (See Figure 9). Figure 9. U.S. Pork Industry Value Chain, Key Boxes
Source: CGGC.
24
Feed
Feed is the major production input to the pork production process, accounting for more than one-third of production expenses. At current prices, feed costs are approximately $62 per pig. Feed includes grain sources of energy—such as corn, barley, milo (grain sorghum), and oats—and protein from oilseed sources such as soybeans and canola. It is estimated that each hog that is marketed in the United States has consumed 12 bushels of corn and 130 pounds of soybean meal (National Producer’s Council, 2008). Feed grain and supplement costs are increasing as demand pressures on grain inventories rise. The main hog feed ingredients have traditionally been corn and soybean meal, but recent shortages and rising prices for those products have led hog producers to seek alternatives, including by-products from grain-milling, brewing, distilling, and several food processing industries (Boggess, Stein and DeRouchey, 2008). Fish meal is widely recognized as a highly digestible source of protein, energy, minerals and vitamins appropriate to animal feed. However, the quality is variable, depending on the freshness, handling and processing of the fish. Fish meal can lead to a “fishy” flavor in pork if it is fed to finishing pigs, but it is commonly used in “starter” diets for nursery pigs (Boggess, Stein and DeRouchey, 2008). Good quality fishmeal commands a higher price than other high protein feedstuffs. Fishmeal is manufactured from two main types of fish: lean fish (e.g. cod, haddock) and industrial fish that are high in fish oil content and not prized for their fillets (e.g. herring, menhaden, anchovy, pilchard, sardines and mackerel). Approximately 90% of the world fishmeal production is from high oil species (Miles and Jacob, 2003). The feed industry is highly concentrated. Several of the top firms that produce animal feed, including Cargill, Tyson Foods, and Smithfield Foods, are also the top producers and processors of meat and poultry, and they supply animal feed for their own operations. Production As mentioned above, several large companies figure prominently in hog ownership, owning the animals, but not the farms on which they are raised. According to a report by Successful Farming magazine, the top 5 hog producers control 35% of the nation’s sow inventory, the critical input to hog production (Freese and Johnston, 2007). These top five hog producer firms are the following:
• Smithfield Foods (Smithfield, Virginia) • Triumph Foods (St. Joseph, Missouri) • Seaboard Foods (Shawnee Mission, Kansas) • Iowa Select Farms (Iowa Falls, Iowa) • Prestage Farms (Clinton, North Carolina)

25
Processing and Distribution
Pork processing encompasses hog slaughter and processing activities, the outputs of which are marketable carcasses, cuts, or consumer products. All major companies directly involved in the pork industry perform both slaughter and consumer product production, although both of these activities may or may not take place at any given plant.
Companies involved in processing may have direct or indirect control over antibiotic use, or both. Some processing companies directly own hog farms, and all contract with farmers through production contracts, making oversight over farming practices possible (Foods, Inc., 2007b; Hormel Foods, Inc., 2007). Given the disproportionate share of hog sales supplied through contracts, indirect leverage is significant. However, it must be mentioned that many diversified food companies, such as ConAgra and Unilever, may also produce pork products or products containing pork without significant involvement with pork production or farming operations. Competition between top companies directly involved in pork production may be direct, may involve diversification into related product lines, such as beef and chicken, and may involve diversification into various consumer outlets, such as food service organizations, packaged consumer products, or fresh meat products. In this respect, these companies resemble the integrators of the chicken industry, shaping and reshaping supplier relationships in light of corporate strategy aimed at the retail stage of production. Based on the Meat Price Spreads Data, which measures the proportion of retail value that accrues to farmers, retailers, and packers, this stage of the industry was valued at $7.13 billion in 2007 (USDA-ERS, 2008b). The U.S. pork processing industry is highly concentrated, with the top five companies controlling 72% of the market (Smithfield Foods, Inc., 2007a). A single player, Smithfield Foods, controls 27% of U.S. pork production. Based on pork production, the top five companies all have significant name recognition or own recognizable brand names. They are as follows (Smithfield Foods, Inc., 2007a):
• Smithfield Foods 27% • Tyson 17% • JBS S/A 11%
(Brazilian company that recently acquired Swift & Company) • Excel 9%
(wholly-owned subsidiary of the privately-owned Cargill, Inc.) • Hormel 8%
Nearly two-thirds of pork consumption is in the form of processed products, such as sausage, smoked ham, or bacon (Davis and Biing-Hwan, 2005b). This figure is in sharp contrast to beef, for which only 13% of consumption is in the form of processed products (Davis and Biing-Hwan, 2005a). The dominance of processed pork in overall pork consumption indicates that processors play a particularly important role in this industry, and many packers of fresh pork are likely to be involved in the production of processed products.

26
Further processors, or large processors not directly involved in the industry, are diversified companies that use pork in final consumer products. In contrast to the companies above, these companies will not have a large degree of leverage. Wholesale firms either sell partially processed carcasses to processors or directly to consumers. In recent years, the conventional relationships between retailers, wholesalers, and manufacturers have been changing, and wholesalers are playing a shrinking role in the pork industry because packing companies are often connected to retailers directly, eliminating the need for a middleman. Additionally, wholesale companies are increasingly becoming involved in further processing activities (Tyson, 2008). Again, these firms will have little leverage with respect to farming operations. Supermarkets
Meats are often a major portion of a food retailer’s business (Datamonitor, 2007). The majority of U.S. pork consumption has traditionally been in the home, which makes supermarkets the primary retail outlet for pork and processed pork products (Davis and Biing-Hwan, 2005b). The USDA does not collect consumption figures annually, but according to the most recent survey data—the Continuing Survey of Food Intakes by Individuals for 1994-1996 and 1998—about 78% of all pork consumption was in the home, 17% was at restaurants and fast food outlets, and 5% was at other venues, such as cafeterias, schools, and institutions (9). This may make supermarkets an especially important leverage point with respect to farming practices.
Ranked by annual sales, the top five U.S. supermarkets are Wal-Mart, Kroger, Costco, Supervalu, and Safeway (Supermarket News). Wal-Mart is the largest food retailer in the world, with annual sales of $379 billion, larger than the combined total of the top four European supermarkets Carrefour, Tesco, Metro Group, and Schwarz Group (total $363 billion) (Supermarket News).
The rise of Wal-Mart and other supercenters is squeezing out some traditional retail grocery outlets. Although the nation's 56,000 supermarkets remain dominant in food shopping, their share of the business has been steadily declining. By 2004, Wal-Mart had roughly 20% of U.S. market share, while supermarkets’ share declined and Whole Foods’ share remained under 1% (see Figure 10). In the roughly four years since that time, Wal-Mart has expanded its reach considerably into its competitors’ niches, including organic and natural offerings. In an economy where, in 2008, the price of consumer goods rose 5%, Wal-Mart has thus continued to draw customers away from higher-priced outlets such as Whole Foods (Market Watch, 2008).

27
Figure 10. U.S. Grocery Market, 2002 and 2004
Source: The New York Times
Restaurants
The U.S. dining industry accounts for more than $500 billion in sales and encompasses about 945,000 eating outlets. Restaurants are typically segmented between full-service and fast foods (Bramhall, 2008). The largest segment, measured in number of locations, is fast food.
Pork accounts for more than 10 billion servings annually in restaurants (National Pork Board, 2007, updated 2008). Nearly one-third of this consumption is in the form of breakfast sandwiches, followed by 13% in bacon cheeseburgers, and 10% in bacon, which is increasingly served as a flavor enhancement in salads, sandwiches and entrees (see Figure 11).
Figure 11. Distribution of Pork Served in U.S. Restaurants
*“Other” includes sausage sandwich, BLT sandwich, ham, barbecue sandwich, and pork (entrees).
Source: National Pork Board, 2007, updated 2008.

28
According to John Green, Director of Strategic Marketing at the National Pork Board, quick service/casual dining restaurants are major purchasers of pork, because a significant amount of pork is used for breakfast meals, ribs, pulled pork, and the like (Green, 2008). McDonald’s and Burger King are probably the leading purchasers of pork in the United States. McDonald’s and Burger King are the leading U.S. restaurants in terms of overall sales with $28.8 billion and $8.6 billion in 2007 sales, respectively (Technomic, 2008). Foodservice establishments are divided into commercial and non-commercial. Commercial food establishments include restaurants and fast-food outlets, accounting for 83% of total foodservice sales. Non-commercial and institutional foodservice outlets include schools, colleges, hospitals, company cafeterias and correctional facilities. These institutions account for the remaining 17% of foodservice sales (Geisler, 2008). Food Service Industry
Foodservice can be defined as all meals, snacks and beverages that are prepared away from the home. Foodservice is different from the retail industry (see supermarkets, above) in that retail food either does not require any preparation, or it is intended to be prepared in the home. Establishments that offer foodservice, by contrast, include restaurants, hotels, cafeterias, schools, hospitals, and correctional facilities, among others. However, the industry also encompasses activities from the adjacent segment of the value chain (Processing/ Distribution), including food product processing, equipment and supplies, and the wholesale delivery of these products to foodservice establishments (Technomic, Inc., 2006). Chris Urban, Director of the Knowledge Center at Technomic, Inc. explains that the foodservice industry can be divided into four main categories. It is important to understand that there is a great deal of overlap between the functions of these different segments. The four main categories, along with lead companies, are as follows:5
• Distributors or suppliers: Sysco Corporation, U.S. Foodservice, Performance Food Group
• Foodservice management companies: Compass Group, ARAMARK, Bon Appétit Management Company
• Restaurants: McDonald’s, Burger King, Subway
• Foodservice manufacturers: ConAgra, Campbell Soup, Heinz
5 Leading companies based on Hoovers report and other industry data.

29
In its handbook on the foodservice industry, Technomic, Inc. explains what differentiates foodservice from other industries. The distinctive characteristics of the foodservice industry are as follows:
• High fragmentation: there are nearly 900,000 foodservice outlets in the United States, compared with only 27,000 supermarkets
• High segmentation: the industry is divided into 18 major segments and multiple sub-segments
• Lack of trade information: few data exist about foodservice purchases; no market data are currently available on the foodservice industry to track product movement
• Private label importance: a number of controlled, private-label products are manufactured
either for distributors/suppliers (such as SYSCO) or operators (such as chain restaurants like McDonald’s)
• Decision makers: although consumers are the ultimate users of foodservice products,
foodservice operators are responsible for making food purchasing decisions and selecting products and brands
C. Top Companies in Each Key Box
For each of the key boxes we identified in the pork industry value chain, we also identified the top companies. In the Inputs column, these included multi-national companies that figure prominently in compound animal feed (see Table 9).

30
Table 9. Top 5 U.S. Compound Feed Producers
Feed Companies* Total Annual Sales and Annual Feed Production Market Position
Cargill, Inc. (Cargill Animal Nutrition / Nutrena)
$88.3 billion 16.8 million tons
Largest grain exporter in the United States; third largest meat and poultry producer.
Land O’ Lakes, Inc.
$8.9 billion 12 million tons
Farmer-owned cooperative; leading marketer of dairy-based products.
Tyson Foods, Inc.
$26.9 billion 10.1 million tons
Tyson feed satisfies the company’s own production of poultry, beef, and pork.
Smithfield Foods, Inc.
$11.4 billion 3.6 million tons
World’s largest pork processer and hog producer.
ADM Alliance Nutrition, Inc.
$1.7 billion 3.2 million tons
Company supplies ingredients that augment the nutritional value of animal feed.
*Listed in order of feed production All figures for 2007 unless otherwise noted Source: CGGC, based on One Source, Hoover’s, and Company Websites

31
For the Production column, top companies include not only hog farms but also major pork processors that own large numbers of hogs; these companies likely have no footprint in farrow-to-finish farms, which are predominantly the traditional style of family hog farms and do not produce under contract (see Table 10).
Table 10. Top 5 U.S. Hog Producers
Hog Producers (Farms) Total Annual Sales Market Position
Smithfield Foods, Inc.
$11.4 billion, company $9.6 billion, Pork division $2.4 billion, Hog production division
31% of US Pork production 17% of US hog production 26.7 million hogs processed 14.6 million hogs sold 3.1 billion pounds of packaged meats sold, 4 billion pounds of fresh pork sold 20% of US sow inventory
Triumph Foods (Private Company)
No financial information or estimates available
6.6% of US sow inventory 403,700 sows
Seaboard Corporation (Parent Company of Seaboard Foods)
$3.2 billion, company $1.004 billion, pork segment
3.5% of US sow inventory 213,600 sows Raises 4 million hogs annually
Iowa Select Farms (Private Company)
Estimated $60 million, company sales (Standard & Poor’s, 2008)
2.5% of US sow inventory 150,000 sows
Prestige Farms (Private Company)
No financial information or estimates available
2.3% of US sow inventory 142,000 sows
All figures for 2007 unless otherwise noted Source: CGGC, based on One Source, Hoover’s, Freese and Johnson, 2007, Smithfield Foods, Inc. 2008, and Company Websites

32
In Packing and Intermediate Processing, the top company is Smithfield Foods, which is also among the top five in the previous two categories, Compound Feed and Production (see Table 11).
Table 11. Top U.S. Hog Packers/Processors Hog
Packers / Producers* Total Annual Sales Market Position
Smithfield Foods, Inc. (FY 2008)
$11.4 billion, company $9.6 billion, Pork division $2.4 billion, Hog production division
31% of US Pork production 17% of US hog production 26.7 million hogs processed 14.6 million hogs sold 3.1 billion pounds of packaged meats sold, 4 billion pounds of fresh pork sold 20% of US sow inventory
Tyson Foods, Inc.
$26.9 billion 10.1 million tons
19% of US Pork Production 1% of US sow inventory
JBS Swift & Company US Subsidiary of JBS S.A., Brazil (FY 2007)
$9.1 billion, total company sales $369.3 million, US Pork segment (encompasses all company-wide pork production)
11% of US Pork Production
Excel Fresh Meats (Subsidiary of Cargill, Inc.)
$88.3 billion, Cargill total sales Sales unknown for Excel Fresh Meats (private company)
9% of US Pork Production Cargill possesses 1.7% of US sow inventory
Hormel Foods Corporation
$6.2 billion, company $3.3 billion, refrigerated foods segment $879.4 million, grocery segment
7% of US pork production 1% of US sow inventory
*Ranked by market position in pork. All figures for 2007 unless otherwise noted. Source: CGGC, based on OneSource, Hoover’s, Freese and Johnson , 2007, Smithfield Foods, Inc., 2008, and company websites.

33
In Final Product Processing, the top companies are diverse food corporations for which pork is likely a small portion of company sales (see Table 12).
Table 12. Top U.S. Food Service Manufacturers Food Service
Manufacturers Total Annual Sales Market Position
Kraft Foods, Inc.
$37.2 billion, company $23.9 billion, North American food sales $6.4 billion, North America cheese and Foodservice
Third largest food processor Pork involvement appears to be confined to TV dinners and other similar products (frozen pizzas, etc.)
Nestle US and Canada only, subsidiary of Nestle, S.A. Switzerland (FY 2006)
$89.7 billion, worldwide $18.799 billion, US and Canada $3.2 billion, Nestle FoodServices, worldwide $1.6 billion, Nestle FoodServices, North and South America
Fourth largest food processor Pork involvement appears to be confined to TV dinners and other similar products (frozen pizzas, etc.), potentially pet food
General Mills, Inc. (FY 2008)
$13.652 billion, total company sales $11.1 billion, US retail, bakeries, and foodservice $2.02 billion, Bakeries and Foodservice
Seventh largest food processor Pork involvement appears to be confined to pizza products (Totino’s / Jeno’s)
ConAgra Foods Inc. (FY 2008)
$11.6 billion, total company sales $10.9 billion, US consumer foods and Food and Ingredients (the division for foodservice)
Ninth largest food processor Pork involvement appears to be confined to TV dinners and other similar products (frozen pizzas, etc.) Potentially also confined to food service supply and lunch meats
Sara Lee Corporation (FY 2007)
$12.3 billion, total company sales $6.8 billion, North American Retail Meats, North American Retail Bakery, and Foodservice
Seventh largest food processor Pork involvement appears to be confined to meat products (hot dogs, lunch meats, etc)
All figures for 2007 unless otherwise noted. Source: CGGC, based on OneSource, Hoover’s, and company websites.

34
For Marketing, we refer to previous CGGC reports for details on top supermarkets and restaurants; here, we provide new top-company information on food service suppliers, which serve institutions such as schools, hospitals, and corporate campuses (see Table 13).
Table 13. Top U.S. Food Service Suppliers
Food Service Suppliers Total Annual Sales Market Position
SYSCO Corporation
$35.04 billion
Number one foodservice supplier and distributer of related products in the United States. The company markets White Marble Farms pork. This pork is specially bred for flavor and tenderness.
U.S. Foodservice
$20.2 billion
Second largest foodservice distributor. Company distributes food and related products to restaurants, healthcare facilities, schools, etc.
Performance Food Group Company
$6.3 billion
Third largest US food service distributor. Company delivers more than 66,000 foodservice items to about 44,000 customers. The company’s top supplier for pork products is Smithfield Foodservice Group.1
Gordon Food Service
$3.9 billion
More than a dozen distribution centers throughout the US and Canada
McLane Foodservice, Inc.
$2.1 billion
Provides food and paper products to more than 17,500 quick-service restaurants in the US
1Performance Food Group website Source: CGGC, based on OneSource, Hoover’s, and company websites.

35
V. Company Profiles
This section consists of full profiles of the following companies in the U.S. pork industry:
• Cargill (Feed, Packing, Final Processing) • Land O’Lakes (Feed) • Tyson Foods (Feed, Production, Packing, Final Processing, Wholesale) • Smithfield Foods (Feed, Genetics, Production, Packing, Final Processing, Wholesale, Food
Service) • Kraft (Final Processing) • General Mills (Final Processing) • SYSCO (Wholesale, Food Service)

COMPANY PROFILE SERIES CARGILL US PORK INDUSTRY
Primary NAICS code: 311611: Animal Slaughtering SIC code: 1511: Production and Processing of Meat
DESCRIPTION Cargill is the world’s largest private company. www.etcgroup.org MAIN SEGMENTS The company has five business segments: Agriculture: Cargill originates processes and distributes grain, oilseeds and other commodities to makers of food and animal nutrition products. It also provides crop and livestock producers with farm services and products. This segment has four distinct business divisions, namely Cargill AgHorizons, Cargill Animal Nutrition, Frontier Agriculture, and Renessen Feed and Processing. Cargill also has a ‘Consulting Services’ department that helps to evaluate and refine operations to maximize performance, productivity and profitability. They serve from mill managers to livestock integrators, to feed companies. Food: The company collaborates with food manufacturers, food service companies and food retailers to provide food and beverage ingredients and meat and poultry products. Their meat segments, Cargill Meat Solutions and Excel Fresh Meats, supply fresh beef, pork, and turkey products. Health: Cargill develops science-based, health promoting ingredients and ingredient systems for makers of food, dietary and pharmaceutical products. Risk management: Cargill provides agricultural, food, financial and energy customers with risk management and financial solutions in world markets. Industrial: Cargill serves industrial users of salt, starch and steel products. It also develops and markets sustainable products made from agricultural feedstock.
Hoover’sCompany Website
OneSource
www.feedindustrynetwork.com
Headquarters: Northfield, Illinois NYSE: KFT Year Established: 1903

37
COMPANY SIZE Annual Revenue: $88.3 billion Assets: $2,343 billion Employees: 158,000
Cargill's last quarter profits (February, 2008) were $1.03 billion. This 86% increase due to global food shortages and the expanding biofuels industry.
Figures for 2007DataMonitor
OneSourceCompany Website
GEOGRAPHIC SCOPE • 158,000 employees in 66 countries • Sales worldwide
Hoover’sCompany Website
DataMonitor HISTORY & MERGERS • Cargill was founded in 1865, when WW Cargill became the proprietor
of a grain flat house in Conover, Iowa. WW Cargill moved the headquarters to La Crosse, Wisconsin in 1875 and started to create more flat houses. By 1889, Cargill also operated a shipbuilding yard in La Crosse. In 1890, the company had expanded to 71 grain elevators and two flour mills6.
• Beef processor Excel Packing Company was formed in Chicago in 1936, and acquired by Cargill in 1979. It became the foundation for Cargill Meat Solutions, Cargill’s umbrella organization for beef, pork, and turkey. Excel opened its first food distribution center to supply grocers and foodservice customers in 1982 and entered the value-added market in 1986 with the acquisition of Del Pero Mondon. Excel entered the pork processing business in 1987 by purchasing two facilities that were being
Hoover’sCompany Website
DataMonitor
6 Text was taken from Datamonitor

38
closed, one by Hormel and the other by Oscar Mayer. Their value-added segment was renamed Emmpack after the acquisition in Emmpak in 2001.
• Cargill, Inc. got serious about the feed business in October, 1945, when the company acquired Nutrena Mills Incorporated, a company that had been in business since 1920 and, at that time, had the capacity to produce a total of 23,000 tons of feed per month in its three feed mills. The purchase price was $1.6 million. Nutrena Mills was one of the most progressive feed companies at that time7.
• In 2008, Cargill acquired the cooked meat operations of Willow Brook Foods, operating as Schweigert Foods. Schweigert Foods processes pork, beef, chicken, and turkey products and sells to the retail, foodservice, and industrial segments.
RELEVANT INFORMATION • Cargill is trying to offer higher value–added products and services and
not only commodities. • It owns 2/3 of the shares of The Mosaic Company, one of the world's
leading producers and marketers of concentrated phosphate and potash crop nutrients.
• It is responsible for 25 percent of all United States grain exports. • It supplies approximately 22 percent of the United States domestic meat
market. (called the “Wal-Mart” of meats”)
Company Websitewww.ft.com
MEDIA PRESENCE 2008 • Acquired cooked meat operations of Willow Brook Foods, operating as
Schweigert Foods 2007 • Implemented an online tracking system to verify the key components of
a carcass using camera vision technology for premium brands • Made donation of 94,520 pounds of ground beef to Second Harvest, the
largest donation of ground beef in the organization’s history • Recalled over a million pounds of beef voluntarily because of E.coli • Recalled about 840,000 pounds of beef distributed to Sam’s Club stores
nationwide because of E. coli • China halts exports of US meats; seen as a response to the massive
recalls from Cargill 2005 • Sold Cargill Investor Services to Refco for $400 million in cash 2004 • Plans to set up wholly owned trading company and processing plants in
China
LexisNexis
7 Data taken form www.cargill.com

39
MAIN COMPETITORS • Smithfield Foods, Inc. • Pilgrim’s Pride • Tyson Foods • Hormel Food Corporation
Hoover’s

COMPANY PROFILE SERIES LAND O’LAKES US PORK INDUSTRY
Primary NAICS code: 311511: Fluid Milk Manufacturing SIC code: 2026: Fluid Milk
DESCRIPTION Land o’Lakes is a farmer-owned cooperative and a leading manufacturer of dairy-based products. Third largest dairy co-operative in the US. Its subsidiary LOL Purina Feed is a leading producer of animal feed in the US.
Company WebsiteOneSource
MAIN SEGMENTS Dairy Foods: LOL produces, markets, and sells more than 300 dairy-based products including butter, cheese, and milk, under their national brands, Land O'Lakes and Alpine Lace, as well as under regional brands, New Yorker and Lake to Lake.
Feed: LOL produces, distributes, and markets animal feed for commercial use through its subsidiary, Land o’Lakes Purina Feed. They distribute through approximately 1,400 local member cooperatives, 4,000 independent dealers directly to customers, and through retail outlets. They have strategic relationships with Syngenta and Monsanto.
Seed: The seed segment mainly operates under the Croplan Genetics brand, selling seeds for alfalfa, soybeans, corn, forage and turf grasses. They also distribute through a local member cooperatives, third-party seed companies or brands, and retail distribution outlets. They have strategic relationships with Syngenta and Monsanto.
Company WebsiteOneSource
Headquarters: North Arden Hills, MN
Year Established: 1920

41
Layers: LOL’s layers division produces and markets eggs and egg products through a subsidiary, MoArk. They process approximately 26 million hens and produce 520 million dozen eggs a year. About 50% of the eggs are marketed through MoArk, and the others are sold at retail and wholesale.
Agronomy: LOL has operated their agronomy segment through their subsidiary, Winfield Solutions, since 2007. Most of the crop protection products are manufactured by third parties then marketed by Winfield products.
KEY BRANDS Relevant to Pork Industry
Brands Dairy Alpine Lace
Land O Lakes New Yorker Lake to Lake
Feed Purina Chow Checkerboard Nine Square
Seed Croplan Genetics (also sells under third party brands)
Agronomy Winfield Solutions (subsidiary) Layers MoArk (subsidiary)
ReutersDataMonitor
COMPANY SIZE Annual Revenue: $8.9 billion Assets: $4.4 billion Employees: 8,700
Annual Revenue Breakdown (in billions) Revenue % Dairy 4.2 billion 46.6Feed 3.0 billion 34.2Seed .92 billion 10.2Layers .51 billion 5.7Agronomy .28 billion 3.3Total 8.9 billion
Figures for 2007OneSource
Annual Report

42
GEOGRAPHIC SCOPE Does business in all 50 states and more than 50 countries.
Serves 300,000 farmers and ranchers in 27 states Foreign operations include feed mills in Taiwan and Poland and marketing functions in Mexico, East Asia, and the Pacific Rim.
Company Website
HISTORY & MERGERS • Land O'Lakes (LOL) began as Minnesota Cooperative Creameries
Association in 1920 and was renamed LOL in 1924. LOL entered the agricultural supply business in 1929 by establishing a feed department, the cheese market in 1934, the dry milk market in 1937, and the fluid milk market in 1951.
• In 1982, LOL merged with Midland Cooperatives, a cooperative that marketed feed, seed, and petroleum.
• In 2004 LOL purchased all of Farmland's ownership interest in LOL Farmland Feed.
• In 2005, the company agreed to sell all of its swine assets to Maschhoffs Incorporated. It also invested an additional $4 million in Penny-Newman Milling, a grain and feed company in California, bringing LOL ownership to 50%.
Company WebsiteDataMonitor
RELEVANT INFORMATION • Produces 12 million tons of feed annually • High commodity prices in past year drove up feed prices and affected
volume and product mix across the industry.
CGGC ReportDataMonitor
MEDIA PRESENCE 2007 • Sold Cheese & Protein International (CPI) operations to Saputo Inc. 2006 • Land O’Lakes secured JPMorgan to amend and restate a $225 million,
five-year senior secured revolver 2005 • L) reported that it and The Maschhoffs Inc. have completed the
transaction in which Maschhoff West LLC will acquire LOL's swine production assets. Terms
2004 • Their animal subsidiary, LOL Farmland Feed LLC was renamed
LOL Purina Feed LLC
LexisNexis

43
MAIN COMPETITORS • Dairy Farmers of America • Dean Foods • Kraft Foods
Hoover’s
SWOT ANALYSIS Strengths Weaknesses Strong market position Broad product portfolio Robust financial performance
Lack of scale Concentrated geographic presence
Opportunities Threats Positive outlook for the US butter and margarine market Growth in private labels
Government regulations Increasing oil prices Outbreak of diseases
From Land O’Lakes Company Profile from DataMonitor (2008)

COMPANY PROFILE SERIES TYSON FOODS US PORK INDUSTRY
Primary NAICS code: 311611: Animal Slaughtering SIC code: 1511: Production and Processing of Meat
DESCRIPTION • Tyson Foods Inc. produces feed to satisfy the company’s own production
of chicken, beef, and pork. • Tyson is the second largest pork producer (17% market share). • Tyson Foods is the world’s largest meat-processing company and one of
the top food production companies in Fortune 500.
Hoover’sCompany Website
OneSource
MAIN SEGMENTS Tyson has four business lines: chicken, beef, pork and prepared foods and related products
The company’s pork operation includes the Company’s fresh, value-added, frozen and refrigerated pork products for retailers, foodservice distributors, restaurant operators, and non-commercial foodservice establishments. It has a vertically-integrated pork production process of production, slaughtering, processing, and wholesale.
OneSource
COMPANY SIZE Annual Revenue: $26.9 billion Annual Income: $268 million Assets: $10.3 billion Employees: 104,000
Figures for 2007OneSource
Headquarters: Springdale, AR NYSE: TSN Year Established: 1935

45
Tyson’s Business Segments and Financial Performance Revenue (mil $) % Operating Income %
Pork 3,309 12.3 135 22.0 Beef 12,703 47.2 35 5.7 Chicken 8,188 30.4 280 45.6 Prepared Foods 2,660 99 81 13.2
Total 26,900 614 Source: OneSource
GEOGRAPHIC SCOPE Sales Offices: China, England, Japan, Mexico, Puerto Rico, Russia, Singapore, South Korea, Taiwan, and UEA.
Tyson’s US Locations
Tyson’s Global Operations • Argentina: Cobb-Vantress joint venture • Brazil: Cobb-Vantress subsidiary • Canada: Beef processing plant, pork processing plant, casings processing
plant • China chicken processing plant, pork processing plant (part ownership),
casings further processing plant (part ownership) • Ireland: Pork further processing plant (part ownership) • Mexico: chicken processing plant • Panama: chicken processing plant • Russia: pork further processing plant (part ownership)
Company Website

46
HISTORY & MERGERS • Tyson Foods (Tyson) was promoted by John Tyson in 1935. It was
initially engaged in hauling hay, fruit, and chickens for local farmers. The following year, the company undertook hauling trips to Chicago, Illinois poultry markets. By 1937, the company had extended its hauling operations to Cincinnati, Detroit, Cleveland, Memphis and Houston.
• In 1947, Tyson Feed and Hatchery was incorporated. • In 1957, Tyson built its first processing plant on the north side of
Springdale. • The company went public in 1963, and changed its name to Tyson’s
Foods. Tyson made its first significant acquisition with the purchase of Garrett Poultry Company in Rogers, Arkansas during the same year.
• In 1971, the company’s name was changed to Tyson Foods. In the early part of 1980’s the company acquired Honeybear Foods in Neosho, Missouri.
• The company acquired Holly Farms, the third largest poultry firm in the US, in 1989. In the same year Tyson entered into partnership with Trasgo, a Mexico-based poultry company, to create an international partnership with Mexico and Japan called CITRA.
• By the end of the 1990s, Tyson strengthened its position as the world’s largest poultry producer by acquiring its long-time competitor Hudson Foods.
• In 2001, the company became the world’s largest processor and marketer of chicken and red meat, following the acquisition of its rival, IBP, which was the largest beef packer and the second largest pork processor in the US.
• In January 2007, Tyson has entered into a joint venture with Cactus Feeders, a cattle breeding company in Argentina, to create the first
DataMonitor

47
vertically integrated beef operation in the South American country. • In April 2007, ConocoPhillips and Tyson formed a strategic alliance to
produce and market the next generation of renewable diesel fuel, which will help supplement the traditional petroleum-based diesel fuel supply. The alliance plans to use beef, pork and poultry by-product fat to create a transportation fuel. This fuel will contribute to America’s energy security and help to address climate change concerns.
• In June 2007, Tyson joined forces with Syntroleum Corporation, a Tulsa-based synthetic fuels technology company, to form a joint venture, called Dynamic Fuels, which will produce synthetic fuels targeting the renewable diesel, jet, and military fuel markets.
MEDIA PRESENCE 2008 • Sanderson and Perdue sue Tyson for advertising campaign touting
chicken “raised without antibiotics”; Lost suit, required to dismantle campaign in two weeks
2007 • Management of fresh meats division restructured 2006 • Declining earnings in pork, beef, and chicken; cites pricing as the cause 2005 • Tyson penalized by SEC for benefits to Chairman • Added to S&P 500 2004 • Court rules that illegal immigrants who were exploited by Tyson for
lower wages can seek damages • Court rules that Tyson must pay damages for using ‘captive supply’ to
depress the supply of meat
LexisNexis
MAIN COMPETITORS • Smithfield Foods, Inc. • Pilgrim’s Pride • Tyson Foods • Hormel Food Corporation
Hoover’s

48
SWOT ANALYSIS
From Tyson Foods, Inc Company Profile from DataMonitor (2008)

COMPANY PROFILE SERIES SMITHFIELD US PORK INDUSTRY
Primary NAICS code: 311611: Animal Slaughtering (except poultry) SIC code: 2011: Meat Packing Plants
DESCRIPTION Five reporting segments: Pork, International, Hog Production, Other, and Corporate Pork Segment -Packaged meats, 57% of revenues -Fresh pork: 41% -Other products, 2% Hog Production - 41% of hogs purchased from Hog Production segment (internal purchases) - 10% of hogs purchased through Maxwell Foods, Inc. and Prestige Farms, Inc Operates 17 processing plants in its pork segment Operates Smithfield Premium Genetics (sow raising and production) Also involved in turkey production
Company Website
KEY BRANDS Relevant to Pork Industry Smithfield, Farmland, John Morrell, Gwaltney, Great, Cumberland Gap, Armour, Eckrich, and private-label products Involvement in Foodservices Most Smithfield subsidiaries provide products to retail and foodservice customers.
Company WebsiteAnnual Reports
Invision Food Marketing Group
Headquarters: Smithfield, VA NYSE: SFD Year Established: 1936

50
Smithfield Foodservice Group Private subsidiary through which Smithfield caters to foodservice industry. Established in May 2003 by combining the Foodservice Sales and Marketing organizations of Gwaltney and Smithfield Packing Company. No financial information available. Not listed under Smithfield’s family of companies.
Smithfield Packing Company, Inc. $3 billion, annual sales Provides packaging for retail, foodservice, and deli channels
John Morrell & Co. $2 billion, annual sales Meat manufacturer; serves retail, foodservice and deli. In 2008, Partnered with Sysco, the world’s largest foodservice distributor, to provide foodservice operators with smaller boxes of fresh pork more flexibility.
Farmland Foods $2.3 billion, annual sales Produces pork products for retail and foodservice.
Northside Foods Corp. Pork and turkey for foodservices industry; First to provide precooked sausages for McDonald’s.
Patrick Cudahy, Inc. Precooked ham, bacon, sausage, and meats; Increased sales of foodservice precooked bacon slices by 28 percent and launched a foodservice ad campaign featuring customer testimonials.
Premium Standard Farms Acquired in 2007; a large provider to foodservices and sixth largest food processor in the US.
COMPANY SIZE Annual Revenue: $11.3 billion Pork segment sales: $9.6 billion Hog Production segment sales: $2.4 billion Annual Income: 128.9 million Assets: $3.0 billion (shareholder equity) $3.1 billion (market capitalization on 8/25/08) Employees: 58,100 (35,300 of which are in the pork segment and 7,500 in the hog production segment. Other employees in remaining segments)
Figures for 2007Company
WebsiteAnnual Report

51
RANKINGS • Fortune 1000: Rank 222, 2008 • FT US 500: NA • Producer Rank
o Europe: Largest packaged meats producer o US: Largest cattle feeding producer o World: Largest producer and processor of pork
• Marketshare
o Fresh and processed pork products, 31% of US pork production, total hogs processed: 26.7 million
o Packaged meat sales: 3.1 billion pounds o Fresh pork sales: 4 billion pounds o Hog Production, 17% of US hog production, total hogs sold:
14.6 million, 1,227,000 sows, accounting for 20% of total US sow inventory
Freese and Johnston 2007
Company Website
Timeline
GEOGRAPHIC SCOPE Smithfield operates over 30 companies internationally in pork, turkey, and food services.
Domestic Segments Mainly involved in hog production, pork processing, and turkey processing. Beef group was divested to JBS-Swift in 2008.
International Segments • Groupe Smithfield S.L. (Europe)
$1.6 billion, annual sales Sausage, ham, poultry, pate, and read to eat meals; serves retail and foodservice
• Animex (Poland) $1 billion, annual sales Fresh and packaged meats
Company Website
Annual Report

52
• Smithfield Prod (Romania) $.14 million, annual sales Primarily fresh pork for retail customers
• Smithfield Foods, Ltd. (U.K.) • Campofrío (Spain) • Maverick Food Co. Ltd. (China) • Norson (Mexico)
Control over hog production in Poland, Romania, and Mexico
HISTORY & MERGERS
RELEVANT INFORMATION Developed the Animal Welfare Management System (AWMS) which is open to audits from third parties as part of the National Pork Board’s Pork Quality Assurance program, PQA Plus.
Decided in 2007 to phase out gestation stalls on sow farms in favor of group housing over the next 10 years.
In 2005, partnered with Compass Group to limit antibiotic usage in Murphy-Brown, Smithfield’s hog production subsidiary. Policy includes: • Therapeutic and preventative antibiotics to treat illnesses with proper
diagnosis • No routine or consistent administration of antibiotics to healthy animals
over lifetime
Company Website
Smithfield’sWelfare Policy
EDF’s agreement with Compass
Group and Smithfield

53
• Adherence to antibiotic withdrawal timelines established by the FDA and the Food Animal Residue Avoidance Databank.
• No consistent use of feed-grade antimicrobials of human health significance over the life of a healthy animal. Use of particular antimicrobials as additives in feeds will be reviewed at least quarterly by a veterinarian and will be adjusted as appropriate, depending on disease prevention and control needs.
• Antibiotics used and antibiotic administration practices to be approved by licensed professional veterinarians.
MEDIA PRESENCE Legal battles because of fighting unionization with illegal methods. Trend of growing company through acquisitions, especially in pork division.
2008
- Sold 7 million shares to Cofco Ltd, China’s largest national agricultural-trading and processing company
2006 - Nonunion walk-out at pork plant in Tar Heel, NC - Lost lawsuit from 1997, ruling that they broke the law while fighting
unionization - Lost lawsuit from 2003, ruling that they illegally fired contractor
workers from QSI 2004
- Fined $2 million for buying stock in IBP Inc, eventually lost it to Tyson Foods Inc.
2003 - Outbid Cargill to buy Farmland Industries pork division - Pennexx Foods claimed Smithfield was trying to force it out of
business and filed a lawsuit
LexisNexis
MAIN COMPETITORS • Tyson • JBS/Swift • Excel • Hormel
Hoover’s
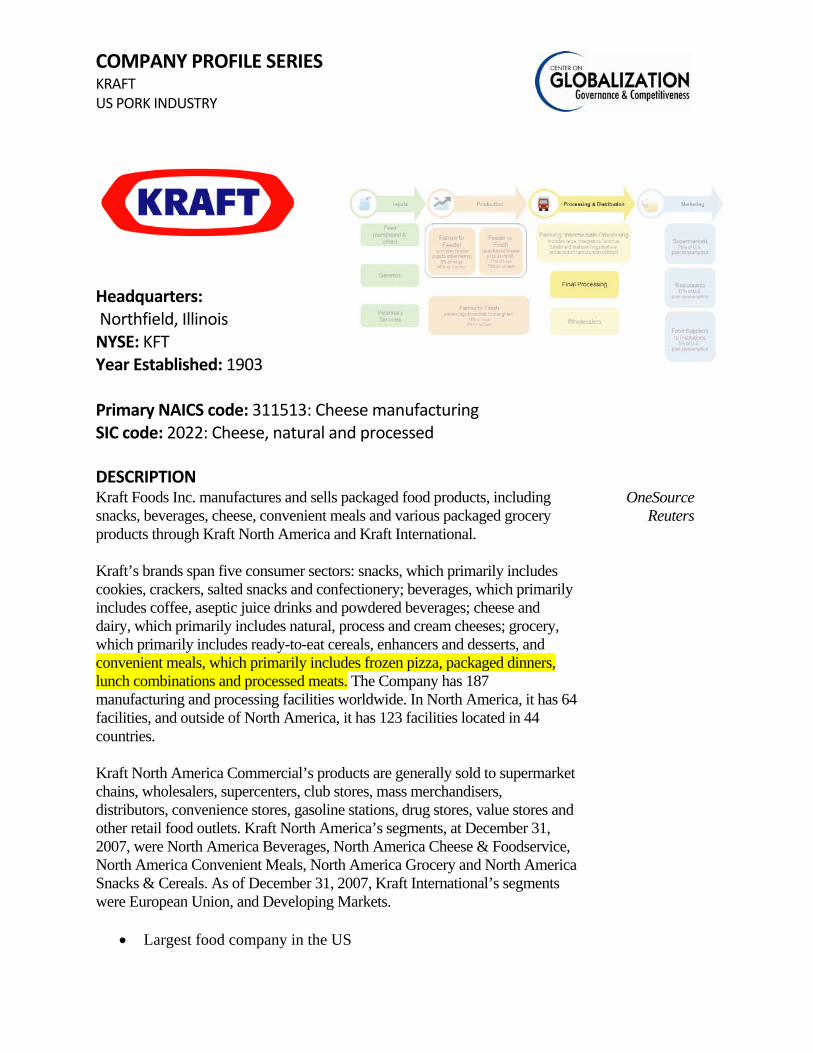
COMPANY PROFILE SERIES KRAFT US PORK INDUSTRY
Primary NAICS code: 311513: Cheese manufacturing SIC code: 2022: Cheese, natural and processed DESCRIPTION Kraft Foods Inc. manufactures and sells packaged food products, including snacks, beverages, cheese, convenient meals and various packaged grocery products through Kraft North America and Kraft International.
Kraft’s brands span five consumer sectors: snacks, which primarily includes cookies, crackers, salted snacks and confectionery; beverages, which primarily includes coffee, aseptic juice drinks and powdered beverages; cheese and dairy, which primarily includes natural, process and cream cheeses; grocery, which primarily includes ready-to-eat cereals, enhancers and desserts, and convenient meals, which primarily includes frozen pizza, packaged dinners, lunch combinations and processed meats. The Company has 187 manufacturing and processing facilities worldwide. In North America, it has 64 facilities, and outside of North America, it has 123 facilities located in 44 countries.
Kraft North America Commercial’s products are generally sold to supermarket chains, wholesalers, supercenters, club stores, mass merchandisers, distributors, convenience stores, gasoline stations, drug stores, value stores and other retail food outlets. Kraft North America’s segments, at December 31, 2007, were North America Beverages, North America Cheese & Foodservice, North America Convenient Meals, North America Grocery and North America Snacks & Cereals. As of December 31, 2007, Kraft International’s segments were European Union, and Developing Markets.
• Largest food company in the US
OneSourceReuters
Headquarters: Northfield, Illinois NYSE: KFT Year Established: 1903

55
• Largest food company in the world • Largest cheese brand in the world
MAIN SEGMENTS Snacks: cookies, crackers, salted snacks and confectionery Beverages: coffee, aseptic juice drinks and powdered beverages Cheese and dairy: natural, process and cream cheeses Grocery: ready-to-eat cereals, enhancers and desserts Convenient meals: frozen pizza, packaged dinners, lunch combinations and processed meats
OneSource
KEY BRANDS Relevant to Pork Industry Convenient Meals • DiGiorno • Tombstone • California Pizza Kitchen • Jack’s • Delissio • Taco Bell Home Originals Lunch Goods • Lunchables • Oscar Mayer • Louis Rich • Deli Creations
Reuters
COMPANY SIZE Annual Revenue: $37.241 billion Assets: $68.0 billion Employees: 103,000
Revenue Breakdown for FY2007 (in billions) Revenue % US Beverages 3.235 8.7US Cheese, North America Foodservice
6.382 17.1
US Convenient Meals 5.097 13.7US Grocery 2.699 7.2US Snacks & Cereals 6.256 17.5Europe, Middle East, Africa 7.954 21.4Latin America, Asia Pacific 5.348 14.4Total 37.241
Figures for 2007DataMonitor

56
RANKINGS • Fortune 500: Rank 63, 2008 • FT Global 500: Rank 166, 2008 • S&P 500
Hoover’s Cross-referenced
with actual source GEOGRAPHIC SCOPE
Segment United States Europe Other Total
Revenues (in billions)
21.543 9.384 6.314
37.241
Manufacturing &
Processing Facilities Kraft North America 64Kraft International *123 187
*in 44 countries Kraft has operations in 70 countries and sells its products in more than 150 countries.
OneSourceDataMonitor
HISTORY & MERGERS Kraft began as a cheese business in 1903. In 1903, Kraft went public and opened its first European sales office in London. They acquired Philadelphia brand cream cheese in 1928. They were acquired by National Dairy in 1930 and expanded into new product lines. National Dairy temporarily merged with Dart Industries from 1980 to 1986, but Kraft’s operations were not affected. In 1988, Philip Morris acquired Kraft and merged it with its General Foods division, forming Kraft General Foods. During the 1990s, Kraft expanded into Central and Eastern Europe through a series of acquisitions in varying product lines. In 2000, Philip Morris acquired Nabisco Holdings, and put under Kraft Foods’ umbrella of operations.
2008 - Merged Post cereals business into Ralcorp Holdings, Inc. 2007 – Acquired Groupe Danone S.A.’s global biscuit group 2007 – sold all cereal assets in Romania
OneSourceDataMonitor
Hoover’s

57
RELEVANT INFORMATION • Wal-Mart accounted for 19 % of consolidated net sales and 27 % of net
sales in the US Retail segment. • General Mills’ warehouse space totals 13 million square feet, of which
10 million square feet are leased • General Mills’ administrative offices total 3 million square feet
worldwide, 600,000 square feet of which are leased.
OneSource
MEDIA PRESENCE 2007 • Multiple lawsuits for misleading product labeling 2006 • Altria Group Inc. to spin off its 88% stake in Kraft 2005 • Higher cheese prices result in Kraft’s loss of marketshare to store brands 2004 • Kraft continues acquisitions and divestments to intend to please Wal-
Mart 2003 • New product and brand focus on health and wellness, but considered
late to the game
LexisNexis
MAIN COMPETITORS • ConAgra • Nestle • Sara Lee Food & Beverage
Hoover’sOneSource
SWOT ANALYSIS Strengths WeaknessesStrong brand image and product innovation Strong distribution network Focus on research and development
Declined profitabilityGeographic concentration
Opportunities ThreatsRestructuring Growing demand for ‘health and wellness’ products and services Growth in the US coffee market
Fierce competitionLitigation risks Falling US consumer confidence
From Kraft Foods, Inc. Company Profile from DataMonitor (2008)

COMPANY PROFILE SERIES SYSCO US PORK INDUSTRY
Primary NAICS code: 311230: Breakfast Cereal Manufacturing SIC code: 2043: Cereal Breakfast Foods DESCRIPTION General Mills, Inc. manufactures and markets consumer foods through retail stores, and the foodservice and commercial baking industries.
OneSourceHoover’s
DataMonitorAnnual Report
Headquarters: Minneapolis, MN NYSE: GIS Year Established: 1928
59
MAIN SEGMENTS U.S. Retail Segment General Mills manufactures ready-to-eat cereals, refrigerated yogurt, ready-to-serve soup, dry dinners, shelf stable and frozen vegetables, refrigerated and frozen dough products, dessert and baking mixes, frozen pizza and pizza snacks, grain, fruit and savory snacks, microwave popcorn, soup, granola bars, and cereal. Their products are sold in grocery stores, mass merchandisers, membership stores, natural food chains, and drug, dollar and discount chains. International Segment General Mills maintains a similar product line in Canada. Outside of North America, They sell super-premium ice cream, grain snacks, shelf stable and frozen vegetables, dough products, and dry dinners. Some of their products are manufactured in the US and exported. Revenues from exports are reported in the region or country where the products are sold. Bakeries and Foodservice Segment General Mills produces ready-to-eat cereals, snacks, dinner and side dish products, refrigerated and soft-serve frozen yogurt, frozen dough products, branded baking mixes, and custom food items for major foodservice distributors and operators, convenience stores, wholesale bakeries, vending machine operators, restaurant operators, and business and school cafeterias in the US and Canada.
OneSource
KEY BRANDS Relevant to Pork Industry • Betty Crocker • Progresso soups • Old El Paso • Hamburger Helper • Totino’s • Jeno’s
Company Website
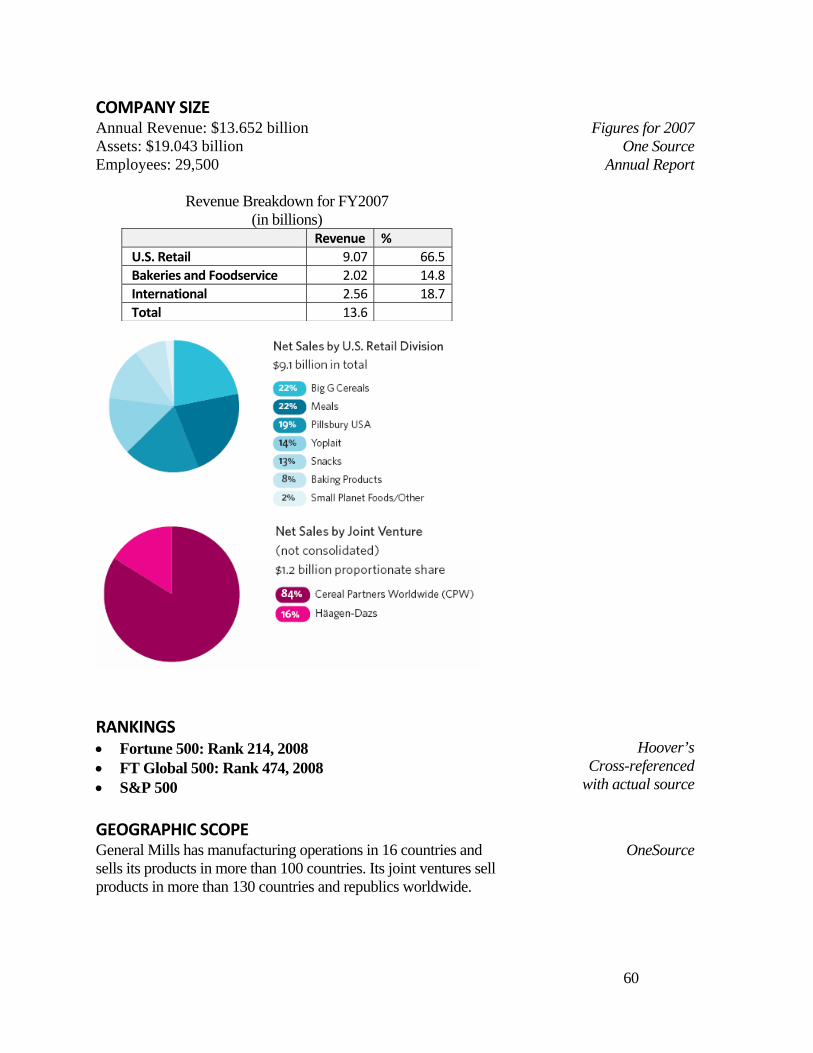
60
COMPANY SIZE Annual Revenue: $13.652 billion Assets: $19.043 billion Employees: 29,500
Revenue Breakdown for FY2007 (in billions)
Revenue % U.S. Retail 9.07 66.5Bakeries and Foodservice 2.02 14.8International 2.56 18.7Total 13.6
Figures for 2007One Source
Annual Report
RANKINGS • Fortune 500: Rank 214, 2008 • FT Global 500: Rank 474, 2008 • S&P 500
Hoover’s Cross-referenced
with actual source
GEOGRAPHIC SCOPE General Mills has manufacturing operations in 16 countries and sells its products in more than 100 countries. Its joint ventures sell products in more than 130 countries and republics worldwide.
OneSource

61
As of May 25, 2008, the Company operates 79 facilities for food product production.
- United States: 49 - Asia/Pacific: 12 (8 leased) - Europe: 7 (3 leased) - Canada: 5 (2 leased) - Latin America: 5 - South Africa: 1
HISTORY & MERGERS RELEVANT INFORMATION • Wal-Mart accounted for 19 % of consolidated net sales and 27 % of net
sales in the US Retail segment. • General Mills’ warehouse space totals 13 million square feet, of which
10 million square feet are leased • General Mills’ administrative offices total 3 million square feet
worldwide, 600,000 square feet of which are leased.
OneSource
MEDIA PRESENCE 2008 • Dining at home lifts General Mills’ profits 2005 • Sued by employee who was suspended after reporting accounting
violations to regulators 2004 • Investments for cereals to go completely whole grain • Repurchased shares when Diageo sold General Mills stock by selling
$835 million preferred interest to Lehman Brothers 2003 • SEC investigations of General Mills’ accounting
LexisNexisGoogleNews
MAIN COMPETITORS • Danone • Kellogg • Ralcorp
Hoover’s

62
SWOT ANALYSIS Strengths WeaknessesStrong market position Growing international operations Product development skills
Rising SG&A expensesCustomer concentration Higher dependence on the US markets
Opportunities ThreatsIncreasing demand for private label products Growing health consciousness Rising demand for cereals Growing foodservice sector* Steady growth in savory snacks
Increasing competitionRegulations Raw material prices
From General Mills Company Profile from DataMonitor (2008)
*According to National Restaurant Association (NRA), restaurant industry sales grew 5% from 2005 to 2006, to $511 billion. Full service restaurants sales should grow about 5.3% in the fiscal 2007 because of a rise in disposable income and increased tourism. Sales at quick service restaurants should grow about 5.4% because of demand for convenience and value. The restaurants' share of the food dollar is 47.5%, but it is expected to reach 53% by 2010.
General Mills’ retail division (66.5% of sales) and bakeries and foodservice (14.5% of sales) may share in the growth of the foodservice sector.
(Source: DataMonitor, 2008)

COMPANY PROFILE SERIES SYSCO US PORK INDUSTRY
Primary NAICS code: 424410: General line grocery merchant wholesalers SIC code: 5141: Groceries, general line DESCRIPTION North American distributor of food and related products to the foodservice industry.
Provides products and services to over 400,000 customers, through over 180 distribution centers in the US and Canada.
SYSCO’s broadline distribution business supplies food and related products to restaurants, educational institutions, hotels, healthcare facilities, and other foodservice customers. The company distributed nationally branded products as well as its own private label goods. SYSCO suppliers specialty produce, meat products, distributes kitchen equipment and supplies for the hospitality industry.
SYSCO’s SYGMA Network operation supplies directly to chain restaurants.
Customers in the restaurant industry account for over 60% of sales, and Wendy’s accounts for 5% of SYSCO’s business.
Primary markets are food retailers and wholesalers, restaurants
OneSourceDataMonitor
Hoover’sCompany Website
Headquarters: Houston, TX NYSE: SYY Year Established: 1969
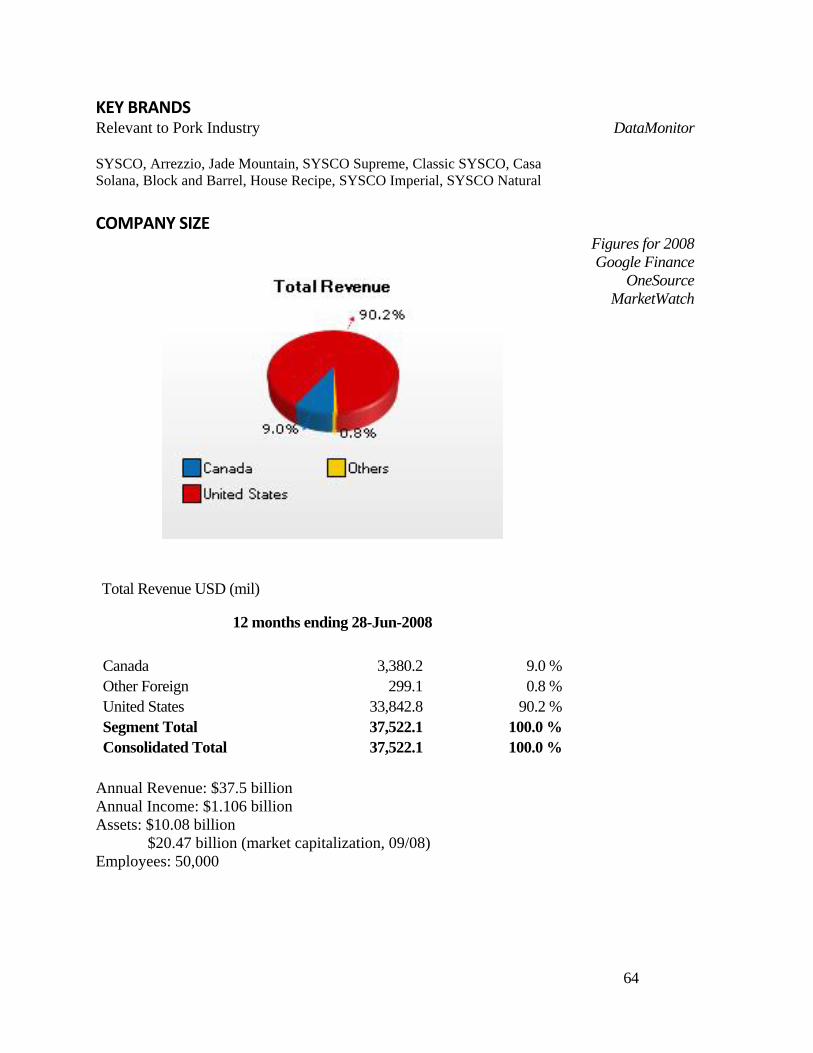
64
KEY BRANDS Relevant to Pork Industry SYSCO, Arrezzio, Jade Mountain, SYSCO Supreme, Classic SYSCO, Casa Solana, Block and Barrel, House Recipe, SYSCO Imperial, SYSCO Natural
DataMonitor
COMPANY SIZE
Total Revenue USD (mil)
12 months ending 28-Jun-2008 Canada 3,380.2 9.0 %Other Foreign 299.1 0.8 %United States 33,842.8 90.2 %Segment Total 37,522.1 100.0 %Consolidated Total 37,522.1 100.0 %
Annual Revenue: $37.5 billion Annual Income: $1.106 billion Assets: $10.08 billion $20.47 billion (market capitalization, 09/08) Employees: 50,000
Figures for 2008Google Finance
OneSourceMarketWatch

65
HISTORY & MERGERS SYSCO (Systems and Services Company) has grown from a $115 million dollar company since its inception to a $35 billion company (FY 2007). The company operates from over 170 locations throughout the United States and Canada
In 1977 SYSCO surpassed its competitors to become the leading supplier to "meals-prepared-away-from-home" operations in North America. Since then, the foodservice industry has grown from $35 billion to more than $200 billion.
• 1998 – SYSCO acquired CFS Continental, which was the third-largest North American food distributor.
• 1992 – SYSCO acquired Collins Foodservice and Benjamin Polakoff & Son and Perloff Brothers.
• 2000 – SYSCO acquires Watson Foodservice, FreshPoint Holdings, North Douglas Distributors and Albert M Briggs.
• 2000 – Opens 5th broadline distribution facility (SYSCO Food Services of Sacramento).
• 2000 – SYSCO, Cargill, Tyson and McDonald’s form Electronic Foodservice Network (EFS Network), a company that operates and independent business to business (B@B) marketplace to facilitate sales and purchases in the foodservice industry.
• 2001 – SYSCO acquires certain operation of The Freedman Companies, HRI Supply, Franklin Supply Company, and Fulton Provision.
• 2002 – Acquired SERCA Foodservice, Asian Foods and Abbott Foods. • 2003 – SYSCO and Starbucks Coffee enter into an agreement which
granted SYSCO the exclusive rights to distribute Starbucks products to non contracted foodservice customers.
• 2004 – SYSCO acquired International Food Group, a distributor of foodservice products to chain restaurants in international markets.
• 2005 – The company acquired certain assets of Western Foods, a broadline foodservice distributor.
• 2006 – SYSCO acquired Desert Meats and Provisions, the largest independent specialty meat distributor in Las Vegas and southern Nevada foodservice markets.
Today, SYSCO has sales and service relationships with approximately 400,000 customers and is committed to helping them succeed in the foodservice industry.
Company WebsiteHoover’s

66
MEDIA PRESENCE “SYSCO’s Board Approves 20-Million-Share Repurchase Program” [PrimeNewswire, September 22, 2008] SYSCO Corporation (NYSE:SYY), the world's largest foodservice marketer and distributor, announced that its Board of Directors approved a 20-million-share repurchase program. The approved program is SYSCO’s fifteenth share repurchase program since FY 1992. SYSCO’s previously approved 20-million-share repurchase program from July 2007 has approximately 3.0 million shares remaining. These remaining shares will be repurchased prior to the initiation of the new program. Under the new repurchase program, shares will be acquired in the open market or in privately negotiated transactions at the Company’s discretion, subject to market conditions and other factors, and in accordance with applicable laws, rules and regulations. For FY 2008 that ended June 28, 2008, the company generated more than $37 billion in sales.
“SYSCO’s Profit Falls on Fuel and Options”[The New York Times, Tuesday, August 15, 2006 (Late Edition – Final)] SYSCO, hurt by soaring fuel costs and stock options expenses, posted an 11 percent decline in quarterly profit. The company reported a profit of $254.1 million, or 41 cents a share, down from $284.7 million, or 44 cents a share, a year earlier. Sales in the period, which ended July 1 and was the fourth quarter of SYSCO’s fiscal year, rose 6.6 percent, to $8.51 billion. Operating expenses as a percent of sales rose to 14.7 percent, compared with 13.6 percent in the quarter last year, on higher fuel prices and pension expenses.
“SYSCO Acquires International Food Group.”[The Associated Press State & Local Wire, Monday, June 21, 2004, (BC cycle)] SYSCO Corporation has acquired International Food Group Inc. to expand its presence and capabilities outside North America. Financial terms were not disclosed. International Food (Plant City, FL) supplies products to fast-food restaurants in the Caribbean, Central and South America, Europe, Asia and the Middle East. SYSCO had sales of $27.5 billion for 2003 while International Food generated sales of $77.8 million. Shares of SYSCO finished at $37.22 Monday, down 41 cents, or 1.1 percent, on the New York Stock Exchange. “SYSCO’s Quarterly Profits Up 14 Pct.” [Associated Press Online, Monday, October 27, 2003] SYSCO Corporation, the country’s largest distributor of food to restaurants, said that its profits had climbed 14 percent in the latest quarter
LexisNexis

67
despite higher food costs. Sales rose 11 percent to $7.13 billion from $6.42 billion. Acquisitions contributed about 1.9 percent to overall sales growth, compared with 5.4 percent a year earlier.
MAIN COMPETITORS • U.S. Foodservice • Gordon Foodservice • Keystone Foods LLC • MBM Corporation • Performance Food Group Company • SUPERVALU INC.
Hoover’sOneSource

68
References Armstrong, Laura. 2005. “Smithfield Commits to Continued Improvement.” Maryland Department of the Environment. Website, accessed August 7, 2008: http://www.mde.state.md.us/ResearchCenter/Publications/General/eMDE/vol1no2/smithfield.asp
Bittman, Mark. 2008, January 27. “Rethinking the Meat-Guzzler.” New York Times. Boggess, Mark, Hans H. Stein, and Joel DeRouchey. 2008. “Alternative Feed Ingredients in Swine Diets.” National Pork Board. Accessed July 23, 2008. Cargill, Inc. 2008. “Cargill At A Glance.” Online web page, available online, accessed August 7, 2008: http://www.cargill.com/about/organization/ataglance.htm. ConAgra Foods, Inc. 2008. “Annual Report 2008.” Available at the ConAgra Foods, Inc. web site, accessed August 22, 2008: http://investor.conagrafoods.com/phoenix.zhtml?c=97518&p=irol-reportsAnnual.
Datamonitor. 2007. “Meat Industry in the United States.” Davis, Christopher G. and Lin, Biing-Hwan. 2005a. “Factors Affecting U.S. Beef Consumption.” Electronic Outlook Report from the Economic Research Service, Report No. LDP-M-130-02. Available online at the USDA-ERS web site, accessed August 7, 2008: http://www.ers.usda.gov/publications/ldp/Oct05/ldpm13502/ldpm13502.pdf. Davis, Christopher G. and Lin, Biing-Hwan. 2005b. “Factors Affecting U.S. Pork Consumption.” Electronic Outlook Report from the Economic Research Service, Report No. LDP-M-130-01. Available online at the USDA-ERS web site, accessed August 7, 2008: http://www.ers.usda.gov/publications/LDP/may05/ldpm13001/ldpm13001.pdf. Freese, Betsy, and Johnston, Gene. 2007. “Pork Powerhouses 2007.” Agriculture Online web site, citation to 2007 Successful Farming magazine report. Available online, accessed July 31, 2008: http://www.agriculture.com/ag/story.jhtml?storyid=/templatedata/ag/story/data/1191433726480.xml Fusaro, Dave, 2008. “Special Report. Top 100: Succeeding in a Difficult Year.” Food Processing. Unknown volume, available online at the Food Processing web site, accessed August 22, 2008: http://foodprocessing.com/articles/2008/307.html.
Geisler, Malinda. 2008. “Foodservice Pork Profile.” Agricultural Marketing Resource Center. Iowa State University. Accessed August 6, 2008. http://www.agmrc.org/agmrc/commodity/livestock/pork/foodserviceporkprofile.htm http://www.pork.org/documents/PorkScience/Alternative%20Feed%20Brochure.pdf
69
General Mills, Inc. 2008. “Annual Report 2008.” Available at the General Mills, Inc. web site, accessed August 22, 2008: http://phx.corporate-ir.net/phoenix.zhtml?c=74271&p=irol-reportsannual. Hormel Foods Corporation. 2007. “Hormel Foods Corporation 2007 Annual Report.” Available at the Hormel Foods web site, accessed August 7, 2008: http://phx.corporate-ir.net/phoenix.zhtml?c=71258&p=irol-irhome.
Hormel Foods, Inc. 2007. “Annual Report 2007.” John Green, Director of Strategic Marketing, National Pork Board, private communication with CGGC researcher Gloria Ayee, August 7, 2008. Key, Nigel and McBride, William. 2007. “The Changing Economics of U.S. Hog Production.” Economic Research Report No. ERR-52. Available online at the USDA-ERS web site, accessed July 31, 2008: http://www.ers.usda.gov/Publications/ERR52. MacDonald, James M. and Korb, Penni. 2005. “Agricultural Contracting Update, 2005.” Economic Information Bulletin No. EIB-35. Available at the USDA-ERS web site, accessed July 31, 2008: http://www.ers.usda.gov/Publications/EIB35/. MacDonald, James M., Ollinger, Michael E., Nelson, Kenneth E., and Handy, Charles R. 2000. “Consolidation in U.S. Meatpacking.” Agricultural Economic Report No. 785 (Washington DC: USDA Economic Research Service). Available at the USDA-ERS web site, accessed July 31, 2008: http://www.ers.usda.gov/publications/aer785/. Market Watch. 2008. “Turning Tides at Whole Foods.” 2008, August 6. Retrieved August 21, 2008 from http://www.marketwatch.com/news/story/tides-have-turned-whole-foods/story.aspx?guid={2D43AF4D-7B54-47D4-B9B5-3FEB3B499152}
McBride William D. and Key, Nigel. 2003. “Economic and Structural Relationships in U.S. Hog Production.” Agricultural Economic Report No. AER818. Available at the USDA-ERS web site, accessed July 31, 2008: http://www.ers.usda.gov/publications/aer818/. McBride William D. and Key, Nigel. 2007. “Characteristics and Production Costs of U.S. Hog Farms, 2004.” Electronic Information Bulletin No. EIB-32. Available at the USDA-ERS web site, accessed July 31, 2008: http://www.ers.usda.gov/Publications/EIB32/. Miles, Richard D. and Jacqueline P. Jacob. 2003. “Fishmeal in Poultry Diets: Understanding the Production of this Valuable Feed Ingredient.” University of Florida, IFAS Extension. http://edis.ifas.ufl.edu/PS007 National Oceanic and Atmospheric Administration. 2008. “Aquaculture in the United States.” Accessed August 19, 2008. http://aquaculture.noaa.gov/us/welcome.html

70
National Pork Board, “Pork in Foodservice 2007. 2007. Accessed August 11, 2008. http://www.porkfoodservice.com/documents/PorkInFoodservice2007.pdf National Pork Producers’ Council. “Today’s U.S. Pork Industry.” Accessed 18 July 2008. http://www.nppc.org/about/pork_today.html National Pork Registry, home page, http://www.nationalswine.com/ Performance Food Group website, accessed September 2, 2008: http://www.pfgc.com/Customers/Products/Pages/NationalSuppliers.aspx Smithfield Foods Inc. 2007a. “2007 Consumer Analyst Group of New York Conference.” Smithfield Foods, Inc. 2007b. “Annual Report 2007.” Supermarket News, “SN’s Top 25 Worldwide Food Retailers for 2008.” Accessed August 12, 2008 at: http://supermarketnews.com/profiles/top25/top_25_food_retailers_worldwide/ Technomic Information Services, “Industry Facts.” 2008. Accessed August 11, 2008: http://www.technomic.com/facts/Top100_page1.html) Technomic, Inc. and International Foodservice Manufacturers Association. 2006. "Foodservice 101, The Essential Industry Handbook for Foodservice Executives." Technomic Information Services. Tyson Foods, Inc. 2007. “Tyson Foods, Inc. 2007 Annual Report.” Available at the Tyson Foods, Inc. web site, accessed August 7, 2008: http://ir.tyson.com/phoenix.zhtml?c=65476&p=irol-irHome. United States Department of Agriculture, Economic Research Service. 2005a. “ERS/USDA Briefing Room – Hogs: Background.” Internet page, accessed July 31, 2008: http://www.ers.usda.gov/Briefing/Hogs/Background.htm. United States Department of Agriculture, Economic Research Service. 2005b. “Factors Affecting U.S. Pork Consumption.” Available online, accessed August 12, 2008, at: http://www.ers.usda.gov/Publications/LDP/may05/ldpm13001/ United States Department of Agriculture, Economic Research Service. 2008a. Commodity Costs and Returns: U.S. and Regional Cost and Return Data [dataset]. Available at the USDA-ERS web site, accessed July 31, 2008: http://www.ers.usda.gov/Data/CostsAndReturns/testpick.htm.

71
United States Department of Agriculture, Economic Research Service. 2008b. Meat Price Spreads [Table 90] [dataset]. Available at the USDA-ERS web site, accessed July 31, 2008: http://www.ers.usda.gov/Data/MeatPriceSpreads/. United States Department of Agriculture, Economic Research Service. 2008c. US Pork Outlook Report - August 2008. Extract from Richard Stillman, August 2008: Livestock, Dairy and Poultry Outlook Report. Available at the USDA-ERS web site, accessed August 26, 2008: http://www.thepigsite.com/articles/7/markets-and-economics/2290/us-pork-outlook-report-august-2008 United States Department of Agriculture, Foreign Agricultural Service. 1997, 2007. Production, Supply, and Distribution [dataset]. Available online at the USDA-FAS web site, accessed July 31, 2008: http://www.fas.usda.gov/psdonline/psdHome.aspx. United States Department of Agriculture, Grain Inspection, Packers and Stockyards Administration. 2008. “Packers and Stockyards Statistical Report, 2006 Reporting Year.” GIPSA SR-08-1 (Washington DC: USDA Grain Inspection, Packers, and Stockyards Administration). Available at the USDA-GIPSA web site, accessed July 31, 2008: http://archive.gipsa.usda.gov/pubs/2006_stat_report.pdf. United States Department of Agriculture, National Agricultural Statistics Service. 2007. “Statistical Highlights of U.S. Agriculture, 2006-2007.” Statistical Report No. 1007, available online at the USDA-NASS web site, accessed July 31, 2008. United States Department of Agriculture, National Agricultural Statistics Service. 1998a. “Hogs and Pigs, Final Estimates 1993-1997.” Statistical Bulletin No.951 (Washington DC: USDA National Agricultural Statistics Service). Available online at the USDA-NASS web site, accessed July 31, 2008: http://usda.mannlib.cornell.edu/nass/SB951/b9511298.pdf. United States Department of Agriculture, National Agricultural Statistics Service. 1998b. “Livestock Slaughter, 1997 Summary.” Statistical Bulletin No. Mt An 1-2 -1 (3-98), released March 1998. Available online at the USDA-NASS web site, accessed July 31, 2008: http://usda.mannlib.cornell.edu/usda/nass/LiveSlauSu//1990s/1998/LiveSlauSu-03-06-1998.txt. United States Department of Agriculture, National Agricultural Statistics Service. 1999. “Meat Animals Production, Disposition, and Income, Final Estimates 1993-1997.” Statistical Bulletin No. 959a (Washington DC: USDA National Agricultural Statistics Service). Available online at the USDA-NASS web site, accessed July 31, 2008: http://usda.mannlib.cornell.edu/nass/SB959/b9590599.pdf. United States Department of Agriculture, National Agricultural Statistics Service. 2008a. “Farms, Land in Farms, and Livestock Operations, 2007 Summary.” Statistical Bulletin No. Sp Sy 4 (08) a (Washington DC: USDA National Agricultural Statistics Service).

72
Available at the USDA-NASS web site, accessed July 31, 2008: http://usda.mannlib.cornell.edu/usda/current/FarmLandIn/FarmLandIn-02-01-2008_revision.pdf. United States Department of Agriculture, National Agricultural Statistics Service. 2008b. “Meat Animals Production, Disposition, and Income, 2007 Summary.” Statistical Bulletin No. Mt An 1-1 (08) (Washington DC: USDA National Agricultural Statistics Service). Available online at the USDA-NASS web site, accessed July 31, 2008: http://usda.mannlib.cornell.edu/usda/current/MeatAnimPr/MeatAnimPr-04-25-2008.pdf. United States Department of Agriculture, National Agricultural Statistics Service. 2008c. “Livestock Slaughter.” Statistical Bulletin No. Mt An 1-2 (6-08),released June 20, 2008. Available online at the USDA-NASS web site, accessed July 31, 2008: http://usda.mannlib.cornell.edu/usda/nass/LiveSlau//2000s/2008/LiveSlau-06-20-2008.pdf. University of Illinois at Urbana-Champaign (2007, August 22). Team Tracks Antibiotic Resistance From Swine Farms To Groundwater. ScienceDaily. Retrieved July 11, 2008, from http://www.sciencedaily.com /releases/2007/08/070821153926.htm Warner, Melanie. 2005. “An Identity Crisis for Supermarkets.” 2005, October 6. The New York Times.