a user's guide to scintillation
TRANSCRIPT
Journul of Armnsphcric nnd Terresrrral Phyam. Vol. 51, No. 9'10. pp 743 750. 19X9 Printed in Great Bntain.
0021-Y169:XY$3.00+ 00 Pergamon Prrs* plc
A user’s guide to scintillation
A. HEWISH
Mullard Radio Astronomy Observatory, Cavendish Laboratory, Madingley Road, Cambridge, CB3 OHE. U.K.
(Received in .jnul form 30 April 1989)
Abstract-During the past four decades scintillation methods have been used for remote-sensing distant plasmas and for providing high angular resolution in radioastronomy. This brief review illustrates some of the techniques employed and explains the underlying theory in simple physical terms ; it is not intended to be a complete survey of all applications of scintillation.
1. INTRODUCTION
The line of sight to a celestial radio source encounters
the ionosphere, the interplanetary medium, the inter- stellar medium and the intergalactic gas. In all cases except the latter, the ionized plasma in these regions
imposes a phase modulation on incident wavefronts which gives rise to a variety of scintillation phenom-
ena. Fortunately the effects due to the different regions can usually be distinguished, for example by their characteristic timescales or correlation bandwidths, so
that scintillation provides a valuable means of remote- sensing these plasmas. In addition, the fact that scin-
tillation is caused by the interference of waves scat- tered from different portions of the incident wavefront implies that it may also be used to measure the co- herence of the incident wave field, which gives infor-
mation about the angular structure of the radio source.
Over the last four decades scintillation has found
many applications in radioastronomy and the diverse phenomena observed have provided a powerful stimu- lus to theoretical developments. Physically similar
situations occur at optical wavelengths and in acous- tics, especially underwater where close parallels with ionospheric scintillation can be found. In reviewing the applications in radioastronomy, some of which have been central to my own research, I am par-
ticularly conscious of my debt to Henry Booker who maintained a lifelong interest in scintillation. My
interest was aroused by the scintillation of “radio stars” and it was his pioneering work, particularly his famous paper with Ratcliffe and Shinn (1950) which first showed me the potential of scintillation as a quantitative scientific tool.
The aim of this review is to illustrate the wide scope of scintillation methods. Some theory is needed to
appreciate the different phenomena involved. While a
substantial and sometimes daunting literature exists
it is often the case that a few basic concepts are all
that is required to gain a reasonable physical insight into the various phenomena. Following the spirit of
a “user’s guide” the emphasis will therefore be upon practical understanding, rather than theoretical fin- esse and it is convenient to begin by outlining some
important physical ideas.
2. DIFFRACTIVE AND REFRACTIVE SCINTILLATION
2.1. Sinusoidal phase-changing screen
The necessity for diffraction theory should be stressed at the outset. While it might appear simpler to think in terms of refraction, so that an irregular transparent medium is considered as an assembly of
rather crude lenses, this approach can be misleading. To illustrate this point consider the very simple case
of a sinusoidal phase-changing screen, a good under- standing of which illuminates many aspects of scin- tillation theory.
Let a thin transparent screen in the plane z = 0
impose a one-dimensional sinusoidal phase modu- lation of wavenumber K such that an incident plane wave e’“’ (or) produces a field of amplitude A (.u, t) = eCA9”” K’ e l”” at the screen.
For A4 < 1 radian this may be written
A(.\-, t) = (1 + iA sin Kx) e -I”“. (1)
Now two plane waves of unit amplitude travelling at angles of 0 and - 8 to the z-axis produce a resultant
2 sin (kx sin 0) cos (kz cos 0 - wt)
so the wavefront emerging from the screen is equi- valent to the original wave combined with a pair of additional waves of amplitude iA4/2 travelling at angles of 0 = _t sin -’ K/k = K/k for K CC k as shown
743
744 A. HEWISH
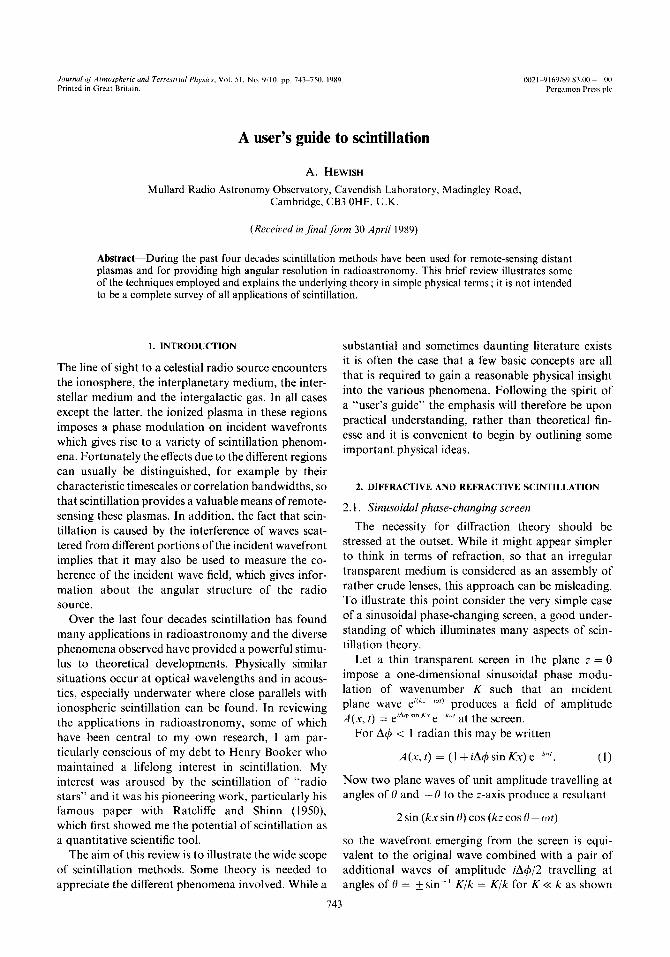
Fig. I. The angular spectrum of plane waves diffracted by a sinusoidal phase-changing screen.
in Fig. I. The added waves correspond to radiation scattered, or diffracted by the screen and the condition A@ < I is called weak scattering. If the radiation came from a point source at infinity an observer beyond the screen would see the source flanked by a pair of weak images displaced by f0 on either side. The Fresnel diffraction pattern across any plane beyond the screen will result from the mutual interference of the three waves and will, in general, exhibit sinusoidal vari- ations of both amplitude and phase with wavenumber K. Note that the phase difference between the scat- tered and unscattered waves varies with distance from the screen as K2z/2k. The component in phase with the unscattered waves has amplitude
AA=Adsin g i >
sin KY
which is a maximum for K*z/2k = nx/2 (when n is odd). The characteristic distance z = nk/K’ is called the Fresnel distance as it denotes the location beyond the screen where the intensity modulation in the Fres- nel diffraction pattern first becomes fully developed. Note that this corresponds to the distance at which the scale of the density irregularities at the screen becomes smaller than the first Fresnel zone.
How does this exact result obtained from a wave theory compare with what might be expected on the basis of an elementary ray theory? An observer view- ing a point source through the screen from a nearby location should see a single image refracted through an angle 0, corresponding to the local phase gradient d4ld.r where
Far behind the screen at distance z >> (K@,)-‘, where
refracted rays reach the observer from many points in the screen, he should see multiple images of the source contained within an angular range set by the extreme value 0, - (K/k)A& Obviously the predictions of elementary refraction are incorrect when the phase variations introduced by the screen are sufficiently small.
Further insight into the failure of the refraction theory can be gained from considering the angular resolving power required to observe an angle of mag- nitude 0,. In order to measure 0, 5 (~/~)A~ it would be necessary to use a telescope having an aperture D > @r/K), which exceeds the transverse scale of the phase modulation. Thus it is meaningless to consider angular shifts due to local phase gradients when A#< 1.
This simple example underlines the necessity for diffraction theory when the phase modulation at the screen is sufficiently small. It is also instructive to examine how diffraction theory converges towards refraction theory when the phase variations become large.
2.3. Strong scattering
For AQt > 1 the approximation used to derive equa- tion (1) is no longer valid and the correct expression becomes
-J A(x,t) =
L J0(A~)$2 x inJ,l(A$)sinnK.u e-““‘.
I! = I 1 (3)
The field beyond the screen now contains many pairs of waves which cross the z-axis at angles of 8, = k @K/k), where the small angle approximation is still assumed. The amplitudes of the component waves are given by the Bessel coefficients J,(A&) which terminate rapidly for n > Ac$.
This exact form of the angular spectrum of scattered
A user’s guide to scintillation
, I
0 200 400 SO0 830 13co
orce (ru)
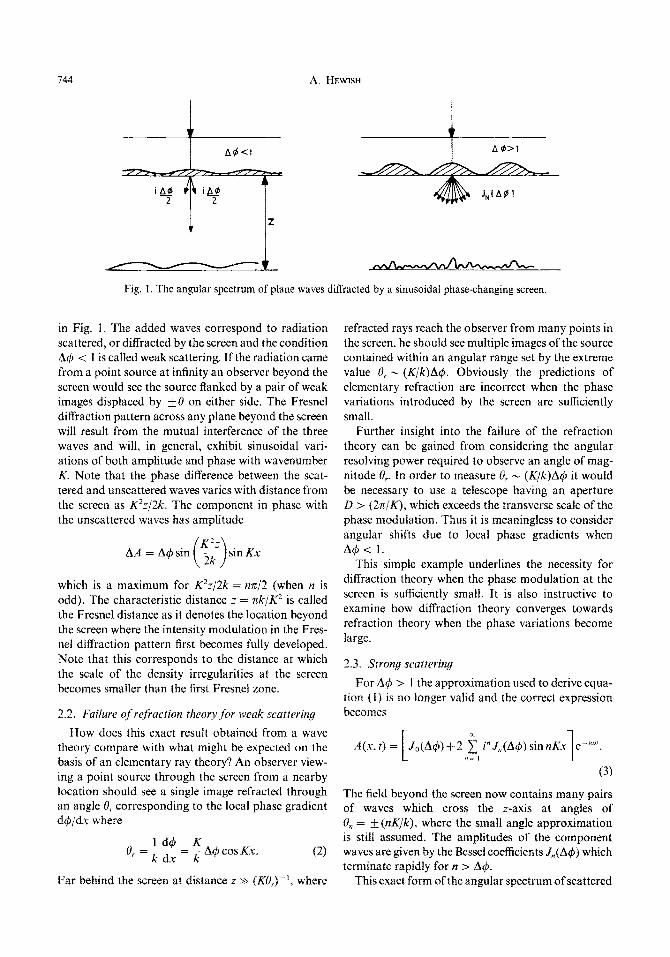
Fig. 2. The amplitudes of the Bessel coefficients J, (800) as a function of order n.
waves must, of course, converge towards that given by refraction when A$J becomes very large. From equation (2) it is evident that parallel rays incident
upon the screen will be refracted locally through an angle Q,, where 0 < 0, Q (K/k)A& and also that the
number of rays per unit angle will peak at the maximum value of 0, when the curvature of the
wavefront at the screen vanishes. A plot of .J,,(A4) against n for Ad = 800 is given in Fig. 2 which shows
that this function does indeed peak sharply at n = 800, corresponding to Q,(max) = k(KA$/k), and then falls to zero. (I am indebted to Graham Woan for this
Figure.) The condition A4 > 1 is called strong scattering
and the form of the angular spectrum in equation (3) shows that the Fresnel diffraction pattern contains intensity variations on physical scales smaller than those in the screen itself. Since the maximum value of
0, is KA4/k the intensity must vary on wavenumbers up to KA$. This may be referred to as the diffractive scale.
Consideration of large-scale refraction indicates rough focusing for O,(max) z - 1/4K corresponding to z - (k/4K2A~). Clearly the physical scale of the intensity variations due to focusing must be about the same as that of the phase modulation in the screen. Focusing becomes progressively less important at greater distances from the screen, whereas the small
scale diffraction pattern is always present.
2.4. The dynumic scintillation spectrum
When the variations of intensity are plotted as a
function of wave frequency and time characteristic
scales appear which can provide useful information, about the random medium. The timescale is usually set by the drift of the scintillation pattern. If B, defines
the maximum scattering angle in the angular spectrum of irregularities producing intensity variations unaffected by the Fresnel filter, the scale of the diffraction pattern is - l/kQ,. The timescale is there-
fore At - I /kO,o, where v is the drift velocity. The bandwidth over which the intensity variations
are correlated depends upon distance from the medium (or equivalent thin screen). At distance z components in the angular spectrum at angle 0, are
delayed relative to components at the centre of the spectrum by a time 6t - z02/c. Hence the maximum bandwidth Av over which the intensity variations are correlated is Av - c/#. The dynamic spectrum there- fore has a characteristic structure as shown in Fig. 3a.
Interesting effects can occur when a medium con- tains irregularities on a wide range of scales so that the diffraction pattern caused by small scale irregu- larities is refracted by the large scale irregularities. If the distance from the medium (or the equivalent thin
146 A. HEWISH
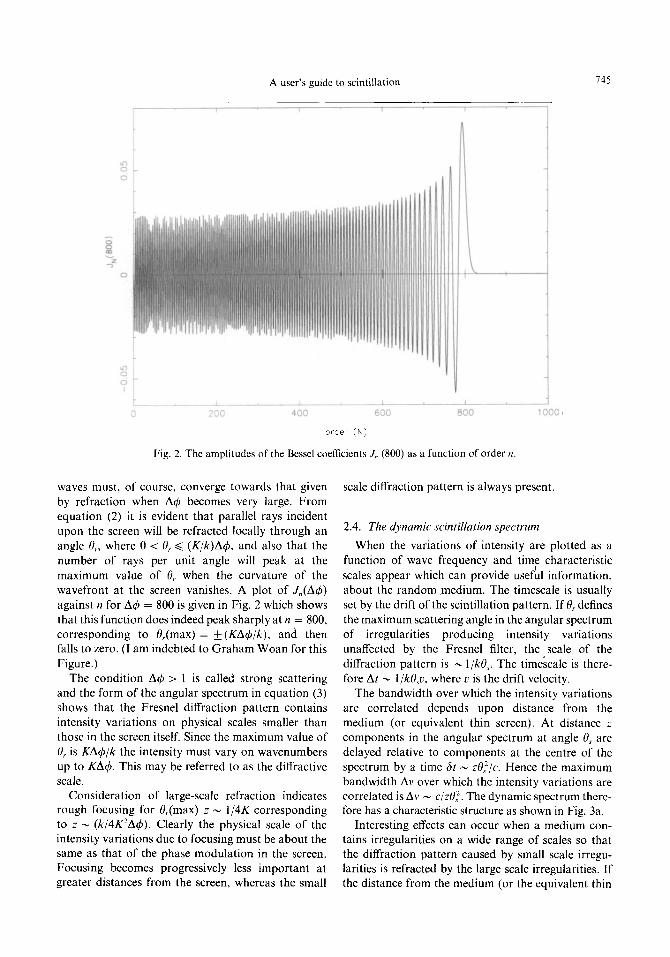
Fig. 3. Schematic dynamic scintillation spectra showing the effect of large-scale phase irregularities.
screen) is within the focal distance of the large features, and if the medium is dispersive, the small scale diffraction pattern is displaced transverse to the line of sight by an amount which varies with the wave frequency Y. For a medium drifting across the line of sight in the same direction as the displacement the dynamic spectrum exhibits a characteristic shear as illustrated in Fig. 3b. For a plasma it is easily shown that the slope of the shear is given by (dv/dr) = (W/Z@,), where u is the drift velocity and 0, the angular refraction (HEWISH, 1980).
At distances just beyond the focal distance, where multiple imaging begins to occur but the number of images is small, a random medium can generate quasi- periodic scintillation. This happens if the large scale refraction 8, involves angles which exceed the scat- tering B,, due to the small scale irregularities. In this case systematic interference fringes due to the multiple images are superposed on the random diffraction pat- tern caused by the small scale irregularities as shown in Fig. 3c. (HEWISH et al., 1985). For a detailed account of multiple-imaging see NARAYAN and GCBODMAN (1989).
3. DESCRIPTION OF IRREGULAR MEDIA
In general we are concerned with media in which the refractive index changes randomly in space. If AN is the variation of density about its mean value the medium may be described by its Fourier transform g(K.Y, KY, KJ where
AN(x. y, z) = JJJ g(K.m i(,,, K:.> ~e’(~~+~‘+~~)dlY,dK~diY,.
In terms of the power spectrum
PVC,, K,, K,) = I.g(K,, Kv> K:)12
we have
(AN2) = JJJ P(K,, Ky, K:) dK,dK,. dK:.
For a medium characterized by variations on a wide range of scales a power law form for the power spectrum is often assumed. Isotropic turbu- lence is described by P(K.*, KY, Kz) cc K -' where K" = Kz + K,? + Kf and c1= 1 l/3 (Kolmogorov spec- trum). The variation of density along a line in the medium (as measured by a spacecraft) is given by
(AN’) = dK, S JJ PCK,, K,,m ICI di(, dK,
x J
f’(K, O,O)K,2 dir;,
x J K.;- ‘dli,
x J K; x3 dK, for Kolmogorov turbulence.
(4)
It is sometimes useful to model a random medium in terms of clouds or “turbules” of different sizes in which case it is necessary to know how the average denisty in a cloud depends upon its physical scale. Over some range of wavenumber K_r to Il,+Akl,,
where AK., cc K,, we have (AN’) cc K:pa GC I\';'!" for Kolmogorov turbulence. Thus for clouds of physical scale 15 x K, ’ the root mean square density AN,, varies as L’13.
As an example of the use of this model consider the angular wandering of a stellar image when viewing a star through a turbulent atmosphere of thickness H. Under conditions of strong scattering each cloud will refract through an angle 68 - Ap cc AN where Ap is the variation of refractive index in the cloud. The number of clouds of scale L along the line of sight is irHL ' so O,,, a i_-i'2 Ahi,,, CC .C”‘. Thus the smaller clouds cause more image wander than the larger clouds for Kolmogorov turbulence but the
A user’s guide to scintillation 141
dependence upon scale is rather weak. At the smallest scales there is, of course, some limit beyond which the total phase variation induced by the atmosphere is less than one radian and only weak scattering occurs.
The exact treatment of scintillation caused by an extended medium containing irregularities on a range of scales is obviously complicated. A useful approxi- mation is that of the “thin screen” in which the total phase variations integrated along z are assumed to occur in a thin layer midway through the medium. For an assessment of the validity of this approximation see BROKER et al. (1986). The integrated phase variations arc given by
cc K’-’ for a power low spectrum. (5)
Under conditions of weak scattering (A&,$ < 1) the Fresnel diffraction pattern may be regarded as the superposition of the patterns due to a set of sinusoidal phase screens corresponding to the Fourier com- ponents which describe the medium. By an extension of the analysis in Section 2 the amplitude scintillation is given by
(f-3
The sin’ term is called “Fresnet filter” and shows that scintillation develops with distance from the medium as for an elementary sinusoidal screen. It expresses the fact that amplitude scintillation on a physical scale L requires that the Fresnel zone radius at the screen exceeds L.
For weak scattering it is evident from equation (6) that there is a close relationship between the scale of the intensity variations in the diffraction pattern and the corresponding scale of the phase variations in the irregular medium. This breaks down for strong scattering when refraction effects become important. In addition to small scale diffraction the focusing action of large scale irregularities must be taken into account. This can give rise to intensity variations on two scales, where the refraction scale increases with distance from the screen due to the longer focal length of the larger irregularities. Recognition of the different phenomena that can occur may not be straight- forward in practice, but scintillation provides many possibilities for the remote-sensing of distant plasmas. Some applications will be considered in the next section. For references to scintillation theory see YEH and LIN (1982).
4. SOME APPLICATIONS OF SCINTILLATION
The discovery of celestial radio sources, and of their scintillation at metre wavelengths, provided for the first time a means of sampling ionospheric plasma irregularities throughout the ionized layers, and not merely those beneath the level of reflection. The measurement of instantaneous phase gradients using simple interferometers showed that the weak scat- tering approximation was usually valid and obser- vations of intensity scintillation at two sites spaced by about 1 km provided information on the magnitude, scale and drift motion of density irregularities (HEW- ISH, 1952). While the action of the Fresnei filter was used to estimate the height of the irregularities its effect in emphasizing the Fresnel scale when scin- tihation is caused by a Kolmogorov spectrum of scales was not fully appreciated. As shown in Section 3, the weak dependence of AN,, on the scale in such a spectrum, and the fact that phase gradients are domi- nated by the smallest scales, implies that the presence of larger irregularities can easily be overlooked. The advent of artificial satellites, particularly geo- stationary ones, provided more convenient sources outside the ionosphere than celestial sources and scin- tillation observations have given a very complete pic- ture of the global distribution and occurrence of iono- spheric irregula~ties (e.g. AARONS, 1982).
4.2. Interplanetary scintiElation
It was known from the early 1950s that radio sources observed within a few degrees from the Sun were apparently broadened by random refraction due to irregularities in the solar corona. Not until 1964 was it realized that some sources of exceptionally small angular size could be observed to scintillate when viewed in any direction from the Earth at VHF fre- quencies (HEWISH et al., 1964). This provided a ground-based method of measu~ng the speed of the solar wind and investigating the small scale structure of density variations in the solar plasma. The typical timescale of 0.5 Hz is significantly faster than iono- spheric scintillation, while the diffraction scale of _ 200 km is considerably larger, so that interplanetary scintillation is not normally confused with ionospheric effects. A fundamental advantage of the scintillation method as compared to spacecraft measurements is that, unlike the latter, it is not confined to the ecliptic plane. When the solar wind speed was measured as a function of heliolatitude it was found that the flow emitted from the Sun’s polar regions was nearly twice as fast as that from the equator. In addition there was a systematic variation through the solar cycle, the

148 A. HEWISH
- 231 8.83
1.00
1.20
0.83
1.00
I.20
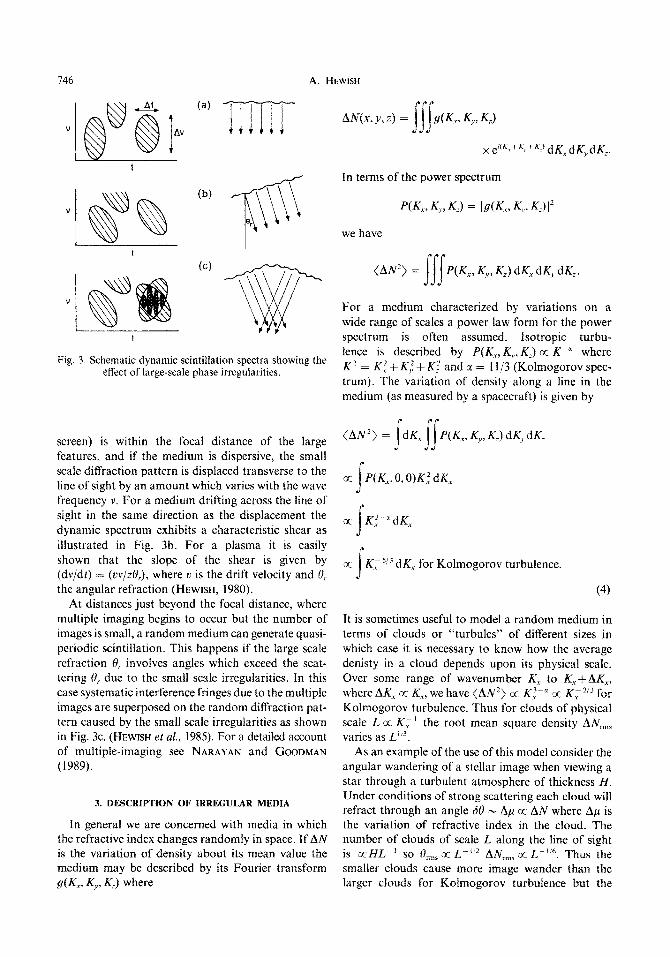
Fig. 4. A map of the whole sky in ecliptic coordinates centred on the Sun (rectangle) showing enhanced interplanetary scintillation caused by a transient of increased density in the solar wind. The disturbance, which occurred on 18-19 September 1980, was a compression zone associated with an eruption of high
speed wind from the coronal hole seen in the He 10830 8, heliogram.
polar cone of high speed wind becoming narrower towards sunspot maximum and vanishing during the reversal of the solar magnetic field. For the most
recent results see KOJIMA and KAKINUMA (1987). Another important application of interplanetary
scintillation is the remote-sensing of transient dis- turbances such as interplanetary shocks and co- rotating solar wind streams. By careful calibration against in situ observations from spacecraft it has been
found that the degree of scintillation varies as N"', where N is the mean plasma density (TAPPIN, 1985). By observing the scintillation on a number of sources
(90&2500 in practice) distributed over the whole sky it is possible to map the structure of large scale dis- turbances of plasma density and to track their motion from day to day. Transients are generally detectable
as they move outwards through distances of 0.5-I .5 AU from the Sun. A typical example is shown in Fig. 4. Computer modelling is necessary to derive the three-dimensional morphology of transients from the observed two-dimensional sky maps of scintillation (TAPPIN et al., 1983).
Systematic daily observations of solar transients using this method were carried out during the solar maximum period 1978-81 and have provided new insights into solar-terrestrial physics. Geomagnetic storms always occurred when widespread zones of high density engulfed the Earth and these transients took
the form of compression regions moving in advance of outbursts of high-speed solar wind. Back-pro- jection of the disturbances to the Sun showed a very
strong correlation with coronal holes. An analysis of 73 events of this type provided little evidence in sup- port of the popular solar flare theory of geomagnetic activity (HEWISH and BRAVO, 1986). Events were seen where “confident” flare-associations made by other workers would have generated transients travelling in
directions far removed from those observed. As it is well known that long-lived high speed streams from stable coronal holes are the causes of geomagnetic
storms which recur at 27 day intervals it is reasonable that unstable holes, which are often located near solar active regions, should produce sporadic outflows gen- erating interplanetary shocks and non-recurrent
storms. Under conditions of weak scattering, which holds
for lines of sight not too near the Sun, the temporal
power spectrum g(o) of the intensity scintillation is simply related to the wavenumber power spectrum through equation (6) putting K,v = w, where v is the solar wind (along x) and the thin screen approxi- mation is assumed. Measurements of the temporal spectrum are in rough agreement with a Kolmogorov spectrum, although the spectrum becomes less steep at large K, where the irregularity scale approaches the proton gyroradius. At scales exceeding a few hundred
A user’s guide to scintillation 749
km the Fresnel filter cuts out intensity variations, but irregularities of larger scale are detectable through the shearing effect described in Section 2. Dual frequency measurements by GAPPER and HEWISH (1981) revealed phase gradients in good agreement with a Kolmogorov spectrum, and dynamic spectra observed by COLE and SLEE (1980) clearly show the effects of refraction by large irregularities. Numerical simulation of the same dynamic spectra by COLES and FILICE (1984) confirm the presence of a Kolmogorov spectrum.
Following the discovery of pulsars in 1967 it was soon recognized that some of the intensity variations which they exhibited could be ascribed to scintillation caused by the ionized component of the interstellar gas. In this case the intensity fluctuates on a timescale of + 10 min and a spatial scale - 10’ km. Only pulsars have a small enough angular size to radiate with sufficient coherence to generate diffractive scintil- lation, and the timescale is determined by the trans- verse motion of the pulsar rather than the slower drift speed of the medium. The use of scintillation to estimate the space velocity has been of particular significance in one instance where the source is in a binary orbit. The binary nature was, ofcourse, evident from the periodic doppler shift of the pulse period which gave the component of orbital velocity in the line of sight. However, the scintillation timescale showed a corresponding periodic variation from which the transverse velocity could be estimated and this led to a unique determination of the inclination of the plane of the binary orbit (LYNE, 1984).
Considerable efforts have been made to deduce the wavenumber spectrum of the density variations of the interstellar medium from scintillation observations. One parameter that has been used is the correlation bandwidth AI, h cj@ discussed in Section 2. If the medium contained clouds of only one scale then 0, cx Y--’ and AV x 1~~~. For a Kolmogorov spectrum, on the other hand, 0, is mainly determined by the maximum value of K for which the phase modulation integrated over higher wavenumbers satisfies the con- dition A# > 1 (see Section 3). This brings in another frequency-dependent factor giving Av cc v 44. Obser- vations of Av support this value (CORDES et al., 1985), but dynamic spectra suggest that the spectrum can be more complex.
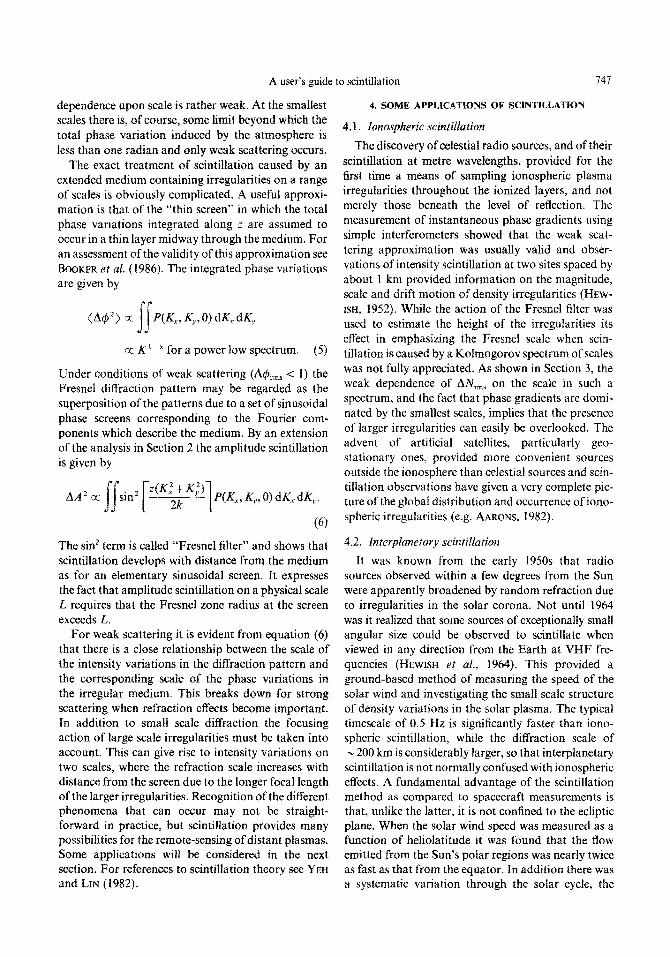
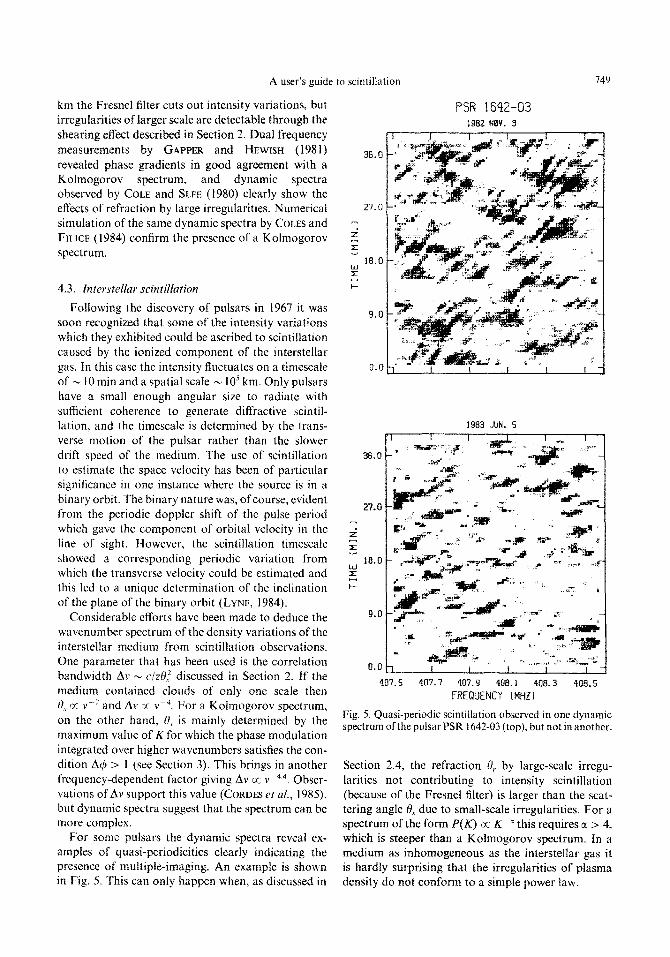
For some pulsars the dynamic spectra reveal ex- amples of quasi-pe~odicities clearly indicating the presence of multiple-imaging. An example is shown in Fig. 5. This can only happen when, as discussed in
PSR 1642-03 1982 NBV. 3
1983 JUN. 5
. .._._..*
407.5 407.7 407.9 408.1 408.3 408.5 FREQUENCY IMHtl
Fig. 5. Quasi-periodic scintillation observed in one dynamic spectrum ofthe pulsar PSR 1642-03 (top), but not in another.
Section 2.4, the refraction 0, by large-scale irregu- larities not contributing to intensity scintillation (because of the Fresnel filter) is larger than the scat- tering angle 0, due to small-scale irregularities. For a spectrum of the form P(K) cc K-” this requires TV > 4, which is steeper than a Kolmogorov spectrum. In a medium as inhomogeneous as the interstellar gas it is hardly surprising that the irregularities of plasma density do not conform to a simple power law.

750 A. HEWISH
The focusing action of large scale irregularities has
been advanced to explain intensity variations of pul-
sars which occur on a timescale of days to years. As
discussed in Section 2.3 focusing will take place when
z - l/4KO,, which implies that at larger distances
focusing requires irregularities of larger scale. Obser- vations do indeed confirm that the timescale of the slow intensity variations increases with the distance
of the pulsar in accordance with this relation (RICKETT
et al., 1984).
due both to the radial variation of plasma density and
the decreased scale of the irregularities, the angular
resolving power can be varied by choosing a suitable line of sight.
4.4 Scintillation and source size
Radiation scattered by an irregular medium must
interfere coherently to generate diffractive scintil-
lation. This means that the incident wavefront must be coherent over a length zO,, at the screen in order to
produce scintillation at distance z. Thus the angular
size of the source must obey the condition 0 (source)
< l/k8,Ys so that radiation from opposite sides of the
source produces scintillation patterns that are dis-
placed by less than the distance over which the inten-
sity variations are correlated. This constraint often provides useful information on the angular size of the
source. For the interplanetary medium observations
at metre wavelengths demand a source size of less than about one arcsecond to produce scintillation.
Since 0, increases for lines of sight closer to the Sun,
This method has been used in major surveys to identify ‘hot-spots’ in radio galaxies caused by ener- getic beams from active galactic nuclei (e.g. READHEAD and HEWISH, 1974). The same method led to the dis-
covery of a highly compact source in the Crab Nebula which later turned out to be a neutron star (HEWISH and OKOYE, 1965). Another interesting source revealed by interplanetary scintillation was the milli-
second pulsar PSR 1937 + 21. The fact that this source showed strong interplanetary scintillation, although
it was in the direction of the galactic plane, provided
the first clue that it must be a pulsar (BACKER et al.,
1982). The angular resolving power for interstellar scin-
tillation is much higher than for interplanetary scin-
tillation and has been used to place an upper limit on the radius at which pulsar emission is generated. The two pulse components of PSR 0525 +21 scintillate
indistinguishably, which demands that their physical separation must be less than about IO3 km (CORDES ef al., 1983). It is astonishing that so small a length
can be resolved for a source at a distance of about 3000 light years and it demonstrates the power of scintillation methods.
REFERENCES
AARONS J BACKER D. C., KULKARNI S. R., HEILES C.,
DAVIS M. M. and Goss W. M. BANKER H. G., RATCLIFFE J. A. and SHINN D. H. BANKER H. G., PASRICHA P. K. and POWERS W. J. COLE T. W. and SLEE 0. B. COLES W. A. and FILICE J. P. CORDES J. M., WEISBERG J. M. and BORIAKOFF V CORDES J. M., WEISBERG J. M. and BORIAKOFF V. GAPPER G. R. and HEWISH A. HEWISH A. HEWISH A. HEWISH A. and BRAVO S. HEWISH A. and OKOYE S. E. HEWISH A, SCOTT P. F. and WILLS D. HEWISH A., WOLSZCZAN A. and GRAHAM D. KOJIMA M. and KAKINUMA T. LYNE A. G. NARAYAN R. and GOODMAN J. READHEAD A. C. S. and HEWISH A. RICKETT J., COLES W. A. and BOURGOIS G. TAPPIN S. J. TAPPIN S. J., HEWISH A. and GAPPEX G. R.
1982 Proc. I.E.E.E. 70, 360. 1982 Nafure 300,615.
1950 Phil. Trans. Roy. Sot. A262, 579. 1986 J. atmos. terr. Phys. 48, 327. 1980 Nature 285,93. 1984 Nature 312,25 1. 1983 Astrophys. J. 268,370. 1985 Astrophys. J. 288,22 I. 1981 Mon. Not. R. astr. Sot. 197,209. 1951 Proc. R. Sot. A209.81. 1952 Proc. R. Sot. A214; 494. 1986 Solar Phys. 106, 185. 1965 Nature 207, 59. 1964 Nature 203, 1214. 1985 Mon. Not. R. astr. Sot. 213, 161. 1987 J. geophys. Res. 92, 7269. 1984 Nature 310, 300. 1989 Mon. Not. R. astr. Sot. 238,963. 1974 Mem. R. aslr. Sot. 78, 1, 1984 Astron. Astrophys. 134, 390. 1985 Planet. Space Sci. 34,93. 1983 Planet. Space Sri. 31, 1171.