a two-tier partition algorithm for the optimization of the
TRANSCRIPT
symmetryS S
Article
A Two-Tier Partition Algorithm for the Optimizationof the Large-Scale Simulation of InformationDiffusion in Social Networks
Bin Chen 1 , Hailiang Chen 1,*, Dandan Ning 1, Mengna Zhu 1, Chuan Ai 1, Xiaogang Qiu 1 andWeihui Dai 2
1 College of Systems Engineering, National University of Defense Technology, Changsha 410073, China;[email protected] (B.C.); [email protected] (D.N.); [email protected] (M.Z.);[email protected] (C.A.); [email protected] (X.Q.)
2 Department of Information Management and Information Systems, School of Management,Fudan University, Shanghai 200433, China; [email protected]
* Correspondence: [email protected]; Tel.: +86-18681203974
Received: 26 April 2020; Accepted: 14 May 2020; Published: 21 May 2020�����������������
Abstract: As online social networks play a more and more important role in public opinion,the large-scale simulation of social networks has been focused on by many scientists from sociology,communication, informatics, and so on. It is a good way to study real information diffusion in asymmetrical simulation world by agent-based modeling and simulation (ABMS), which is consideredan effective solution by scholars from computational sociology. However, on the one hand, classicalABMS tools such as NetLogo cannot support the simulation of more than thousands of agents. On theother hand, big data platforms such as Hadoop and Spark used to study big datasets do not provideoptimization for the simulation of large-scale social networks. A two-tier partition algorithm forthe optimization of large-scale simulation of social networks is proposed in this paper. First, thesimulation kernel of ABMS for information diffusion is implemented based on the Spark platform.Both the data structure and the scheduling mechanism are implemented by Resilient DistributedData (RDD) to simulate the millions of agents. Second, a two-tier partition algorithm is implementedby community detection and graph cut. Community detection is used to find the partition of highinteractions in the social network. A graph cut is used to achieve the goal of load balance. Finally,with the support of the dataset recorded from Twitter, a series of experiments are used to testify theperformance of the two-tier partition algorithm in both the communication cost and load balance.
Keywords: social network simulation; ABMS; Spark; two-tier partition algorithm
1. Introduction
With the development of Internet technology, Facebook, Twitter, WeChat, Weibo, and other socialnetwork applications have developed rapidly. As of 31 December 2018, Facebook had 2.32 billionmonthly active users, with an average of 1.52 billion daily active users in December 2018. According tothe annual data report of WeChat in 2018 [1], up to September of this year, there were 1.0825 billionactive online users every month, and the daily information delivery volume of WeChat reached45 billion times. The rapid development of all kinds of social media makes the use of the Internet hashad a profound change, from the simple information search and browsing to the establishment andmaintenance of online social relations, information creation, communication, and sharing based onsocial relationships. Social networks have penetrated every aspect of our life [2]. The role of socialrelationships in information diffusion, guidance for individuals, media influence, and promotingattitude or behavior change are influenced by social networks [3]. Research on social networks can be
Symmetry 2020, 12, 843; doi:10.3390/sym12050843 www.mdpi.com/journal/symmetry
Symmetry 2020, 12, 843 2 of 23
summarized into three types: the structural characteristics and evolution mechanism of social networks,the formation and interaction of group behaviors in social networks, and the law and evolution ofinformation diffusion in social networks [4]. However, the coverage of current mainstream mediais widespread, and corresponding social network nodes are massive, complex in structure, and thecalculation of whether nodes transmit information is complicated. Relevant theories in the fields ofpsychology, communication, and complex networks are difficult to be directly applied in quantitativeresearches. As a result, agent-based modeling and simulation (ABMS) [5] is one of the most popularmethods to solve these problems in a symmetry simulation world. In ABMS, every node in the socialnetwork is mapped into an agent. As all the agents follow human behavioral mode, a social networkevolves during the running of the simulation. Under certain conditions, a specific emergence mayoccur, reflecting the evolution of real society. In this symmetrical way, real-world data can be used torevise the information diffusion in the symmetrical simulation world, and at the same time, throughthe study of information diffusion in the symmetrical simulation world, we can intervene in real-worldinformation diffusion.
The applications of ABMS tools, such as NetLogo, Repast, and Swarm, are very popular inthe fields of sociology, communication, and psychology [6–9]. However, these simulation tools aredesigned with more consideration of generalization, and the flexibility and scalability are limited;in particular, the performance is not acceptable in large-scale simulation. Although Repast has anHPC(High Performance Computing) version, which is for high performance computing, it is notoptimized for social network simulation. Repast HPC is suitable for modeling general agent-basedcomplex systems, but complex networks themselves have characteristics that are different from generalcomplex systems, such as small-world characteristics, scale-free characteristics, etc. At the same time,the propagation calculations in complex networks have special fast calculation requirements relatedto networks such as node degrees, clustering coefficients, and community structure. Therefore, as ageneric ABMS tool, Repast HPC does not directly support the fast calculation of these characteristics ofcomplex networks. Although Repast HPC is well known in the implementation of large scale ABMS, ithadn’t been proven to perform well in the simulation of large-scale complex network propagation.Thus, large-scale social network simulation is a problem worth studying.
Large-scale social network simulation is used to study information diffusion and topology changesin the network through the modeling and simulation of large-scale social networks. The amount ofdata involved is huge, and various difficulties are faced in the actual studies.
• Difficulties in the storage, management, and analysis of big data. For large-scale social networks,such as WeChat and Weibo, the scale of data is very large—usually hundreds of millions oreven billions. It is difficult to manage such unstructured data based on traditional file storage orrelational databases. When the network scale is too large, the time consumption of connectivity isnot acceptable in the traditional relational database, let alone in the analysis and calculation ofnetwork indexes such as node degree, cascades, and so on.
• Difficulties with the implementation of the simulation of large-scale social networks.Existing high-performance simulation engines, including MPI-based(Message Passing Interface)simulation tools, GPU-based(Graphic Processing Unit) simulation engines [10], and so on, cannotobtain high performance in the simulation of large-scale social networks because of the strongcorrelations in the network. Too many interactions among nodes decrease the performance greatly,especially when the nodes are distributed in different machines.
With the advent of the era of big data [11], many big data platforms such as Hadoop and Sparkhave been spawned. With the support of these technologies, it is easy to analyze big data by theefficient management and application of clusters, cloud environments, etc. [12,13]. These platformscan also support the simulation of the social networks obtained from big data. This paper proposes amethod to implement a large-scale social network simulation based on Spark, and the optimizationbased on the network structure is also given to improve the performance of the simulation. The rest of

Symmetry 2020, 12, 843 3 of 23
this paper is organized as follows. Section 2 gives the current research on large-scale social networksimulation; Section 3 introduces how to build the large-scale social network simulation using the Sparkplatform; Section 4 presents the optimization of the social network simulation based on the networkstructure; the effectiveness of the optimization method is testified by the experiments in Section 5;the conclusion and areas for future work are given in Section 6.
2. Related Works
There are many studies on agent modeling based on existing tools, such as NetLogo, Swarm,MASON, and Repast [14,15]. NetLogo, with its heritage as an educational tool, stands out for its ease ofuse and excellent documentation. However, the performance of large models is hard to bear. Usually,only hundreds of agents are supported. For example, Anuj and Caroline et al. proposed an agent-basedmodel to predict the performance of different residential distributed solar models with respect to thestakeholders’ objectives [16]. Swarm is relatively small and well-organized while providing a fairlycomplete set of tools. However, it cannot support a large-scale simulation either. It is fast for simplemodels but slow for complex ones. MASON could be a good choice for experienced programmersworking on computationally intensive models. However, it is nonstandard and sometimes confusingterminology is given. Repast is certainly the most complete Java platform, but it is not suitable forlarge-scale simulation [9]. The scale of agents developed in Repast is usually less than 1 millionbecause of performance. For example, in reference [17], Griffin and Stanish developed an agent-basedmodel using the Repast agent-based modeling toolkit. They took 500,000 agents for this model in total.In reference [18], Mock and Testa developed an agent-based model of predator–prey relationshipsbetween transient killer whales and threatened marine mammal species in Alaska based on Repast forabout 200,000 agents. Existing agent-based modeling tools cannot support the large-scale simulationof information diffusion well.
Based on Hadoop, Kangsun Lee et al. designed ARLS (After-action Reviewer for Large-scaleSimulations), a tool for analyzing simulation results, and used MapReduce to batch process simulationlog files to accelerate the analysis of the simulation results [19]. Reference [20] proposed an agent-basedmodeling method based on Hadoop; the MapReduce programming model was used to implement thesimulation kernel. Hadoop automatically realized the underlying load balance and fault tolerance.Compared with the traditional simulation tools, this framework greatly improves the performanceand scalability of the simulation. References [21,22] applied Hadoop in the simulation of moleculardynamics and power systems. He Liang et al. proposed a large-scale Online Social Network (OSN)worm simulation based on MapReduce. The OSN worm propagation process was divided into differentstages and MapReduce was used to construct the corresponding map and reduce algorithms [23].However, because the programming model of Hadoop is relatively simple, and the hard disk needs tobe read and written frequently during the operations, the above large-scale simulation research basedon Hadoop still has many limitations in performance.
With the improvement of the Spark ecosystem, Spark has gradually become the most popular bigdata framework. Chuan Ai et al. [24] implemented the propagation simulation of large-scale socialnetworks based on Spark’s graph computing library GraphX and the Pregel algorithm. The performanceof the simulation kernel was increased greatly GraphX is Apache Spark’s API (Application ProgrammingInterface) for graphs and graph-parallel computation, with a built-in library of common algorithms.The networks are organized and managed in the form of nodes and edges. Pregel is a bulk synchronousparallel computing model (BSP model). The simulation of propagation is abstracted as a seriesof supersteps. Nodes in each superstep pass messages to each other and the nodes update the stateaccording to the messages received previously and their state update mechanism. The large-scalesocial network simulation method based on Pregel is simple and fast. However, because Pregel istightly packaged, users can analyze the simulation process and results only after the simulation iscompleted, and state transformations cannot visually be observed during the simulation. As a result,
Symmetry 2020, 12, 843 4 of 23
the difficulties faced by actual large-scale social network simulations lie in the whole process from datamanagement to the analysis of the simulation results.
Based on the problems discussed above, this paper proposes a large-scale social network simulationframework based on Spark. The built-in components in the Spark ecosystem are used to support datamanagement, data analysis, and simulation experiments in a large-scale social network simulation.
3. The Spark-Based Large-Scale Simulation of Information Siffusion in Social Networks
3.1. The Infrastructure of Simulation
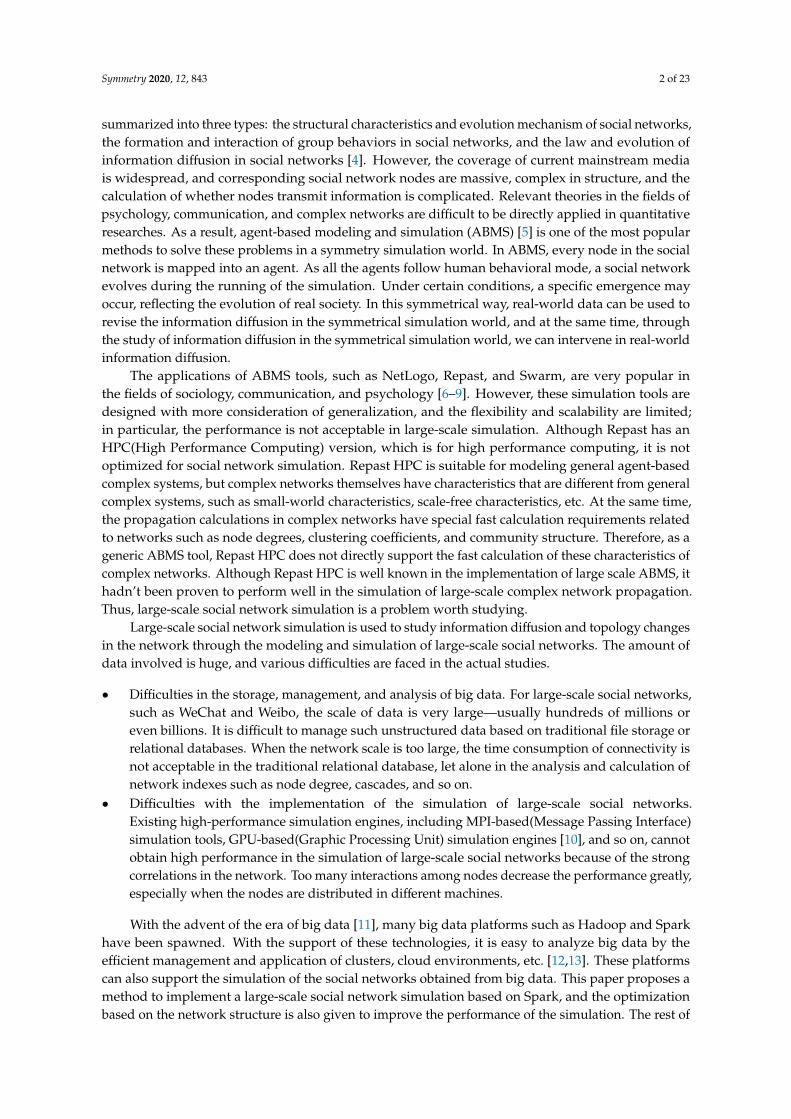
The infrastructure of the Spark-based large-scale simulation of information diffusion in socialnetworks designed in this paper is shown in Figure 1. The simulation framework is composedof three layers. From the bottom up, they are the hibernate layer, the scheduling layer, and theexecution layer. The hibernate layer is used for the big data storage of large-scale social networks inHDFS (Hadoop Distributed File System). The scheduling layer is responsible for job scheduling anddistribution, distributing large-scale social network simulation and analysis jobs to different nodes inthe cluster. The execution layer is the top layer, which is composed of a data analysis module and asimulation kernel. The simulation kernel is the core part of the large-scale social network simulationframework based on Spark. Based on the data interaction characteristics and the characteristics oflarge-scale social networks, the optimization of the simulation kernel is proposed to further acceleratethe execution of a large-scale social network simulation.
Figure 1. The infrastructure of a Spark-based large-scale simulation of information diffusion in asocial network.
The large-scale social network simulation based on Spark is the core module that supportsthe execution of the agent-based simulation on distributed clusters. The agent model and theimplementation of the simulation kernel on Spark are illustrated below.
3.2. The Agent Model
This paper uses ABMS to model information diffusion in large-scale social networks. Each agentrepresents a node in the social network. In a large-scale social network diffusion simulation, informationis transmitted between nodes in the network according to a certain mechanism. In this paper, the SIR(Susceptible Infected Recovered) model is used for the large-scale social network diffusion simulation.First, the definition of the agent model is given as follows:
<ID, ASN, S, I, R, M>. (1)

Symmetry 2020, 12, 843 5 of 23
ID represents the unique identifier of the agent; ASN represents the set of out-degree neighbors,that is, the set of agents to whom the current agent will send messages. S, I, and R are the states ofthe agents. S means susceptible—it represents the agent who has not received the message or hasreceived the message but the message is not enough to attract his attention; I means infected—itrepresents the agent who has received the message and would like to forward this message to hisneighboring agents; R means recovered, which is always after S and never transforms to other statesagain—it represents the agent who does not care about the message and will never send this messageto his neighboring agents. M is the message transmitted by the agent.
The behavior of the agent follows the mechanism of the SIR model. The SIR model is essentiallythe process by which an infected node infects its neighboring susceptible nodes and the self-immune.As for information diffusion in large-scale social networks, the switching of the model states is shownin Figure 2. The left side of the figure shows a simple case of a four-agent network. A1, A2, A3, and A4stand for the agent ID. The letters in the circle represent the agent state. The states of A1 and A2 are I,which means that they have received the message and will forward the message. The A3 status is S,indicating that if he receives the message, he may turn to I. A4 is R, which means that he is immuneto this message and does not care or will not forward it. Because A3 is a neighbor of A1, when A1forwards the message, A3 will receive the message and transform to the I state according to a certainprobability. Meanwhile, A1 will also automatically transform to the R state according to a specificprobability. The state switching process is shown on the right side of Figure 2.
Figure 2. The state switch of the SIR model.
3.3. The Implementation of a Simulation Kernel in Spark
A simulation kernel is composed of the calculation of agents and the scheduling algorithm. As thesimulation kernel is implemented in Spark, it is necessary to partition the social network reasonably anddesign the scheduling algorithm based on the Spark programming model. As a result, the Spark datastructure, Resilient Distributed Data (RDD), is used to organize the large-scale social network, and theSpark programming model is also used to build the processing flow of the simulation kernel. Actually,the functions of the simulation kernel are implemented by a series of operations and transformationson the social network model stored in RDD in the cluster. Each computing node in the cluster performslocal computing on a part of the network stored in the node and then aggregates to achieve parallelcomputation. Therefore, the design of a large-scale social network simulation kernel based on Spark canbe divided into two parts: the design of the data structure and the design of the scheduling algorithm.
3.3.1. The Design of Data Structure
Data in Spark is stored, transformed, and calculated in the form of RDD. The broadcast variablesand accumulators to process global data are also designed to optimize the simulation performance.Therefore, in the design of the data structure of the simulation kernel, it is necessary to consider thedesign of the RDD involved in the simulation process firstly, then broadcast variables and accumulatorsare considered too.
RDD is divided into two types: <Key> and <Key, Value>, which are used to organize different typesof data. In a large-scale social network simulation, the data includes nodes and edges in the network,messages generated during the simulation, and temporary variables involved in the calculation process

Symmetry 2020, 12, 843 6 of 23
of the model. The main data structures of the simulation kernel and their descriptions are shown inTable 1.
Table 1. The sesign of the data structure.
Name Stored Information Data Type Description
AgentStateRDD Agent state <Key,Value>RDD Record the state change of agent
AgentLinkListRDD Neighboring Agents of Agent <Key,Value>RDD Record the neighboring agents list of agent
MsgRDD Message <Key,Value>RDD Record the messages list received by agent
InfectedAgentBroadcast Infected Agent Broadcast Record infected agents
InfectedAgentRDD Infected Agent <Key,Value>RDD Record infected agents
The descriptions of the data structures are detailed below.(1) AgentStateRDDAgentStateRDD records the state information of Agents. The RDD is in the form of <Key, Value>.
Key is the agent number, and value is the state of the agent. As mentioned in Section 3.2, the agentstate includes three types—S, I, and R—in the SIR model.
(2) AgentLinkListRDDAgentLinkListRDD records the list of neighboring agents. The key of AgentLinkListRDD is the
agent number, and value is the list of neighboring agents. In the existing large-scale social networkresearch, the links in the network are mostly stored in the form of edges. However, the storage of edgeshas certain problems. In large-scale social networks, agents have many connected edges, and each nodecorresponds to many neighboring agents. For example, young users of WeChat have an average of128 friends. The edges corresponding to each user have an average of 128 pieces of data, and the startnumber will be recorded 128 times. In Sina Weibo, some verified influencers may have tens of millionsof fans. Managing edge information in this form will inevitably bring data redundancy. In addition, inthe simulation agents will send information to neighboring agents as needed, which requires frequentiterative access to the agent edge information.
Based on the above problems, the links between agents are stored in the form of the neighboringagents list of the agent, AgentLinkListRDD. All neighboring agents can be easily obtained by the startnumber in AgentLinkListRDD, which can greatly improve the efficiency of the simulation operation.
(3) MsgRDDMsgRDD records all messages generated during the simulation. Each message represents an
infection event between two agents. In the event, the target agent is the agent that receives the message,and the message needs to be passed to the target agent to update the state of the target agent. Therefore,set the key as the target agent number, and the content of the message and other information arerecorded in the value.
(4) InfectedAgentBroadcast and InfectedAgentRDDBoth InfectedAgentBroadcast and InfectedAgentRDD are the data structures used to record infected
agents during the simulation. In the SIR model, each infected agent sends messages to its neighboringagents to infect them. This operation needs to link the infected agent and AgentLinkListRDD.The linking is really time-consuming when the scale of information diffusion is large. At first, theInfectedAgentRDD is designed in the form of <Key, Value>, where key is the agent number. In Spark,the InfectedAgentRDD and the AgentLinkListRDD are connected through the same key to obtainMsgRDD. However, it was actually found that in the Spark programming model, the join operationneeded to cache a large amount of data and the operation efficiency was low. Furthermore, it wasfound that in the initial stage of information diffusion on social networks, the number of infectedagents was small. Performing a join operation, in this case, led to unnecessary computation, so thetwo data structures, InfectedAgentBroadcast and InfectedAgentRDD, were designed to manage theinfected Agents together. When a large number of agents were infected, InfectedAgentRDD was usedto connect with AgentLinkListRDD, and when the number of agents was not large, the broadcast
Symmetry 2020, 12, 843 7 of 23
variable InfectedAgentBroadcast was set in each computing node. Thus, the communications werereduced greatly during the simulation.
3.3.2. Scheduling Mechanism
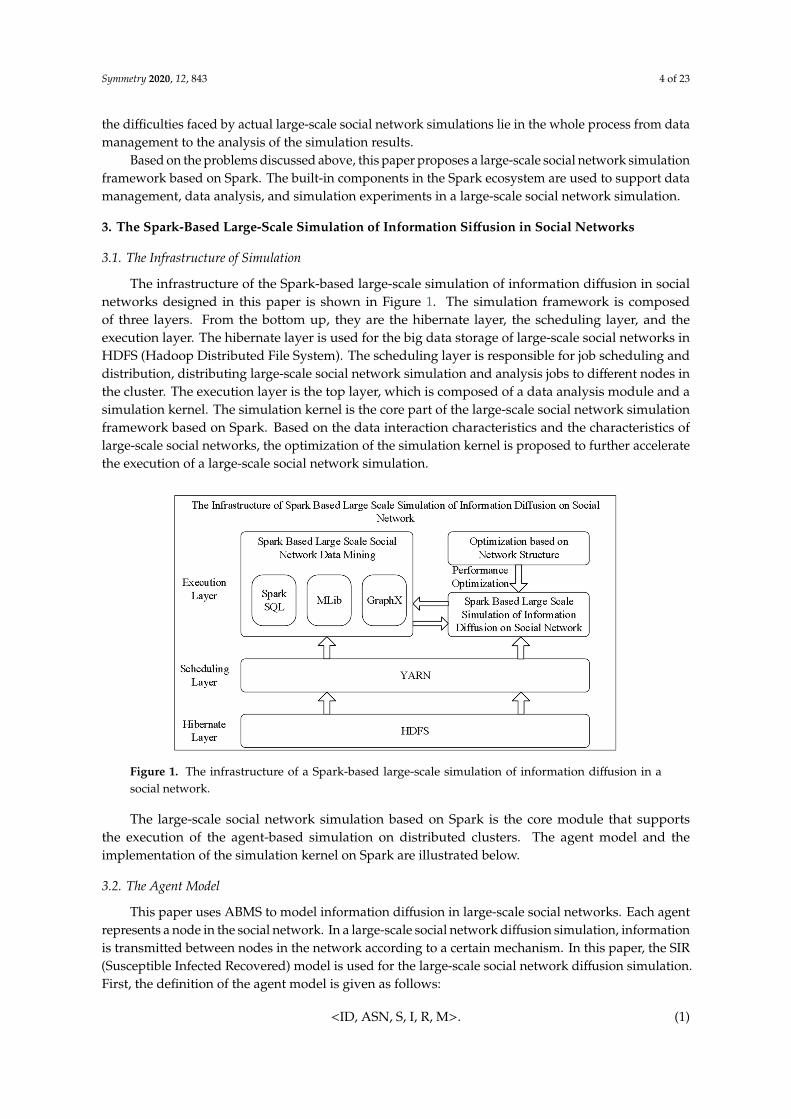
The design of the data structure basically includes the management of data and variables involvedin the simulation process. However, for a large-scale social network simulation based on Spark,the scheduling mechanism needs to be converted into the operations of RDD. In the diffusion ofinformation in large-scale social networks, messages are sent and received very frequently. The topologyof large-scale social networks is also changing rapidly. Therefore, it is more efficient to use a timestep-based method to schedule the simulation, and the changes of the network are observed within acertain time interval. The workflow of scheduling is shown in Figure 3. Because data is organized andmanaged in the form of RDD in Spark, an RDD operation task is allocated to computing nodes first,and the next operation is performed when the tasks on all computing nodes are completed. This modeimplements the time synchronization of the agents in the simulation. On this basis, the large-scale socialnetwork simulation process can be divided according to time steps. In a simulation step, information isdiffused based on the message passing and state updating of agents, which are actually the generationsof MsgRDD and the update operations of AgentStateRDD.
Figure 3. Simulation flow chart.
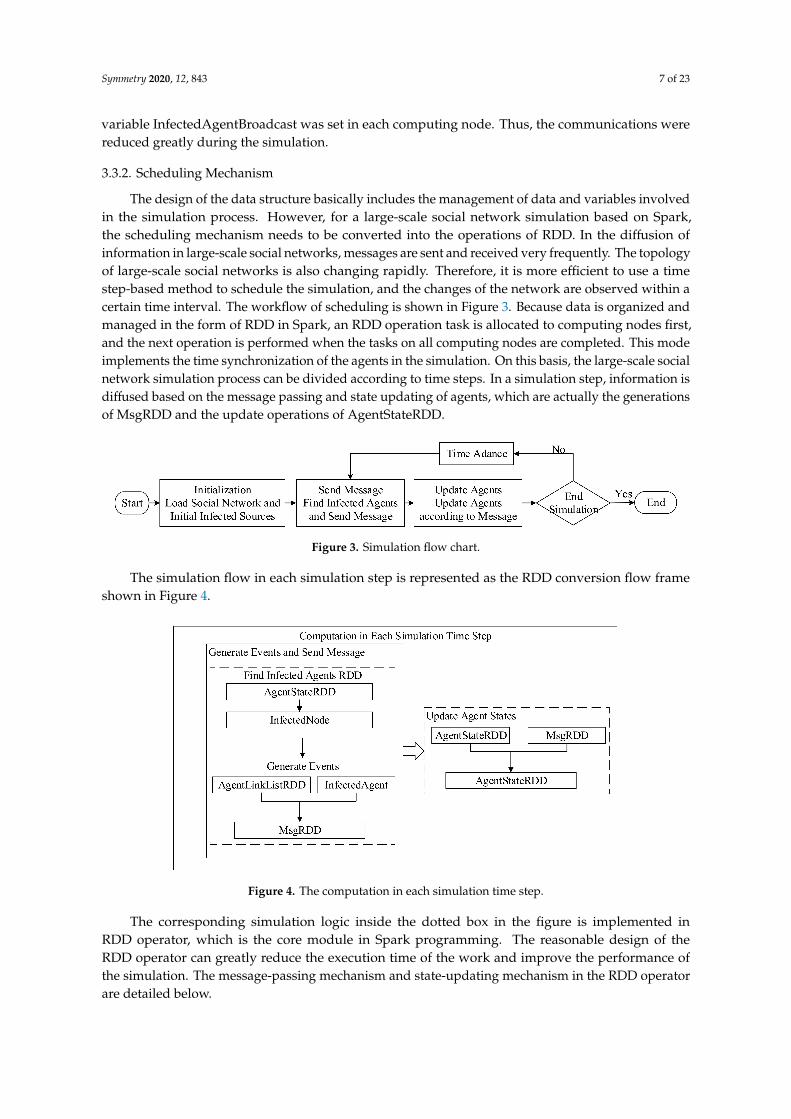
The simulation flow in each simulation step is represented as the RDD conversion flow frameshown in Figure 4.
Figure 4. The computation in each simulation time step.
The corresponding simulation logic inside the dotted box in the figure is implemented inRDD operator, which is the core module in Spark programming. The reasonable design of theRDD operator can greatly reduce the execution time of the work and improve the performance ofthe simulation. The message-passing mechanism and state-updating mechanism in the RDD operatorare detailed below.
Symmetry 2020, 12, 843 8 of 23
The Design of the Message Passing Mechanism
Within each simulation step, each infected agent sends a message to its neighboring agent with acertain rate according to the parameter settings. This message-passing mechanism is implemented bythe two RDDs: AgentStateRDD and AgentLinkListRDD. In addition, MsgRDD is generated by thesetwo RDDs.
First, the filter operator is used to find the infected agents from AgentStateRDD according tothe node state, then the infected agent is obtained. Then, the usage of the broadcast solution isdetermined by the number of nodes in the infected agent mentioned in Section 3.3.1. If necessary,broadcast the InfectedAgentBroadcast to each computing node. Next, each computing node obtainsthe local InfectedAgentBroadcast list and processes the AgentLinkListRDD through the filter operatoraccording to the list and filters out all possible message source agents and their neighboring agents.If the broadcast is not required, connect InfectedAgentRDD and AgentLinkListRDD to obtain thepossible message source agents and their neighboring agents. Then, according to the model parametersinitially set, select the target agents and then generate MsgRDD through the FlatMap operation in Spark.Finally, the join operator is used to connect MsgRDD with AgentStateRDD, which means that the agenthas received the messages. Then, merge the current state of all agents with the received messages;the messages are processed and the states of the agents are updated accordingly.
The Design of the State Update Mechanism
It can be seen from Figure 4 that the state switching in the agent model is to update the nextstate based on the current state with the received messages. The join operator in Spark is used toconnect MsgRDD with AgentStateRDD, which means that the agents receive messages. Because theentire RDD is processed at the same time in Spark, the updating of the agent state is not operatedduring the message-receiving stage. Then, the ReduceByKey operator is used to aggregate all themessages received by a single agent and process messages according to the different agent state storedin AgentStateRDD. Agents with state I and R drop the messages. Agents with state I determine whetherit is necessary to update the node state to R themselves. Agents with state S process the messages(infection events) and set the latest state according to the model parameters. Finally, all agents returnthe latest updated state to RDD. During the state update stage of the model, Spark’s join operator isused to connect MsgRDD to AgentStateRDD for calculation. The join operator is a time-consumingoperator because it involves matching the key values between different RDDs. The key values arematched one by one and then calculated. During the matching process, the partition of the RDDs alsohas a great impact on the calculation time.
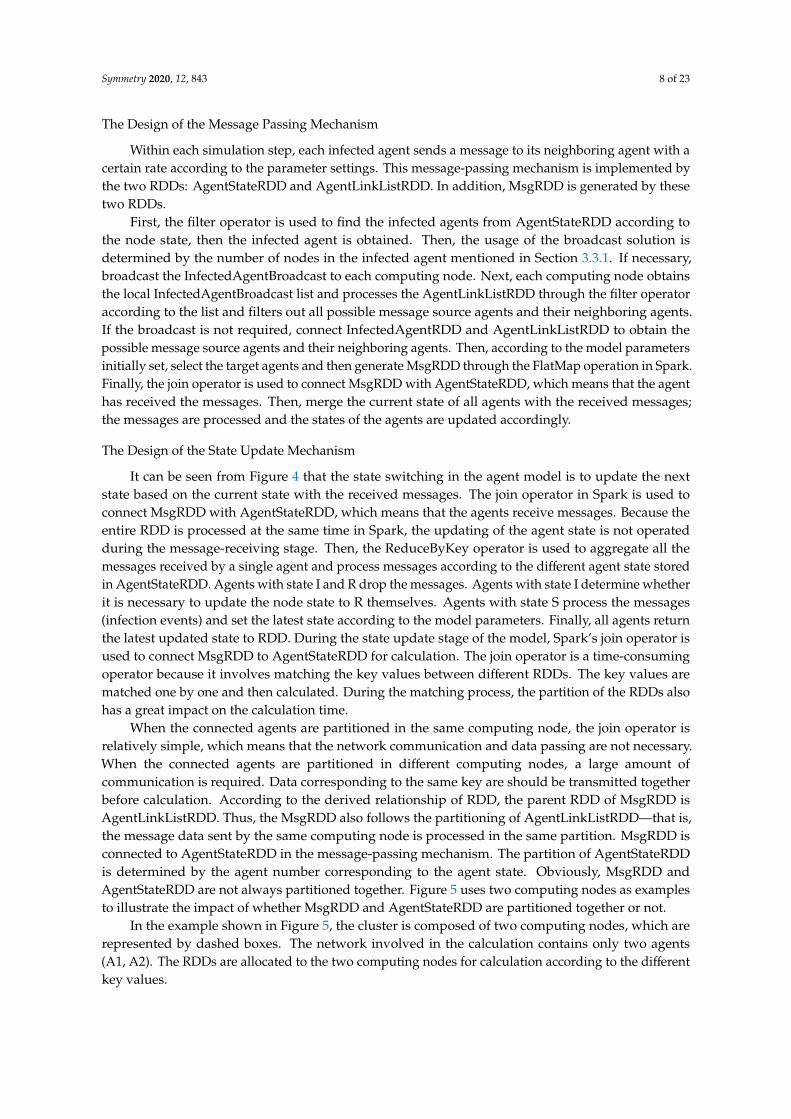
When the connected agents are partitioned in the same computing node, the join operator isrelatively simple, which means that the network communication and data passing are not necessary.When the connected agents are partitioned in different computing nodes, a large amount ofcommunication is required. Data corresponding to the same key are should be transmitted togetherbefore calculation. According to the derived relationship of RDD, the parent RDD of MsgRDD isAgentLinkListRDD. Thus, the MsgRDD also follows the partitioning of AgentLinkListRDD—that is,the message data sent by the same computing node is processed in the same partition. MsgRDD isconnected to AgentStateRDD in the message-passing mechanism. The partition of AgentStateRDDis determined by the agent number corresponding to the agent state. Obviously, MsgRDD andAgentStateRDD are not always partitioned together. Figure 5 uses two computing nodes as examplesto illustrate the impact of whether MsgRDD and AgentStateRDD are partitioned together or not.
In the example shown in Figure 5, the cluster is composed of two computing nodes, which arerepresented by dashed boxes. The network involved in the calculation contains only two agents(A1, A2). The RDDs are allocated to the two computing nodes for calculation according to the differentkey values.
Symmetry 2020, 12, 843 9 of 23
Figure 5. The sifferences in communication cost caused by the different partitions of MsgRDDand AgentStateRDD.
MsgRDD should be connected to AgentStateRDD in order to update AgentStateRDD. In thesetwo cases, AgentStateRDD follows the partition of AgentLinkListRDD. Case 1 on the left indicatesthat MsgRDD follows the partition of AgentStateRDD according to the message sender. For example,MsgRDD (A1 > A2) is located in the same computing node with AgentStateRDD (A1). Case 2 on theright indicates that MsgRDD is re-partitioned according to the message receiver. For example, by beingre-partitioned, MsgRDD(A1- > A2) is located in the same computing node as AgentStateRDD (A2).MsgRDD (A1- > A2) and AgentStateRDD (A2) can be combined together to update the AgentStateRDDof A2. In case 1, MsgRDD (A1- > A2) needs to combine with AgentStateRDD (A2) by communication,while this is not needed in case 2. Thus, when the states of the agents are updated, the datacommunications (indicated by bold arrows in the figure) for the two cases are quite different.
In case 1, since the message received by A1 is distributed to two computing nodes respectively,in addition to the local calculation, the message received by A1 on computing node 2 needs to be passedto computing node 1 to perform the calculation. Similarly, the message received by A2 on computingnode 1 needs to be passed to computing node 2. When the number of agents and computing nodes arenot large, the data communications are acceptable. However, when the size of the network reaches 1billion and the number of computing nodes is hundreds, a large number of communications amongdifferent computing nodes in the cluster are needed and it becomes time-consuming. In case 2, becausethe state and the received messages of the same agent can be assigned to the same computing node,no other data passing is required at this step. Thus, compared to case 1, the performance of thesimulation is improved. As a result, MsgRDD is re-partitioned before connecting MsgRDD andAgentStateRDD in the state update mechanism of agents in order to improve the performance ofthe simulation.
As mentioned before, the partition is a key factor in the performance of the large-scale socialnetwork simulation. The performance differs greatly in the different partitions. As a result, the two-tieroptimization based on the network structure is described in detail in the next section.
4. Optimization
Compared with the large data analysis, the large number of interactions between agents willinevitably bring huge communication consumption between computing nodes in a large-scale socialnetwork simulation. Spark is a memory-based distributed computing framework, and the performanceof Spark is closely related to the usage efficiency of the distributed clusters. The cost of networkcommunication and the load balance of computing nodes are the two key points in the performance of
Symmetry 2020, 12, 843 10 of 23
the simulation. Minimizing communication consumption while ensuring load balance can greatlyimprove the performance.
4.1. Figures, Tables, and Schemes
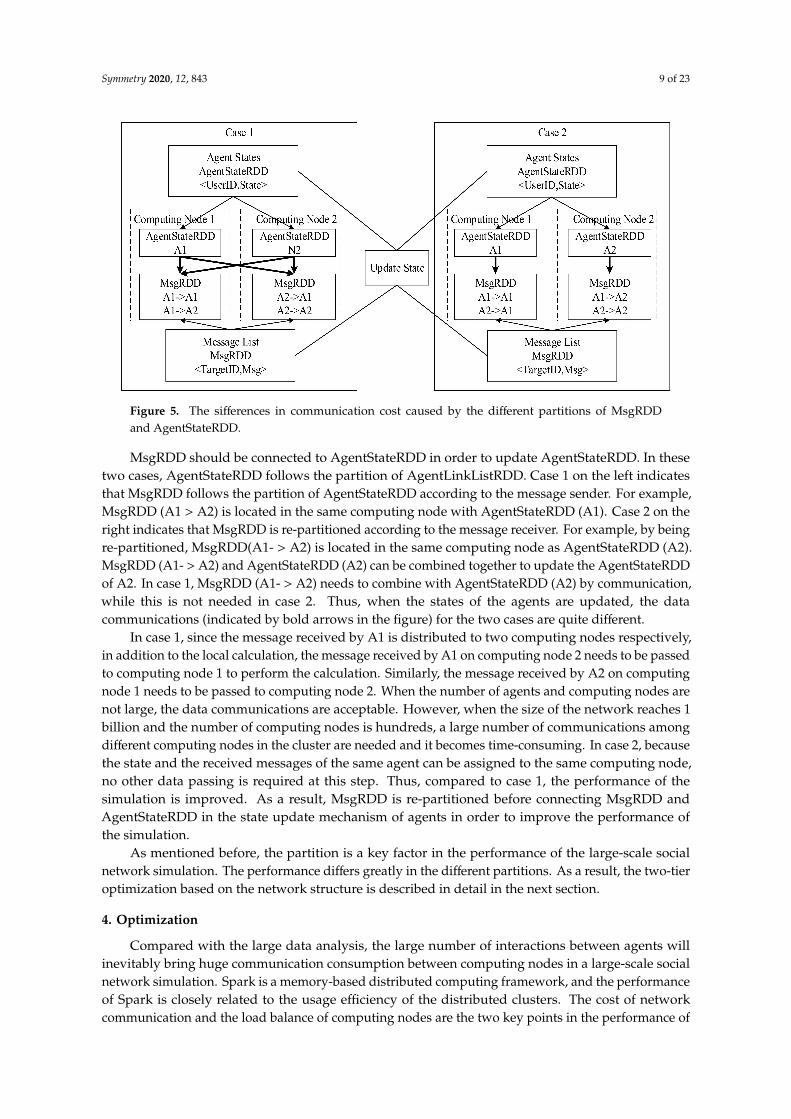
According to the partitioning strategy, the simulation kernel designed in this paper improvesthe performance of simulation by distributing the social network to different computing nodes inthe cluster. As mentioned before, almost all the calculation of the simulation kernel is composedof message passing and agent state updating in each simulation step. During the message passing,the interconnected network agents produce message transmissions. The message passing becomesthe communication among computing nodes if the source agent and target agent are partitionedin different computing nodes. The scale of communication changes greatly in different partitionstrategies. An example of nine agents is used in Figure 6 to illustrate how communications aredetermined by the partition strategy. The social network in Figure 6 contains nine network agents, A0to A8. The directional arrows between the nodes represent the connection relationship between theagents (friend relationship in the social network). The agents are partitioned in two RDDs, and Hashpartitioning is used based on the agent number.
Figure 6. The structure of the social network.
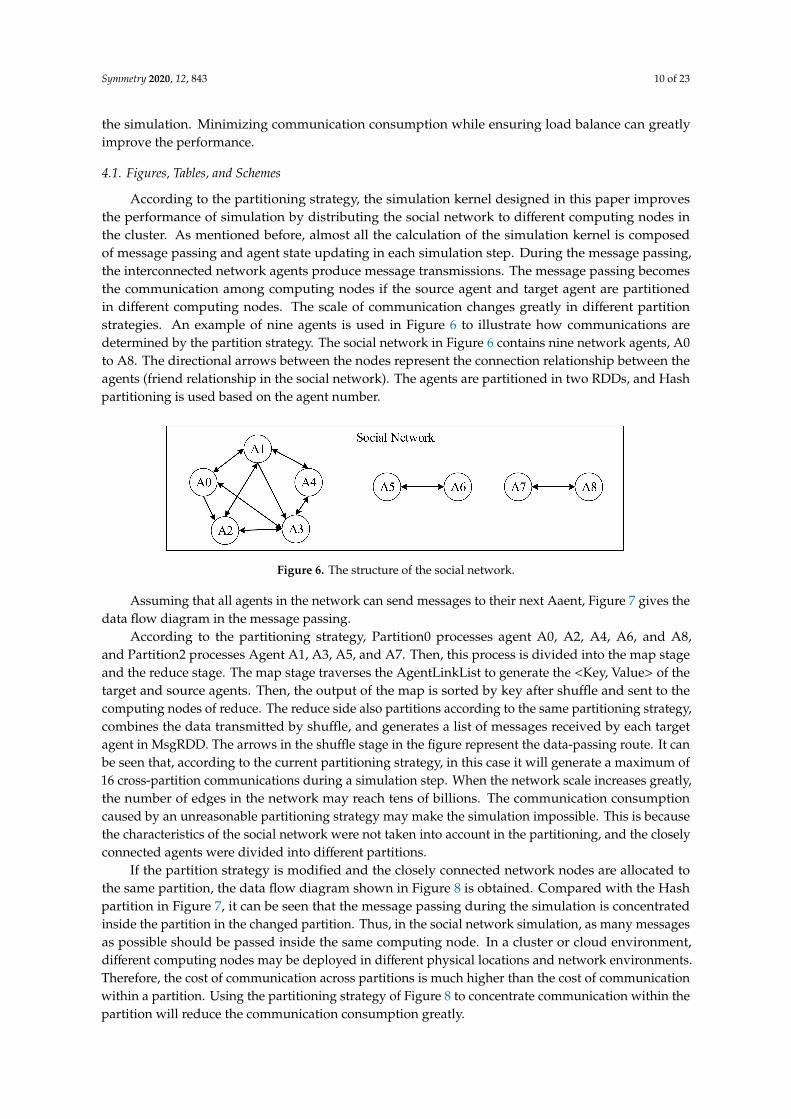
Assuming that all agents in the network can send messages to their next Aaent, Figure 7 gives thedata flow diagram in the message passing.
According to the partitioning strategy, Partition0 processes agent A0, A2, A4, A6, and A8,and Partition2 processes Agent A1, A3, A5, and A7. Then, this process is divided into the map stageand the reduce stage. The map stage traverses the AgentLinkList to generate the <Key, Value> of thetarget and source agents. Then, the output of the map is sorted by key after shuffle and sent to thecomputing nodes of reduce. The reduce side also partitions according to the same partitioning strategy,combines the data transmitted by shuffle, and generates a list of messages received by each targetagent in MsgRDD. The arrows in the shuffle stage in the figure represent the data-passing route. It canbe seen that, according to the current partitioning strategy, in this case it will generate a maximum of16 cross-partition communications during a simulation step. When the network scale increases greatly,the number of edges in the network may reach tens of billions. The communication consumptioncaused by an unreasonable partitioning strategy may make the simulation impossible. This is becausethe characteristics of the social network were not taken into account in the partitioning, and the closelyconnected agents were divided into different partitions.
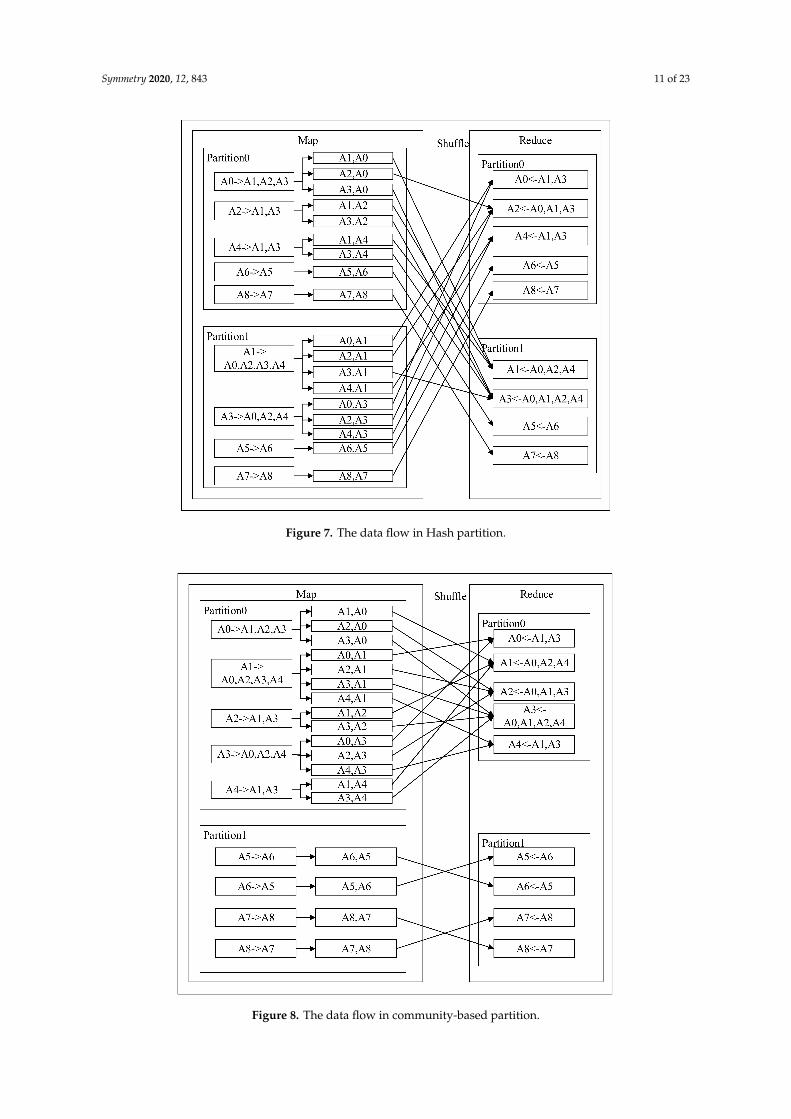
If the partition strategy is modified and the closely connected network nodes are allocated tothe same partition, the data flow diagram shown in Figure 8 is obtained. Compared with the Hashpartition in Figure 7, it can be seen that the message passing during the simulation is concentratedinside the partition in the changed partition. Thus, in the social network simulation, as many messagesas possible should be passed inside the same computing node. In a cluster or cloud environment,different computing nodes may be deployed in different physical locations and network environments.Therefore, the cost of communication across partitions is much higher than the cost of communicationwithin a partition. Using the partitioning strategy of Figure 8 to concentrate communication within thepartition will reduce the communication consumption greatly.
Symmetry 2020, 12, 843 11 of 23
Figure 7. The data flow in Hash partition.
Figure 8. The data flow in community-based partition.

Symmetry 2020, 12, 843 12 of 23
However, the actual social network structure is complex, and it is not easy to assign all theconnected agents to the same partition. Therefore, the core goal of the partition algorithm is to allocatethe closely related agents to the same partition, if possible. At the same time, load balance should alsobe considered for the reasonable calculation of partitions in the cluster. The partition based on networkstructure is detailed in the next section.
4.2. The Partition Based on Network Structure
4.2.1. The Principle of the Two-Tier Partition
An agent in a social network is the smallest calculating unit in a large-scale socialnetwork simulation. The calculation includes checking the agent state, sending messages toneighboring agents, and updating the agent state. Assume that the network is divided into Kpartitions, {P1, P2, . . .PK}. Each partition, Pi, needs to manage Ni agents
{vi1, vi2, . . . vi j, . . . , viNi
}. Each
agent vi j has wi j neighbors. The neighbors of an agent can be divided into the same partition as vi j anda different partition from vi j, and their sizes are represented by wi j
− and wi j+, respectively.
For a large-scale social network simulation, the behavior of agents in the network is very simple.It can be considered that the computing load of each node when processing a message is the same,and the number of messages received by an agent is determined by the state and number of itsneighboring agents. The state of the neighboring agents changes with simulation time, while thenumber of neighboring agents is always constant during the simulation. Statistically speaking, thenumber of messages received by a node is positively related to the number of its neighbors. Therefore,in each simulation step, the computational load LPi to be processed on a partition Pi is positivelyrelated to the sum of the neighboring agents of all agents in the partition. The communication betweenpartitions is determined by the relationship and state of agents in different partitions. When aninfected agent sends messages to its neighboring agents, a message communication between differentpartitions will be generated if the target agents are allocated in a different partition. Therefore, the totalcommunication, C, between different partitions at a certain time is closely related to the current state ofeach agent in the partition and the state of its neighboring agents. C cannot be predicted in advance,but statistically, C is proportional to the number of connected edges across the different partitions.As a result, a partition algorithm for large-scale social networks is proposed in this paper to reducethe amount of communication, C, between partitions, based on ensuring the load, LPi , is balanced forall the partitions. In other words, under the constraint of load balance, an optimal network-cuttingalgorithm is found to minimize the network communication among computing nodes, and the networksize of segmentation is N.
Consider the social network as a graph, the agents in the social network as the nodes in the graph,and the relationships between the nodes in the social network as the edges. The social network graph isdivided into K sub-graphs of the same size; minimizing the number of the edges that are cut during thesegmentation process is a typical application of the graph-cut algorithm [25]. However, the graph-cutproblem is an NP(Non-deterministic Polynomial) problem. Although there have been many studies ongraph cut, the current online social networks with a scale of over a billion is still a difficult problem.Partitioning directly based on the graph-cut algorithm is obviously time consuming, and cannot meetthe requirements of performance improvement. At the same time, the goal of the graph-cut algorithmis to divide a given network into several parts of almost equal scale, while ignoring the structuralcharacteristics of the graph and the similarity between nodes. It is not reasonable to directly use graphcut in the partition of the simulation of large-scale social networks.
Additionally, the community-detection algorithm is used to find nodes of similar structures in thenetwork and then aggregate the nodes into communities. At the same time, in social networks thecommunity shows the characteristics of close internal connection and sparse external connection [26,27].Social networks can be divided into several independent sub-networks. The division of the networkbased on the community can not only preserve the characteristics of the network structure but also

Symmetry 2020, 12, 843 13 of 23
reduce communication in the network. However, the result of the divisions in the community cannotguarantee load balance among the various communities.
Taking the advantages and disadvantages of the graph-cut algorithm and community-detectionalgorithm into consideration, a two-tier partition algorithm is proposed in this paper. The principleof the partition algorithm is shown in Figure 9. Through community detection, the large-scalesocial network is simplified into a network composed of several communities, which reduces thescale of the network. In addition, it ensures a reduction in communication while maintaining thecharacteristics of the network structure. Then, the graph-cut algorithm is used to partition based onthe simplified network to ensure load balance among the partitions. Since the input of the graph cut isthe simplified network, the efficiency of the graph cut will be greatly improved. Finally, a partitioncase can be obtained that ensures load balance while preserving the network structure characteristicsand reducing network communications to a certain extent. The community detection and graph cutare detailed next, then the implementation of the two-tier partition algorithm is also illustrated in thefollowing subsections.
Figure 9. The principle of the two-tier partition algorithm.
4.2.2. Community Detection
Community is one of the most important characteristics of a complex network. Communities canbe regarded as equal and independent sub-parts of the network [28], which represent user organizationswith close internal connections and sparse external connections in a social network. In the processof network simplification, communities can be used to represent nodes in the simplified network.The community-detection algorithm is used to segment a large-scale social network into severalcommunities, which ensures that the result of the segmentation is tightly connected internally andsparsely externally connected. Therefore, a relatively smaller number of edges are cut during thenetwork simplification.
The community detection algorithms can be divided into non-overlapping community-discoveryalgorithms and overlapping community-discovery algorithms, which are used to detect whetherthere are overlapping nodes in the community in the network. The purpose of our work is todistribute the nodes into different partitions; each node only exists in one computing partition.Thus, non-overlapping community-discovery algorithms are selected in our work. The research onnon-overlapping community discovery includes an optimization algorithm based on modularity,a community-discovery algorithm based on spectral analysis, a community-discovery algorithm basedon label propagation, and so on. Girvan and Newman et al. proposed the GN(Girvan Newman)

Symmetry 2020, 12, 843 14 of 23
algorithm [29]. In order to improve the GN algorithm, Newman proposed a fast algorithm which greatlyreduced the time complexity of the GN algorithm [30]. Based on Newman’s fast algorithm, Clauset et al.proposed the CNM (Clauset–Newman–Moore) algorithm [31], which used a heap data structure to storeand calculate the modularity of the updated network. The above algorithms are community-discoveryalgorithms based on modularity which have a high computational complexity and cannot solvethe problem of different community sizes in large-scale social networks. A community-discoveryalgorithm based on spectral analysis [32] uses the Laplace transformation to represent the graph andthen uses the eigenvector of its Laplacian matrix on clusters to get communities. This algorithm alsohas the problem of high computational complexity when dealing with large-scale social networks.The label-propagation algorithm updates the state of nodes in the network through the propagationof several tags in the network and divides the communities according to the final state value of thenodes [33]. This algorithm is suitable for community detection in large-scale complex networks, andthe computational complexity is low.
In the label-propagation algorithm, each node in the network is given a label value duringinitialization, and the label values are propagated continuously in the network according to thenetwork structure. In each iteration, the label value of the node is updated by the largest numberof label value owned by its neighboring nodes. In the iteration process, the nodes that are closelyrelated will finally converge into groups with the same label value. According to the label value ofthe nodes, the network can be divided into corresponding communities. In the initialization stage,the label-propagation algorithm needs O(n) time, where n is the number of nodes in the network.In the iterative process of label propagation, each step takes O(m) time, where m is the numberof nodes connected to this node. Compared with other community detection algorithms, the timecomplexity of the Fast-Newman algorithm is O((m + n)n), while that of the CNM algorithm isO(n log2 n). The performance of the label-propagation algorithm is excellent in the communitydetection of large-scale networks.
In this paper, the label-propagation algorithm is selected as the community-detection algorithm inthe simplified network. M communities are obtained, {C1, C2, . . . , Ci, . . . , CM}, and each communityCi contains Ni nodes. Then, a simplified large-scale social network is constructed based on the Mcommunities. The simplified network consists of M nodes, {C1, C2, . . . , Ci, . . . , CM}. The size of thenode Wi is defined as the number of edges of all nodes within the community, and the edge betweennodes ei j is defined as the connection between the node Ci and node C j.
Wi =
Ni∑j=1
w j (2)
ei j ={(va, vb)
∣∣∣∀(va, vb), va ∈ Ci, vb ∈ C j}
(3)
4.2.3. Graph Cut
The graph-cut algorithm is a common method to deal with load balance. The algorithm cuts agraph into sub-graphs of the same size with the specified number and minimizes the number of edgesremoved in cutting. For load balance, the multi-path cut algorithm [34] proposed by Kernighan andLin is a kind of graph-cut algorithm. In the multi-path cut algorithm, a graph G with n nodes is defined;the size of each node in the graph is represented by wi. For the given parameter K, the graph G is cutinto K parts of the same size. The size of each part is the sum of the sizes of the nodes contained in thepart. Based on the large-scale social network simplified by community detection, the goal of this paperis to cut the network into K partitions with the same load, ensuring that the communications amongthe partitions are as small as possible.
In the classical multi-path cut algorithm, a node with the size of p is regarded as a communitycomposed of p nodes with size 1, and edges with high weight are added to this community to ensure
Symmetry 2020, 12, 843 15 of 23
that the community will not be split in the cutting. However, it cannot guarantee that the communitiesare not cut in the case of communities with many kinds of sizes in this paper. At the same time,the classical multi-path cut algorithm needs to iterate many times to find the global optimal solutionwhen K ≥ 3 and the time complexity of the algorithm is far greater than O(N2 log2 N). Considering theabove problems, Cheol H. Lee et al. proposed an efficient multi-path cut algorithm. In this algorithm,the problems are transformed into the problem of seeking the maximum K times cutting of the graph.Then, the generic algorithm is used to solve the problem. The complexity of the improved algorithm isO(k|V|2), where |V| is the number of nodes in the subpart of the graph.
In the two-tier partition algorithm proposed in this paper, the multi-path cut algorithm is usedto cut the simplified network graph composed of communities. The simplified network G containsM nodes, {C1, C2, . . . , Ci, . . . , CM}. Each node represents a community, and the community containsni nodes,
{vi1, vi2, . . . , vi j, . . . , vini
}. The size of the nodes corresponds to the load of the nodes, LCi .
The simplified network is divided into K partitions,{P1, P2, . . .PK}. Each partition Pi contains Sicommunities, and the corresponding partition load, LPi , is the sum of all the community loads inthe partition.
LCi ∝
ni∑i=1
wi j (4)
LPi =
si∑j=1
LCi j (5)
According to Equations (3)–(5) can be obtained—that is, the load on each partition is directlyproportional to the number of neighboring nodes of all the nodes in the communities distributed in thepartition. LCi is defined as the size of the node in the simplified network, and the goal of the multi-pathcut algorithm of the simplified network is to ensure that LPi is the same for each partition.
The edge in the simplified network is defined as ei j, and the simplified network is cut into Kpartitions with a similar load by cutting edges with the least cost. Ei
− and Ei+ are used to represent
the inner edges of partition, Pi, and the edges out of the Pi. The corresponding communicationconsumption C after cutting is as shown in Equation (8):
Ei− = {eab|Ca ∈ Pi, Cb ∈ Pi} (6)
Ei+ = {eab|Ca ∈ Pi, Cb < Pi} (7)
C = β·K∑
i=1
E+i . (8)
As mentioned before, the graph cut is transformed into the finding of an optimal network partitionalgorithm under the constraint of load balance (Equation (10)) so as to minimize the communicationsbetween computing nodes (Equation (9)). The problem of cutting an original N agents social networkis transformed into the problem of cutting a simplified M nodes network, and M << N.
minNC = β·K∑
i=1
E+i (9)
s.t.∀i ∈ (1 . . .K), LPi ≤ Bmax := (1 + ε)
K∑i=1
LPi
K(10)
As a result, the two-tier partition algorithm of the large-scale social network is divided intotwo stages. The first stage is the community detection based on the label-propagation algorithm, and
Symmetry 2020, 12, 843 16 of 23
the second stage is the graph cut of the simplified network. Finally, the partition results are obtained.The details of the implementation of the two-tier partition algorithm are illustrated in the next section.
4.2.4. The Flow of Two-Tier Partition
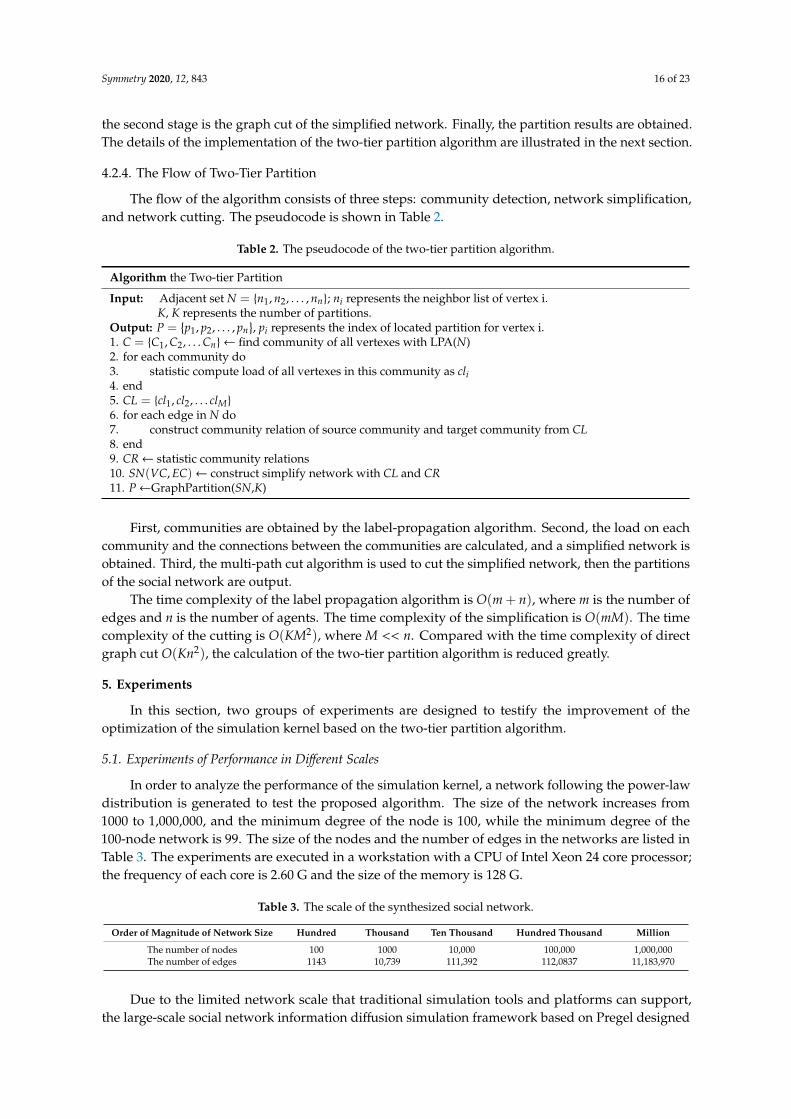
The flow of the algorithm consists of three steps: community detection, network simplification,and network cutting. The pseudocode is shown in Table 2.
Table 2. The pseudocode of the two-tier partition algorithm.
Algorithm the Two-tier Partition
Input: Adjacent set N = {n1, n2, . . . , nn}; ni represents the neighbor list of vertex i.K, K represents the number of partitions.
Output: P ={p1, p2, . . . , pn
}, pi represents the index of located partition for vertex i.
1. C = {C1, C2, . . .Cn} ← find community of all vertexes with LPA(N)2. for each community do3. statistic compute load of all vertexes in this community as cli4. end5. CL = {cl1, cl2, . . . clM}6. for each edge in N do7. construct community relation of source community and target community from CL8. end9. CR← statistic community relations10. SN(VC, EC)← construct simplify network with CL and CR11. P←GraphPartition(SN,K)
First, communities are obtained by the label-propagation algorithm. Second, the load on eachcommunity and the connections between the communities are calculated, and a simplified network isobtained. Third, the multi-path cut algorithm is used to cut the simplified network, then the partitionsof the social network are output.
The time complexity of the label propagation algorithm is O(m + n), where m is the number ofedges and n is the number of agents. The time complexity of the simplification is O(mM). The timecomplexity of the cutting is O(KM2), where M << n. Compared with the time complexity of directgraph cut O(Kn2), the calculation of the two-tier partition algorithm is reduced greatly.
5. Experiments
In this section, two groups of experiments are designed to testify the improvement of theoptimization of the simulation kernel based on the two-tier partition algorithm.
5.1. Experiments of Performance in Different Scales
In order to analyze the performance of the simulation kernel, a network following the power-lawdistribution is generated to test the proposed algorithm. The size of the network increases from1000 to 1,000,000, and the minimum degree of the node is 100, while the minimum degree of the100-node network is 99. The size of the nodes and the number of edges in the networks are listed inTable 3. The experiments are executed in a workstation with a CPU of Intel Xeon 24 core processor;the frequency of each core is 2.60 G and the size of the memory is 128 G.
Table 3. The scale of the synthesized social network.
Order of Magnitude of Network Size Hundred Thousand Ten Thousand Hundred Thousand Million
The number of nodes 100 1000 10,000 100,000 1,000,000The number of edges 1143 10,739 111,392 112,0837 11,183,970
Due to the limited network scale that traditional simulation tools and platforms can support,the large-scale social network information diffusion simulation framework based on Pregel designed

Symmetry 2020, 12, 843 17 of 23
by Chuan Ai et al. [18] is selected for the comparison with the simulation kernel implemented inthis paper. As described before, the SIR model is used as an example in the experiments. The initialinfection number is set as 10, the infection probability is set as 0.05, and the recovery probability is setas 0.02. The experiments under two simulation frameworks are executed 50 times and the mean valuesare shown in Figure 10.
Figure 10. The comparison of results between the Spark-based simulation of information siffusion andthe Pregel-based simulation.
As can be seen from Figure 10, there are almost no differences in performance between thetwo simulation frameworks. However, because of the tight encapsulation of Pregel, the simulationframework based on Pregel cannot perform statistical analysis of the temporary data generated by eachsimulation step in the simulation process. Actually, in order to analyze the mechanism of the diffusionprocess, the changes of all agents and edges should be recorded. Although the time consumptionfor the recording of temporary data is counted, the simulation kernel based on Spark designed inthis paper still achieves the same level of computing performance as Pregel. In each simulation step,the infections of agents are recorded and output along with the simulation.
The simulation time recorded in the experiment includes the statistics of the time of the numberof infected and recovered agents in each step. Figure 11 shows a sample of the statistical results ofthe number of infected and recovered agents in the experiments. In the case of similar performance,the simulation kernel proposed in this paper is flexible in programming and the real-time data statisticsare supported, so time is saved in the results analysis.
In the large-scale social network simulation application, the real-time statistics of the data in thesimulation process is of great significance. For example, when the information diffusion simulation inthe large-scale social network is used to support decisions about rumor management, different rumormanagement strategies could be simulated in a short time. Through the real-time data statistics,the effect of rumor management policies can be observed clearly during the simulation. The mostoptimal policy can be selected for decision-making as soon as possible.

Symmetry 2020, 12, 843 18 of 23
Figure 11. The count of infected and recovered agents.
5.2. Experiments of Two-Tier Partition
In order to verify the performance improvement of the two-tier partition algorithm, the empiricaldata from SNAP (Stanford Network Analysis Project) are used to design a series of experiments.The dataset from Twitter records a large-scale social network which has 81,306 users and 1,768,149directed edges. Four different partition algorithms are designed to test the performance of thealgorithms: (1) partition with Hash algorithm (Hash Partition); (2) partition with multi-path cutalgorithm (Graph Partition); (3) simplify the network with the label propagation algorithm, and thenpartition the simplified network with the Hash algorithm (Community Hash); (4) simplify the networkwith the label propagation algorithm, and then partition the simplified network with a = the multi-pathcut algorithm (Community Graph).
The parameters of the SIR model in agents are set in the experiments. The infection rate is setas 0.001, while the recovery probability is set as 0.01. A group of 10 agents is randomly selected asthe initial infection sources to simulate the information diffusion in the social network from Twitter.Fifty simulation experiments are carried out for each partition algorithm, and the communications andloads of the partitions in the simulation are compared.
Figure 12 shows the comparison between the cross-partition communications and inter-partitioncommunications of four different partition algorithms. In the figure, the solid line represents thecross-partition communication, the dotted line represents inter-partition communication, and the topleft to bottom right corresponds the Hash Partition, Graph Partition, Community Hash, and CommunityGraph. It can be seen from the figure that in the partition mode of Hash Partition and Graph Partition,the cross-partition communications exceed the inter partition communications. However, when thecommunity-detection algorithm is used to simplify the network, the inter-partition communicationsare obviously more numerous than cross-partition communications. This shows that communitydetection reduces communication across partitions greatly.
Figure 13 shows the comparisons of the communications of four different partition algorithms.The number of cross-partition communications is given at the top of the figure, while the number ofcommunications between the partitions is given at the bottom. It can be seen that in the Hash Partition,the amount of cross-partition communications is the most, the amount of inter-partition communicationsis the least, and the communication consumptions are also the largest. Compared with the HashPartition, the cross-partition communications of Graph Partition are reduced, but it still accounts fora higher proportion in the total communication. Although the Graph Partition cuts as few edges aspossible, due to the need for the load balance of partitions, the consumptions are still large. It can be

Symmetry 2020, 12, 843 19 of 23
seen that the simplification of the network by using the community-detection algorithm significantlyreduces cross-partition communications. In the latter two partition algorithms, the inner-partitioncommunications are far greater than the cross-partition communications.
Figure 12. The communications in four partitions.
Figure 13. The comparisons of the communication of four partitions.
Due to the influences of random factors in the simulation, the amount of communication invarious partition algorithms is different. For further comparison, the proportion of cross-partitioncommunications in the total communication of various partition algorithms is listed in Table 4.It can be seen that the Graph Partition reduces the proportion of cross-partition communication byabout 35% compared with the Hash Partition. However, the load balance should be consideredin the Graph Partition. After using the community-detection algorithm, the community Hash andcommunity both perform well in reducing cross-partition communications, which are less than 10% ofthe total communications. Because community detections are usually achieved before the simulation,the performance of latter partition algorithms is influenced.
Symmetry 2020, 12, 843 20 of 23
Table 4. The communications in four partitions.
Partition Algorithm Hash Partition Graph Partition Community Hash Community Graph
The proportion of cross-partitioncommunication 87.9% 53.3% 7.8% 7.6%
The proportion of inter-partitioncommunication 12.1% 46.7% 92.2% 92.4%
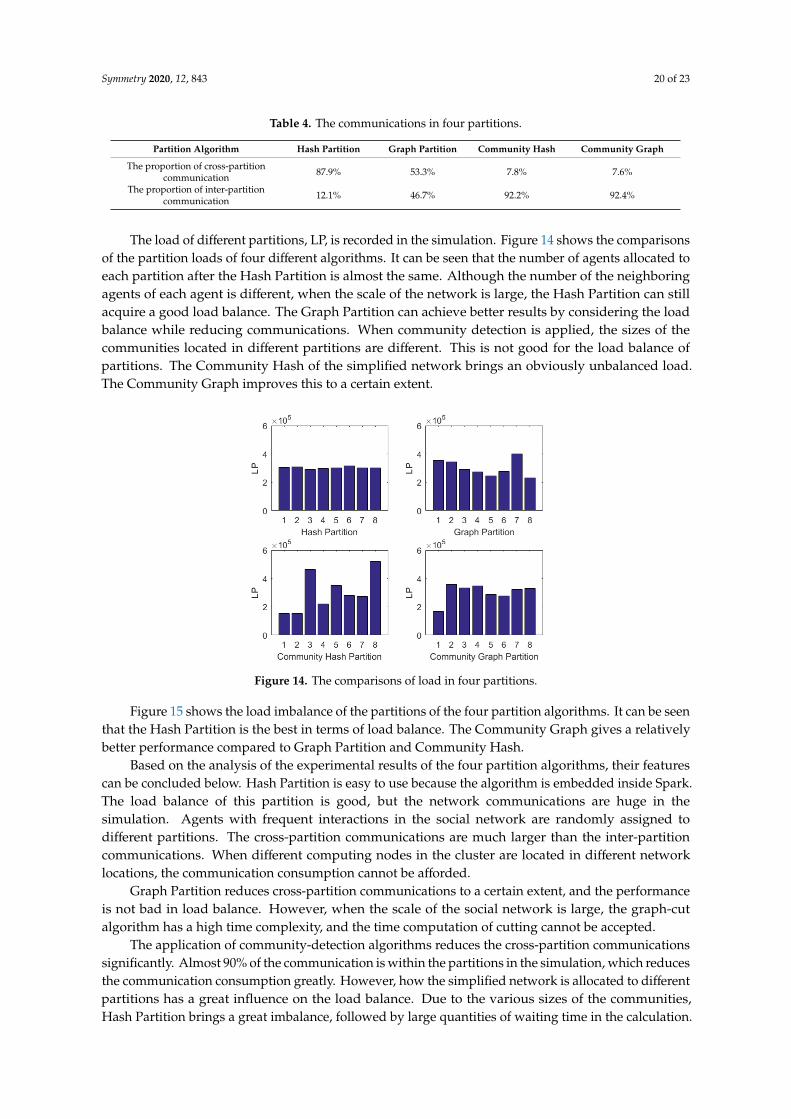
The load of different partitions, LP, is recorded in the simulation. Figure 14 shows the comparisonsof the partition loads of four different algorithms. It can be seen that the number of agents allocated toeach partition after the Hash Partition is almost the same. Although the number of the neighboringagents of each agent is different, when the scale of the network is large, the Hash Partition can stillacquire a good load balance. The Graph Partition can achieve better results by considering the loadbalance while reducing communications. When community detection is applied, the sizes of thecommunities located in different partitions are different. This is not good for the load balance ofpartitions. The Community Hash of the simplified network brings an obviously unbalanced load.The Community Graph improves this to a certain extent.
Figure 14. The comparisons of load in four partitions.
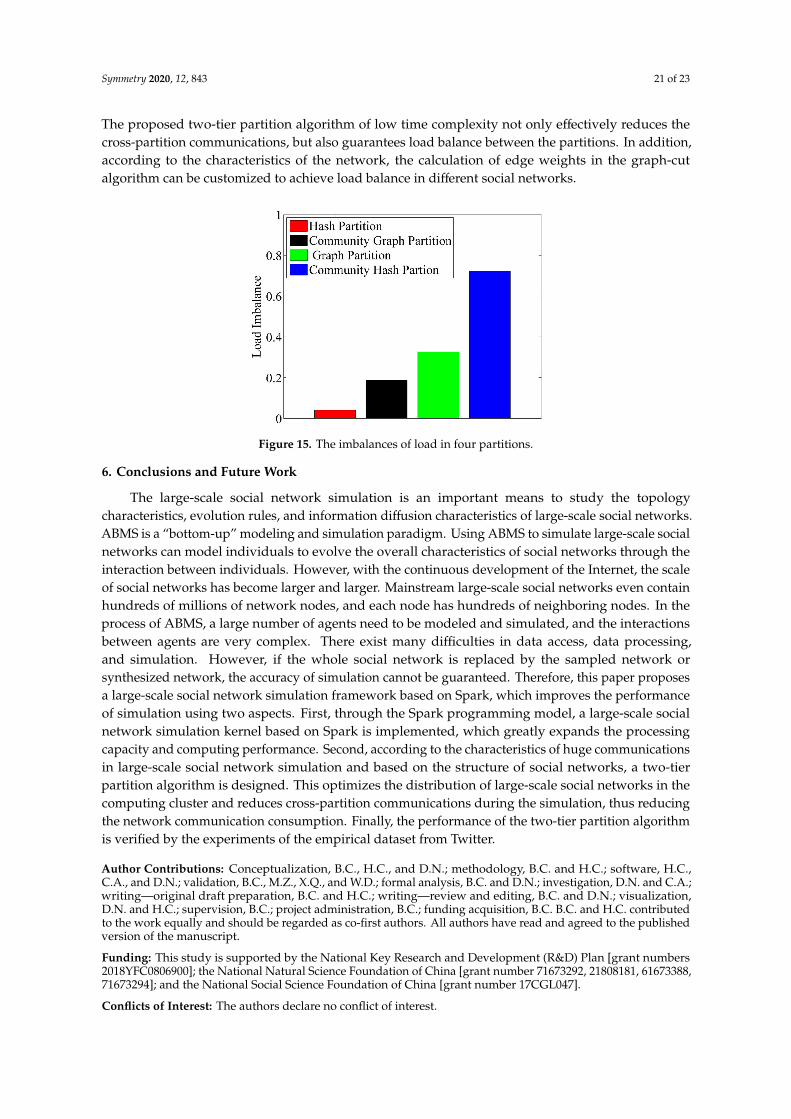
Figure 15 shows the load imbalance of the partitions of the four partition algorithms. It can be seenthat the Hash Partition is the best in terms of load balance. The Community Graph gives a relativelybetter performance compared to Graph Partition and Community Hash.
Based on the analysis of the experimental results of the four partition algorithms, their featurescan be concluded below. Hash Partition is easy to use because the algorithm is embedded inside Spark.The load balance of this partition is good, but the network communications are huge in thesimulation. Agents with frequent interactions in the social network are randomly assigned todifferent partitions. The cross-partition communications are much larger than the inter-partitioncommunications. When different computing nodes in the cluster are located in different networklocations, the communication consumption cannot be afforded.
Graph Partition reduces cross-partition communications to a certain extent, and the performanceis not bad in load balance. However, when the scale of the social network is large, the graph-cutalgorithm has a high time complexity, and the time computation of cutting cannot be accepted.
The application of community-detection algorithms reduces the cross-partition communicationssignificantly. Almost 90% of the communication is within the partitions in the simulation, which reducesthe communication consumption greatly. However, how the simplified network is allocated to differentpartitions has a great influence on the load balance. Due to the various sizes of the communities,Hash Partition brings a great imbalance, followed by large quantities of waiting time in the calculation.
Symmetry 2020, 12, 843 21 of 23
The proposed two-tier partition algorithm of low time complexity not only effectively reduces thecross-partition communications, but also guarantees load balance between the partitions. In addition,according to the characteristics of the network, the calculation of edge weights in the graph-cutalgorithm can be customized to achieve load balance in different social networks.
Figure 15. The imbalances of load in four partitions.
6. Conclusions and Future Work
The large-scale social network simulation is an important means to study the topologycharacteristics, evolution rules, and information diffusion characteristics of large-scale social networks.ABMS is a “bottom-up” modeling and simulation paradigm. Using ABMS to simulate large-scale socialnetworks can model individuals to evolve the overall characteristics of social networks through theinteraction between individuals. However, with the continuous development of the Internet, the scaleof social networks has become larger and larger. Mainstream large-scale social networks even containhundreds of millions of network nodes, and each node has hundreds of neighboring nodes. In theprocess of ABMS, a large number of agents need to be modeled and simulated, and the interactionsbetween agents are very complex. There exist many difficulties in data access, data processing,and simulation. However, if the whole social network is replaced by the sampled network orsynthesized network, the accuracy of simulation cannot be guaranteed. Therefore, this paper proposesa large-scale social network simulation framework based on Spark, which improves the performanceof simulation using two aspects. First, through the Spark programming model, a large-scale socialnetwork simulation kernel based on Spark is implemented, which greatly expands the processingcapacity and computing performance. Second, according to the characteristics of huge communicationsin large-scale social network simulation and based on the structure of social networks, a two-tierpartition algorithm is designed. This optimizes the distribution of large-scale social networks in thecomputing cluster and reduces cross-partition communications during the simulation, thus reducingthe network communication consumption. Finally, the performance of the two-tier partition algorithmis verified by the experiments of the empirical dataset from Twitter.
Author Contributions: Conceptualization, B.C., H.C., and D.N.; methodology, B.C. and H.C.; software, H.C.,C.A., and D.N.; validation, B.C., M.Z., X.Q., and W.D.; formal analysis, B.C. and D.N.; investigation, D.N. and C.A.;writing—original draft preparation, B.C. and H.C.; writing—review and editing, B.C. and D.N.; visualization,D.N. and H.C.; supervision, B.C.; project administration, B.C.; funding acquisition, B.C. B.C. and H.C. contributedto the work equally and should be regarded as co-first authors. All authors have read and agreed to the publishedversion of the manuscript.
Funding: This study is supported by the National Key Research and Development (R&D) Plan [grant numbers2018YFC0806900]; the National Natural Science Foundation of China [grant number 71673292, 21808181, 61673388,71673294]; and the National Social Science Foundation of China [grant number 17CGL047].
Conflicts of Interest: The authors declare no conflict of interest.

Symmetry 2020, 12, 843 22 of 23
References
1. Wechat 2018. In Wechat Data Report 2018; Wechat: Singapore, 2019; Available online: https://support.weixin.qq.com/cgi-bin/mmsupport-bin/getopendays (accessed on 19 May 2020).
2. Fang, B.; Jia, Y.; Han, Y. Core scientific issues of social network analysis. research status and future prospects.CAS Bull. 2015, 2, 187–199.
3. Liu, W.; Sidhu, A.; Beacom, A.M.; Valente, T. Social Network Theory. In The International Encyclopedia ofMedia Effects; John Wiley & Sons, Inc.: Hoboken, NJ, USA, 2017.
4. Fang, B. Online Social Network Analysis; Electronic Industry Press: Beijing, China, 2014.5. Zhang, J.; Li, X. Artificial society -sociological simulation based on Agent. Syst. Eng. 2005, 23, 13–20.6. Sklar, E. Software Review: NetLogo, a Multi-Agent Simulation Environment. Artif. Life 2007, 13, 303–311.
[CrossRef]7. Minar, N.; Burkhart, R.; Langton, C.; Askenazy, M. The Swarm Simulation System–A Toolkit for Building
Multi-agent Simulations; Santa Fe Institute: Santa Fe, NM, USA, 1996.8. North, M.J.; Collier, N.; Vos, J.R. Experiences creating three implementations of the repast agent modeling
toolkit. ACM Trans. Model. Comput. Simul. 2006, 16, 1–25. [CrossRef]9. Railsback, S.F.; Lytinen, S.; Jackson, S.K. Agent-based Simulation Platforms: Review and Development
Recommendations. Simulation 2006, 82, 609–623. [CrossRef]10. Zhen, L.; Gang, G.; Bin, C.; Xiaogang, Q. Accelerating Large Scale Artificial Society Simulation with CPU/GPU
Based Heterogeneous Parallel Method. In Proceedings of the IEEE/ACM International Symposium onDistributed Simulation & Real Time Applications, London, UK, 21–23 September 2016.
11. Walker, S.J. Big Data: A Revolution That Will Transform How We Live, Work, and Think. Int. J. Advert. 2014,33, 181–183. [CrossRef]
12. Google. Sorting 1 PB with MapReduce. Available online: http://googleblog.blogspot.com/2008/11/sorting-1pb-with-mapreduce.html,20081111 (accessed on 21 November 2019).
13. Matei, Z.; Mosharaf, C.; Franklin, J.; Shenker, M.; Ion, S. Spark: Cluster Computing with Working Sets.In Proceedings of the 2nd USENIX Conference on Hot Topics in Cloud Computing, Berkeley, CA, USA,22–25 June 2010.
14. Charlse, M.; Michael, J. agent-based modeling and simulation. In Proceedings of the 2009 Winter SimulationConference, Austin, TX, USA, 13 December 2009; pp. 86–98.
15. Allan, R. Survey of Agent Based Modelling and Simulation Tools; Science and Technology Facilities Council:Washington, DC, USA, 2010.
16. Mittal, A.; Krejci, C.C.; Dorneich, M.C. An agent-based approach to designing residential renewable energysystems. Renew. Sustain. Energy Rev. 2019, 112, 1008–1020. [CrossRef]
17. Griffin, F.A.; Stanish, C. An Agent-Based Model of Prehistoric Settlement Patterns and Political Consolidationin the Lake Titicaca Basin of Peru and Bolivia. Struct. Dyn. 2007, 2, 2.
18. Testa, J.W.; Mock, K.J.; Taylor, C.; Koyuk, H.; Coyle, J.R.; Waggoner, R. Agent-based modeling of the dynamicsof mammal-eating killer whales and their prey. Mar. Ecol. Prog. Ser. 2012, 466, 275–291. [CrossRef]
19. Lee, K.; Park, J. A Hadoop-Based Output Analyzer for Large-Scale Simulation Data. In Proceedings of the TheFourth IEEE International Conference on Big Data & Cloud Computing, Sydney, Australia, 3 December 2014.
20. Sethia, P.; Karlapalem, K. A multi-agent simulation framework on small Hadoop cluster. Eng. Appl. Artif.Intell. 2011, 24, 1120–1127. [CrossRef]
21. Kärger, J.; Ruthven, D.M.; Theodorou, D.N. Molecular Dynamics Simulations. In Diffusion in NanoporousMaterials; Wiley: Hoboken, NJ, USA, 2012; pp. 227–273.
22. Youbo, L.; Yang, L.; Junyong, L.; Yong, L.; Jianting, L.; Su, D. Hadoop Based Distributed ComputingFramework for Large-scale Cascading Failure Simulation and Analysis of Power System. Autom. Electr.Power Syst. 2016, 40, 90–97.
23. He, L.; Fen, D.; Wang, R.; Su, P.-R.; Ying, L.-Y. Worm simulation of large-scale online social network based onMapReduce. J. Softw. 2013, 7, 1666–1682. [CrossRef]
24. Chuan, A.; Bin, C.; Liang, L.; Jian, J.; He, L.; Lai, K.; Qiu, X. Design and implementation of large-scale networkpropagation simulation method inspired by Pregel mechanism. Sci. Sin. Inf. 2018, 48, 932–946.
25. Kang, L.; Zhang, X.; Li, F.; Tian, Y. Graph partitioning method for social networks based on communicationload balancing. Comput. Eng. Appl. 2018, 54, 66–71.
Symmetry 2020, 12, 843 23 of 23
26. Clauset, A.; Newman, M.E.; Moore, C. Finding community structure in very large networks. Phys. Rev. E2004, 70, 066111. [CrossRef]
27. Watts, D.J.; Strogatz, S.H. Collective dynamics of ‘small-world’ networks. Nature 1998, 393, 440–442.[CrossRef]
28. Fortunato, S. Community detection in graphs. Phys. Rep. 2009, 486, 75–174. [CrossRef]29. Girvan, M.; Newman, M.E.J. Community structure in social and biological networks. Proc. Natl. Acad.
Sci. USA 2002, 99, 7821–7826. [CrossRef]30. Newman, M.E.J. Fast algorithm for detecting community structure in networks. Phys. Rev. E 2004, 69, 066133.
[CrossRef]31. Clauset, A. Finding local community structure in network. Phys. Rev. E 2005, 72, 1–7. [CrossRef]32. Fieldler, M. Algebraic connectivity of graphs. Czechoslov. Math. J. 1973, 23, 298–305.33. Raghavan, U.N.; Albert, R.; Kumara, S. Near linear time algorithm to detect community structures in
large-scale networks. Phys. Rev. E 2007, 76, 036106. [CrossRef] [PubMed]34. Kernighan, B.W.; Lin, S. An Efficient Heuristic Procedure for Partitioning Graphs. Bell Syst. Tech. J. 1970, 49,
291–307. [CrossRef]
© 2020 by the authors. Licensee MDPI, Basel, Switzerland. This article is an open accessarticle distributed under the terms and conditions of the Creative Commons Attribution(CC BY) license (http://creativecommons.org/licenses/by/4.0/).