a two-study comparison of clinical and mri markers
DESCRIPTION
A Two-Study Comparison of Clinical and MRI MarkersTRANSCRIPT

7/17/2019 A Two-Study Comparison of Clinical and MRI Markers
http://slidepdf.com/reader/full/a-two-study-comparison-of-clinical-and-mri-markers 1/9
Hindawi Publishing CorporationInternational Journal of Alzheimer’s DiseaseVolume 2012, Article ID 483469, 8 pagesdoi:10.1155/2012/483469
Clinical Study A Two-Study Comparison of Clinical and MRIMarkers of Transition from Mild Cognitive Impairment to Alzheimer’s Disease
D. P. Devanand,1, 2 XinhuaLiu,3 Patrick J.Brown,1 Edward D. Huey,1, 2
Yaakov Stern,2 and Gregory H. Pelton1
1 Division of Geriatric Psychiatry, New York State Psychiatric Institute, College of Physicians and Surgeons, Columbia University,
1051 Riverside Drive, Unit 126, New York, NY 10032, USA 2 Gertrude H. Sergievsky Center and Taub Institute for Research in Alzheimer’s Disease and The Aging Brain, Department of Neurology,College of Physicians and Surgeons, Columbia University, 630 West 168th Street, New York, NY 10032, USA
3 Department of Biostatistics, Columbia University School of Public Health, 722 West 168th Street, NY 10032, USA
Correspondence should be addressed to D. P. Devanand, [email protected]
Received 25 August 2011; Revised 20 October 2011; Accepted 25 October 2011
Academic Editor: Anthony Bayer
Copyright © 2012 D. P. Devanand et al. This is an open access article distributed under the Creative Commons AttributionLicense, which permits unrestricted use, distribution, and reproduction in any medium, provided the original work is properly cited.
A published predictor model in a single-site cohort study (questionable dementia, QD) that contained episodic verbal memory (SRT total recall), informant report of function (FAQ), and MRI measures was tested using logistic regression and ROC analyseswith comparable measures in a second multisite cohort study (Alzheimer’s Disease Neuroimaging Initiative, ADNI). There were126 patients in QD and 282 patients in ADNI with MCI followed for 3 years. Within each sample, the diff erences in AUCs betweenthe statistical models were very similar. Adding hippocampal and entorhinal cortex volumes to the model containing AVLT/SRT,FAQ, age andMMSE increased the area under the curve (AUC)in ADNI butnot QD, withsensitivity increasing by 2% in ADNI and2% in QD for a fixed specificity of 80%. Conversely, adding episodic verbal memory (SRT/AVLT) and FAQ to the model containingage, Mini Mental State Exam (MMSE), hippocampal and entorhinal cortex volumes increased the AUC in ADNI and QD, withsensitivity increasing by 17% in ADNI and 10% in QD for 80% specificity. The predictor models showed similar diff erences fromeach other in both studies, supporting independent validation. MRI hippocampal and entorhinal cortex volumes showed limitedadded predictive utility to memory and function measures.
1. Introduction
Mild cognitive impairment (MCI) often represents a tran-sitional state between normal cognition and Alzheimer’sdisease (AD) [1, 2]. Accurate prediction of transition fromMCI to AD aids in prognosis and targeting early treatment[3]. Episodic verbal memory impairment and informantreport of functional deficits in complex social and cognitivetasks are features of incipient AD, and impairment in thesedomains is associated with transition from MCI to AD [4, 5].
Most biomarkers of MCI transition to AD are related tothe underlying disease pathology of amyloid plaques andneurofibrillary tangles [6]. Hippocampal and entorhinalcortex atrophy on MRI scan of brain [7], parietotemporal
hypometabolism on 18FDG PET [8], increased amyloid up-
take using PET [9], and decreased amyloid beta-42 (A β42)with increased tau/phospho-tau levels in the cerebrospinalfluid (CSF) [10, 11] each significantly predict transition fromMCI to AD. The apolipoprotein E ε4 allele increases AD risk,but is not a strong biomarker of transition from MCI to AD[3].
In a meta-analysis, memory deficits appeared to be supe-rior to MRI hippocampal atrophy in predicting transition toAD [12], but studies in the meta-analysis had highly variablesubject inclusion/exclusion criteria and assessment methods.There has been a lack of direct head-to-head comparisonof clinical and neuroimaging predictors of transition acrossdiff erent studies.

7/17/2019 A Two-Study Comparison of Clinical and MRI Markers
http://slidepdf.com/reader/full/a-two-study-comparison-of-clinical-and-mri-markers 2/9
2 International Journal of Alzheimer’s Disease
In our single-site study (Questionable Dementia or QDstudy) that evaluated and followed a broadly defined sampleof patients with MCI, a published predictor model thatincluded specific cognitive, functional, olfactory, and MRImeasures strongly predicted transition to AD [3]. In theAlzheimer’s Disease Neuroimaging Initiative (ADNI) study,
cognitive and functional measures and several biomarkersare assessed in samples of MCI, AD, and healthy controlsubjects at baseline and serially during followup. In thispaper, the first goal was to test the accuracy of a combinationof predictor variables derived from the QD study to predicttransition from MCI to AD in a completely independentADNI sample. The validation of specific predictor combina-tions, rather than individual measures, has rarely been donein independent samples. This is essential before specific cut-points, and ranges for specific predictors in such modelscan be developed with confidence for eventual clinicalapplication. The second goal was to evaluate the relativeutility of clinical and MRI measures in predicting transitionfrom MCI to AD.
2. Methods
Patients with MCI in the QD and ADNI studies were in-cluded, and patients with AD (ADNI) and healthy controlsubjects (QD and ADNI) were excluded. The 3-year followupsamples were chosen because most transitions occur to ADwithin 3 years of clinical presentation [13].
2.1. QD Study. As previously reported, patients 41–85 yearsold who presented with subjective memory complaints forclinical evaluation to a Memory Disorders Clinic were eligi-
ble if they had a Folstein Mini-Mental State Exam (MMSE)score ≥22 out of 30, memory impairment defined as MMSErecall ≤2/3 objects at 5 minutes or a Selective RemindingTest (SRT) delayed recall score >1 SD below norms, andabsence of a consensus diagnosis of dementia made by two experienced raters [3]. Patients could also be includedif they had other cognitive and functional deficits. Thisstudy began before criteria for MCI were published [1, 2].Baseline MCI subtype using the criterion of >1.5 SD below norms on cognitive tests was determined post hoc by usingage, education, and sex-based regression norms derivedfrom 83 healthy control subjects [4]. Using this approach,73% of patients met the Peterson criteria for single or
multidomain amnestic MCI, and this subsample was alsocompared to ADNI. The presence of specific neurologicalor major psychiatric disorders led to exclusion [3]. Patientswere followed every 6 months for up to 9 years, and the tworaters made a consensus diagnosis at each time point. Thesample comprised 148 patients with MCI at baseline, and 126patients were in the 3-year followup sample.
2.2. ADNI Study. Data were obtained from the ADNI study (http://adni.loni.ucla.edu/), a project launched in 2003 by the National Institute on Aging, the National Institute of Biomedical Imaging and Bioengineering, the Food andDrug Administration, private pharmaceutical companies,
and non-profit organizations as a $60 million, 5-year public-private partnership. The primary goal is to test whether serialmagnetic resonance imaging, positron emission tomogra-phy, other biological markers, and clinical and neuropsy-chological assessment can be combined to measure theprogression of MCI and early AD.
Participants 55–90 years old were enrolled if they hadat least 6 years of education, spoke English or Spanish,agreed to longitudinal followup and neuroimaging tests,had single or multidomain MCI by the Petersen criteriawith MMSE scores between 24 and 30, a memory com-plaint verified by informant, an abnormal memory score(1.5 SD below age-adjusted cutoff ) on the Logical Memory II subscale (delayed paragraph recall) from the WechslerMemory Scale-Revised, and absence of a dementia diagnosis.All participants had a Geriatric Depression Scale score of <6 and a modified Hachinski score of ≤4. For a moredetailed account of the inclusion/exclusion criteria, pleasesee http://www.adni-info.org/. Raters at each site madeconsensus diagnoses at six-month intervals that includedan evaluation of transition from MCI to AD, which wasreviewed by a central committee. Data were obtained fromADNI on October 31, 2010. Of 394 individuals with MCIat baseline evaluation, 282 subjects completed 3 years of followup.
2.3. Comparable Baseline Measures Chosen for Analysis fromQD and ADNI. In the QD study, the SRT total recall (12items, 6 trials) was the strongest predictor among the fivehypothesized neuropsychological predictors examined [3].TheSRT was not done in ADNI, but the comparable measureof total recall across 6 trials in the Auditory Verbal learning
Test (AVLT) was not used for study inclusion criteria and wasavailable. Informant report of the patient’s functioning usingthe Pfeff er Functional Activities Questionnaire (FAQ) totalscore and MRI hippocampal and entorhinal cortex volumeswas additional predictors in the final model in QD [3] thatwere also assessed in ADNI.
Both studies conducted MRI on 1.5T scanners: a singleGE scanner in QD, and GE or Siemens or Philips scannersacross 48 sites in ADNI. In QD, hippocampal volume wasassessed by a semiautomated method with specific anatomi-cal landmarks used to define hippocampal boundaries, andentorhinal cortex volume was computed from three slicescentered at the level of the mammillary bodies [7]. In
ADNI, MRI hippocampal and entorhinal cortex volumeswere derived from postprocessed image analysis that usedFreeSurfer (FS) version 4.3.0 by researchers at the University of California, San Francisco (UCSFFSX); the data areavailable at http://adni.loni.ucla.edu/. The volume derivationprocess is described at http://www.loni.ucla.edu/twiki/bin/view/ADNI/ADNIPostProc. For both studies, intracranialvolume was a covariate in all analyses of hippocampal andentorhinal cortex volumes.
2.4. Statistical Analyses. Summary statistics were calculatedto describe the sample characteristics in the ADNI and QDstudies. For each study, Chi-square and t -tests were used
7/17/2019 A Two-Study Comparison of Clinical and MRI Markers
http://slidepdf.com/reader/full/a-two-study-comparison-of-clinical-and-mri-markers 3/9
International Journal of Alzheimer’s Disease 3
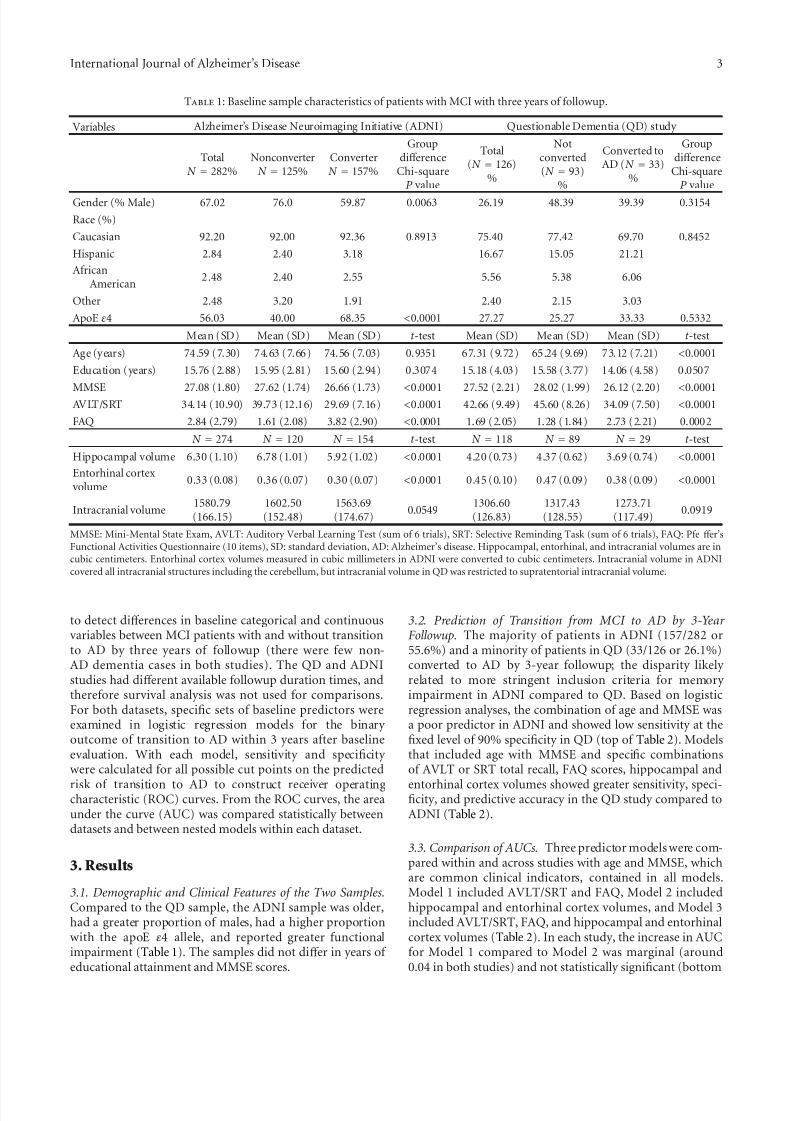
Table 1: Baseline sample characteristics of patients with MCI with three years of followup.
Variables Alzheimer’s Disease Neuroimaging Initiative (ADNI) Questionable Dementia (QD) study
TotalN = 282%
NonconverterN = 125%
ConverterN = 157%
Groupdiff erence
Chi-squareP value
Total(N = 126)
%
Notconverted(N = 93)
%
Converted toAD (N = 33)
%
Groupdiff erence
Chi-squareP value
Gender (% Male) 67.02 76.0 59.87 0.0063 26.19 48.39 39.39 0.3154
Race (%)
Caucasian 92.20 92.00 92.36 0.8913 75.40 77.42 69.70 0.8452
Hispanic 2.84 2.40 3.18 16.67 15.05 21.21
AfricanAmerican
2.48 2.40 2.55 5.56 5.38 6.06
Other 2.48 3.20 1.91 2.40 2.15 3.03
ApoE ε4 56.03 40.00 68.35 <0.0001 27.27 25.27 33.33 0.5332
Mean (SD) Mean (SD) Mean (SD) t -test Mean (SD) Mean (SD) Mean (SD) t -test
Age (years) 74.59 (7.30) 74.63 (7.66) 74.56 (7.03) 0.9351 67.31 (9.72) 65.24 (9.69) 73.12 (7.21) <0.0001
Education (years) 15.76 (2.88) 15.95 (2.81) 15.60 (2.94) 0.3074 15.18 (4.03) 15.58 (3.77) 14.06 (4.58) 0.0507
MMSE 27.08 (1.80) 27.62 (1.74) 26.66 (1.73) <0.0001 27.52 (2.21) 28.02 (1.99) 26.12 (2.20) <0.0001AVLT/SRT 34.14 (10.90) 39.73 (12.16) 29.69 (7.16) <0.0001 42.66 (9.49) 45.60 (8.26) 34.09 (7.50) <0.0001
FAQ 2.84 (2.79) 1.61 (2.08) 3.82 (2.90) <0.0001 1.69 (2.05) 1.28 (1.84) 2.73 (2.21) 0.0002
N = 274 N = 120 N = 154 t -test N = 118 N = 89 N = 29 t -test
Hippocampal volume 6.30 (1.10) 6.78 (1.01) 5.92 (1.02) <0.0001 4.20 (0.73) 4.37 (0.62) 3.69 (0.74) <0.0001
Entorhinal cortex volume
0.33 (0.08) 0.36 (0.07) 0.30 (0.07) <0.0001 0.45 (0.10) 0.47 (0.09) 0.38 (0.09) <0.0001
Intracranial volume 1580.79
(166.15)1602.50(152.48)
1563.69(174.67)
0.0549 1306.60
(126.83)1317.43(128.55)
1273.71(117.49)
0.0919
MMSE: Mini-Mental State Exam, AVLT: Auditory Verbal Learning Test (sum of 6 trials), SRT: Selective Reminding Task (sum of 6 trials), FAQ: Pfe ff er’sFunctional Activities Questionnaire (10 items), SD: standard deviation, AD: Alzheimer’s disease. Hippocampal, entorhinal, and intracranial volumes are incubic centimeters. Entorhinal cortex volumes measured in cubic millimeters in ADNI were converted to cubic centimeters. Intracranial volume in ADNIcovered all intracranial structures including the cerebellum, but intracranial volume in QD was restricted to supratentorial intracranial volume.
to detect diff erences in baseline categorical and continuousvariables between MCI patients with and without transitionto AD by three years of followup (there were few non-AD dementia cases in both studies). The QD and ADNIstudies had diff erent available followup duration times, andtherefore survival analysis was not used for comparisons.For both datasets, specific sets of baseline predictors wereexamined in logistic regression models for the binary outcome of transition to AD within 3 years after baselineevaluation. With each model, sensitivity and specificity were calculated for all possible cut points on the predicted
risk of transition to AD to construct receiver operatingcharacteristic (ROC) curves. From the ROC curves, the areaunder the curve (AUC) was compared statistically betweendatasets and between nested models within each dataset.
3. Results
3.1. Demographic and Clinical Features of the Two Samples.Compared to the QD sample, the ADNI sample was older,had a greater proportion of males, had a higher proportionwith the apoE ε4 allele, and reported greater functionalimpairment (Table 1). The samples did not diff er in years of educational attainment and MMSE scores.
3.2. Prediction of Transition from MCI to AD by 3-Year Followup. The majority of patients in ADNI (157/282 or55.6%) and a minority of patients in QD (33/126 or 26.1%)converted to AD by 3-year followup; the disparity likely related to more stringent inclusion criteria for memory impairment in ADNI compared to QD. Based on logisticregression analyses, the combination of age and MMSE wasa poor predictor in ADNI and showed low sensitivity at thefixed level of 90% specificity in QD (top of Table 2). Modelsthat included age with MMSE and specific combinationsof AVLT or SRT total recall, FAQ scores, hippocampal and
entorhinal cortex volumes showed greater sensitivity, speci-ficity, and predictive accuracy in the QD study compared toADNI (Table 2).
3.3. Comparison of AUCs. Three predictor models were com-pared within and across studies with age and MMSE, whichare common clinical indicators, contained in all models.Model 1 included AVLT/SRT and FAQ, Model 2 includedhippocampal and entorhinal cortex volumes, and Model 3included AVLT/SRT, FAQ, and hippocampal and entorhinalcortex volumes (Table 2). In each study, the increase in AUCfor Model 1 compared to Model 2 was marginal (around0.04 in both studies) and not statistically significant (bottom

7/17/2019 A Two-Study Comparison of Clinical and MRI Markers
http://slidepdf.com/reader/full/a-two-study-comparison-of-clinical-and-mri-markers 4/9
4 International Journal of Alzheimer’s Disease
Table 2: Predictive accuracy of specific combinations of predictor variables for classification of transition to Alzheimer’s disease (AD) by 3 years of followup in two independent samples (ADNI and QD) of older adults with Mild Cognitive Impairment, and comparisons of threepredictor models.
ADNI QD
Model Predictor variables AUC (SE)Sensitivity atspecificity =80% (90%)
Correct
classification % AUC (SE)
Sensitivity atspecificity =80% (90%)
Correct
classification %
Age 0.497 12.74 (5.73) 55.67 0.739 52.61 (29.85) 73.02
MMSE 0.655 37.88 (19.20) 65.54 0.778 41.41 (26.79) 76.00
Hippocampal vol. 0.725 48.05 (34.42) 64.60 0.753 62.07 (41.38) 80.51
Entorhinal volume 0.718 50.65 (35.71) 67.16 0.773 67.86 (50.00) 80.34
AVLT 0.756 49.47 (25.16) 44.33 0.849 71.63 (53.13) 80.00
FAQ 0.738 49.05 (35.90) 44.33 0.708 45.46 (32.83) 75.42
Age, MMSE 0.659 36.94 (18.79) 63.48 0.821 72.73 (39.39) 76.00
Hippocampal andentorhinal volumes
0.744 55.84 (35.71) 68.98 0.824 67.86 (67.86) 88.03
AVLT/SRT and FAQ 0.811 62.74 (42.68) 72.70 0.879 78.13 (59.38) 82.05
Model 1 Age, MMSE, AVLT/SRT
and FAQ 0.828 (0.024) 73.25 (49.05) 73.40 0.921 (0.027) 90.63 (81.25) 87.07
Model 2Age, MMSE,Hippocampal andentorhinal volumes
0.783 (0.028) 57.79 (40.26) 73.72 0.866 (0.046) 82.14 (71.43) 87.07
Model 3Age, MMSE, AVLT/SRT,FAQ, Hippocampal andentorhinal volumes
0.865 (0.022) 75.33 (55.20) 77.01 0.940 (0.027) 92.59 (88.89) 89.72
Model comparisons AUC diff erence P value AUCdiff erence
P value
Model 1 versus Model 2 0.0396 0.2271 0.0428 0.3618
Model 1 versus Model 3 0.0428 0.0035∗∗ 0.0282 0.1979
Model 2 versus Model 3 0.0824 0.0001∗∗ 0.0710 0.0254∗
A threshold of 0.5 was used on predicted risk derived from the logistic regression models. Area under the curve (AUC) was derived from receiver operatingcharacteristic (ROC) analyses. N = 282 (157 converters) in ADNI and N = 126 (33 converters) in QD. The diff erences between models in AUCs are slightly diff erent from the direct subtraction of AUCs between models because of missing data that ranged from 1% to 4% for the variables examined in ADNI and1% to 5% for the variables examined in QD.∗P < 0.05, ∗∗P < 0.01.
of Table 2). The AUC increased consistently across thetwo studies when episodic verbal memory (AVLT/SRT)and function (FAQ) measures were added to the modelcontaining the combination of age, MMSE, and hippocampaland entorhinal cortex volumes (P < 0.0001 in ADNI and P =
0.0254 in QD; Model 2 versus Model 3, bottom of Table 2and Figure 1), with an appreciable increase in sensitivity fora fixed specificity of 80% and 90% in both ADNI (increasesof 17% and 15%, resp.) and QD (increases of 10% and17%, resp.; top of Table 2 and Figure 1). Conversely, addinghippocampal and entorhinal cortex volumes to AVLT/SRT,FAQ, age, and MMSE significantly increased the AUC inADNI (P = 0.0035) but not in QD (P = 0.20) and led toa small increase in sensitivity for a fixed specificity of 80%and 90% in ADNI (increases of 2% and 6%, resp.) and QD(increases of 2% and 7%, respectively, top of Table 2).
In both samples, the diff erences in AUCs between thethree statistical models examined were very similar (bottom
of Table 2). Analyses of all combinations of predictors exam-ined are in the supplemental Table 3. (see Supplementary Material available online at doi: 10.1155/2012/483469).
When the QD sample was restricted to patients withbaseline amnestic MCI (32/90 transitioned to AD) using
comparable criteria to ADNI inclusion criteria for amnesticMCI, the results were similar to the entire QD sample: 80.7%were correctly classified for Model 1, 85.5% for Model 2, and84.2% for Model 3. AUCs were 0.877 for Model 1, 0.905 inModel 2, and 0.915 in Model 3 without significant diff erencesin AUCs, partly because of reduced sample size.
4. Discussion
Within each sample, QD and ADNI, the diff erences inAUCs between predictor models were similar, suggestingrobustness and generalizability across outpatient settings.

7/17/2019 A Two-Study Comparison of Clinical and MRI Markers
http://slidepdf.com/reader/full/a-two-study-comparison-of-clinical-and-mri-markers 5/9
International Journal of Alzheimer’s Disease 5
0
0.2
0.4
0.6
0.8
1
0 0.2 0.4 0.6 0.8 1
1-specificity
S e n s i t i v i t y
ADNI study
(a)
0 0.2 0.4 0.6 0.8 1
0
0.2
0.4
0.6
0.8
1
1-specificity
S e n s i t i v i t y
QD study
(b)
Figure 1: Comparison of receiver operating characteristic (ROC curves) for three statistical models in the ADNI and QD studies. Model 1(red line) contained age, MMSE, AVLT/SRT and FAQ, Model 2 (blue line) contained age, MMSE, hippocampal and entorhinal cortex volumes, and Model 3 (green line) contained age, MMSE, AVLT/SRT, FAQ, hippocampal and entorhinal cortex volumes. The vertical linesat 80% specificity (0.2 on x -axis) indicate 20% false positives.
When advising patients and families about the likelihoodof transition from MCI to AD, a predictor model withspecificity over 80% is essential because a false positive rate of over 20% (specificity less than 80%) is clinically unacceptable[14, 15]. In the predictor model, adding hippocampaland entorhinal cortex atrophy to age, MMSE, and theepisodic verbal memory and function measures increasedsensitivity only to a small extent at fixed specificities of 80% and 90%. These findings suggest limited added utility for MRI hippocampal and entorhinal cortex volumes toclinical assessment of memory and function in predictingtransition from MCI to AD. In contrast, adding measuresof episodic verbal memory and function to the model thatcombined age, MMSE, and hippocampal and entorhinalcortex volumes appreciably increased sensitivity for fixedlevels of 80% and 90% specificity in both samples. Inboth studies, the model that included AVLT/SRT, FAQ, and
hippocampal and entorhinal cortex volumes with age andMMSE showed the strongest predictive accuracy.
For episodic verbal memory measures, numerical rangesand cutoff s for specific ages and education levels can informthe likelihood of transition to AD. Although delayed recalldeficit is typical in AD, both immediate recall (incorporateslearning) and delayed recall show comparable predictiveaccuracy for the transition from MCI to AD [4]. The use of a single episodic memory measure in the predictor modelsexamined does not replace the need for a comprehensiveneuropsychological evaluation for diagnostic purposes [4].Informant reports of FAQ scores reflect instrumental, social,and cognitive functional impairments, but specific cutoff s
for prediction of transition to AD are not established[5, 16]. International eff orts to standardize MRI imagingparameters and methods of volumetric assessment [17], bothof which have varied widely across studies, may lead tothe development of specific cutoff s for hippocampal andentorhinal cortex atrophy that improve predictive accuracy.
The use of cognitive markers has some advantages overneuroimaging: objectivity in scoring, comparative economy in expense and time, and reliability. One argument is thatepisodic verbal memory should not be used as a markerbecause it is used for inclusion criteria and in the diagnosticprocess. However, evaluation of severity of episodic verbalmemory deficit as a predictor in patients with amnestic MCIwho have episodic verbal memory deficits is analogous tothe established strategy of evaluating severity of depressionas a predictor of clinical course and treatment response inmajor depression [18]. Further, using memory test scores
in prediction creates a statistical handicap, rather than anadvantage, by restricting the range in baseline memory testperformance [12]. Of note, the AVLT memory measureexamined as a predictor in this paper was not part of thestudy inclusion criteria in ADNI (WMS-R logical memory was used). The same rationale applies to the incorporationof the MMSE, which is widely used and clinically relevant,in predictor analyses even though it is part of the screeningcriteria for study inclusion.
Informant report of functional impairment using theFAQ was not part of the inclusion criteria in either QD orADNI, and the definition of MCI by the original Peters-en criteria requires the absence of significant functional
7/17/2019 A Two-Study Comparison of Clinical and MRI Markers
http://slidepdf.com/reader/full/a-two-study-comparison-of-clinical-and-mri-markers 6/9
6 International Journal of Alzheimer’s Disease
impairment [1, 2]. Therefore, the use of informant reportof functional impairment is independent of the diagnosticcriteria for MCI, and our findings indicate that this type of assessment is important in predicting transition to AD [3, 5].
Clinical and neurobiological markers have been incor-porated recently into diagnostic classification systems. An
international panel used the terms “prodromal dementia”and “predementia” to indicate that neurobiological markersmay identify patients with incipient AD who cannot bediagnosed clinically [19]. The new NIA diagnostic criteriaseparate core clinical criteria from research criteria thatemploy neurobiological markers [20], partly because diag-nostic and predictive accuracy for neurobiological markershas not been fully developed and validated. Our resultsemphasize the need for such validation.
There have been few comparisons of predictor modelsbetween studies. In a comparison of ADNI to a Finnish study,classification performance did not increase after the inclu-sion of 10 variables that included CSF measures, apolipopro-tein E ε4, MRI measures, age, and education [21]. The overallmodel was not strong, possibly because key cognitive andfunctional measures were excluded. Another study compareddiff erent samples of patients with MCI who had 18 FDG PETwith generally positive results [22] but without cut-pointsfor clinical application. Our report represents a novel inde-pendent validation of predictor models that included clinical,memory, functional, and MRI measures. The consistency inthe diff erences between models in each study indicates thatthis two-study comparison is broader and more clinically relevant than prior validation attempts [21, 22].
From the ADNI database, several reports show moderatepredictive accuracy for weighted scores within a globalcognitive test [23] and moderately strong predictive accuracy for specific neuropsychological test scores [24], consistentwith other studies [4]. The best possible fit from a high-dimensional pattern classification approach using ADNIMRI data [25] led to results similar to our report thatused volumetric measures, but other MRI analytic strategiesusing ADNI data have led to lower predictive accuracy [26, 27]. Entorhinal cortex volume enhanced prediction inboth ADNI and QD in our comparisons, supporting theevaluation of entorhinal cortex volume as a predictor [7].
There were some limitations to this paper. The twosamples diff ered in sex and age distribution and cognitivetest scores, significant episodic verbal memory deficits wererequired in ADNI compared to broader inclusion criteria
in QD that may partly account for higher transition ratesin ADNI, and diff erent episodic verbal memory measuresand diff erent MRI volumetric assessment methods werecompared. Nonetheless, within each sample for severalcombinations of predictors the diff erences in AUCs weresimilar. The high transition rate in ADNI suggests thatsome patients diagnosed with MCI by 3-year followup may convert in subsequent years, likely leading to a higher rate of false negatives in ADNI. This may partly explain the loweraccuracy for predictor combinations in ADNI. In ADNI, thesmaller number of patients at 3-year followup was partly related to some recently recruited patients not yet havinghad the opportunity to reach 3-year followup at the time
of data analysis for this paper. This issue also precluded theuse of survival analysis in this sample. In QD, we derivedthe strongest predictors from a set of a priori measuresin a large neuropsychological test battery and examinedcomparable measures from the shorter ADNI neuropsycho-logical assessment. While administering a comprehensive
neuropsychological test battery is important for diagnosticpurposes, our clinically relevant approach of examiningindividual measures facilitates comparison across studies anddemonstrates the predictive strength of even a single episodicverbal memory test. Baseline MRI measures were examinedbecause serial MRI measures were not available in QD.It remains unclear if serial imaging measures are superiorto baseline imaging in predicting long-term outcome [28].Serial imaging measures provide useful information aboutstructural changes associated with disease progression, butthey are expensive, not current clinical practice, and notuseful in early converters. Cerebrovascular disease may contribute to cognitive decline in these patients [19, 20].However, hyperintensities, lacunes, and infarcts could not beassessed systematically in QD because of the MRI sequencesobtained (no FLAIR or comparable sequence) and thereforecould not be compared with ADNI. Absent neuropathologi-cal validation, we considered examining CSF measures fromADNI (not done in QD) for in vivo validation of transitionto AD, but CSF was not collected in approximately half theADNI sample and neuropathological validation of CSF tauand A β abnormalities has not been established.
In QD, the pathophysiological measure [19] of olfactory identification deficits (not done in ADNI) strongly predictedtransition to AD with limited overlap in prediction with theSRT and MRI measures [3, 29]. In ADNI, 18FDG indices (notdone in QD) significantly predicted transition to AD andwere superior to the ADAS-cog [8], but the ADAS-cog is aglobal cognitive measure used primarily in clinical trials of AD patients and is not established as a strong predictor of transition from MCI to AD. PET amyloid imaging discrim-inates among AD, MCI, and controls [30] and correlates atautopsy with amyloid plaques [9]. However, approximately 10–30% of healthy controls show increased amyloid uptake[30] and whether these subjects have incipient AD needsconfirmation in long-term followup studies. The sensitivity and specificity of CSF levels of A β42 and tau/phospho tau,and their ratio, for predicting MCI transition to AD in ADNI[31] and in a European multicenter study [32] ranged from65% to 75%, which is slightly lower than that in other reports
[10, 11]. For CSF markers, further refinement of assay technique and validation in long-term followup studies areneeded to establish more definitive cut-points for individualand ratio measures that have varied to some extent acrossstudies [10, 11, 32].
This report suggests that volumetric evaluation of medialtemporal lobe atrophy adds only marginally to the informa-tion obtained by cognitive testing and assessment of episodicmemory, and it cannot yet be recommended for wide clinicaluse to assess the risk of patients with MCI being diagnosedwith AD during followup. In the clinic, visual inspectionratings are likely to lead to lower predictive accuracy thaneither the QD or ADNI volumetric assessments. Structural

7/17/2019 A Two-Study Comparison of Clinical and MRI Markers
http://slidepdf.com/reader/full/a-two-study-comparison-of-clinical-and-mri-markers 7/9
International Journal of Alzheimer’s Disease 7
neuroimaging with MRI remains useful to rule out specificcauses of cognitive impairment, for example, stroke, tumor.A key conclusion from this report is that conducting neu-ropsychological evaluation is important, and interviewingfamily members or other informants about the patient’sfunctioning may be at least as important as conducting
an MRI scan. Several clinical and neurobiological markers,including cognitive test scores, functional ability, and MRIand 18FDG PET measures, are influenced considerably by ageand other demographic factors, and their utility needs to beevaluated in more heterogeneous samples. The comparativepredictive utility of clinical and neurobiological markersneeds further assessment across diff erent populations asthese measures improve in predictive accuracy.
Disclosure
Data used in the preparation of this paper includeddata obtained from the Alzheimer’s Disease NeuroimagingInitiative (ADNI) database (http://adni.loni.ucla.edu/). Assuch, the investigators within the ADNI contributed tothe design and implementation of ADNI and/or provideddata but did not participate in analysis or writing of thisreport. Complete listing of ADNI investigators is available athttp://adni.loni.ucla.edu/.
Acknowledgments
Data collection and sharing for this project was fundedby the Alzheimer’s Disease Neuroimaging Initiative (ADNI)(National Institutes of Health Grant U01 AG024904). ADNIis funded by the National Institute on Aging, the NationalInstitute of Biomedical Imaging and Bioengineering, andthrough generous contributions from the following: Abbott,AstraZeneca AB, Bayer Schering Pharma AG, Bristol-Myers Squibb, Eisai Global Clinical Development, ElanCorporation, Genentech, GE Healthcare, GlaxoSmithKline,Innogenetics, Johnson and Johnson, Eli Lilly and Co.,Medpace, Inc., Merck and Co., Inc., Novartis AG, PfizerInc, F. Hoff man-La Roche, Schering-Plough, Synarc, Inc.,and Wyeth, as well as nonprofit partners the Alzheimer’sAssociation and Alzheimer’s Drug Discovery Foundation,with participation from the U.S. Food and Drug Adminis-tration. Private sector contributions to ADNI are facilitated
by the Foundation for the National Institutes of Health(http:/www.fnih.org/). The Grantee organization is theNorthern California Institute for Research and Education,and the study is coordinated by the Alzheimer’s DiseaseCooperative Study at the University of California, San Diego.ADNI data are disseminated by the Laboratory for NeuroImaging at the University of California, Los Angeles. TheADNI study research was also supported by NIH Grants P30AG010129, K01 AG030514, 5R00NS060766, and the DanaFoundation. Dr. Y. Stern was the Columbia University siteprincipal investigator in the ADNI study. The QD study research was supported by NIH Grant R01AG17761 (Dr. D.P. Devanand), and Dr. P. J. Brown’s eff ort was supported by
NIH Grant T32 MH20004. and Dr. E. D. Huey’s eff ort wassupported by NIH Grant 5R00NS060766.
References
[1] R. C. Petersen, G. E. Smith, S. C. Waring, R. J. Ivnik, E.
G. Tangalos, and E. Kokmen, “Mild cognitive impairment:clinical characterization and outcome,” Archives of Neurology ,vol. 56, no. 3, pp. 303–308, 1999.
[2] R. C. Petersen, G. E. Smith, S. C. Waring, R. J. Ivnik, E.G. Tangalos, and E. Kokmen, “Erratum: Mild cognitive im-pairment: clinical characterization and outcome,” Archives of
Neurology , vol. 56, no. 6, p. 760, 1999.
[3] D. P. Devanand, X. Liu, M. H. Tabert et al., “Combining early markers strongly predicts conversion from mild cognitiveimpairment to Alzheimer’s disease,” Biological Psychiatry , vol.64, no. 10, pp. 871–879, 2008.
[4] M. H. Tabert, J. J. Manly, X. Liu et al., “Neuropsychologicalprediction of conversion to Alzheimer disease in patients withmild cognitive impairment,” Archives of General Psychiatry ,
vol. 63, no. 8, pp. 916–924, 2006.[5] M. H. Tabert, S. M. Albert, L. Borukhova-Milov et al., “Func-
tional deficits in patients with mild cognitive impairment:prediction of AD,” Neurology , vol. 58, no. 5, pp. 758–764, 2002.
[6] C. R. Jack Jr., D. S. Knopman, W. J. Jagust et al., “Hypotheticalmodel of dynamic biomarkers of the Alzheimer’s pathologicalcascade,” The Lancet Neurology , vol. 9, no. 1, pp. 119–128,2010.
[7] D. P. Devanand, G. Pradhaban, X. Liu et al., “Hippocampaland entorhinal atrophy in mild cognitive impairment: predic-tion of Alzheimer disease,” Neurology , vol. 68, no. 11, pp. 828–836, 2007.
[8] S. M. Landau, D. Harvey, C. M. Madison et al., “Comparingpredictors of conversion and decline in mild cognitive impair-
ment,” Neurology , vol. 75, no. 3, pp. 230–238, 2010.[9] C. M. Clark, J. A. Schneider, B. J. Bedell et al., “Use of
florbetapir-PET for imaging beta-amyloid pathology,” Journal of the American Medical Association, vol. 305, no. 3, pp. 275–283, 2011.
[10] O. Hansson, H. Zetterberg, P. Buchhave, E. Londos,K. Blennow, and L. Minthon, “Association between CSFbiomarkers and incipient Alzheimer’s disease in patients withmild cognitive impairment: a follow-up study,” The Lancet
Neurology , vol. 5, no. 3, pp. 228–234, 2006.
[11] P. J. Visser, F. Verhey, D. L. Knol et al., “Prevalence andprognostic value of CSF markers of Alzheimer’s diseasepathology in patients with subjective cognitive impairmentor mild cognitive impairment in the DESCRIPA study: a
prospective cohort study,” The Lancet Neurology , vol. 8, no. 7,pp. 619–627, 2009.
[12] B. Schmand, H. M. Huizenga, and W. A. van Gool, “Meta-analysis of CSF and MRI biomarkers for detecting preclinicalAlzheimer’s disease,” Psychological Medicine, vol. 40, no. 1, pp.135–145, 2010.
[13] B. Winblad, K. Palmer, M. Kivipelto et al., “Mild cognitiveimpairment—beyond controversies, towards a consensus:report of the international working group on mild cognitiveimpairment,” Journal of Internal Medicine, vol. 256, no. 3, pp.240–246, 2004.
[14] Consensus report of the Working Group, “Molecular andbiochemicalmarkers of Alzheimer’s disease,” Neurobiology of
Aging , vol. 19,no. 2, pp. 109–116, 1998, The Ronald andNancy

7/17/2019 A Two-Study Comparison of Clinical and MRI Markers
http://slidepdf.com/reader/full/a-two-study-comparison-of-clinical-and-mri-markers 8/9
8 International Journal of Alzheimer’s Disease
Reagan Research Institute of the Alzheimer’s Association andthe National Institute on Aging Working Group.
[15] Consensus report of the Working Group, “Molecular andBiochemical Markers of Alzheimer’s Disease,” Neurobiology of Aging , vol. 19, no. 3, p. 285, 1998, Erratum: The Ronaldand Nancy Reagan Research Institute of the Alzheimer’sAssociation and the National Institute on Aging Working
Group.[16] P. J. Brown, D. P. Devanand, X. Liu, and E. Caccappolo,
“Functional impairment in elderly patients with mild cog-nitive impairment and mild Alzheimer disease,” Archives of General Psychiatry , vol. 68, no. 6, pp. 617–626, 2011.
[17] G. B. Frisoni, N. C. Fox, C. R. Jack Jr., P. Scheltens, and P. M.Thompson, “The clinical use of structural MRI in Alzheimerdisease,” Nature Reviews Neurology , vol. 6, no. 2, pp. 67–77,2010.
[18] L. S. Schneider, J. C. Nelson, C. M. Clary et al., “An8-week multicenter, parallel-group, double-blind, placebo-controlled study of sertraline in elderly outpatients with majordepression,” American Journal of Psychiatry , vol. 160, no. 7, pp.1277–1285, 2003.
[19] B. Dubois, H. H. Feldman, C. Jacova et al., “Revising thedefinition of Alzheimer’s disease: a new lexicon,” The Lancet
Neurology , vol. 9, no. 11, pp. 1118–1127, 2010.[20] M. S. Albert, S. T. DeKosky, D. Dickson et al., “The diagnosis
of mild cognitive impairment due to Alzheimer’s disease:recommendations from the national institute on aging-Alzheimer’s association workgroups on diagnostic guidelinesfor Alzheimer’s disease,” Alzheimer’s and Dementia, vol. 7, no.3, pp. 270–279, 2011.
[21] M. van Gils, J. Koikkalainen, J. Mattila, S. K. Herukka,J. Lotjonen, and H. Soininen, “Discovery and use of effi-cient biomarkers for objective disease state assessment inAlzheimer’s disease,” in Proceedings of the IEEE Engineering in Medicine and Biology Society , vol. 2010, pp. 2886–2889,
September 2010.[22] C. Haense, K. Herholz, W. J. Jagust, and W. D. Heiss,“Performance of FDG PET for detectionof Alzheimer’s diseasein two independent multicentre samples (NEST-DD andADNI),” Dementia and Geriatric Cognitive Disorders, vol. 28,no. 3, pp. 259–266, 2009.
[23] D. A. Llano, G. Laforet, and V. Devanarayan, “Derivationof a new ADAS-cog composite using tree-based multivariateanalysis: prediction of conversion from mild cognitive impair-ment to alzheimer disease,” Alzheimer Disease and Associated Disorders, vol. 25, no. 1, pp. 73–84, 2011.
[24] M. Ewers, C. Walsh, J. Q. Trojanowski, and North Amer-ican Alzheimer’s Disease Neuroimaging Initiative (ADNI),“Prediction of conversion from mild cognitive impairmentto Alzheimer’s disease dementia based upon biomarkers and
neuropsychological test performance,” Neurobiology of Aging .In press.
[25] C. Misra, Y. Fan, and C. Davatzikos, “Baseline and longitudi-nal patterns of brain atrophy in MCI patients, and their usein prediction of short-term conversion to AD: results fromADNI,” NeuroImage, vol. 44, no. 4, pp. 1415–1422, 2009.
[26] R. Cuingnet, E. Gerardin, J. Tessieras et al., “Automatic clas-sification of patients with Alzheimer’s disease from structuralMRI: a comparison of ten methods using the ADNI database,”
NeuroImage, vol. 56, no. 2, pp. 766–781, 2011.[27] R. Wolz, R. A. Heckemann, P. Aljabar et al., “Measurement
of hippocampal atrophy using 4D graph-cut segmentation:application to ADNI,” NeuroImage, vol. 52, no. 1, pp. 109–118,2010.
[28] E. A. Murphy, D. Holland, M. Donohue et al., “Six-monthatrophy in MTL structures is associated with subsequentmemory decline in elderly controls,” NeuroImage, vol. 53, no.4, pp. 1310–1317, 2010.
[29] M. H. Tabert, X. Liu, R. L. Doty et al., “A 10-item smellidentification scale related to risk for Alzheimer’s disease,”
Annals of Neurology , vol. 58, no. 1, pp. 155–160, 2005.
[30] M. A. Mintun, G. N. Larossa, Y. I. Sheline et al., “[11C]PIBin a nondemented population: potential antecedent markerof Alzheimer disease,” Neurology , vol. 67, no. 3, pp. 446–452,2006.
[31] G. De Meyer, F. Shapiro, H. Vanderstichele et al., “Diagnosis-independent Alzheimer disease biomarker signature in cogni-tively normal elderly people,” Archives of Neurology , vol. 67,no. 8, pp. 949–956, 2010.
[32] N. Mattsson, H. Zetterberg, O. Hansson et al., “CSF biomark-ers and incipient Alzheimer disease in patients with mildcognitive impairment,” Journal of the American Medical Asso-ciation, vol. 302, no. 4, pp. 385–393, 2009.

7/17/2019 A Two-Study Comparison of Clinical and MRI Markers
http://slidepdf.com/reader/full/a-two-study-comparison-of-clinical-and-mri-markers 9/9
Submit your manuscripts at
http://www.hindawi.com