a two-century precipitation dataset for the continent of africa
TRANSCRIPT

AFFILIATIONS: NicholsoN, Dezfuli,* aND Klotter—Department of Earth, Ocean and Atmospheric Science, The Florida State University, Tallahassee, Florida*CurreNT AFFILIATION: Department of Earth and Planetary Sciences, Johns Hopkins University, Baltimore, MarylandCOrreSPONDING AuTHOr: Sharon Nicholson, EOAS—Meteorology, The Florida State University, P.O. Box 3064520, Tallahassee, FL 32306-4520E-mail: [email protected]
The abstract for this article can be found in this issue, following the table of contents.DOI:10.1175/BAMS-D-11-00212.1
In final form 21 February 2012©2012 American Meteorological Society
Extensive historical climate information for Africa survives, allowing production of
a semiquantitative precipitation dataset for the nineteenth century to
add to the more modern gauge data.
I t is commonly believed that in Africa the instru- mental record began later than in most continents. While the interior was not well represented until
the 1920s or later, a large number of stations, par-ticularly those near the coast, go back much further. Africa was a hub of activity in the nineteenth century, the focus of dozens of explorers and geographical expeditions as several European colonial powers struggled for power throughout the continent. Climate and weather were of particular interest to many of them. The French, Belgians, British, Italians,
Portuguese, Germans, and Spanish left behind a wealth of meteorological information. This consists of both gauge data and verbal reports of weather conditions.
The purpose of this article is twofold. One is to demonstrate that a lengthy record of precipitation is available for Africa. The second is to describe several new datasets that are now available to the scientific community. These include a compilation of all nineteenth-century gauge records available for Africa and several versions of a semiquantita-tive dataset that combines these gauge records with proxy indicators, such as documentary information and hydrological records. In the latter, statistical methods were utilized to augment the spatial cov-erage, so that all of Africa is covered from 1801 to 1900. When gauge data for the twentieth century are added, the result is a two-century record of rainfall variability for 90 regions of Africa. The final dataset and the data used to produce it are available from the National Oceanic and Atmospheric Administration’s (NOAA’s) World Data Center for Paleoclimatology.
GAuGe DATA. The African precipitation records for the nineteenth century are of three main types. The most readily usable type consists of continuous station records for modern stations that began
A TWO-CENTURY PRECIPITATION DATASET FOR THE CONTINENT OF AFRICA
by sharoN e. NicholsoN, amiN K. Dezfuli, aND Douglas Klotter
1219august 2012aMERICaN MEtEOROLOgICaL sOCIEtY |
sometime in that century. Many such stations exist in Algeria, Tunisia, Senegal, Namibia, and South Africa. The second type consists of regular reporting stations established by colonial governments but generally abandoned with the departure of the colonial powers early in the twentieth century. Larger numbers of such stations existed in countries such as Togo and Tanzania, under German control, and Malawi, under British control. The third type consists of temporary nongovernmental observations, usually made at mission stations, explorers’ camps, and so on. In many cases, such as the ones described below, the observations covered many years.
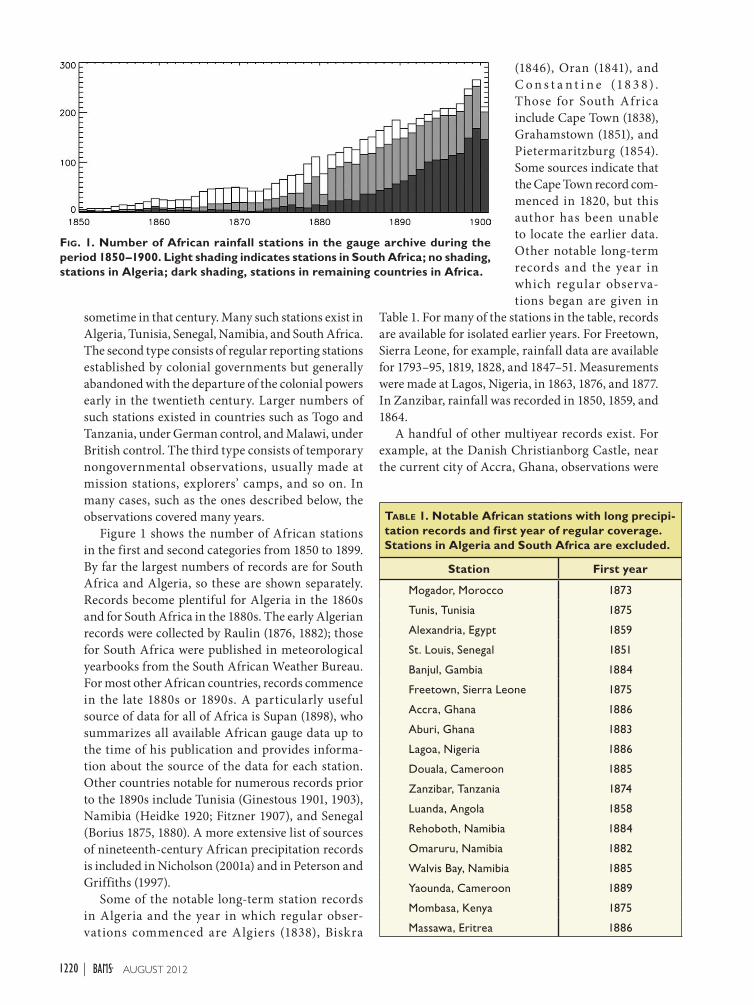
Figure 1 shows the number of African stations in the first and second categories from 1850 to 1899. By far the largest numbers of records are for South Africa and Algeria, so these are shown separately. Records become plentiful for Algeria in the 1860s and for South Africa in the 1880s. The early Algerian records were collected by Raulin (1876, 1882); those for South Africa were published in meteorological yearbooks from the South African Weather Bureau. For most other African countries, records commence in the late 1880s or 1890s. A particularly useful source of data for all of Africa is Supan (1898), who summarizes all available African gauge data up to the time of his publication and provides informa-tion about the source of the data for each station. Other countries notable for numerous records prior to the 1890s include Tunisia (Ginestous 1901, 1903), Namibia (Heidke 1920; Fitzner 1907), and Senegal (Borius 1875, 1880). A more extensive list of sources of nineteenth-century African precipitation records is included in Nicholson (2001a) and in Peterson and Griffiths (1997).
Some of the notable long-term station records in Algeria and the year in which regular obser-vations commenced are Algiers (1838), Biskra
(1846), Oran (1841), and C o n s t a n t i n e (18 3 8) . Those for South Africa include Cape Town (1838), Grahamstown (1851), and Pietermaritzburg (1854). Some sources indicate that the Cape Town record com-menced in 1820, but this author has been unable to locate the earlier data. Other notable long-term records and the year in which regular observa-tions began are given in
Table 1. For many of the stations in the table, records are available for isolated earlier years. For Freetown, Sierra Leone, for example, rainfall data are available for 1793–95, 1819, 1828, and 1847–51. Measurements were made at Lagos, Nigeria, in 1863, 1876, and 1877. In Zanzibar, rainfall was recorded in 1850, 1859, and 1864.
A handful of other multiyear records exist. For example, at the Danish Christianborg Castle, near the current city of Accra, Ghana, observations were
Table 1. Notable African stations with long precipi-tation records and first year of regular coverage. Stations in Algeria and South Africa are excluded.
Station First year
Mogador, Morocco 1873
Tunis, Tunisia 1875
Alexandria, Egypt 1859
St. Louis, Senegal 1851
Banjul, Gambia 1884
Freetown, Sierra Leone 1875
Accra, Ghana 1886
Aburi, Ghana 1883
Lagoa, Nigeria 1886
Douala, Cameroon 1885
Zanzibar, Tanzania 1874
Luanda, Angola 1858
Rehoboth, Namibia 1884
Omaruru, Namibia 1882
Walvis Bay, Namibia 1885
Yaounda, Cameroon 1889
Mombasa, Kenya 1875
Massawa, Eritrea 1886
Fig. 1. Number of African rainfall stations in the gauge archive during the period 1850–1900. Light shading indicates stations in South Africa; no shading, stations in Algeria; dark shading, stations in remaining countries in Africa.
1220 august 2012|

made during 1829–34 and 1839–42 (Table 2). Just to the north, at Aburi, Ghana, continuous records cover the years 1883–89. Although the accuracy of these two records cannot be verified and some values look questionable, the suggested occurrence of very dry years in the 1830s and wetter years in the 1840s is consistent with many other observations (Nicholson 1996) and with limnological evidence (Nicholson 2001a; Bessems et al. 2008; Verschuren et al. 2000).
Numerous multiyear records come from Senegal. Those for the French fort at Bakel cover the years 1856–62. At nearby Goree, an island near Dakar, where slaves were imprisoned prior to the trans-Atlantic passage, observations were made from 1854 to 1866. At St. Louis a French monk, Frère Constantin, made observations in 1830 and 1831, but apparently only the mean values for that period remain. At Podor, on the Senegal River, observations were made from 1857 to 1860 and again during 1873, 1874, and 1876.
The Germans, Portuguese, and Belgians made observations at many locations in western equato-rial Africa in the 1870s and 1880s. Examples are the records for Sao Salvador, Zaire, from 1883 to 1887, for Caconda, Angola, in 1889 and 1890, Punte de Lenha (Banana, French Congo) for 1882–91, Luluaburg, Zaire, for 1885–86, and Kinshasa, Zaire, for 1874–76. In Gabon observations were made at Sibange farm
from 1880 to 1884 and elsewhere from 1859 to 1860 and 1863. Data from Tete, Mozambique, cover the years 1859–61 and 1889–91.
Most of the stations mentioned above lie on or near the coast. It took much longer for inland Africa to be well represented meteorologically. Regular observa-tions began at networks of stations in the 1890s in the former British, German, and Portuguese colonies of Tanganyika (Tanzania), Mozambique, Kenya, Uganda, Northern Rhodesia (Zambia), Southern Rhodesia (Zimbabwe), and Nyasaland (Malawi). Elsewhere records generally exist for only isolated years: Fort Kita, Mali, in 1882; Bamako, Mali, in 1883; and Livingstonia, Malawi, in 1876 and 1877. Inland observations were also made at several locations along the upper Nile: Rubaga, Tanzania, for 1878–81; Bukoba, Uganda, 1861–62; Natete, Uganda, 1879–85; Ribe, Kenya, 1876–77; Wadelai, Uganda, 1885–88; and Lado, Sudan, 1881–84, as well as a handful of other locations.
Figure 2 shows one example of regionally averaged gauge records from the Sahel of West Africa (roughly the area from 10° to 25°N, and from the Atlantic coast to 25°E). This curve was produced by adding modern gauge records to the nineteenth-century dataset. The curve shows a dominance of wet years in the mid- to late nineteenth century and underscores how unusual the post-1960s drought years appear to be. However,
Table 2. excerpt from the precipitation data archive. The first entry for each station includes geographical coordinates, elevation, and region number. The second line contains a mean by month and year (mm), and the third line contains a standard deviation of precipitation totals by month and year (mm). The remaining lines give monthly totals, January–December, for individual years, plus an annual total. An entry of 9999 indicates missing values.
1221august 2012aMERICaN MEtEOROLOgICaL sOCIEtY |

other evidence shows that the early years of the nineteenth century were similar to the more recent ones (see the section “Reconstruction of nineteenth-century continental precipitation”).
OTHer SOurCeS OF INFOrMATION. Explorers, settlers, and missionaries. The nineteenth century was a time of exploration and scientific in-quiry (Fig. 3). Africa was the hub of both for many European countries. At the same time, these countries vied for power and inf luence in Africa, and their clergy established mission stations throughout the sub-Saharan lands. In many cases, explorations were carried out by thrill-seekers vying to reach destina-tions such as the Mountains of the Moon, thought to be today’s Ruwenzori. In other cases, scientific expeditions were financed by governments or geo-graphical societies. Often prizes, medals, or legions of honor were offered to those successful in their quest. The reports of explorations and expeditions were vigorously published in scientific journals of the period. Particularly useful for meteorological data were Petermann’s Geogra-phische Mitteilungen and Meteorologische Zeitschrift, as well as the geographical journals of several national geographic societies.
A goal sought by many was reaching and returning from the fabled city of Timbuktu. The French Société de Géographie offered a prize of 10,000 francs to the first European traveler to return with de-tailed knowledge of the
city. The British off icer Major Gordon Laing, who is credited as being the first to reach Timbuktu, arrived in 1826 but he was mur-dered shortly thereafter. René Caillié reached the city in 1828 and returned to claim the French prize.
The explorers Richard Burton and John Speke set out on a quest for the Nile’s source in 1857, discovering both Lake Tanganyika and
Lake Victoria, which they correctly assumed was the river’s source. The German scholar Heinrich Barth set out to cross the Sahara from Tripoli in 1850. He returned in 1855, having traversed 12,000 miles, 24 degrees of latitude (across the Sahara to Cameroon), and 20 degrees of longitude (from Lake Chad to Timbuktu).
These explorations and expeditions were tre-mendous sources of meteorological information. In some cases the material was merely descriptive: references to famine or drought, the character of the year’s rainy season, or the state of a lake. However, many of the explorers, such as Barth (1859), kept day-by-day records of the weather, often including even temperature measurements (Fig. 4). Speke (1864) left behind rainfall measurements for Bukoba in the 1860s. The German expedition to the Loango district of the French Congo measured rainfall during the years 1873–76 (Danckelman 1884). Barth and many others left detailed descriptions and maps of Lake
Fig. 2. Multicentury record of Sahel rainfall based on gauges. units are standard deviations. Number of gauge records available per year is given at the bottom.
Fig. 3. African map from 1850, showing the routes of several explorers.
1222 august 2012|

Chad that allowed its levels to be reconstructed since at least the late eighteenth century (Pejml 1963; Maley 1973; Nicholson 1996). Because the lake’s spatial configuration and extent changes so much from year to year (Fig. 5), this information is extremely useful. Missionaries made measurements of the height of Lake Victoria over many years in the mid-nineteenth century (Nicholson 1998).
The explorations and expeditions provided transient and temporary records. Sources of more continuous and homogeneous reporting are the European settlers in various African countries and the numerous missionary stations, particularly those in the Anglophone countries. In many cases, the same mission station persisted for several decades. These sources generally give descriptive information on such things as famine, drought, the conditions of crops, unusual weather, and the status of vegetation and waterways. In some cases, rigorous observations and measurements were made. For example, the missionary A.M. Mackay kept an 8-yr record from Natete, Uganda (near Kampala).
Several authors have produced multidecadal climate chronologies for Africa from missionary records. These include chronologies for the Kalahari (Nash 1996; Nash and Endfield 2002a,b), Lesotho (Grab and Nash 2010; Nash and Grab 2010), and South Africa (Vogel 1989; Kelso and Vogel 2007).
Vogel (1989) validated her records for time periods with overlapping gauge data, supporting the accu-racy and credibility of the missionary reports. The missionary records in Africa have not, however, been fully exploited in terms of climate information. Much more is available, particularly for East Africa. Support for the validity of the documentary records also comes from correlations with El Niño and the Southern Oscillation (Kelso and Vogel 2007; Nash and Endfield 2008).
Local oral tradition. West Africa has a rich historical legacy that includes one of the oldest universities in the world. The University of Timbuktu (Fig. 6), established in the twelfth century, houses a wealth of Islamic manuscripts, including historical chronicles that detail the reigns of kings over many centuries. In most cases, the information came down as oral tradi-tion, first written down centuries later. Some of the better-known West African chronicles include those of Tichitt (Monteil 1939), Oualata and Nema (Marty 1921), the Wâlo empire (Monteil 1964), Timbuktu (Cissoko 1968), and the Bornu empire (Urvoy 1949). These cover empires that stretched across the Sahel from Mauritania to Lake Chad. Similar historical
works cover regions of the upper Nile such as Uganda (Webster 1979; Herring 1979). These provide invalu-able reports of famine, droughts, and agricultural failure or prosperity over centuries.
These written records are complemented by memories of the elders and of stories passed down over generations. Many such stories were passed on to European explorers and colonists of the eighteenth and nineteenth centuries. One example is an old man reporting to Barth in 1851 that in his youth one could travel by canoe from Lake Chad to the north of the country, tens of miles along a now dry waterway (Maley 1973). Reports from the mid-nineteenth cen-tury describe Lake Ngami, in northern Botswana, as a vast water body with waves strong enough to push hippos to shore. Photos and paintings from the period document its expanse (Fig. 7). However, around 1820 an old man told of a period during his youth when Lake Ngami, then a vast sheet of water, had completely
Fig. 4. A page from the meteorological diary of the German explorer Heinrich Barth, who traversed the Sahara from north to south.
1223august 2012aMERICaN MEtEOROLOgICaL sOCIEtY |

dried out. The old man told of a stream running through a grass plain, with trees along the banks.
Little credence was given to the story until Ngami once again dried out and the remnants of the streambed and trees became visible (Fig. 8).
While the validity of each indi-vidual report might be challenged, the key to producing a credible picture of historical climate is the convergence of evidence from vari-ous sources. Information from the late eighteenth century provides an excellent example. The explorer Mungo Park (1799), credited with being the first European to reach the Niger River, reported that in 1796 the rains in Bamako and Segou (Mali) did not begin until 19 June. Normally they begin sometime in May or even April. Jackson (1820) reported from Hausaland, in northwestern Nigeria,
that no significant rain had fallen during his 2-yr stay from 1793 to 1795. At Freetown (Sierra Leone) annual
Fig. 5. Photos of Lake Chad taken from space in four different years. The 1963 photo was taken by an astronaut. The others are from satellites. All photos courtesy of the National Aeronautics and Space Administration (NASA).
Fig. 6. The Sankoré mosque, one of three branches of the university of Timbuktu.
1224 august 2012|

rainfall in these same years averaged 2,000 mm, com-pared to a modern mean of 3,400 mm (Winterbottom 1969). According to oral tradition, within the period 1790–96 a drought forced the evacuation of Agadez in northern Niger and drought depleted the grain stores in Kano, in northern Nigeria. Chronicles of Bornu reported a severe drought near Lake Chad and the locals also reported that the lake began to fall rapidly about that time.
Hydrologic records. The documentary sources de-scribed above frequently include references to lake levels. For Africa, sufficient information exists to create nineteenth-century chronologies for 11 lakes spanning the latitudes 15°N–20°S. In some cases, such as Lakes Bosumtwi (Shanahan et al. 2008) and Turkana (Ricketts and Anderson 1998), lake cores provide annual or nearly annual resolution. In addition to the lakes, quantitative monthly records of Nile flow cover most of the nineteenth century, with gaps. These have the potential to provide a wealth
of information on precipitation. Unfortunately, the interpretation is complex and generally a hydrologic model of the lake or river is needed to produce estimates of precipitation.
An example of such a model is presented in Nicholson et al. (2000). The lake levels (Fig. 9) were “inverted” to utilize Lake Victoria as a giant rain gauge. The accuracy of the estimation of rainfall in the catchment was roughly within 3%. This model was applied to estimating nineteenth-century rainfall. During the arid interval early in the century,
rainfall in the catchment was on the order of 13% below normal, but on the order of 40% above normal in the mid-1870s (Nicholson and Yin 2001).
A most interesting result of the Lake Victoria model was to show that rainfall is reflected as the difference between the levels in a sequence of two years, not in the level of the lake itself. This is prob-ably the case for most of the other African lakes, but the response of the lake depends on the relative magnitude of the inputs and outputs. In the case of Lake Victoria, precipitation and evaporation are by far the largest terms.
The Nile is a special case. The centuries-long historical record is based on the Roda gauge, in Cairo (Toussoun 1925). It reflects a combination of f low from the Blue Nile, which flows out of the Ethiopia highlands, and the White Nile, which originates in equatorial Africa, with Lake Victoria as its source. Lamb (1966) suggested that the flood levels could be interpreted in terms of rainfall from the Ethiopian highlands, with the summer minimum ref lecting equatorial rainfall. However, both regions have some
Fig. 7. Lake Ngami sketch from David Livingstone (1857).
Fig. 8. A dry riverbed in the middle of a grassy plain that was formerly covered by Lake Ngami (Botswana).
Fig. 9. Fluctuations (m) of Lake Victoria since 1800. Years for which specific references are available are indicated at the bottom with dots. Years since 1896 are based on modern measurements, and earlier years are reconstructed from historical references (from Nicholson 1998).
1225august 2012aMERICaN MEtEOROLOgICaL sOCIEtY |

inf luence on both the maximum and minimum levels, which are also inf luenced by what occurs during the passage of the Nile waters across some 30 degrees of latitude.
Tree-ring records. Tree rings are excellent climate indicators on the historical time scale. For Africa, however, tree-ring analysis is limited by the fact that there are few locations where the trees have annual rings. Most of the dendroclimatological studies stem from Morocco, Tunisia, and Algeria (Touchan et al. 2008). However, some work has been done in Namibia (e.g., Trouet et al. 2001), Tanzania (Fichtler et al. 2004), and Zimbabwe (e.g., Therrell et al. 2006). The data from these studies are readily available at the NOAA World Data Center for Paleoclimatology website (www.ncdc.noaa.gov/paleo/). These data have not yet been incorporated into the dataset de-scribed in this article.
reCONSTruCTION OF NINeTeeNTH-CeNTurY CONTINeNTAL PreCIPITA-TION. The information available for examining nineteenth-century precipitation in Africa is largely fragmentary, especially prior to the 1890s. A meth-odology has been developed to utilize these diverse bits of information to construct semiquantitative indicators of precipitation for 90 regions of the con-tinent (Nicholson 2001a). The basis of the method is the use of regions that are homogeneous with respect to interannual variability. These regions are described in Nicholson (1986) and are evident in Fig. 11. A detailed explanation of the methodology is found in Nicholson et al. (2012). It is summarized in the following paragraphs.
A basic assumption is that information pertaining to any location within the region can be used to produce a precipitation time series representing the region. Also, because so much of the available material is descriptive rather than quantitative, a seven-class system is used to describe the “wetness” of the season. Each descriptive entry is subjectively fit into these classes, with the presence of key descrip-tors being used to distinguish the various categories. For example, a dry year might be classified as –1, but a –2 categorization requires explicit mention of a drought. An entry is classed as –3, severe drought, only if human consequences such as famine or migra-tion are mentioned. In this scheme, a zero denotes normal conditions and +1 to +3 indicate a range from good rains to anomalously wet then very wet. The last category does not occur frequently and often indicates a flood situation. Gauge data are likewise fit
into these same categories, using a transfer function based on standard deviations.
An example of the format of the documentary records is shown in Table 3, which contains entries for several years for the Niger Bend area. The entries include the rainfall region the entry fits into, the wetness class, the general geographical region, the year to which the entry pertains, and the entry itself. When feasible, geographical coordinates are given within the descriptive section. In some cases, a wetness class cannot be ascertained. Such entries are left in the archive but cannot be utilized in producing a precipitation dataset. An example is the second entry in Table 3.
The first step in producing regional averages is combining the various entries for each individual region. Once this is complete, some regional values are filled in based on linear correlation with nearby regions. Further detail on this step is given in Nicholson (2001a) and Nicholson et al. (2012). The correlation between many of the regions is exceed-ingly high. In filling in the spatial detail, acceptable regional substitutions have a correlation of at least 0.4 (based on roughly 100 years of data) with the missing region. This correlation far exceeds the 1% significance level. At this step, roughly half of the 90 regions are represented by the 1840s. By 1880 at least two-thirds of the regions are represented.
The last step in the reconstruction is to utilize statistics to fill in any remaining gaps in the record. A principal component (PC) method of climate field reconstruction, similar to that of Mann and Jones (2003), is used to identify the common modes of variability in the twentieth century. The degree of dominance of each mode is then determined for each year of the nineteenth century and values for missing regions are assigned, based on the eigenvector loadings for the PCs. The end result is a complete time series commencing in 1801 for each of the 90 regions. These represent annual values only. However, in some regions certain sea-sons dominate the annual signal (e.g., October–December in East Africa and March–May in much of southern Africa).
Only a few results are shown here. Figure 10 shows the entire nineteenth- through twentieth-century time series for several multiregion sectors, with rainfall expressed in the seven-class system. Twentieth-century gauge data described in Nicholson (2001b) have been added to the historical dataset to produce these curves. A striking feature is the near-ubiquitous period of aridity in the earliest years of the nineteenth century. The arid interval probably
1226 august 2012|

commenced around 1790, the droughts of the 1790s bearing witness to this (Nicholson 1996). The spatial pattern of anomalies for two of those years is shown in Fig. 11: 1835, a dry year throughout the continent, and 1888, a year with wet above-normal rainfall in the
subtropics of both hemispheres and abnormally dry conditions throughout the equatorial region.
ArCHIVeD DATA. The African historical dataset has been contributed to the World Data Center for
Fig. 10. A wetness index for five sectors of Africa, based on a combination of gauge and documentary data. The range of values, –3 to +3, corresponds to conditions ranging from extremely dry to extremely wet, with zero indicating normal.
1227august 2012aMERICaN MEtEOROLOgICaL sOCIEtY |

Paleoclimatology in Boulder, Colorado. This contri-bution is available online (at http://hurricane.ncdc .noaa.gov/pls/paleox/f?p=519:1:1071810159565685::::P1_STUDY_ID:12201). The data on the website consist of three separate entries, together with meta-data and documentation. Each has been subjected to extensive quality control (see Nicholson et al. 2012). One part is the nineteenth-century gauge dataset. It includes 48 stations in Algeria, 93 stations in South Africa, and 283 stations scattered over the rest of
Africa. Its format is that shown in Table 2. The second part is the documentary record based on descriptive historical sources. Its format is that shown in Table 3.
The third part is the semiquantitative data matrix with an annual wetness values for each of the 90 regions and each year of the nineteenth century. Error estimates for each region have been obtained and are published in Nicholson et al. (2012). Two other versions of the data matrix are available on request to the first author. One uses no statistical inference
Table 3. example of documentary entries for the Niger Bend.
Region: 14
Rain Anomaly: –3
Country/Geographical Area: Niger Bend
Year: 1853/1854
Entry: Famine and drought in the Niger Bend (c. 17°N, 3°W) (Barth 1965).
Region: 14
Rain Anomaly:
Country/Geographical Area: Niger Bend
Year: Circa 1854
Entry: It was, near Tombouctoo, rainy on the fifteenth of January; Barth states that rain and thunder is not
unusual along this quarter of the river toward the end of January and the beginning of February.
Region: 14
Rain Anomaly: –2
Country/Geographical Area: Niger Bend
Year: 1864/1865
Entry: Great drought in Oualata and the Soudan (Mali) (Marty 1927).
Region: 14
Rain Anomaly: –3
Country/Geographical Area: Niger Bend
Year: 1865/1866
Entry: Great drought and famine at Tichitt, Chinguetti, Oualata, Araouane, and 1 Tombouctoo (Monteil 1939).
Region: 14
Rain Anomaly: +2
Country/Geographical Area: Niger Bend
Year: 1866
Entry: This year of abundant precipitation "ended a long period of drought which affected the regions of the Sahara between Adrar in the West and Tombouctoo in the East" (Plote 1974).
Region: 14
Rain Anomaly: +2
Country/Geographical Area: Niger Bend
Year: 1880
Entry: After Lenz's passage in this year, floods of the Niger were always good, until at least 1897, and the region became very prosperous (Plote 1974). In 1880 the floods were exceptionally good, filling Lake Faguibine and the daou-nas, bringing fertility to a region that had been left sterile by many years of drought. This would imply that the 1870s were reasonably dry.
1228 august 2012|

to determine values for missing regions. The other uses the linear correlations with nearby regions but does not include regions for which values are obtained through spatial reconstruction via PCS.
The twentieth-century gauge dataset, which includes roughly 1,200 stations, is available from the first author. It has also been incorporated into the Global Historical Climatology Network (GHCN) dataset maintained by the National Climatic Data Center. Some of the historical records, especially those from South Africa and Algeria, are also in the GHCN archive.
ACKNOWLeDGMeNTS. The first author would like to acknowledge the support of two historical grants from NOAA: NAO80AR4310731 and A46GP0285. She would also like to thank Dave Nash and Georgina Endfield for contributing to the archive their invaluable missionary records of southern African climate. We would also like to thank Tom Johnson, and Tim Shanahan and his coauthors for lake level data.
REFERENCESBarth, H., 1859: Travels and Discoveries in North and
Central Africa (1849–1855): Being a Journal of an Ex-pedition Undertaken under the Auspices of H. B. M.'s Government, in the Years 1849–1855. J. W. Bradley, 538 pp.
Bessems, I., D. Verschuren, J. M. Russell, J. Hus, F. Mees, and B. F. Cumming, 2008: Paleolimno-logical evidence for widespread late 18th century drought across equatorial East Africa. Palaeogeogr. Palaeoclimatol. Palaeoecol., 259, 107–120.
Borius, A., 1875: Recherches sur le climat du Sénégal. Gauthier Villars, 327 pp.
—, 1880: Nouvelles recherches sur le climat du Sénégal. Gauthier Villars, 32 pp.
Cissoko, S .-M., 1968: Famines et épidemies à Tombouctoo et dans la Boucle du Niger du XVIe au XVIIIe siècle. Bull. Inst. Fr. Afr. Noire, 3B, 806–821.
Danckelman, A., 1884: Mémoire sur les observations météorologiques faites à Vivi et sur la climatologie de la côte Sud-Ouest d'Afrique en general. Asher and Co., 92 pp.
Fichtler, E., V. Trouet, H. Beeckman, P. Coppin, and M. Worbes, 2004: Climatic signals in tree rings of Burkea africana and Pterocarpus angolensis from semiarid forests in Namibia. Trees, 18, 442–451.
Fitzner, R., 1907: Regenverteilung in den deutschen Kolonien. Herman Paetel, 57 pp.
Ginestous, G., 1901: Les pluies en Tunisie. 2nd ed. Direction Générale de l’Enseignment Public, Service Météorologiques, Tunis, 87 pp.
—, 1903: Etudes sur le climat de la Tunisie. G. Guinle, 441 pp.
Grab, S. W., and D. J. Nash, 2010: Documentary evi-dence of climate variability during cold seasons in
Fig. 11. rainfall anomaly patterns for 1835 and 1888 for 90 regions of Africa (see the aforementioned wetness index in Fig. 10). The regions are homogeneous with respect to interannual variability (Nicholson 1986).
1229august 2012aMERICaN MEtEOROLOgICaL sOCIEtY |

Lesotho, southern Africa, 1833–1900. Climate Dyn., 34, 473–499.
Heidke, P., 1920: Die Niederschlagsverhältnisse in Deutsch-Südwest Afrika. Mitt. Deut. Schutzgebiet, 32, 136–186.
Herring, R., 1979: Hydrology and chronology: The Rodah Nilometer as an aid in dating interlacustrine history. Chronology, Migration and Drought in Interlacustrine Africa, J. B. Webster, Ed., Dalhousie University Press, 38–86.
Jackson, J. G., 1820: An Account of Timbuctoo and Housa. Long, Hurst, Rees, Orme, and Brown, 547 pp.
Kelso, C., and C. Vogel, 2007: The cl imate of Namaqualand in the nineteenth century. Climatic Change, 83, 357–380.
Lamb, H. H., 1966: Climate in the 1960’s: Changes in the world’s wind circulation reflected in prevailing temperatures, rainfall patterns and the levels of the African lakes. Geogr. J., 132, 183–212.
Livingstone, D., 1857: Missionary Travels and Researches in South Africa. John Murray, 711 pp.
Maley, J., 1973: Mécanisme des changements climatiques aux basses latitudes. Palaeogeogr. Palaeoclimatol. Palaeoecol., 14, 193–227.
Mann, M. E., and P. D. Jones, 2003: Global surface tem-peratures over the past two millennia. Geophys. Res. Lett., 30, 1820, doi:10.1029/2003GL017814.
Marty, P., 1921: Poème historique d’Abou Bakr Ibn Hejab, le Dimani. Bull. Comm. Etud. Hist. Scient. AOF, 4, 252–263.
Monteil, V., 1939: Chroniques du Tichitt. Bull. Inst. Fond. Afr. Noire, 1, 282–313.
—, 1964: Chronique du Wâlo Empire (1186–1855). Bull. Inst. Fond. Afr. Noire, 26, 440–498.
Nash, D. J., 1996: The dry valleys of the Kalahari: Docu-mentary evidence of environmental change in central southern Africa. Geogr. J., 162, 154–168.
—, and G. H. Endfield, 2002a: A 19th century climate chronology for the Kalahari region of central south-ern Africa derived from missionary correspondence. Int. J. Climatol., 22, 821–841.
—, and —, 2002b: Historical flows in the dry val-leys of the Kalahari identified from missionary cor-respondence. S. Afr. J. Sci., 98, 244–248.
—, and —, 2008: ‘Splendid rains have fallen’: Links between El Niño and rainfall variability in the Kalahari, 1840–1900. Climatic Change, 86, 257–290.
—, and S. W. Grab, 2010: “A sky of brass and burning winds”: Documentary evidence of rainfall vari-ability in the Kingdom of Lesotho, southern Africa, 1824–1900. Climatic Change, 101, 617–653.
Nicholson, S. E., 1986: The spatial coherence of African rainfall anomalies: Interhemispheric teleconnections. J. Climate Appl. Meteor., 25, 1365–1381.
—, 1996: Environmental change within the histori-cal period. The Physical Geography of Africa, A. S. Goudie, W. M. Adams, and A. Orme, Eds., Oxford University Press, 60–75.
—, 1998: Historical fluctuations of Lake Victoria and other lakes in the northern Rift Valley of East Africa. Environmental Change and Response in East African Lakes, J. T. Lehman, Ed., Kluwer, 7–35.
—, 2001a: A semi-quantitative, regional precipita-tion data set for studying African climates of the nineteenth century, Part I. Overview of the data set. Climatic Change, 50, 317–353.
—, 2001b: Climatic and environmental change in Africa during the last two centuries. Climate Res., 17, 123–144.
—, and X. Yin, 2001: Rainfall conditions in equatorial East Africa during the nineteenth century as inferred from the record of Lake Victoria. Climatic Change, 48, 387–398.
—, —, and M. B. Ba, 2000: On the feasibility of using a lake water balance model to infer rainfall. Hydrol. Sci. J., 45, 75–95.
—, D. Klotter, and A. K. Dezfuli, 2012: Spatial recon-struction of semi-quantitative precipitation fields over Africa during the nineteenth century from documen-tary evidence and gauge data. Quat. Res., 78, 13–23..
Park, M., 1799: Travels in the Interior District of Africa (1795–97). W. Bulmer, 372 pp.
Pejml, K., 1963: Studie o Kolísání Klimatu v Severní Africa v Prehistorickych a Historickych Dobach. Hydrometeorologicky Ustav, 93 pp.
Peterson, T. C., and J. F. Griffiths, 1997: Historical African data. Bull. Amer. Meteor. Soc., 78, 2869–2872.
Raulin, V., 1876: Observations pluviometriques faites dans l'Algérie, 1751–1870. Savy, 202 pp.
—, 1882: Observations pluviometriques faites dans l'Algérie, 1871–1880. Savy, 35 pp.
Ricketts, R. D., and R. F. Anderson, 1998: A direct comparison between the historical record of lake level and the d18O signal in carbonate sediments from Lake Turkana, Kenya. Limnol. Oceanogr., 43, 811–822.
Shanahan, T. M., J. T. Overpeck, J. W. Beck, C. W. Wheeler, J. A. Peck, J. W. King, and C. A. Scholz, 2008: The formation of biogeochemical lamina-tions in Lake Bosumtwi, Ghana, and their useful-ness as indicators of past environmental changes. J. Paleolimnol., 40, 339–355.
Speke, J. H., 1864: Journal of the Discovery of the Source of the Nile. W. Blackwood and Sons, 658 pp.
Supan, A., 1898: Die Verteiliung des Niederschlags auf der festen Erdoerf läche. Petermanns Mitt., Ergänzungsheft 124, 103 pp.
1230 august 2012|

Therrell, M. D., D. W. Stahle, L. P. Ries, and H. H. Shugart, 2006: Tree-ring reconstructed rain-fall variability in Zimbabwe. Climate Dyn., 26, 677–685.
Touchan, R., D. M. Meko, and A. Aloui, 2008: Precipita-tion reconstruction for northwestern Tunisia from tree rings. J. Arid Environ., 72, 1887–1896.
Toussoun, O., 1925: Memoire sur l’histoire du Nil. Mem. Inst. Egypt, 18, 366–404.
Trouet, V., K. Haneca, P. Coppin, and H. Beeckman, 2001: Tree ring analysis of Brachystegia spiciformis and Isoberlinia tomentosa: Evaluation of the ENSO-signal in the miombo woodland of eastern Africa. IAWA J., 22, 385–399.
Urvoy, Y., 1949: Histoire de l’empire du Bornu. Mem. Inst. Fr. Afr. Noire, 7, 1–166.
Verschuren, D., K. R. Laird, and B. F. Cumming, 2000: Rainfall and drought in equatorial East Africa during the past 1,100 years. Nature, 403, 410–414.
Vogel, C., 1989: A documentary-derived climatic chronology for South Africa, 1820–1900. Climatic Change, 14, 291–308.
Webster, J. B., 1979: Noi! Noi! Famines as an aid to interlacustrine chronology. Chronology, Migration and Drought in Interlacustrine Africa, J. B. Webster, Ed., Dalhousie University Press, 1–37.
Winterbottom, T. M., 1969: An Account of the Native Africans in the Neighbourhood of Sierra Leone, to Which Is Added an Account of the Present State of Medicine among Them. 2nd ed. Cass Library of African Studies: Travels and Narratives, Vol. 1, Barnes and Noble, 283 pp.
1231august 2012aMERICaN MEtEOROLOgICaL sOCIEtY |