a transcriptomic analysis of photomorphogenesis in ...hugh/presentations/ucc.pdf · a...
TRANSCRIPT
A transcriptomic analysis of photomorphogenesis in Arabidopsis Thaliana
Hugh Shanahan,Department of Computer Science,Royal Holloway,University of London
UCC, Department of Microbiology
19 September 2007
1
Outline
• Introduction :- A. Thaliana as a model organism
• Photomorphogenesis
• A conservative estimate of differentially expressed genes
• A strategy for examining functional classification
• The picture of photomorphogenesis
• Where to go from here...
2

Why is Arabidopsis thaliana a good system ?
• Short lifetime - around 40 days.
• Large number of genes - ~25,500 (Drosophila around 11,000 genes)
• Compact Genome - 125 Mbases (non-coding regions ~30-50%)
• Large number of array experiments (65 Affymetrix data sets, with 10’s of raw image files per data set at TAIR for example)
• A huge number of different strains - over half a million genotypes.
3

And why perhaps not so good....
• Not much Protein-Protein interaction data (Tandem Affinity Purification experiments on the way).
• The genomes of near neighbours have not been sequenced.
• A. lytra, C. rubella, B. rapa and T. halophilia are planned or underway
• Not clear how representative genes are for other agriculturally relevant species
• A. thaliana has a huge repertoire of Ubiquitination proteins.
4

Photomorphogenesis in Arabidopsis thaliana
• Before exposure to light, seeding grows via skotomorphogenesis after germination - slow root growth, no growth in shoot apical meristem or cotyledon.
• When exposed to light, cotyledon grows through simple reproduction (control).
• Meristem (stem cells) grow by differentiation.
• Meristem source of true leaves.
• Little understood about process.
5

The data
• RNA material was gathered from the shoot apical meristem and cotyledon of Arabidopsis seedlings at
• 0 hour (in darkness)
• 1 and 6 hours (Cot and Mer with replicates)
• 2, 24, 48 and 72 hours (Mer only)
• Samples hybridised with Affymetrix ATH1 GeneChip array.
• No amplification of RNA material !
6

Strategy
• Construct stringent test to determine genes which are clearly differentially expressed.
• Identify kinetic behaviour of different classes of differentially genes (i.e. try and find a time line of events).
• Identify functional groupings of genes and then examine how all the genes in that functional grouping behave (i.e. including those that are not differentially expressed according to our strict criteria).
7

Finding differentially expressed genes
• Look at three different normalisations for Affymetrix data
• GCRMA
• MAS5
• VSN
• Only consider genes that are differentially expressed in all three normalisations as being significant.
8

Test for significance
• Apply two-way ANOVA test. Look for significance with respect to
• tissue
• time
• time and tissue
• Compute F-Ratio
• Only use data with two replicates (i.e. Cot and Mer at 0, 1 and 6 hours)
9

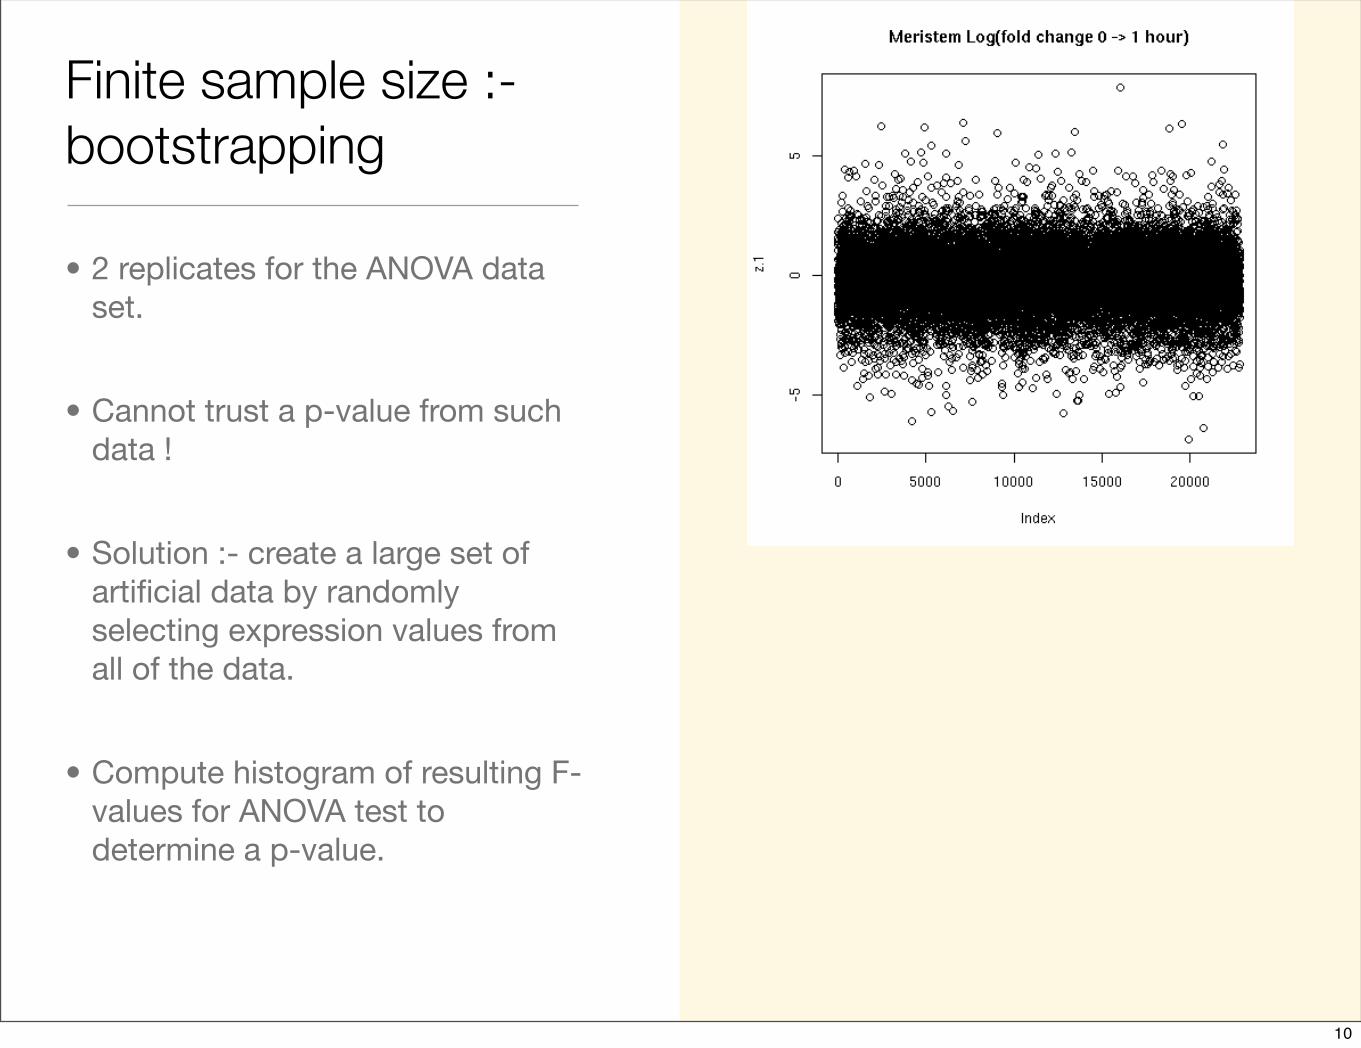
Finite sample size :- bootstrapping
• 2 replicates for the ANOVA data set.
• Cannot trust a p-value from such data !
• Solution :- create a large set of artificial data by randomly selecting expression values from all of the data.
• Compute histogram of resulting F-values for ANOVA test to determine a p-value.
10

False Detection Rate
• Bonferroni Correction is very conservative.
• Estimate FDR by plotting a histogram of the p-values.
• Fix FDR to 5% and set p-value.
• Important step : employ Present/Absent filter in MAS5 to filter out genes. Substantial improvement in results.
• Final step : remove all genes with fold change less than 2
11

Initial Results
• Selected 5,620 genes (out of 22,810).
• (Very conservatively) 1/4 of the transcriptome is differentially expressed during photomorphogenesis.
• Majority selected through time variation (2/3 time, 1/3 tissue).
• Very small number selected using time-tissue variation (10).
12

Functional Classification :- it should be easy....
• Many genes in Arabidopsis have some kind of functional annotation.
• Use Gene Ontology to give a structured functional annotation.
• Enumerate numbers of genes for a given annotation.
• Compute probability of over or under-representation using hyper-geometric distribution.
13

Functional Classification :- but it isn’t....
• Gene Ontology are useful but far too specific at its lowest nodes - False Discovery Rate calculation.
• Initially interested in general picture, what is the highest level annotation ?
• GO slim should cover more general cases, however annotations of genes can have multiple parents, e.g. a gene with kinase function and binds to DNA will sit in both classes.
• Ultimately, we developed our own general functional annotation.
• Lesson :- GO has a huge amount of information, but when looking at the big picture, you need to make the decisions !
14

Example15

Example
log(
p)
15

Example
Over-representation
log(
p)
15

Example
Over-representation
Under-representationlo
g(p)
15
Clustering :- Understanding the time behaviour
• Important lesson :- cluster early, cluster often.
• While genes have been selected using data at 0,1,6 hours, all data is used for clustering.
• Results quoted use K-Means (20 clusters) but checked with varying cluster size and with Hierarchical Clustering (very different clustering algorithm) to check if clusters are consistent.
• For each cluster, examine functional classes and explore any possible over-representations.
16

K-means clusters (reordered)
17

Yes, but what does it mean ?
K-means clusters (reordered)
17

First Phase
• Transcription Factors
• Ubiquitination
• Kinases
• More down-regulation than up.
18

First Phase
• Transcription Factors
• Ubiquitination
• Kinases
• More down-regulation than up.
18

Regulator (?) classes Including non-selected genes
19

Second Phase
• Ribosomal activity
• cell cycle
• hormone-related activity
20

Second Phase
• Ribosomal activity
• cell cycle
• hormone-related activity
20

Ribosome working overtime
21
Hormones
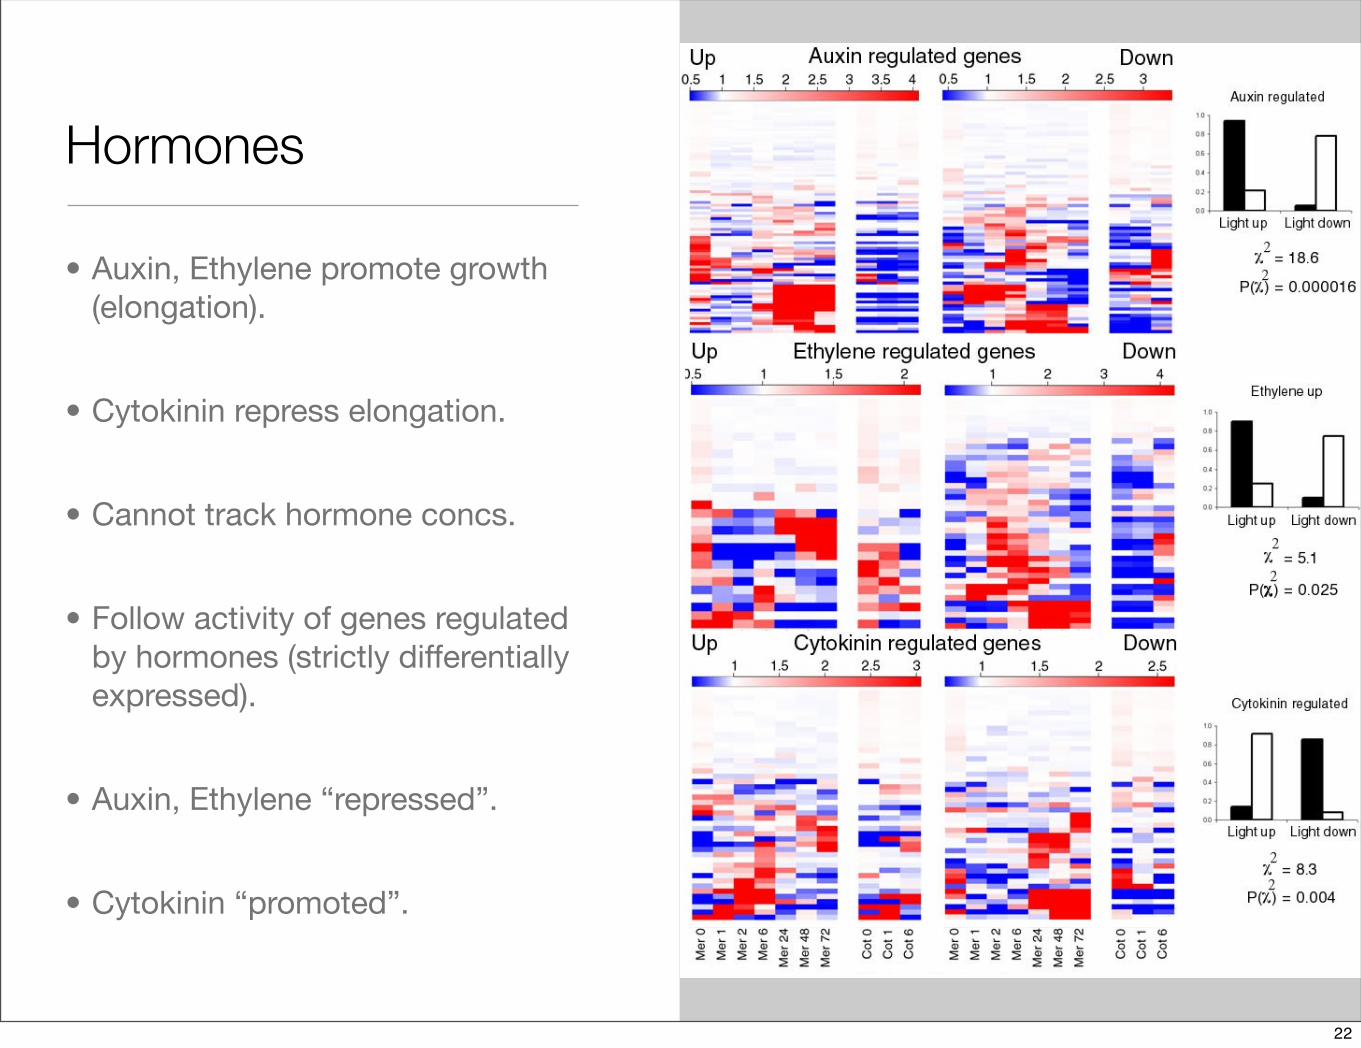
• Auxin, Ethylene promote growth (elongation).
• Cytokinin repress elongation.
• Cannot track hormone concs.
• Follow activity of genes regulated by hormones (strictly differentially expressed).
• Auxin, Ethylene “repressed”.
• Cytokinin “promoted”.
22

Third Phase
• Photosynthesis
• Cell wall loosening
23

Third Phase
• Photosynthesis
• Cell wall loosening
23

Cell Wall
• Plant cells have rigid cell walls.
• Expansion implies that cell walls must become less rigid.
• Complicated process between cell wall modification and internal turgor pressure.
• Nonetheless, see late expression in genes controlling this behaviour.
24

Summary of what’s been seen
• After constructing a set of genes which are strictly differentially expressed we find:
• An early burst (0-1 hours after exposure to light) of genes in the meristem that are regulatory in nature and are in general down rather than up-regulated.
• Around 6 hours after exposure to light evidence for cell division and repression of growth.
• At later times, parts of meristem are already starting to behave like leaves and we see growth through expansion rather than division (up-regulation of relevant hormone-related genes, down-regulation of ribosomal genes).
25

Where to go from here
• So far we’ve put together a picture of genes up and down regulated and looking at their classification fits in with a picture of particular types of growth.
• Useful at middle and late times (6 hours and beyond)
• We see sets of transcription factors, MAP kinases and Ubiquitination-related genes which are over-represented.
• Can we identify targets of these regulators ?
• Start off with co-regulated sets and see if we have common upstream promoter elements.
• How conserved are the above mechanisms elsewhere ?
26

Acknowledgements
27

• Enrique López-Juez• Edyta Dillon• Safina Khan • Zoltan Magyar • Laszlo Bögre
School of Biological Sciences, Royal Holloway
Acknowledgements
Computer Science, Royal Holloway
Department of Molecular Genetics,Ghent University
Institute of Biotechnology,University of Cambridge
• Saul Hazeldine
• Gerrit Beemster
• James A. H. Murray
27