a third generation glucose biosensor based on … · modified electrode, obtained through direct...
TRANSCRIPT

sensors
Article
A Third Generation Glucose Biosensor Based onCellobiose Dehydrogenase Immobilized on a GlassyCarbon Electrode Decorated with ElectrodepositedGold Nanoparticles: Characterization andApplication in Human Saliva
Paolo Bollella 1, Lo Gorton 2 ID , Roland Ludwig 3 and Riccarda Antiochia 1,* ID
1 Department of Chemistry and Drug Technologies, Sapienza University of Rome, P.le Aldo Moro. 5,00185 Rome, Italy; [email protected]
2 Department of Analytical Chemistry/Biochemistry and Structural Biology, Lund University, P.O. Box 124,SE-221 00 Lund, Sweden; [email protected]
3 Food Biotechnology Laboratory, Department of Food Science and Technology, BOKU—University of NaturalResources and Life Sciences, Muthgasse 18, A-1190 Vienna, Austria; [email protected]
* Correspondence: [email protected]
Received: 4 July 2017; Accepted: 16 August 2017; Published: 18 August 2017
Abstract: Efficient direct electron transfer (DET) between a cellobiose dehydrogenase mutantfrom Corynascus thermophilus (CtCDH C291Y) and a novel glassy carbon (GC)-modified electrode,obtained by direct electrodeposition of gold nanoparticles (AuNPs) was realized. The electrodewas further modified with a mixed self-assembled monolayer of 4-aminothiophenol (4-APh) and4-mercaptobenzoic acid (4-MBA), by using glutaraldehyde (GA) as cross-linking agent. The CtCDHC291Y/GA/4-APh,4-MBA/AuNPs/GC platform showed an apparent heterogeneous electrontransfer rate constant (ks) of 19.4 ± 0.6 s−1, with an enhanced theoretical and real enzyme surfacecoverage (Γtheor and Γreal) of 5287 ± 152 pmol cm−2 and 27 ± 2 pmol cm−2, respectively. Themodified electrode was successively used as glucose biosensor exhibiting a detection limit of 6.2 µM,an extended linear range from 0.02 to 30 mM, a sensitivity of 3.1 ± 0.1 µA mM−1 cm−2 (R2 = 0.995),excellent stability and good selectivity. These performances compared favourably with other glucosebiosensors reported in the literature. Finally, the biosensor was tested to quantify the glucose contentin human saliva samples with successful results in terms of both recovery and correlation withglucose blood levels, allowing further considerations on the development of non-invasive glucosemonitoring devices.
Keywords: cellobiose dehydrogenase; gold nanoparticles; electrodeposition; glucose biosensor;human saliva
1. Introduction
Glucose monitoring has attracted great attention in several fields, ranging from biomedicalapplications to ecological fields [1]. In particular, for clinical trials, glucose monitoring has beenconsidered one of the key factor in early diagnosis of diabetes mellitus, which is a main causeof death or other diseases around the world. Diabetes is a metabolic disease generally related tonon-/under-production of insulin in the pancreas and hyperglycemia, reflected by blood glucoseconcentrations higher or lower than the normal range of 80–120 mg dL−1 [2]. It is possible to distinguishbetween three types of diabetes: (i) type 1, which most affects young people, with non-productionof insulin in the pancreas and involves about 10% of diabetic people [3]; (ii) type 2, which occurs in
Sensors 2017, 17, 1912; doi:10.3390/s17081912 www.mdpi.com/journal/sensors

Sensors 2017, 17, 1912 2 of 14
middle-age or old people, with low production of insulin or when the body does not use the insulinproduced and involves about 90% of diabetic people [4]; (iii) gestational diabetes, which occurs duringthe pregnancy, with a connected risk of diabetes development for both mother and child [5].
In the last century, several approaches for early diagnosis of diabetes mellitus mainly focusedon glucose monitoring have been developed such as capillary zone electrophoresis (CZE) [6], gaschromatography (GC) mainly coupled with mass spectrometry (MS) [7], high performance liquidchromatography/mass spectrometry (HPLC-MS) [8], enzymatic spectrophotometric assays [9], Fouriertransform near-infrared spectroscopy (FT-NIR) [10] and proton NMR.
However, these methods require expensive equipment and complicated operations and thereforethey cannot be applied to home-based care [11]. Most diabetic patients need to test their blood glucoselevels periodically, even several times a day. Biosensors may represent a valid alternative as they allowtime-saving, accurate, repeatable and cost-effective determination of glucose in blood [12]. Typically,a blood test for analysis is realized through a finger prick, which may cause physical and mentalstress to patients, especially to young children and elderly people. Therefore, there is a great need forthe developing of a point-of-care non-invasive glucose monitoring system [2]. A positive correlationbetween blood glucose (80–120 mg dL−1) and salivary glucose (0.6–1.8 mg dL−1) has been revealed inmany studies [4].
Saliva shows great advantages compared to other biological fluids such as blood, tears, urine, etc.because its sampling is not invasive and it is recognized as the most sensitive one, containing alsoother disease biomarkers in a concentration larger than in blood. Moreover saliva sampling involves asimple collection method that allows easy storage and transport.
It is well known that electrochemical enzymatic glucose biosensors are divided into three classesdepending on the electrochemical communication between the enzyme and the electrode: (i) firstgeneration biosensors, where glucose is considered as co-substrate of glucose oxidase (GOx) with asubsequent generation of hydrogen peroxide (H2O2), which is oxidised at the electrode surface at quitehigh redox potential (e.g., 0.6 V vs. Ag|AgClsat for carbon modified electrodes, 0.4 V Ag|AgClsat forgold electrodes and 0.7 V vs. Ag|AgClsat for platinum electrode; (ii) second generation biosensors,where oxygen was replaced with a non-physiological electron acceptor (mediator) able to shuttle theelectrons from the enzyme redox center to the surface of the electrode; (iii) third generation biosensors,where the mediator was eliminated to develop a reagentless glucose biosensor transferring the electronsfrom glucose to the electrode through the active site of the enzyme, with a low operating potential, closeto that of the redox potential of the enzyme itself [13]. The electrode nanostructure plays a key role,particularly for third generation biosensors, thanks to the increased electroactive area and roughnessfactor [13]. Among the various nanostructured materials, carbon nanotubes, graphene [14] and metalnanoparticles (MNPs) showed very promising results [15], because of their high surface/volumeratio, thus allowing a better communication between the electrode and the prosthetic group of theenzyme [16]. Recently, several MNPs deposition approaches have been developed to modify theelectrode surface, such as drop-casting [17,18], covalent linkage [19,20] or direct electrodeposition [21].Among these methods, the electrodeposition allows a fast and easy MNPs synthesis with the possibilityto monitor the MNPs geometry and size [22], especially by sweeping the potential [23] instead ofapplying a fixed potential [24]. Moreover, MNPs can grow directly onto the electrode surface withoutthe need of further sample preparation, being surfactant-free and cost-effective and allowing to tunethe nature of the nanoclusters by changing electrolyte composition and deposition parameters [24].
Unfortunately, despite the electrode nanostructure, only a few enzymes are able to directly transferelectrons from their active sites to the electrode [25,26]. Cellobiose dehydrogenase (CDH) has receivedgreat attention for biosensors [27] and biofuel cell development [28] because of its ability to show DET.CDH is a flavocytochrome oxidoreductase expressed by the dikaryotic phyla of Basidiomycota (Class I)and Ascomycota (Class II and Class III), consisting of two domains [29]. The first domain, calleddehydrogenase domain (DHCDH), contains a flavin adenine dinucleotide (FAD) cofactor, connectedthrough a flexible linker to a second subunit containing a heme-b cofactor, called cytochrome domain

Sensors 2017, 17, 1912 3 of 14
(CYTCDH) [30]. DHCDH domain is structurally similar to the FAD domain of most GMC-oxidoreductaseenzymes and is fully reduced by di-/mono- saccharides, transferring the electrons through internalelectron transfer (IET) to the CYTCDH, which finally shuttles the electrons to properly modifiedelectrodes [31]. Among II class CDHs, Corynascus thermophilus CDH (CtCDH) was genetically mutatedin its active site (CtCDH C291Y mutant) to enhance its sensitivity toward glucose and reduce themaltose cross-reactivity [32].
In this work, we report an improved DET efficiency between CtCDH C291Y and a novel GCmodified electrode, obtained through direct electrodeposition of gold nanoparticles (AuNPs) on the GCelectrode, further modified with a mixed self-assembled monolayer of 4-aminothiophenol (4-APh) and4-mercaptobenzoic acid (4-MBA) using glutaraldehyde as cross-linking agent, as shown in Scheme 1.The proposed electrodeposition method allowed to monitor the nanoparticles surface coverage aswell as the surface area available for the biomodification, which is directly related to the biosensorsensitivity. The so modified AuNPs/GC electrode was used to develop a third generation biosensorfor glucose detection. The performances of the proposed biosensor were investigated in human salivasamples, demonstrating that the constructed AuNPs/GC biosensor has great potentials to realizeelectrochemical devices for non-invasive diabetes mellitus monitoring.
Sensors 2017, 17, 1912 3 of 14
cytochrome domain (CYTCDH) [30]. DHCDH domain is structurally similar to the FAD domain of most GMC-oxidoreductase enzymes and is fully reduced by di-/mono- saccharides, transferring the electrons through internal electron transfer (IET) to the CYTCDH, which finally shuttles the electrons to properly modified electrodes [31]. Among II class CDHs, Corynascus thermophilus CDH (CtCDH) was genetically mutated in its active site (CtCDH C291Y mutant) to enhance its sensitivity toward glucose and reduce the maltose cross-reactivity [32].
In this work, we report an improved DET efficiency between CtCDH C291Y and a novel GC modified electrode, obtained through direct electrodeposition of gold nanoparticles (AuNPs) on the GC electrode, further modified with a mixed self-assembled monolayer of 4-aminothiophenol (4-APh) and 4-mercaptobenzoic acid (4-MBA) using glutaraldehyde as cross-linking agent, as shown in Scheme 1. The proposed electrodeposition method allowed to monitor the nanoparticles surface coverage as well as the surface area available for the biomodification, which is directly related to the biosensor sensitivity. The so modified AuNPs/GC electrode was used to develop a third generation biosensor for glucose detection. The performances of the proposed biosensor were investigated in human saliva samples, demonstrating that the constructed AuNPs/GC biosensor has great potentials to realize electrochemical devices for non-invasive diabetes mellitus monitoring.
Scheme 1. The electrode modification pathway for CtCDH C291Y/GA/4-APh,4-MBA/AuNPs/GC platform has been reported. Initially, AuNPs were directly electrodeposited onto cleaned GC electrode by sweeping the potential. Afterward, the electrode was incubated in a thiol mixture (1:1 v/v 4-APh and 4-MBA) overnight, followed by cross-linking reaction (glutaraldehyde GA: cross-linking agent) to covalently link the enzyme (CtCDH C291Y) to the so modified electrode surface.
2. Experimental Section
2.1. Chemicals
Sulfuric acid (H2SO4), D-glucose, D-(+)-maltose monohydrate, ascorbic acid, calcium chloride (CaCl2), chloroauric acid (HAuCl4·3H2O), potassium ferricyanide (K3[Fe(CN)6]), potassium ferrocyanide (K4[Fe(CN)6]), sodium acetate (CH3COOH), 3-(N-morpholino)propanesulfonic acid (MOPS), tris(hydroxymethyl)aminomethane (TRIS), urea, cortisol, 4-aminothiophenol (4-APh), 4-mercaptobenzoic acid (4-MBA), glutaraldehyde (GA), potassium chloride (KCl) and Glucose (GO) Assay Kit were purchased from Sigma Aldrich (St. Louis, MO, USA).
CtCDH C291Y (E.C. 1.1.99.18) was purified from the culture supernatant of the ascomycete Corynascus thermophilus (CBS 405.69) obtained from the Centralbureau voor Schimmelcultures (Baarn, The Netherlands) (volumetric activity with cytochrome c at pH 7.5 = 54 U mL−1, protein concentration = 16 mg mL−1). All solutions were prepared using Milli-Q water (R = 18.2 MΩ cm at 25 °C; TOC < 10 μg L−1, Millipore, Molsheim, France).
Scheme 1. The electrode modification pathway for CtCDH C291Y/GA/4-APh,4-MBA/AuNPs/GCplatform has been reported. Initially, AuNPs were directly electrodeposited onto cleaned GC electrodeby sweeping the potential. Afterward, the electrode was incubated in a thiol mixture (1:1 v/v 4-APhand 4-MBA) overnight, followed by cross-linking reaction (glutaraldehyde GA: cross-linking agent) tocovalently link the enzyme (CtCDH C291Y) to the so modified electrode surface.
2. Experimental Section
2.1. Chemicals
Sulfuric acid (H2SO4), D-glucose, D-(+)-maltose monohydrate, ascorbic acid, calcium chloride(CaCl2), chloroauric acid (HAuCl4·3H2O), potassium ferricyanide (K3[Fe(CN)6]), potassiumferrocyanide (K4[Fe(CN)6]), sodium acetate (CH3COOH), 3-(N-morpholino)propanesulfonic acid(MOPS), tris(hydroxymethyl)aminomethane (TRIS), urea, cortisol, 4-aminothiophenol (4-APh),4-mercaptobenzoic acid (4-MBA), glutaraldehyde (GA), potassium chloride (KCl) and Glucose (GO)Assay Kit were purchased from Sigma Aldrich (St. Louis, MO, USA).
CtCDH C291Y (E.C. 1.1.99.18) was purified from the culture supernatant of the ascomyceteCorynascus thermophilus (CBS 405.69) obtained from the Centralbureau voor Schimmelcultures(Baarn, The Netherlands) (volumetric activity with cytochrome c at pH 7.5 = 54 U mL−1, protein

Sensors 2017, 17, 1912 4 of 14
concentration = 16 mg mL−1). All solutions were prepared using Milli-Q water (R = 18.2 MΩ cm at25 C; TOC < 10 µg L−1, Millipore, Molsheim, France).
2.2. Electrode Preparation and Modification
GC electrodes (Bioanalytical Systems Inc., West Lafayette, IN, USA, d = 3 mm) were polishedwith alumina slurries (Al2O3, particle size of 1 and 0.1 µm) on cloth pads wet with Milli-Q water(Struers ApS, Ballerup, Denmark), thoroughly rinsed with Milli-Q water and further sonicated for5 min between each polishing step. GC electrodes were successively modified by electrodeposition ofgold nanoparticles (AuNPs) by sweeping the potential between 1.1 and −0.1 V vs. Ag|AgClsat fora given number of scans (5, 10, 15, 20, 25, 30, 35 scans) in 10 mM HAuCl4 [33]. Then, the modifiedelectrodes were activated in 0.5 M H2SO4 by running 25 scans between 0 and +1.7 vs. Ag|AgClsat at ascan rate of 0.1 V s−1 until a well-defined cyclic voltammogram (CV) was obtained. The best modifiedelectrode was selected on the basis of the electroactive and real surface area, heterogeneous electrontransfer rate constant (k0, cm s−1) and roughness factor (ρ), calculated from CV measurements carriedout in 10 mM Fe(CN)6
3−/4− (50 mM TRIS buffer pH 7.4). It was further dipped into a volumetric 1:1mixture of 1 mM 4-APh/4-MBA ethanol solution. Then, the electrode was thoroughly rinsed withethanol and dried under N2 stream. For the biomodification, 1 µL of GA solution (2.5% v/v in distilledwater) and 3 µL of CtCDH C291Y solution (16 mg mL−1) were drop-cast, gently mixed on the top ofthiol-modified AuNPs/GC electrode and allowed to react in a moisturised atmosphere for 2 h to avoidevaporation of the reactants. Finally, the so modified electrode was gently rinsed with 50 mM TRISbuffer (pH 7.4) in order to remove any possible unbounded enzyme molecule [34].
2.3. Whole Saliva and Blood Samples Collection and Analysis
Saliva samples collection was performed at 8.30 a.m. from three healthy male and female patientsrefrained from eating, drinking and oral hygiene procedures (at least for 1 h before). The patients weregiven drinking bottled water and asked to rinse well their mouths. After 5 min, the patients wereasked to spit whole saliva (WS) into a 50 mL sterile Falcon® tube, once a minute for up to 10 min untilsampling 5 mL of WS [35]. At the same time the patients were punched on their fingers to collect adrop of blood sufficient to measure glucose with the commercial GlucoContour XT (Bayer, Leverkusen,Germany) used by diabetic patients for self-monitoring and with the glucose oxidase-peroxidasemethod [36,37] by using the Glucose (GO) Assay Kit, which is the standard reference method for WSsamples [38].
2.4. SEM Experiments
Scanned electron microscopy (SEM) measurements were performed with a JSM-7600F SchottkyField Emission Scanning Electron Microscope (JEOL Nordic AB, Sollentuna, Sweden). All sampleswere prepared according to the electrodeposition protocol, reported in Section 2.2, using glassy carbonplates (25 × 25 × 1 mm, ALS Co. Ltd., Tokyo, Japan) instead of GC electrodes. The samples werepaced on a clip SEM sample holder (JEOL Nordic AB).
2.5. Electrochemical Measurements and Electrochemical Apparatus
Cyclic voltammograms (CVs) were recorded by using a PGSTAT 30 potentiostat (equipped withGPES 4.9, Autolab, Utrecht, The Netherlands). CVs were performed in a three-electrode electrochemicalcell containing a standard silver chloride electrode (Ag|AgCl, sat. KCl), a platinum wire counterelectrode and a modified glassy carbon (GC) electrode as working electrode. The temperaturecontrolled experiments were carried out by using a cryostatic bath (T ± 0.01 C, LAUDA RM6, Delran,NJ, USA). Flow injection analysis (FIA) data have been collected by using an analogic potentiostat(Zäta Elektronik, Höör, Sweden) connected with a strip chart recorder (Kipp & Zonen, Utrecht,The Netherlands). The modified GC electrode, an Ag|AgCl (0.1 M KCl) reference electrode anda platinum wire counter electrode were fitted into a wall-jet cell. The electrochemical system was

Sensors 2017, 17, 1912 5 of 14
equipped with a flow system consisting of a peristaltic pump (Gilson, Villier-le-Bel, France) and asix-port valve electrical injector (Rheodyne, Cotati, CA, USA).
3. Results and Discussion
3.1. SEM and Electrochemical Characterization of AuNPs Modified GC Electrodes
SEMs were used to evaluate the physical appearance and surface characteristics of the AuNPson the electrode surfaces for a given number of scans. Figure 1a–g show the SEM images relative toincreasing number of scans. It is clearly visible that the surface coverage of the AuNPs increases withincreasing number of scans until 25 scans, when the electrode surface is completely covered by a singlelayer of AuNPs. For electrodes prepared with 30 and 35 scans (Figure 1f,g), it is possible to observemultiple layers of AuNPs with possible formation of AuNPs agglomerates.
Sensors 2017, 17, 1912 5 of 14
3. Results and Discussion
3.1. SEM and Electrochemical Characterization of AuNPs Modified GC Electrodes
SEMs were used to evaluate the physical appearance and surface characteristics of the AuNPs on the electrode surfaces for a given number of scans. Figure 1a–g show the SEM images relative to increasing number of scans. It is clearly visible that the surface coverage of the AuNPs increases with increasing number of scans until 25 scans, when the electrode surface is completely covered by a single layer of AuNPs. For electrodes prepared with 30 and 35 scans (Figure 1f,g), it is possible to observe multiple layers of AuNPs with possible formation of AuNPs agglomerates.
Figure 1. SEM images of AuNPs-modified GCEs obtained by sweeping the potential between 1.1 and −0.1 V vs. Ag|AgClsat for a given number of scans in 10 mM HAuCl4 (0.5 M H2SO4): (a) 5, (b) 10, (c) 15, (d) 20, (e) 25, (f) 30 and (g) 35.
All AuNP-modified electrodes were successively characterized by cyclic voltammetry (CV) experiments in a solution of Fe(CN)63−/4− (data not shown) in order to calculate the electroactive area (AEA, cm2), the heterogeneous electron transfer rate constant (k0, cm s−1) and the roughness factor (electroactive/geometrical area ratio, ρ) and in 0.5 M H2SO4 (Figure 2) in order to calculate the real surface area (Areal). All data are shown in Table 1. The AEA has been evaluated using the Randles-
(a) (b)
(c) (d)
(e) (f)
(g)
1 µm 1 µm
1 µm 1 µm
1 µm 1 µm
1 µm
Figure 1. SEM images of AuNPs-modified GCEs obtained by sweeping the potential between 1.1 and−0.1 V vs. Ag|AgClsat for a given number of scans in 10 mM HAuCl4 (0.5 M H2SO4): (a) 5, (b) 10,(c) 15, (d) 20, (e) 25, (f) 30 and (g) 35.

Sensors 2017, 17, 1912 6 of 14
All AuNP-modified electrodes were successively characterized by cyclic voltammetry (CV)experiments in a solution of Fe(CN)6
3−/4− (data not shown) in order to calculate the electroactive area(AEA, cm2), the heterogeneous electron transfer rate constant (k0, cm s−1) and the roughness factor(electroactive/geometrical area ratio, ρ) and in 0.5 M H2SO4 (Figure 2) in order to calculate the realsurface area (Areal). All data are shown in Table 1. The AEA has been evaluated using the Randles-Sevcikequation by the slope of the peak current vs. square root of scan rate (υ1/2) [39], whereas the realsurface area (Areal) was calculated by integration of the peak current related to the gold oxide reductionprocess occurring by running CVs in 0.5 M H2SO4 [40,41]. The theoretical charge density consideredfor gold oxide reduction is 390 ± 10 µC cm−2 [42]. k0 was calculated using the extended methodwhich merges the Klingler-Kochi and Nicholson-Shain methods for totally irreversible and reversiblesystems, respectively [43,44]. It is possible to observe in Table 1 that all the electrochemical parametersare highly influenced by the number of scans, showing the best results after 25 scans with an AEA
of 12.96 ± 0.18 cm2 and a roughness factor of 183.6 ± 1.2, probably related to the increase in AuNPssurface coverage with the scan number. With electrodes prepared with 30 and 35 scans the decrease inthe electrochemical parameters reported in Table 1 might be due to the presence of multiple layers andpossible AuNPs agglomeration (Figure 1f,g).
Sensors 2017, 17, 1912 6 of 14
Sevcik equation by the slope of the peak current vs. square root of scan rate ( / ) [39], whereas the real surface area (Areal) was calculated by integration of the peak current related to the gold oxide reduction process occurring by running CVs in 0.5 M H2SO4 [40,41]. The theoretical charge density considered for gold oxide reduction is 390 ± 10 μC cm−2 [42]. k0 was calculated using the extended method which merges the Klingler-Kochi and Nicholson-Shain methods for totally irreversible and reversible systems, respectively [43,44]. It is possible to observe in Table 1 that all the electrochemical parameters are highly influenced by the number of scans, showing the best results after 25 scans with an AEA of 12.96 ± 0.18 cm2 and a roughness factor of 183.6 ± 1.2, probably related to the increase in AuNPs surface coverage with the scan number. With electrodes prepared with 30 and 35 scans the decrease in the electrochemical parameters reported in Table 1 might be due to the presence of multiple layers and possible AuNPs agglomeration (Figure 1f,g).
Table 1. Characterization of AuNPs on GC modified electrodes for different numbers of cyclic scans (N) during the electrodeposition step. Experimental conditions: 10 mM Fe(CN)63−/4− in 50 mM TRIS buffer pH 7.4 with 0.1 M KCl for electroactive area (AEA), real surface area (Areal), electron transfer rate constant (k0) and roughness factor (ρ) determination; 0.5 M H2SO4 at a scan rate of 100 mV s−1, for Areal determination.
Scan Numbers (N) AEA/cm2 Areal/cm2 k0app/10−2 cm s−1 Roughness Factor (ρ) 0 0.09 ± 0.01 - 4.6 ± 0.1 1.3 ± 0.1 5 2.72 ± 0.21 2.93 ± 0.07 5.2 ± 0.3 38.5 ± 0.3
10 3.92 ± 0.12 4.13 ± 0.06 7.9 ± 0.4 55.5 ± 0.3 15 4.13 ± 0.19 4.46 ± 0.06 13.4 ± 0.6 58.5 ± 0.5 20 8.74 ± 0.25 9.26 ± 0.04 18.2 ± 0.7 123.8 ± 0.8 25 12.96 ± 0.18 13.83 ± 0.04 26.8 ± 0.3 183.6 ± 1.2 30 4.18 ± 0.06 4.39 ± 0.08 15.3 ± 0.8 59.2 ± 0.7 35 3.26 ± 0.12 3.99 ± 0.06 10.6 ± 0.5 46.2 ± 1.3
Figure 2. Cyclic voltammograms of AuNPs modified GCE electrodes with different number of scans (from 0 scans to 35 scans) in 0.5 M H2SO4. Scan rate 100 mV s−1. T = 25 °C.
3.2. Electrochemistry of CtCDH C291Y on Modified GA/4-APh,4-MBA/AuNPs/GC Electrode
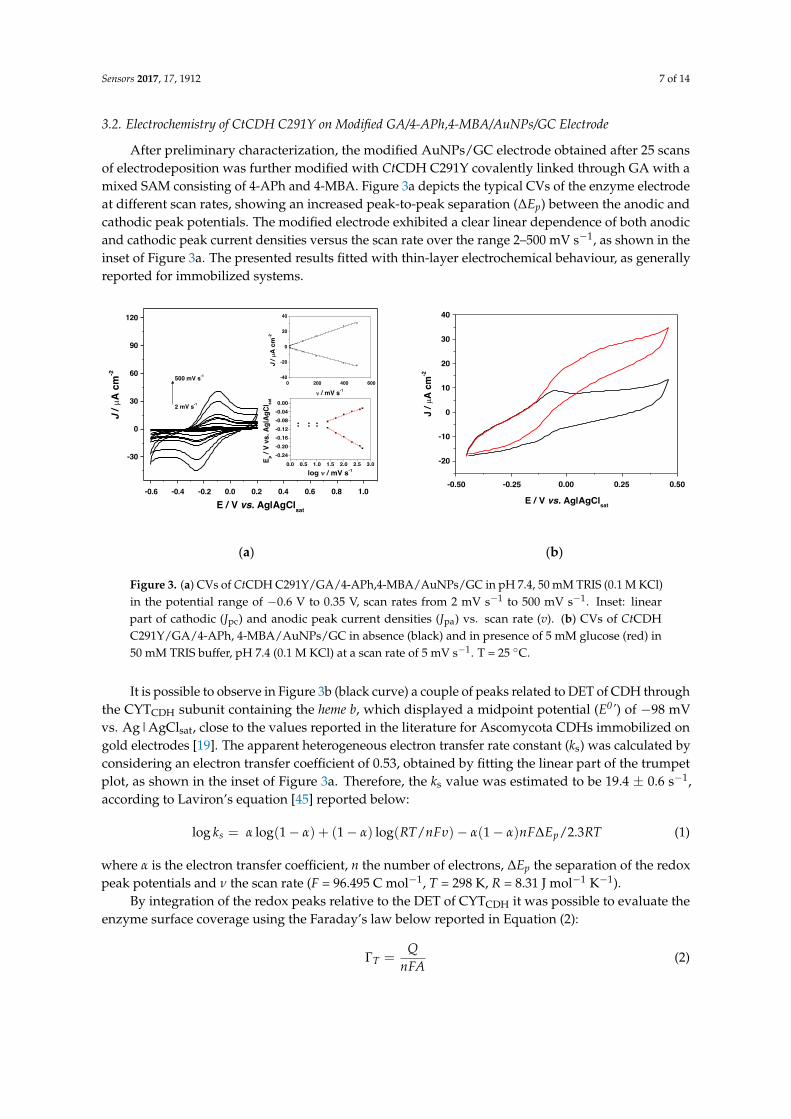
After preliminary characterization, the modified AuNPs/GC electrode obtained after 25 scans of electrodeposition was further modified with CtCDH C291Y covalently linked through GA with a mixed SAM consisting of 4-APh and 4-MBA. Figure 3a depicts the typical CVs of the enzyme electrode at different scan rates, showing an increased peak-to-peak separation (ΔEp) between the anodic and cathodic peak potentials. The modified electrode exhibited a clear linear dependence of both anodic and cathodic peak current densities versus the scan rate over the range 2–500 mV s−1, as
Figure 2. Cyclic voltammograms of AuNPs modified GCE electrodes with different number of scans(from 0 scans to 35 scans) in 0.5 M H2SO4. Scan rate 100 mV s−1. T = 25 C.
Table 1. Characterization of AuNPs on GC modified electrodes for different numbers of cyclic scans(N) during the electrodeposition step. Experimental conditions: 10 mM Fe(CN)6
3−/4− in 50 mM TRISbuffer pH 7.4 with 0.1 M KCl for electroactive area (AEA), real surface area (Areal), electron transfer rateconstant (k0) and roughness factor (ρ) determination; 0.5 M H2SO4 at a scan rate of 100 mV s−1, forAreal determination.
Scan Numbers (N) AEA/cm2 Areal/cm2 k0app/10−2 cm s−1 Roughness Factor (ρ)
0 0.09 ± 0.01 - 4.6 ± 0.1 1.3 ± 0.15 2.72 ± 0.21 2.93 ± 0.07 5.2 ± 0.3 38.5 ± 0.310 3.92 ± 0.12 4.13 ± 0.06 7.9 ± 0.4 55.5 ± 0.315 4.13 ± 0.19 4.46 ± 0.06 13.4 ± 0.6 58.5 ± 0.520 8.74 ± 0.25 9.26 ± 0.04 18.2 ± 0.7 123.8 ± 0.825 12.96 ± 0.18 13.83 ± 0.04 26.8 ± 0.3 183.6 ± 1.230 4.18 ± 0.06 4.39 ± 0.08 15.3 ± 0.8 59.2 ± 0.735 3.26 ± 0.12 3.99 ± 0.06 10.6 ± 0.5 46.2 ± 1.3
Sensors 2017, 17, 1912 7 of 14
3.2. Electrochemistry of CtCDH C291Y on Modified GA/4-APh,4-MBA/AuNPs/GC Electrode
After preliminary characterization, the modified AuNPs/GC electrode obtained after 25 scansof electrodeposition was further modified with CtCDH C291Y covalently linked through GA with amixed SAM consisting of 4-APh and 4-MBA. Figure 3a depicts the typical CVs of the enzyme electrodeat different scan rates, showing an increased peak-to-peak separation (∆Ep) between the anodic andcathodic peak potentials. The modified electrode exhibited a clear linear dependence of both anodicand cathodic peak current densities versus the scan rate over the range 2–500 mV s−1, as shown in theinset of Figure 3a. The presented results fitted with thin-layer electrochemical behaviour, as generallyreported for immobilized systems.
Sensors 2017, 17, 1912 7 of 14
shown in the inset of Figure 3a. The presented results fitted with thin-layer electrochemical behaviour, as generally reported for immobilized systems.
(a) (b)
Figure 3. (a) CVs of CtCDH C291Y/GA/4-APh,4-MBA/AuNPs/GC in pH 7.4, 50 mM TRIS (0.1 M KCl) in the potential range of −0.6 V to 0.35 V, scan rates from 2 mV s−1 to 500 mV s−1. Inset: linear part of cathodic (Jpc) and anodic peak current densities (Jpa) vs. scan rate (v). (b) CVs of CtCDH C291Y/GA/4-APh, 4-MBA/AuNPs/GC in absence (black) and in presence of 5 mM glucose (red) in 50 mM TRIS buffer, pH 7.4 (0.1 M KCl) at a scan rate of 5 mV s−1. T = 25 °C.
It is possible to observe in Figure 3b (black curve) a couple of peaks related to DET of CDH through the CYTCDH subunit containing the heme b, which displayed a midpoint potential (E0’) of −98 mV vs. Ag|AgClsat, close to the values reported in the literature for Ascomycota CDHs immobilized on gold electrodes [19]. The apparent heterogeneous electron transfer rate constant (ks) was calculated by considering an electron transfer coefficient of 0.53, obtained by fitting the linear part of the trumpet plot, as shown in the inset of Figure 3a. Therefore, the ks value was estimated to be 19.4 ± 0.6 s−1, according to Laviron’s equation [45] reported below: log = log(1 − ) + (1 − ) log( ⁄ ) − (1 − ) ∆ 2.3⁄ (1)
where α is the electron transfer coefficient, n the number of electrons, ΔEp the separation of the redox peak potentials and ν the scan rate (F = 96.495 C mol−1, T = 298 K, R = 8.31 J mol−1 K−1).
By integration of the redox peaks relative to the DET of CYTCDH it was possible to evaluate the enzyme surface coverage using the Faraday’s law below reported in Equation (2): Γ = (2)
where ΓT is the total surface concentration of electroactive protein (mol cm−2), A the electrode area (cm2), F the Faraday’s constant (96 495 C mol−1 of electrons), Q the charge underlying the redox wave and n the number of electrons [46]. The theoretical surface coverage (Γtheor) was estimated to be 5287 ± 152 pmol cm−2 (Ageom = 0.073 cm2), while the real surface coverage (Γreal) resulted to be 27 ± 2 pmol cm−2 (Areal = 13.83 ± 0.04 cm2, as shown in Table 1). Afterwards, the electrocatalytic behaviour of the CtCDH C291Y/GA/4-APh,4-MBA/AuNPs/GC electrode was studied by performing CVs in the presence of 5 mM glucose as substrate (Figure 3b, red curve), showing excellent performances with a current density of about 30 μA cm−2, probably due to the high nanostructuration of the electrode surface and the covalent immobilization of the enzyme.
Figure 3. (a) CVs of CtCDH C291Y/GA/4-APh,4-MBA/AuNPs/GC in pH 7.4, 50 mM TRIS (0.1 M KCl)in the potential range of −0.6 V to 0.35 V, scan rates from 2 mV s−1 to 500 mV s−1. Inset: linearpart of cathodic (Jpc) and anodic peak current densities (Jpa) vs. scan rate (v). (b) CVs of CtCDHC291Y/GA/4-APh, 4-MBA/AuNPs/GC in absence (black) and in presence of 5 mM glucose (red) in50 mM TRIS buffer, pH 7.4 (0.1 M KCl) at a scan rate of 5 mV s−1. T = 25 C.
It is possible to observe in Figure 3b (black curve) a couple of peaks related to DET of CDH throughthe CYTCDH subunit containing the heme b, which displayed a midpoint potential (E0’) of −98 mVvs. Ag|AgClsat, close to the values reported in the literature for Ascomycota CDHs immobilized ongold electrodes [19]. The apparent heterogeneous electron transfer rate constant (ks) was calculated byconsidering an electron transfer coefficient of 0.53, obtained by fitting the linear part of the trumpetplot, as shown in the inset of Figure 3a. Therefore, the ks value was estimated to be 19.4 ± 0.6 s−1,according to Laviron’s equation [45] reported below:
log ks = α log(1− α) + (1− α) log(RT/nFυ)− α(1− α)nF∆Ep/2.3RT (1)
where α is the electron transfer coefficient, n the number of electrons, ∆Ep the separation of the redoxpeak potentials and ν the scan rate (F = 96.495 C mol−1, T = 298 K, R = 8.31 J mol−1 K−1).
By integration of the redox peaks relative to the DET of CYTCDH it was possible to evaluate theenzyme surface coverage using the Faraday’s law below reported in Equation (2):
ΓT =Q
nFA(2)

Sensors 2017, 17, 1912 8 of 14
where ΓT is the total surface concentration of electroactive protein (mol cm−2), A the electrodearea (cm2), F the Faraday’s constant (96 495 C mol−1 of electrons), Q the charge underlying theredox wave and n the number of electrons [46]. The theoretical surface coverage (Γtheor) wasestimated to be 5287 ± 152 pmol cm−2 (Ageom = 0.073 cm2), while the real surface coverage (Γreal)resulted to be 27 ± 2 pmol cm−2 (Areal = 13.83 ± 0.04 cm2, as shown in Table 1). Afterwards,the electrocatalytic behaviour of the CtCDH C291Y/GA/4-APh,4-MBA/AuNPs/GC electrode wasstudied by performing CVs in the presence of 5 mM glucose as substrate (Figure 3b, red curve),showing excellent performances with a current density of about 30 µA cm−2, probably due to the highnanostructuration of the electrode surface and the covalent immobilization of the enzyme.
3.3. Glucose Biosensor Development
The amperometric response to glucose was studied by injecting glucose solutions atdifferent concentrations by using the flow injection analysis (FIA) system, in order toinvestigate the electroanalytical and kinetic parameters of the modified CtCDH C291Y/GA/4-APh,4-MBA/AuNPs/GC electrode. The biosensor showed a fast peak response (5 s), probably due tothe enlarged surface area related to the electrodeposition of the AuNPs and the cross-linking of theenzyme, which ensure high number of immobilized enzyme molecules and stable enzyme layer.
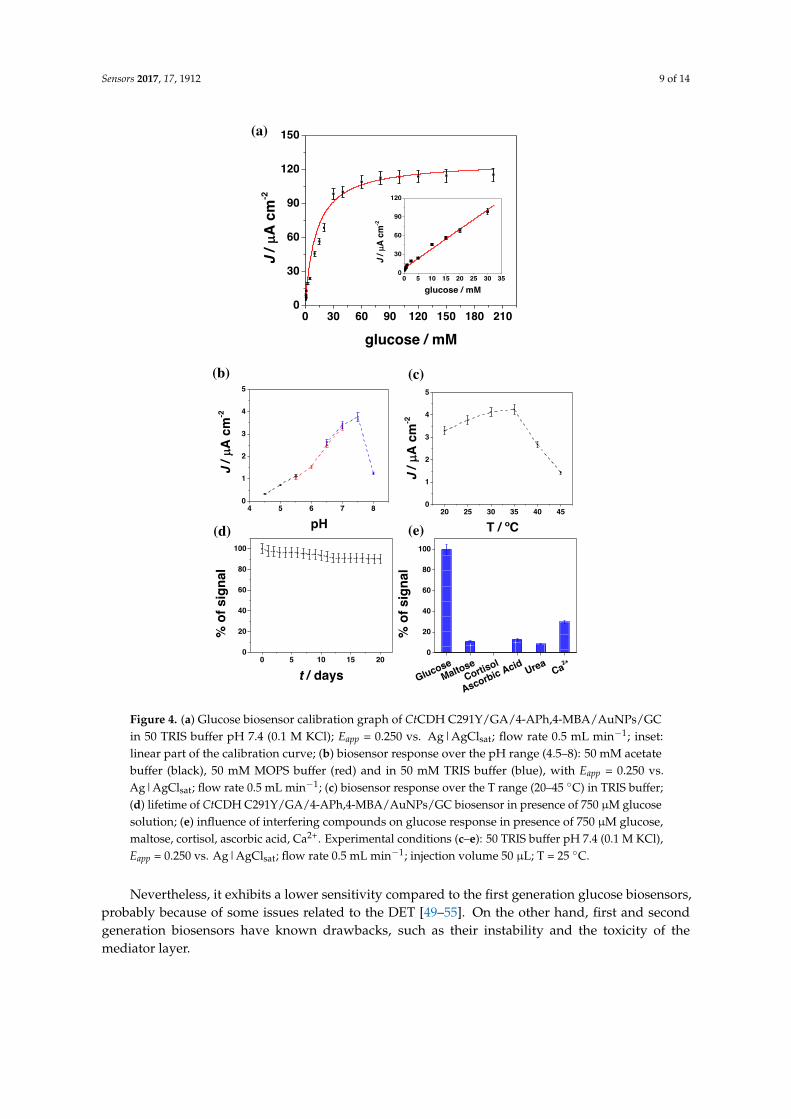
The calibration curve displayed a linear response range between 0.02 and 30 mM (R2 = 0.995,n = 5) with a sensitivity of 3.1 ± 0.1 µA mM−1 cm−2, as shown in the inset of Figure 4a. At higherconcentrations the amperometric response is no longer linear due to the saturation of the enzyme activesite. The detection limit for CtCDH C291Y/GA/4-APh,4-MBA/AuNPs/GC biosensor was found to be6.2 µM, calculated using the relation 3σ/S, where σ is the absolute standard deviation of the interceptand S is the slope of the calibration curve [47]. The analytical performances of the glucose biosensorand the kinetic parameters are listed in Table 2. The apparent kinetic parameters (Imax, KM
app) arein good agreement with the values reported in the literature for nanostructured electrodes [48]. It isinteresting to underline that today very few third generation glucose biosensors based on AscomycotaCDHs have been reported in the literature while most other glucose biosensors are based on first andsecond generation electron transfer mechanism of other GMC oxidoreductase enzymes (e.g., GOx).
Table 2. Electroanalytical and kinetic parameters of the CtCDH C291Y/GA/4-APh,4-MBA/AuNPs/GCbiosensor obtained by FIA amperometry in 50 mM TRIS buffer, pH 7.4. Applied potential: +0.250 V vs.Ag|AgClsat.
CtCDH C291Y/GA/4-APh,4-MBA/AuNPs/GC
Eapp/(V vs. Ag|AgClsat) +0.250KM
app/mM 11.7 ± 1.2Jmax/µA cm−2 126.9 ± 3.0
LOD/µM 6.2Linear range/mM 0.02–30
Sensitivity/µA mM−1 cm−2 3.1 ± 0.1R2 0.99
The proposed CtCDH C291Y/GA/4-APh,4-MBA/AuNPs/GC biosensor shows a clear increasein terms of sensitivity, selectivity, stability, extended linear range and lower detection limit comparedto other second and third generation glucose biosensors reported in the literature, as shown in Table 3.
Sensors 2017, 17, 1912 9 of 14
Sensors 2017, 17, 1912 8 of 14
enlarged surface area related to the electrodeposition of the AuNPs and the cross-linking of the enzyme, which ensure high number of immobilized enzyme molecules and stable enzyme layer.
The calibration curve displayed a linear response range between 0.02 and 30 mM (R2 = 0.995, n = 5) with a sensitivity of 3.1 ± 0.1 μA mM−1 cm−2, as shown in the inset of Figure 4a. At higher concentrations the amperometric response is no longer linear due to the saturation of the enzyme active site. The detection limit for CtCDH C291Y/GA/4-APh,4-MBA/AuNPs/GC biosensor was found to be 6.2 μM, calculated using the relation 3σ/S, where σ is the absolute standard deviation of the intercept and S is the slope of the calibration curve [47]. The analytical performances of the glucose biosensor and the kinetic parameters are listed in Table 2. The apparent kinetic parameters (Imax, KMapp) are in good agreement with the values reported in the literature for nanostructured electrodes [48]. It is interesting to underline that today very few third generation glucose biosensors based on Ascomycota CDHs have been reported in the literature while most other glucose biosensors are based on first and second generation electron transfer mechanism of other GMC oxidoreductase enzymes (e.g., GOx).
Figure 4. (a) Glucose biosensor calibration graph of CtCDH C291Y/GA/4-APh,4-MBA/AuNPs/GC in 50 TRIS buffer pH 7.4 (0.1 M KCl); Eapp = 0.250 vs. Ag|AgClsat; flow rate 0.5 mL min−1; inset: linear part of the calibration curve; (b) biosensor response over the pH range (4.5–8): 50 mM acetate buffer (black), 50 mM MOPS buffer (red) and in 50 mM TRIS buffer (blue), with Eapp = 0.250 vs. Ag|AgClsat; flow rate 0.5 mL min−1; (c) biosensor response over the T range (20–45 °C) in TRIS buffer; (d) lifetime of CtCDH C291Y/GA/4-APh,4-MBA/AuNPs/GC biosensor in presence of 750 μM glucose solution; (e) influence of interfering compounds on glucose response in presence of 750 μM glucose, maltose, cortisol, ascorbic acid, Ca2+. Experimental conditions (c–e): 50 TRIS buffer pH 7.4 (0.1 M KCl), Eapp = 0.250 vs. Ag|AgClsat; flow rate 0.5 mL min−1; injection volume 50 μL; T = 25 °C.
Figure 4. (a) Glucose biosensor calibration graph of CtCDH C291Y/GA/4-APh,4-MBA/AuNPs/GCin 50 TRIS buffer pH 7.4 (0.1 M KCl); Eapp = 0.250 vs. Ag|AgClsat; flow rate 0.5 mL min−1; inset:linear part of the calibration curve; (b) biosensor response over the pH range (4.5–8): 50 mM acetatebuffer (black), 50 mM MOPS buffer (red) and in 50 mM TRIS buffer (blue), with Eapp = 0.250 vs.Ag|AgClsat; flow rate 0.5 mL min−1; (c) biosensor response over the T range (20–45 C) in TRIS buffer;(d) lifetime of CtCDH C291Y/GA/4-APh,4-MBA/AuNPs/GC biosensor in presence of 750 µM glucosesolution; (e) influence of interfering compounds on glucose response in presence of 750 µM glucose,maltose, cortisol, ascorbic acid, Ca2+. Experimental conditions (c–e): 50 TRIS buffer pH 7.4 (0.1 M KCl),Eapp = 0.250 vs. Ag|AgClsat; flow rate 0.5 mL min−1; injection volume 50 µL; T = 25 C.
Nevertheless, it exhibits a lower sensitivity compared to the first generation glucose biosensors,probably because of some issues related to the DET [49–55]. On the other hand, first and secondgeneration biosensors have known drawbacks, such as their instability and the toxicity of themediator layer.

Sensors 2017, 17, 1912 10 of 14
Table 3. Comparison between glucose biosensors based on mediated (MET) and direct electrontransfer (DET). List of abbreviations: 1,1′-dimethylferrocene (DMFc), 1,2-diaminobenzene (p-DAB),4-aminophenol (4-APh), 4-mercaptobenzoic acid (4-MBA), Corynascus thermophilus cellobiosedehydrogenase (CtCDH), Corynascus thermophilus cellobiose dehydrogenase C291Y mutant (CtCDHC291Y), ferrocene-COOH (Fc-COOH), glassy carbon electrode (GC), glucose oxidase (GOx),glutaraldehyde (GA), gold (Au), gold nanoparticles (AuNPs), osmium (bpy)2poly (1-vinylimidazole)(PVI-Os), Prussian Blue (PB), screen-printed carbon electrode (SPCE), single walled carbon nanotubes(SWCNTs), titanium nanotubes (TiNTs).
Modified Electrode Eapp/V vs.Ag|AgClsat
LinearRange/mM LOD/µM Sensitivity/µA
mM−1 cm−2 Stability Reference
(GOx/Au/pDAB)-PB/AuNPs/TiNTs (1st generation) −0.35 0.01–0.70 3.2 248.0 >90% after 1 month [49]
GOx-GA/PB/Pt(1st generation) −0.05 0.01–1 5 80.0 83.3% after 23 days [50]
GOx/PB/SPCE(1st generation) −0.30 0.25–2 10.0 17.0 72% after 45 days [51]
GOx/Fc-COOH/SPCE(2nd generation) +0.25 1–5 180.0 2.0 ~80% after 3 weeks [52]
GOx/DMFc/G(2nd generation) +0.16 1–30 300 - - [53]
GOx-SWCNTs-PVI-Os/SPCE(2nd generation) +0.30 0.2–7.5 0.07 32 ~90% after 30 days [54]
CtCDH/GA/SWCNTs/SPCE(3rd generation) +0.10 0.1–30 10.0 - ~90% after 7.5 h [55]
CtCDH C291Y/GA/4-APh,4-MBA/AuNPs/GC
(3rd generation)+0.25 0.02–30 6.2 3.1 ~90% after 20 days this work
3.4. Effect of pH and Temperature, Interferences and Stability Studies
The effects of pH and temperature on the proposed glucose biosensor were evaluated andthe results are reported in Figure 4b. The optimum pH resulted to be pH 7 in TRIS buffer at atemperature of 35 C. A significant decrease in the current densities occurs below pH 5.5 and above8, in perfect agreement with the data reported in the literature about the optimum pH of the freeCDH [56]. The dependence on the temperature is shown in Figure 4c where it is possible to see that theamperometric response increased from 20 to 30–35 C and drastically decreased above 37 C, due to apossible inactivation of the enzyme caused by the temperature.
The stability and lifetime of the CtCDH C291Y/GA/4-APh,4-MBA/AuNPs/GC biosensor wasevaluated using the FIA system by monitoring the signal decrease within 20 days when the biosensoris used for one measurement per day, as reported in Figure 4d. The modified biosensor seems to retainabout 90% of its initial activity after 20 days, probably due to the stability of the enzyme layer directlyrelated to the nanostructuration of the electrode surface.
Finally, the selectivity of the proposed biosensor was studied in order to see the influence ofpossible interfering compounds generally present in human saliva such as maltose, cortisol, ascorbicacid, urea and calcium ions (Ca2+). The signal obtained for a fixed concentration of glucose (750 µM)was compared to that obtained with a sample containing the same glucose concentration plus equalamounts of the possible interfering compounds. The amperometric signal is lower than 10% forall compounds tested with the exception of Ca2+ ions, which potentially may interfere in realmeasurements (30% of glucose signal), probably because of its interaction with some amino acidresidues present between the DHCDH and CYTCDH domains [56].
3.5. Glucose Detection in Human Saliva
In order to demonstrate the feasibility of the modified electrode for the non-invasive detectionof glucose, the proposed biosensor was used to detect the concentration of glucose in humansaliva samples. The samples were collected according to the procedure reported in Section 2.3,referred to literature on saliva analysis. The reliability of the amperometric biosensor platform CtCDH

Sensors 2017, 17, 1912 11 of 14
C291Y/GA/4-APh,4-MBA/AuNPs/GC was evaluated by comparing the results with those obtained withthe glucose oxidase-peroxidase method. The proposed biosensor showed satisfactory results in all samplestested with a recovery between 95.0 and 97.4% (RSD values lower than 4%), as reported in Table 4.
Table 4. Glucose measurements in human saliva with the CtCDH C291Y/GA/4-APh, 4-MBA/AuNPs/GCbiosensor and with the glucose oxidase-peroxidase kit (GlucoContour XT), as reference method.Experimental conditions: 50 mM TRIS buffer pH 7.4, Eapp = +0.250 V vs. Ag|AgClsat.
Biosensor/mg dL−1 Reference Method/mg dL−1 Recovery/%
Sample 1 (male) 0.77 ± 0.03 0.79 ± 0.03 97.4Sample 2 (male) 0.96 ± 0.02 1.00 ± 0.04 95.7Sample 3 (male) 0.89 ± 0.03 0.92 ± 0.05 96.9
Sample 1 (female) 0.74 ± 0.03 0.75 ± 0.03 98.8Sample 2 (female) 0.71 ± 0.01 0.74 ± 0.02 95.0Sample 3 (female) 0.77 ± 0.02 0.80 ± 0.01 96.5
The glucose content was measured also in blood samples collected from the same healthypatients with a commercial self-monitoring system (GlucoContour XT) in order to evaluate thecorrelation between glucose saliva and blood levels, for future potential development of devicesfor non-invasive glucose monitoring [57]. Figure 5 shows a good correlation between salivary andblood glucose concentration, opening the doors to the development of possible self-non invasiveglucose monitoring devices.Sensors 2017, 17, 1912 11 of 14
Figure 5. Correlation between glucose blood and saliva glucose concentration in 6 healthy patients at fasting state. Salivary glucose was detected with the CtCDH C291Y/GA/4-APh,4-MBA/AuNPs/GC biosensor, blood glucose was detected with the commercial GlucoContour XT.
4. Conclusions
We have demonstrated the possibility to carefully monitor the surface coverage of AuNPs on the electrode surface through a direct electrochemical deposition method of AuNPs onto a glassy carbon electrode which allows to achieve an efficient DET thanks to the effective nanostructure and the cross-linking of CDH molecules. AuNPs resulted to be very efficient for retaining the enzyme activity and promoting the electron transfer. The CtCDH C291Y/GA/4-APh,4-MBA/AuNPs/GC biosensor showed great performances in terms of extended linear range and higher sensitivity, selectivity and stability compared to other glucose biosensors. The promising platform allowed the detection of glucose in human saliva with results in very good agreement with those obtained with the standard spectrophotometric method showing also a good correlation with glucose blood levels. For these reasons, the proposed biosensor may represent the basis for the development of a portable non-invasive device for glucose monitoring in diabetes mellitus patients.
Acknowledgments: A particular acknowledgment to Daniel Jacobsson for the SEM characterization of the AuNPs modified GC electrodes. The authors would like to thank for financial funding the Swedish Research Council (Vetenskapsrådet project 2014-5908), the European Commission (project “Bioenergy” FP7-PEOPLE-2013-ITN-607793) and a scholarship of the Erasmus+ Project Unipharma-Graduates, promoted by a Consortium of Italian Universities and coordinated by Sapienza University of Rome.
Author Contributions: P.B. and R.A. conceived and designed the experiments; P.B. performed the experiments and analyzed the data. L.G. and R.A. revised the manuscript and R.L. kindly provided CtCDH C291Y mutant.
Conflicts of Interest: The authors declare no conflicts of interest. All authors have revised and approved the final version.
References
1. Heller, A.; Feldman, B. Electrochemical glucose sensors and their applications in diabetes management. Chem. Rev. 2008, 108, 2482–2505.
2. Wang, J. Electrochemical glucose biosensors. Chem. Rev. 2008, 108, 814–825. 3. American Diabetes Association. Diagnosis and classification of diabetes mellitus. Diabetes Care 2014, 37,
S81–S90. 4. Janghorbani, M.; Van Dam, R.M.; Willett, W.C.; Hu, F.B. Systematic review of type 1 and type 2 diabetes
mellitus and risk of fracture. Am. J. Epidemiol. 2007, 166, 495–505. 5. Newman, J.D.; Turner, A.P.F. Home blood glucose biosensors: A commercial perspective. Biosens.
Bioelectron. 2005, 20, 2435–2453.
Figure 5. Correlation between glucose blood and saliva glucose concentration in 6 healthy patients atfasting state. Salivary glucose was detected with the CtCDH C291Y/GA/4-APh,4-MBA/AuNPs/GCbiosensor, blood glucose was detected with the commercial GlucoContour XT.
4. Conclusions
We have demonstrated the possibility to carefully monitor the surface coverage of AuNPs onthe electrode surface through a direct electrochemical deposition method of AuNPs onto a glassycarbon electrode which allows to achieve an efficient DET thanks to the effective nanostructure and thecross-linking of CDH molecules. AuNPs resulted to be very efficient for retaining the enzyme activityand promoting the electron transfer. The CtCDH C291Y/GA/4-APh,4-MBA/AuNPs/GC biosensorshowed great performances in terms of extended linear range and higher sensitivity, selectivity andstability compared to other glucose biosensors. The promising platform allowed the detection ofglucose in human saliva with results in very good agreement with those obtained with the standardspectrophotometric method showing also a good correlation with glucose blood levels. For these

Sensors 2017, 17, 1912 12 of 14
reasons, the proposed biosensor may represent the basis for the development of a portable non-invasivedevice for glucose monitoring in diabetes mellitus patients.
Acknowledgments: A particular acknowledgment to Daniel Jacobsson for the SEM characterization ofthe AuNPs modified GC electrodes. The authors would like to thank for financial funding the SwedishResearch Council (Vetenskapsrådet project 2014-5908), the European Commission (project “Bioenergy”FP7-PEOPLE-2013-ITN-607793) and a scholarship of the Erasmus+ Project Unipharma-Graduates, promoted by aConsortium of Italian Universities and coordinated by Sapienza University of Rome.
Author Contributions: P.B. and R.A. conceived and designed the experiments; P.B. performed the experimentsand analyzed the data. L.G. and R.A. revised the manuscript and R.L. kindly provided CtCDH C291Y mutant.
Conflicts of Interest: The authors declare no conflicts of interest. All authors have revised and approved thefinal version.
References
1. Heller, A.; Feldman, B. Electrochemical glucose sensors and their applications in diabetes management.Chem. Rev. 2008, 108, 2482–2505. [CrossRef] [PubMed]
2. Wang, J. Electrochemical glucose biosensors. Chem. Rev. 2008, 108, 814–825. [CrossRef] [PubMed]3. American Diabetes Association. Diagnosis and classification of diabetes mellitus. Diabetes Care 2014, 37,
S81–S90.4. Janghorbani, M.; Van Dam, R.M.; Willett, W.C.; Hu, F.B. Systematic review of type 1 and type 2 diabetes
mellitus and risk of fracture. Am. J. Epidemiol. 2007, 166, 495–505. [CrossRef] [PubMed]5. Newman, J.D.; Turner, A.P.F. Home blood glucose biosensors: A commercial perspective. Biosens. Bioelectron.
2005, 20, 2435–2453. [CrossRef] [PubMed]6. Lehmann, R.; Huber, M.; Beck, A.; Schindera, T.; Rinkler, T.; Houdali, B.; Weigert, C.; Häring, H.U.;
Voelter, W.; Schleicher, E.D. Simultaneous, quantitative analysis of UDP-N-acetylglucosamine, UDP-N-acetylgalactosamine, UDP-glucose and UDP-galactose in human peripheral blood cells, muscle biopsies andcultured mesangial cells by capillary zone electrophoresis. Electrophoresis 2000, 21, 3010–3015. [CrossRef]
7. Orata, F. Derivatization Reactions and Reagents for Gas Chromatography Analysis; Mohd, M.A., Ed.; InTech OpenAccess Publisher: Rijeka, Croatia, 2012; pp. 83–108. ISBN 978-953-0298-4. [CrossRef]
8. Wang, C.; Kong, H.; Guan, Y.; Yang, J.; Gu, J.; Yang, S.; Xu, G. Plasma phospholipid metabolic profiling andbiomarkers of type 2 diabetes mellitus based on high-performance liquid chromatography/electrospray massspectRometry and multivariate statistical analysis. Anal. Chem. 2005, 77, 4108–4116. [CrossRef] [PubMed]
9. Srinivasan, V.; Pamula, V.K.; Fair, R.B. Droplet-based microfluidic lab-on-a-chip for glucose detection.Anal. Chim. Acta 2004, 507, 145–150. [CrossRef]
10. Chen, S.-F.; Danao, M.-G.C.; Singh, V.; Brown, P.J. Determining sucrose and glucose levels in dual-purposesorghum stalks by Fourier transform near infrared (FT-NIR) spectroscopy. J. Sci. Food Agric. 2014, 94,2569–2576. [CrossRef] [PubMed]
11. Scheller, F.W.; Schubert, F.; Neumann, B.; Pfeiffer, D.; Hintsche, R.; Dransfeld, I.; Wollenberger, U.;Renneberg, R.; Warsinke, A.; Johansson, G. Second generation biosensors. Biosens. Bioelectron. 1991, 6,245–253. [CrossRef]
12. Antiochia, R.; Vinci, G.; Gorton, L. Rapid and direct determination of fructose in food: A newosmium-polymer mediated biosensor. Food Chem. 2013, 140, 742–747. [CrossRef] [PubMed]
13. Mazzei, F.; Favero, G.; Bollella, P.; Tortolini, C.; Mannina, L.; Conti, M.E.; Antiochia, R. Recent trends inelectrochemical nanobiosensors for environmental analysis. Int. J. Environ. Health 2015, 7, 267–291. [CrossRef]
14. Bollella, P.; Fusco, G.; Tortolini, C.; Sanzò, G.; Favero, G.; Gorton, L.; Antiochia, R. Beyond graphene:Electrochemical sensors and biosensors for biomarkers detection. Biosens. Bioelectron. 2017, 89, 152–166.[CrossRef] [PubMed]
15. Bollella, P.; Schulz, C.; Favero, G.; Mazzei, F.; Ludwig, R.; Gorton, L.; Antiochia, R. Green Synthesis andCharacterization of Gold and Silver Nanoparticles and Their Application for Development of a ThirdGeneration Lactose Biosensor. Electroanalysis 2017, 29, 77–86. [CrossRef]
16. Favero, G.; Fusco, G.; Mazzei, F.; Tasca, F.; Antiochia, R. Electrochemical characterization of graphene andMWCNT screen-printed electrodes modified with AuNPs for laccase biosensor development. Nanomaterials2015, 5, 1995–2006. [CrossRef] [PubMed]

Sensors 2017, 17, 1912 13 of 14
17. Katz, E.; Willner, I. Integrated nanoparticle–biomolecule hybrid systems: Synthesis, properties, andapplications. Angew. Chem. Int. Ed. 2004, 43, 6042–6108. [CrossRef] [PubMed]
18. Krueger, M.; Berg, S.; Stone, D.A.; Strelcov, E.; Dikin, D.A.; Kim, J.; Cote, L.J.; Huang, J.; Kolmakov, A.Drop-casted self-assembling graphene oxide membranes for scanning electron microscopy on wet and densegaseous samples. ACS Nano 2011, 5, 10047–10054. [CrossRef] [PubMed]
19. Bollella, P.; Mazzei, F.; Favero, G.; Fusco, G.; Ludwig, R.; Gorton, L.; Antiochia, R. Improved DETcommunication between cellobiose dehydrogenase and a gold electrode modified with a rigid self-assembledmonolayer and green metal nanoparticles: The role of an ordered nanostructuration. Biosens. Bioelectron.2017, 88, 196–203. [CrossRef] [PubMed]
20. Shah, A.T.; Din, M.I.; Bashir, S.; Qadir, M.A.; Rashid, F. Green synthesis and characterization of silvernanoparticles using Ferocactus echidne extract as a reducing agent. Anal. Lett. 2015, 48, 1180–1189. [CrossRef]
21. El-Deab, M.S.; Sotomura, T.; Ohsaka, T. Size and crystallographic orientation controls of gold nanoparticleselectrodeposited on GC electrodes. J. Electrochem. Soc. 2005, 152, C1–C6. [CrossRef]
22. Hezard, T.; Fajerwerg, K.; Evrard, D.; Collière, V.; Behra, P.; Gros, P. Gold nanoparticles electrodeposited onglassy carbon using cyclic voltammetry: Application to Hg(II) trace analysis. J. Electroanal. Chem. 2012, 664,46–52. [CrossRef]
23. Luo, X.-L.; Xu, J.-J.; Du, Y.; Chen, H.-Y. A glucose biosensor based on chitosan–glucose oxidase–goldnanoparticles biocomposite formed by one-step electrodeposition. Anal. Biochem. 2004, 334, 284–289.[CrossRef] [PubMed]
24. Ustarroz, J.; Ke, X.; Hubin, A.; Bals, S.; Terryn, H. New insights into the early stages of nanoparticleelectrodeposition. J. Phys. Chem. C 2012, 116, 2322–2329. [CrossRef]
25. Matsumura, H.; Ortiz, R.; Ludwig, R.; Igarashi, K.; Samejima, M.; Gorton, L. Direct electrochemistry ofPhanerochaete chrysosporium cellobiose dehydrogenase covalently attached onto gold nanoparticle modifiedsolid gold electrodes. Langmuir 2012, 28, 10925–10933. [CrossRef] [PubMed]
26. Ludwig, R.; Ortiz, R.; Schulz, C.; Harreither, W.; Sygmund, C.; Gorton, L. Cellobiose dehydrogenase modifiedelectrodes: Advances by materials science and biochemical engineering. Anal. Bioanal. Chem. 2013, 405,3637–3658. [CrossRef] [PubMed]
27. Cipri, A.; Schulz, C.; Ludwig, R.; Gorton, L.; Del Valle, M. A novel bio-electronic tongue using differentcellobiose dehydrogenases to resolve mixtures of various sugars and interfering analytes. Biosens. Bioelectron.2016, 79, 515–521. [CrossRef] [PubMed]
28. Falk, M.; Pankratov, D.; Lindh, L.; Arnebrant, T.; Shleev, S. Miniature direct electron transfer based enzymaticfuel cell operating in human sweat and saliva. Fuel Cells 2014, 14, 1050–1056. [CrossRef]
29. Zamocky, M.; Ludwig, R.; Peterbauer, C.; Hallberg, B.M.; Divne, C.; Nicholls, P.; Haltrich, D. Cellobiosedehydrogenase-a flavocytochRome from wood-degrading, phytopathogenic and saprotropic fungi.Curr. Protein. Pept. Sci. 2006, 7, 255–280. [CrossRef] [PubMed]
30. Schulz, C.; Ludwig, R.; Gorton, L. Polyethyleneimine as a promoter layer for the immobilization of cellobiosedehydrogenase from Myriococcum thermophilum on graphite electrodes. Anal. Chem. 2014, 86, 4256–4263.[CrossRef] [PubMed]
31. Tavahodi, M.; Ortiz, R.; Schulz, C.; Ekhtiari, A.; Ludwig, R.; Haghighi, B.; Gorton, L. Direct Electron Transferof Cellobiose Dehydrogenase on Positively Charged Polyethyleneimine Gold Nanoparticles. ChemPlusChem2017, 82, 546–552. [CrossRef]
32. Ortiz, R.; Rahman, M.; Zangrilli, B.; Sygmund, C.; Micheelsen, P.O.; Silow, M.; Toscano, M.D.; Ludwig, R.;Gorton, L. Engineering of Cellobiose Dehydrogenases for Improved Glucose Sensitivity and ReducedMaltose Affinity. ChemElectroChem 2017, 4, 846–855. [CrossRef]
33. Dai, X.; Nekrassova, O.; Hyde, M.E.; Compton, R.G. Anodic stripping voltammetry of arsenic(III) using goldnanoparticle-modified electrodes. Anal. Chem. 2004, 76, 5924–5929. [CrossRef] [PubMed]
34. Wang, X.; Falk, M.; Ortiz, R.; Matsumura, H.; Bobacka, J.; Ludwig, R.; Bergelin, M.; Gorton, L.;Shleev, S. Mediatorless sugar/oxygen enzymatic fuel cells based on gold nanoparticle-modified electrodes.Biosens. Bioelectron. 2012, 31, 219–225. [CrossRef] [PubMed]
35. Henson, B.S.; Wong, D.T. Collection, storage, and processing of saliva samples for downstream molecularapplications. Oral Biol. Mol. Technol. Appl. 2010, 666, 21–30.
36. Mehta, Y.P.; Munde, B.P. Study of blood sugar levels in high risk neonates using glucometer method andlaboratory glucose oxidase peroxidase method. Int. J. Contemp. Pediatr. 2017, 4, 1185–1192. [CrossRef]

Sensors 2017, 17, 1912 14 of 14
37. Trinder, P. Determination of glucose in blood using glucose oxidase with an alternative oxygen acceptor.Ann. Clin. Biochem. 1969, 6, 24–27. [CrossRef]
38. Wilkins, E.; Atanasov, P. Glucose monitoring: State of the art and future possibilities. Med. Eng. Phys. 1996,18, 273–288. [CrossRef]
39. Oldham, K.B. Analytical expressions for the reversible Randles-Sevcik function. J. Electroanal. Chem.Interfacial Electrochem. 1979, 105, 373–375. [CrossRef]
40. Daglia, M.; Antiochia, R.; Sobolev, A.P.; Mannina, L. Untargeted and targeted methodologies in the study oftea (Camellia sinensis L.). Food Res. Int. 2014, 63, 275–289. [CrossRef]
41. Murata, K.; Kajiya, K.; Nukaga, M.; Suga, Y.; Watanabe, T.; Nakamura, N.; Ohno, H. A Simple FabricationMethod for Three-Dimensional Gold Nanoparticle Electrodes and Their Application to the Study of theDirect Electrochemistry of Cytochrome c. Electroanalysis 2010, 22, 185–190. [CrossRef]
42. Trasatti, S.; Petrii, O.A. Real surface area measurements in electrochemistry. Pure Appl. Chem. 1991, 63,711–734. [CrossRef]
43. Lavagnini, I.; Antiochia, R.; Magno, F. An extended method for the practical evaluation of the standard rateconstant from cyclic voltammetric data. Electroanalysis 2004, 16, 505–506. [CrossRef]
44. Lavagnini, I.; Antiochia, R.; Magno, F. A calibration-base method for the evaluation of the detection limit ofan electrochemical biosensor. Electroanalysis 2007, 19, 1127–1230. [CrossRef]
45. Laviron, E. General expression of the linear potential sweep voltammogram in the case of diffusionlesselectrochemical systems. J. Electroanal. Chem. Interfacial Electrochem. 1979, 101, 19–28. [CrossRef]
46. Rusling, J.F.; Zhang, Z. Thin films on electrodes for direct protein electron transfer. In Handbook of Surfacesand Interfaces of Materials; Elsevier: Amsterdam, The Netherlands, 2001; pp. 33–71.
47. Shrivastava, A.; Gupta, V.B. Methods for the determination of limit of detection and limit of quantitation ofthe analytical methods. Chron. Young Sci. 2011, 2, 21–25. [CrossRef]
48. Tasca, F.; Zafar, M.N.; Harreither, W.; Nöll, G.; Ludwig, R.; Gorton, L. A third generation glucose biosensorbased on cellobiose dehydrogenase from Corynascus thermophilus and single-walled carbon nanotubes.Analyst 2011, 136, 2033–2036. [CrossRef] [PubMed]
49. Gao, Z.-D.; Qu, Y.; Li, T.; Shrestha, N.K.; Song, Y.-Y. Development of amperometric glucose biosensor basedon Prussian Blue functionlized TiO2 nanotube arrays. Sci. Rep. 2014, 4, 6891. [CrossRef] [PubMed]
50. Liu, Y.; Chu, Z.; Zhang, Y.; Jin, W. Amperometric glucose biosensor with high sensitivity based onself-assembled Prussian Blue modified electrode. Electrochim. Acta 2009, 54, 7490–7494. [CrossRef]
51. Sekar, N.C.; Shaegh, S.A.M.; Ng, S.H.; Ge, L.; Tan, S.N. A paper-based amperometric glucose biosensordeveloped with Prussian Blue-modified screen-printed electrodes. Sens. Actuators B Chem. 2014, 204, 414–420.[CrossRef]
52. Lawrence, C.S.K.; Tan, S.N.; Floresca, C.Z. A “green” cellulose paper based glucose amperometric biosensor.Sens. Actuators B Chem. 2014, 193, 536–541. [CrossRef]
53. Cass, A.E.G.; Davis, G.; Francis, G.D.; Hill, H.A.O.; Aston, W.J.; Higgins, I.J.; Plotkin, E.V.; Scott, L.D.L.;Turner, A.P.F. Ferrocene-mediated enzyme electrode for amperometric determination of glucose. Anal. Chem.1984, 56, 667–671. [CrossRef] [PubMed]
54. Gao, Q.; Guo, Y.; Zhang, W.; Qi, H.; Zhang, C. An amperometric glucose biosensor based on layer-by-layerGOx-SWCNT conjugate/redox polymer multilayer on a screen-printed carbon electrode. Sens. ActuatorsB Chem. 2011, 153, 219–225. [CrossRef]
55. Zafar, M.N.; Safina, G.; Ludwig, R.; Gorton, L. Characteristics of third-generation glucose biosensors basedon Corynascus thermophilus cellobiose dehydrogenase immobilized on commercially available screen-printedelectrodes working under physiological conditions. Anal. Biochem. 2012, 425, 36–42. [CrossRef] [PubMed]
56. Harreither, W.; COman, V.; Ludwig, R.; Haltrich, D.; Gorton, L. Investigation of graphite electrodes modifiedwith cellobiose dehydrogenase from the ascomycete Myriococcum thermophilum. Electroanalysis 2007, 19,172–180. [CrossRef]
57. Zhang, W.; Du, Y.; Wang, M.L. Noninvasive glucose monitoring using saliva nano-biosensor. Sens. Biol.Sens. Res. 2015, 4, 23–29. [CrossRef]
© 2017 by the authors. Licensee MDPI, Basel, Switzerland. This article is an open accessarticle distributed under the terms and conditions of the Creative Commons Attribution(CC BY) license (http://creativecommons.org/licenses/by/4.0/).