a thermodynamic study of the system pbo-pbs
TRANSCRIPT

Scholars' Mine Scholars' Mine
Masters Theses Student Theses and Dissertations
1960
A thermodynamic study of the system PbO-PbS A thermodynamic study of the system PbO-PbS
John P. Hager
Follow this and additional works at: https://scholarsmine.mst.edu/masters_theses
Part of the Metallurgy Commons
Department: Department:
Recommended Citation Recommended Citation Hager, John P., "A thermodynamic study of the system PbO-PbS" (1960). Masters Theses. 2672. https://scholarsmine.mst.edu/masters_theses/2672
This thesis is brought to you by Scholars' Mine, a service of the Missouri S&T Library and Learning Resources. This work is protected by U. S. Copyright Law. Unauthorized use including reproduction for redistribution requires the permission of the copyright holder. For more information, please contact [email protected].

A THERMODYNAMIC STUDY OF THE sYSTEM PbO-PbS
BY
JOHN Po HAGER
A
THESIS
submitted to the faeu:tty of the
SCHOOL OF MINES AND METALLURGY OF THE UN·IVERSITY OF MISSOURI
in partial fuI:rillment of the work required for the
Degree of
MASTER OF SCIENCE. IN METALLURGICAL ENGINEERING
Rolla, Missouri
1960
Approved by

ABSTRACT
An experimental investigation t~as conducted 1n· ord·er
to determine the thermodynamic and kinetic behavior of the
system PbO-PbSo
The thermodynamic· behavior of the system PbO-PbS was studied by measuring the P802 in argon-so2 mixtures equili- .
brat_ed with various PbO-PbS mixtures in a recirculating
type _equilibrium apparatus, and analyzing the condensed
phases by means of X-ray diffractiono
The effect of temperature and PbO/PbS ratio on the
rate of S02 evolution was investigated in order to determine
the reaction mechanisms involved in tpe approach· to equili
briumo
A sodium hydroxide, hydrogen peroxide titration
technique was employed in the analysis of so2 in the gas
mixtureso
A detailed description of the apparatus and
experimental procedure is given for both the equilibrium
and kinetic s·tudieso
At constant temperature the variation of r802 with
composition was found to consist of several horizontal
lines connected by diagonal 11neso Below 733°C the
is9therms consisted of ttio horizontals connected by one

ii
diagonal line~ Above 733oc the isotherms .consisted of
three, horizontals connected by two diagonal .lines~ . i --ray I •
ana~ysis of the condensed phases showed.that the.horizontals
_represe:p.ted areas· of three~phase stability and the diagonal
lines areas of two-phas.e .sta.bilityo
A phase diagram was constructed for th.e system
PbO-PbSo The equi;:tibrium results indicated the pres.ence
of iiquid solubility in lead and solid-solubility in the
,basic sulfates; however, the exact composition of the
liquid lead and the basic sulfates· was not_ determined. The
Pb-S-0 diagram, proposed. by Kellogg and Basu, has been
corrected to ~oincide with the PbO-PbS diagr~ ~rom this
investigationo
A ·11n~ar free. energy equation was der"ived for the
~For of Pbso4~4Pb0.in the temperature range 7000-760°Co·
Additional calculations trere made r.or the~H0 r :·and '6.S0 r
of PbS04··4PbOo The calculations from the experimental
results agreed very well i-,i th the calculations made from
the ·a.ata of previous investigatorso
The· kinetic· studies indicated that the reaction
mechanism in the system PbO-PbS is '(l) conversion of all .
of the PbO or PbS (~hichever is the minor co~stituent)
to either PbS04°4PbO or PbS04.o2PbO, and (2) reaction
b~t~een _the basic sulfate· ·and either Pb or PbS to produce

111
From the results of this investigatio~ it was
established that the equilibrium 2Pb0 + PbS._-·-;-3Pb + S02,
which was thought to be the basis of ore-hearth smelting,
is unstable e.t all PbO/PbS ratios in the temperature range
7oo0 -760°c.

ACKNOWLEDGEMENTS
The author wispes to express h~s appreciation and
gratitude to Dro Ao Wo Schlechten, C~irinan of the Depart
ment .of Metallurgical Engineering and Dro A.H.· Larson,
Assistant Professor of Metallurgy for their co-µnsel and
assistance throughout the course of this investigationo
$pecial thanks is also express.ed to Dro WC> J .• · Kroll,
Cons~lting Metallurgist, Corvallis, Oregon for making funds
·available for c:onstruction of the experiµlental apparatus.
The author is also indebted to various members of
the Metallurgical Engineering, Ceramic, and Chemistry
Departments for advice and consultat~on; and, ·to Dro To
Ejima, f~rmer graduate student, for the constru~tion of
the glass portion of the experimental apparatuso

TABLE OF CONTENTS
CHAPTER PAGE
1
;I.
1
1
3
9
!. INTRODUCTION. • • • • • • . •. • • • • • • • •
II.
III.
IV.
v. VI.
VII.
Statement of the_problem. • • • • • • • • •
Organization of the problem • • • • • • • • Importance of the study. • • • • • • • • • •
REVIEW OF THE LITERATURE. • • • • • . . . •· . PREPARATION. OF PbO-PbS MIXTURES • • • • • • •
THE APPAP.ATUS AND E..XPERIMENTAL PROCEDURE • • •
The Apparatus • • • • • • • • • • • • • • • •
The gas purification system
The equilibrium apparatus .••
• •
• •
_Experimental Procedures
EXPERJMENTAL RESULTS • • •
THERMODYNAMIC CALCULATIONS
• • • • •
• • • • •
• • • • •
• • • • •
. .. . . . • • • • •
• • • • •
• • • • •
Calculations from experimental results. . -. Calculations from results of previous
12
12
12
19
27
33
47
47
investigations. • • • • • • • • • • • • • 54
Graphical representation of the thermodynamic
calculations. • • • • • • • • • . . ·• • •
KINETIC STUDIES • • • • • • • • • • • • • • •
59
67
Review of th~ literature. • • • • • • • • • 67
The apparatus and experimental procedure. • 69
Experimental results. • • • • • • • • • • • 76

vi
CHAPTER PAGE
Discussion and conclusions • • • 0 • • • • • 81
VIII. SlllVIM.ARY AND CONCLUSIONS • • • 0 • 0 0 • • 0 88
BIBLIOGRAPHY 0 0 • • 0 • • • .. • • 0 • 0 • • • 98
APPENDICES • • • • • • • C) • • • 0 • • • • • 100
VITA • • • • 0 • • • • • 0 • • • • .. 126

LIST OF FIGURES
FIGURE
l. Composit~on Diagram, after Kellogg and Basu,
. for the Pb-S-0 System_ Between 6160 - 733~C 0 0
2o Composition Diagram, · after Kellcg g and Ba.~u,
for the Pb-S-0 System Above 733°C, but -Below
the Liquidu$ • 0 • • e O O . • . 0 0 • • • 0 . . . .
PAGE
5
6
3. .The Apparatus • o • • • .• • • • • • • • • • • • 13
4 • . Schematic Diagram of Gas ~i~ica~i~n System. o 14
5.
l?.
Gas Purification System 0 . 0 • • 0 0 0 0 o e O •
Schematic Diagram o;f Equilibrium Apparatus. 0 • . .
15
20
7. Eq'q.ilibrium Apparatus o • • • • • • • o •• ·• • • 21
B. Reac_tion ~be and Furnace Assembly for
Equilibrium Apparatus O O O O e • o e • • • •
9 .• Furnace Electrical Power Control. • 0 • • • • •
10.- Gas .Analysis Apparatus. 0 • • • o O O • 0 • . 0 •
23
25
'30
llo Equilibrium Pso2 Values r~r _the Sys~em PbO-PbS
Between 700~ 76o0 c o •••••• o o • ~ • • 38
120 . Proposed Phase Diagram fo~ · the ~y~tem PbO~PbS
Between 7oo0 - .76o0 c •••• 0 0 . • 0 0 44
13. Phase Diagram, after Kellcg g and Basu, for the
System PbO-PbS Between 7oo0 - 760°C .. 0 0 0 0 46
14~ . Temperature Depen~ence . of .6._ F~r of Pb~04°4Pb0
Between .. 7co0 - 76o 0 c 0 • 0 0 0 0 0 0 0 0 ·o 0 0 63

FIGURE
l5o Schematic Diagram or Kinetic Apparatus 0 0 0 0 0
16. Reaction Tube .and Furnace Assembly !'or Kineti·c
viii
.PAGE
70
Apparatus • • • • • • . o • • • o • • • • • o • o 71
17. Effect of Flow Rate on Reaction Velocity. • • • 78
18. Temperature Dependence of the Reaction Velocity. 79
19. Dependence of Reaction Velocity on PbQ/PbS
Ratio O O O O O O O O O O O O O O O O O • 0 0 80
20. Moles of Pbso4.4Pb0 and P~S _per Mole o~ Pb at
Various PbO/PbS Ratios. o • o • ~ • 0 • 0 0 0 85
21. Corrected Composition Diagr~ f"or the Pb-S-0
System Above 733°C o •••• o • o o o. • • • 95

LIST OF TABLES
TABLE PAGE
I. Equilibrium P802 Values for t~e System
FbO-PbS Between 700° - 76o0
c Together -with
the Phases Identiried in the Reacted Charges 34
II. The 2G Values Used in Interpreting the X-ray
Diffraction Data . . . . . . . . . . 39
III. -~quilibria µivestigated Together with the
Equilibr:iu11 Values of' Pso~. . • . • • • . . 49 ~
IV. Equations for the Free Energy of Formation of
PbO, PbS, so2 es a Function of Temperature. 51
V. Ce..lculs. ted Val uas of' .6.. F 0 f of _PbS04. 4Pb0 ·and
_Pbso4 .2Pb0 from the Experimental Data .. . • • . 55
VI. Equilibria Studied by Kellogg and Basu Together
with ~F0 Equations. • • • • • • • • • • • • 56
VII. Calc~atcd Values of ,6.F0r of PbS04·4PbO and_
Pbso4 .2Pb0 ~rom the De.ta or Kellogg and
Basu ••• e O e • e O • • • • • • • • • • •
VIII. S-ummary of Thermo.dynamic Calculations. • • • •
IX. AveragE: Deviation or .6.F0 :r of' PbS04 .. 4PbO .Values
from this Investigation and those rrom
60
61
KBllogg and Basu. • • • • • • • • • • • • • 65
Xo X-ray Identificetion.or Phases in Partially
Reacted PbO-PbS Mixtures • • • • • • • • • • 82

x
TABLE PAGE
XI. Linear·Free Energy Equations for .6.F0 f: of
PbSo4.4PbO o o •••••••• o • o o • • • 91

CHAPTER I
INTRODUCTION
Statement of the problemo The purpose of this
experimental investigation was (1) to determine some of the
thermodynamic properties of the system PbO-PbS,.(2) to
determine the equilibrium phases and their range of
stability in the system PbO-PbS, (3) to determine the
mechanism(s) of the reactions in the system PbO-PbSo
Organization of the problemo The problem consisted
of two types of experim~ntal measurements: (l) equilibrium
measurements, (2) kinetic measurementso The -results have
been presented in separate chapterso
The kinetic study was conducted to supplement the
equilibrium study, in order to determine the possible
reaction mechanism(s) involved in the approach to ~quili
brium. The kinetic study is discussed separately in
Chapter VIIo
Importance of the study. The process whereby
metallic lead is produced by the reaction 2Pb0 t PbS ~
3Pb+ so2 , is very important in the metallurgy of lead,
because it makes possible the direct smelting of lead . . .
sulfide by controlled ·oxidationo

Consequently, any knowledge of the thermodynamic
or kinetic behavior of the system PbO-PbS would be of
2
prime importance t.o the understanding· and possible i.11prove
ment of lead smelting :rr ocesses involvfug PbO and PbS.
The terminology "system PbO-PbS" is used in accord
ance with the thermodynamic definition of syst~,i •. e., the
isolated portion of the universe which is chosen far thermo
dynamic considerationo This terminology is not to.be
construed as referring to a binary system, whereas the
system PbO-PbS is the vertical section PbO-PbS in the
Fb-S-0 system.

CHAPTER II
REVIEW OF THE LITERATURE
The earliest reported work on ·the thermodynamic
properties of the system Pb-S-0 is that of Schenck and
Rassbach1 (1908). Additional investigations by ~einders2
(1915) and by Schenck and coworkers; Schenck and Albers3 . . . .
(1918)," Schenck and Borkenstein4 (1925), have beenr~portedo
The results·or these investigators have been revie~
ed by Kellogg and_Basu5 who have recently (1959) reinvesti
gated the thermodynamic -properties of the system Pb-S-Oo
The results of their investigation have shown that
the early data lack precision and agreement; values of
Pso2 given by Schenck and coworkers are badly scattered
and are 10-20~ higher than those reported by Kellogg 8:D,d
Basuo The data of Reinders likewise give values of Pso2 which are l-5fo highero
The lack of precision of the earlier work is evident
in the report of Schenck and coworkers that PbS0403PbO
rather than PbS04o4PbO is stable at high te~peratureso
The work of Lander6 on the system PbS04°PbO, and the .
results of Kellogg and Basu have substantiated that
Pbso4°4Pb0 r ·ather than Pbso4°3Pb0 is the stable basic
sulfateo

Kellogg and Basu have stated that they believe the
values of Pso2 found by earlier investigato~s are high
because of incomplete removal of moisture and adsorbed
gases from the sample and refractories; a precaution which
was ta.ken in their work. ·
4
The experimental work of Kellogg and Bas~ consisted
of measuring the equilibrium value of _Pso2 for the following
equilibria in the temperature range 800-ll00°K.:
1. PbS + 7PbS04 ~4(PbS04 •PbO) + 4802
2. PbS + lO(PbS04·PbO) ,, 7(PbS04•2PbO) + 4S02
3. PbS + 8(PbS04 •2PbO) ____. 5(PbS04•4PbO) + 4802
4. Pb+ PbS04•4PbO ~6Pb0 + 502
5. 2PbS + PbS04.2PbO ~5Pb + 3S02
From the results of the above equilibria, together
with thermodynamic calculations for three additional
equilibria, they have constructed a consistent thermodyna
mic phase diagram, and composition diagrams for the system
Pb-s-o. The composition diagram for temperatures below
733oc is illustrated in Figure 1, and for temperatures
above 733°C in Figure 2~
The heat and free energy of .formation of . the _
compounds PbS04.PbO, PbS04•2PbO, and PbS04.4PbO at 298°K
were also determined from the data.
According to the composition diagrams in Figures

5
Pb MOLE •1. 0 ,. PbO
FIG.- I
. so / 3
COMPOSITION DIAGRAM AFTER KELLOGG AND
· BASU, FOR THE Pb - S - 0 SYSTEM BETWEEN
616°-733°C
5
0

s
/
~PbS04
PbSOt • PbCt' , Pb50+· ZPbO ,
• Pb50+·4Pb0 '
Po MOLE •1. 0 _ _....,_
FIG.-2
COMPOSITION DIAGRAM, AFTER KELLOGG AND
. BASU . FOR THE . Pb- s.;.;.o SYSTEM ABOVE . ) .
733°C, BUT BELOW THE LIQUIDUS.
6
.Q

1 and 2, the equilibrium 2Pb0-+ lPbS~::.:~ 3Pb + so2 is
metastable* at all temperatures. Below 733°C the reaction
sequence £or stable equilibrium or a 2Pb0/1PbS mixture is
PbS + 8Pb0--> PbS04•4PbO -t 4Pb
PbS04•4PbO + 3PbS~.=.::.:;8Pb + 4802,
and above 733°C the rea.ction sequence is
PbS -t 6Pb0 -· -~> PbSO 4 • 2Pb0 + 4Pb
PbS04 • 2Fb0 + 2PbS ~-=:;SPb + 3S02•
Since Kellogg and Basu have not measured the Pso2
above PbO-PbS mixtures, the question a.rises as to whether
the reactions between PbO and PbS are metastable or stable
equilibria.
Schenck and Borkenstein :found · that the Pso2
above
a mixture of PbO and PbS was .216 atm. at 1100°K. From
the data of Kellogg and Basu, the calculated value of
P802 at 1100°K for the metastable equilibrium 2Pb0 + PbS.
7
~-~3Pb + so2 is .333 atm., and ror the stable equilibrium
PbS04 • 2Pb0 + PbS ~~ 5Pb + 3802 the Pso2 is .1 71 a tm. at
ll00°K.
*Metastable equilibrium is a peculiar state of pseudo-equilibrium in which the system has acquired energy beyond that ror its most stable state, but because or the long period or time required for transition to a state or lower energy it remains in a state 0£ higher energy.

8
The results o:r Schenck and Borkenstein obviously do ·
not indicate which equilibrium, stable or metastable,
represents the thermodynamic behavior· of' the system PbO-PbS.
On the basis of the above information, it was con
cluded that the thermodynamic behavior of the system PbO-PbS
could be determined by (1) measuring the equilibrium P502
values above various PbO-PbS mixtures at severa1 tempera
tures, ·and (2) analyzing the reacted mixtures by means of
X-ray diffraction.

CHAPTER III
PREPARATION OF PbO-PbS MIXTURES
In order to measure the equilibrium values of P802 for the system PbO-PbS, it was necessary to prepare PbO-PbS
mixtures with varying ratios of PbO to PbS. These mixtures
were prepared in the 1aboratory by mixing purified PbO and
purified PbS in various mole ratios of PbO to PbS.
To obtain puri:ried PbS, massive crystals or natural
galena were crushed and sized until several po1.lllds of -200,
+325 mesh particles were obtained. The natural galena
crystals were then purified by a dense medium separation
to eliminate the gangue material •. and then an ammonium
acetate leach to remove the lead oxides.
The procedure for the dense medium separation of the
galena. crystals .follows. A few grams or galena crystals
were placed in a. 1000 c. c. beaker containing a derise
medium with a specific gravity of 2.95. Eastman Kodak
tetrabromoethane was used as the dense medium. The crystals
were slowly agitated while the impurities such as silica
and calcite rose to the surface of the liquid and were
removed. The crystals remaining in the bottom or the
beaker were then removed and washed several times with
carbon tetrachloride • .

10
The procedure for the ammonium acetate leaching
follows. The galena crystals frcm the dense medium separa
tion were placed in ·a boiling solution of concentrated
ammonium acetate, and allowed to boil for a period of 30
minutes. After this time the crystals were removed from
the leach solution and washed several times with boiling
water. The crystals were then washed with. acetone and dried
at 100°c for a period of one hour.
Examination of the dried crystals with a binocular
microscope showed that the galena crys·tals were virtually
free of any gangue materials or surface oxidation.
The purified FbO wa.s Fisher's National Fine-Grade
Pbo. A screen analysis showed that .the average particle
size was -200, +325 mesh. The PbO was dried overnight at
100°c.
The purified PbO and PbS were used to prepare PbO-PbS
mixtures in the following PbO/FbS mole ratios: 20:1, 13:1,
10:1, 9:1, 8:1, 7:1, 6:1, 5.3:1, 4:1, 2:1, 1:1, 1:2, 1:4,
1:6, 1:8, 1:10, and 1:20.
The mixtures were prepared in 30 gram lots, and were
thoroughly mixed to obtain a homogeneous mixture. The PbO
and PbS were weighed on an analytical balance to the near
est tenth of a milligram.
Each mixture was placed in a. separate bottle with an

air tight lid to prevent adsorption of' moisture. The
reaction boats were filled from the mixtures contained in
these bottles.
11

CHAPTER IV
THE APPABATJJS AND EXPERIMENTAL PROCEDURE
The experimental technique of the equilibrium studies
consisted of (1) measur:ing the P802 in an argon-so2 mixture
which was equilibrated with a PbO-PbS mixture .in a recircu
lating type equilibrium apparatus, and (2) analyzing ·the
condensed phases by X-ray diffractiono
Io THE APPARATUS
The apparatus used in this investigation can be
divided into two major ·portions: the gas purification
system and the equilibrium apparatus·o The entire ~pparatus
is depicted photographically in Figure 3o
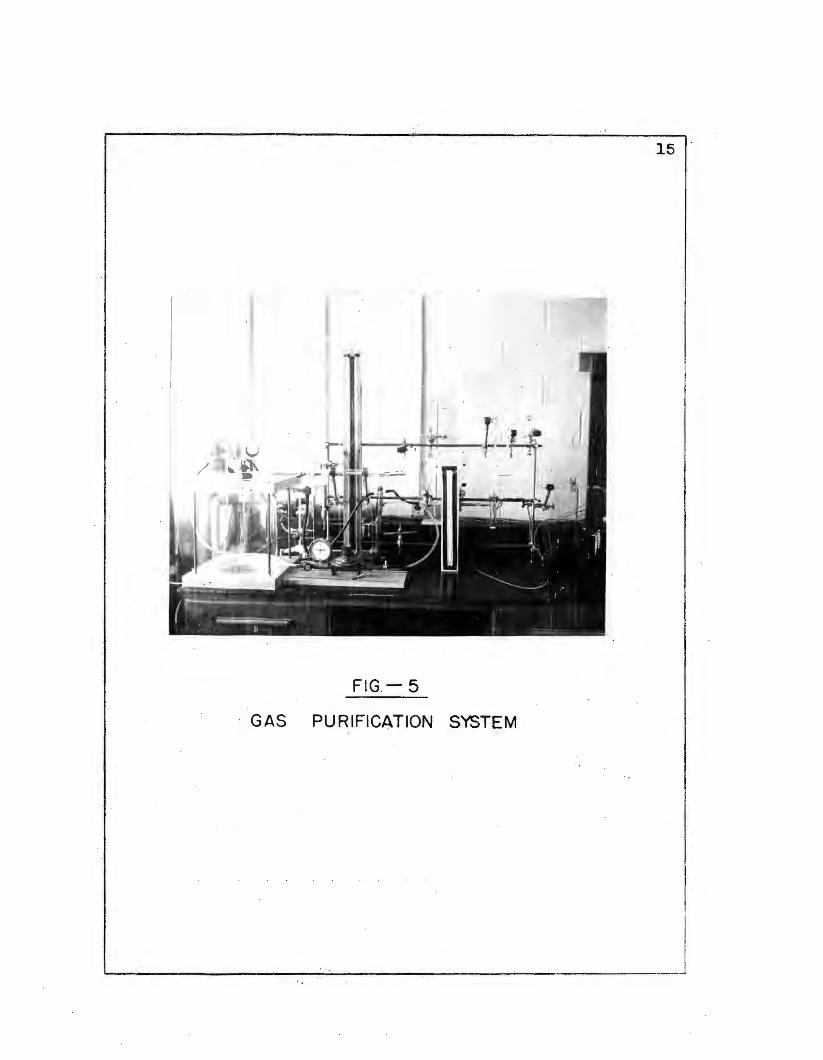
The gas purification systemo The gas purification
system is illustrated schematically in Figure 4, ~d
photographically in Figure 5o The system was composed
entirely of 9 mmo .Pyrex glass tubing with the exception
or the high ·pressure ru~ber tubing between the argon tank
and the pancake regulator, and the tygon tubing_ connecting
the purification furnace to the pressure relief bubbler
and the pancake regulator<>
The gas purification system consisted of two separ
ate gas train9 which were connected by a three-way stop-

I l
I i . I I
13
FIG.-3
THE APPARATUS
i ..,._ _____________________ . __ .J

• \:RGON F~OM TANI<
PURIFICATION FURNACE
BUBBLER
ATMOSPHERE
~ r i
VACUUM
i....__ ____ _
RESERVOIR BOTTLE
FIG-4
------- ·- -----·----~
MANOMETER
AUXILIARY SYSTEM
NEEDLE VALVE
FLOW METER
SCHEMATIC DIAGRAM OF GAS PURIFICATION SYSTEM
): .GAS , FLOW
BUBBLER
··-··---------·---------------'------------------------~
14
15 .
FIG.- 5
· GAS PURIFICATION SYSTEM

16
cock. One of the gas trains was not used in this investi-·
gation, and in Figure 4 has been labeled auxiliary gas
system. The auxiliary gas system was isolated from the
remainder of the system by a 2-way s·topcock.
Linde, standard-grade argon was used. The gas was ·
supplied in tank form at 2000 psi. - gage. The tank -pressure
was reduced to 10 psi. gage by a single-stage tank regulator
valve. · The tank regulator was connected to a Matheson,
pancake-type regulator which reduced the pressure to 2 psi.
gage.
Af'ter leaving the pancake regulator, the argon
passed through a gas purification .furnace. The gas purifi
cation furnace consisted of a tube furnace containing a
reaction tube and boats of titanium powder. The titanium
powder was heated to 5oo0 c to remove any traces 0£ oxygen
in the argon. The temperature of the purification furnace
was controlled by adjusting the power input to the.furnace.
A variable resistor was placed in series with the 110 volt
A. c. power supply to allow adjustment or the power input
to the furnace. A chromel-a1umel thermocouple was placed
next to the furnace windings to give instantaneous tempera
ture reading on a direct reading pyrometer.
From the purirication· furnace the deoxidized argon
entered a 20 1iter,pyrex glass bottle which served as a

reservoir. A rubber stopper was used to make connection
between the bottle and the glass tubing. The rubber
stopper was sealed to' the bottle by High-Pyseal sealing
wax. A mercury manometer was connected to the bottle to
measure the pressure. The large capacity of' the bottle
served to provide a constant gas flow through the flow
meter.
17
A mercury bubbler was placed in the gas line between
the purification furnace and the reservoir bottle. The
mercury bubbler was constructed in such a manner that the
mercury level could be adjusted by lowering or raising a
level bottle outside the bubbler. The purpose of the
mercury bubbler was to act as a safety valve in the event
of the possible failure of the pancake regulator. The
mercury level was adjusted to correspond to a gas pressure
slight1y greater than 2 psi. gage.
From the reservoir bottle the argon gas passed into
a drying chamber containing boats of P205. The boats of
P205 were ch~ged several times during the course of the
investigation, indicating that the argon did contain a
small a.mount of water vapor.
Two valves were placed in the gas line to isolate
the purification furnace and the reservoir bottle fran the
remainder of the system. By closing these two valves the

18
argon tank or the boats of P2o5 could be changed without
the necessity of releasing the pressure from the furnace
and the reservoir .bottle. These two valves were placed
9!ter the pancake regulator and be:fore the drying chamber
respectively. The system was found to be pressure tight ·
as there was no reduction in pressure after the.furnace and
reservoir bottle had been isolated for several days.
'The flow rate of argon was controlled by a Manostat,
teflon needle valve with a special glass to valve ass.embly.
The valve was designed for control of liquid flow, but was
found to give excellent control of gas flow. The needle
valve gave accurate adjustment of the flow rate between
5 and 320 c. c./minute.
The flow rate was measured by a carefully calibrated
manometer-type flow meter. Dibutyl phthalate was used a.s
the manometer fluid because of its low vapor pressure at
room temperature.
Two 3-way stopcocks were placed in the gas line
between the flow meter and the equilibrium apparatus: the
first stopcock connected the dibutyl phthalate bubbler to
the gas line, and the second connected the argon gas.system
and the auxiliary gas system to the equilibrium apparatus.
The gas flow could be·diverted from the equilibrium
apparatus to the bubbler; providing a means or starting

19
the gas flow prior to use in the equilibrium apparatus~
This was particularly useful when the equilibrium apparatus
had been evacuated. a.rid was being filled with the purified
argon: the rate of bubbling ~as a measure or the pressure
in the gas line when argon was being admitted to the
evacuated equilibrium apparatus by .opening the ~econd 3-way
stopcock. The second 3-way stopcock was never opened.far
enough 'to stop the bubbling and allow the dibutyl phthalate
to be drawn into the gas line.
A vacuum line was attached to the gas line between
the second 3-way stopcock and the ball joint, . which connect
ed the equilibrium apparatus to the gas purification system.
The vacuum line was opened and closed to the gas line by
means of · a 2-way stopcock which was placed in the vacuum
line a few inches from where it entered the gas line •.
Vacuum was provided by a National Research Corpora
tion, rotary gas ballast pump; a vacuum of 1 m. m. ~of Hg
could be attained after a 5 minute pumping period. The
pressure . in the vacuum line was measured by a mercury
manometer which was placed in the vacuum 1ine. A 3-way
stopcock was placed in the vacuum 1ine to connect th~
vacuum line to the vacuum pump or atmosphere.
The equilibrium apparatus. The equilibrium appara
tus is depict~d schematically in Figure 6 and photographi-

BUBBLER
PURIFIED • ARGON
FIG.~ 6
l \GAS
\ FLOW
TO GAS ANALYSIS
I i i
SCHEMATIC DIAGRIAM OF EQUILIBRIUM APPARATUS
I ' ---·-··- ·-··---·--------- - ··- -- ------ ·---·- ·-··-------- ··----·-··- - ·· - - ···- --- .•.. . ... . -···· ·-···· - - ....... . . ··- - ···---- - ---····· --·. __ ____ .)
20

FIG.-7
EQUILIBRIUM AP~RATUS
,, --·- ----~-21
~-------------------- ·-----····-- ····· ... . ..... ·-

22
cally in Figure 7.
The equilibrium apparatus was a recirculating-type
apparatus in which. the gas mixture was recirculated over
t~e charge of PbO and FbS. The circulation path consisted
. of the f'urnace, circulating pump, and sample bottle.
The reaction tube and sample bottle were.constructed
of' vycor and pyrex glass. The remainder of the system was
composed of' tygon tubing.
The reaction tube and furnace assembly are illustrat
ed schematically _in Figure e. The reaction tube was con
structed from 19 mm. vycor glass tubing, and connections
were made on both ends of the furnace by means of a series
of ground glass joints: both spherical and conical Joints
being used. The vycor gless thermocouple protection tube
was sealed to the reaction tube with High-Pyseal sealing
wax. A spacer, constructed from vycor tubing, was pJa.ced
between.the boat and the end of the reaction tube to
decrease the possibility of thermal segregation of the gases
in the reaction zone.
The furnace was a hinged-type tube furnace, contain
ing two separate heating coi1s. Being hinged, the fwnace
could be opened to permit rapid cooling of the tube and
sample. Asbestos paper gaskets, constructed .from l}"
e.·sbestos paper tape, were placed around the reaction tube

23
THERMOCOUPLE
ARGON+ S02
-1 ~ 1 FURNACE POWER
FIG~ 8
REACTION TUBE 8 FURNACE ASSEMBLY FOR
EQUILIBRIUM APPARATUS
1------,----------------------- ·-- ----------------·-·------·----'---'

24
on each end of the furnace to minimize convection currents
ap.d increase thermal stability between the furnace and tube.
The regu1ation'of the power supply to the furnace
h~ating elements is illustrated schematically in Figure 9.
Power to the furnace was controlled by means ot a Powerstat,
71 ampere, variable transformer. The transformer was
connected in series with a Wheelco, Model 402-8296, t1me
proport.ioning controller. The controller was actuated by
a chromel-alumel thermocouple which extended into the
reaction tube to the end of the boat.
A Leeds and Northrup precision potentiometer, Model
No. 8662, was connected.in parallel with the therm.ocouple
controller circuit to measure the temperature variance of
the furnace. Temperature control was found to ·be within
A Sigma.motor pump was used to circulate the gas
mixture.through the apparatus. Both rubber and tygon tub
ing were used in the pump; tygon tubing was found to be
far superior. to rubber tubing, and was used in the ma.jori ty
or the runs. The tygon·tubing was replaced after approxi
mately 100 hours ot use. The circµlation rate could_be
adjusted by changing the speed of the torque converter
between the driving motor and the pump. Darken and Gurry7
found that a linear velocity greater than .6 cm./ sec. was

IIOV AC
IIOV AC
r1L . WHEELCO
CONTROLLER
POTENTIOMETER
CHROMEL-ALUMEL .__----~----------- THERMOCOU~ .
v
--------t A ...____... __ -,--___ _
FURNACE HEATING
ELEMENTS
POWERS TAT
FIG- 9.
FURNACE ELECTRICAL. POWER CONTROL
L ____ ·--------:----------,-------'
.25

26
sufficient to prevent thermal segregation in CO, co2 mixtures.. Since A and S02 have approximately the same
ratio of' molecular weights as CO and co2 , a circulation
velocity greater than •. 6 cm./ sec. should prevent thermal
segregation in the reaction zone. The circulation velocity
used in this investigation was 1.15 cm./ sec •• A circula
tion velocity greater then this was avoided because of the
appreciable transport of' PbS, as PbS vapor, f'rom the
charge.
A 274.5 c. c., pyrex sample bottle was used to obtain
a gas sample of' known volume, temperature, and pressure.
The bottle was fitted with 3-way stopcocks on both ends.
The temperature of' the gas was measured by a thermometer,
which was placed next to the bottle. The pressure in the
bottle was adjusted to barometric pressure, ±2 or 3 cm of
dibutyl phthalate, by means of a bubbler which was placed
in the line between the furnace and the pump.
The equilibrium apparatus was isolated from the gas
purification system by a pinch clamp, which is represented
as a 2-way stopcock in Figure 6, end by the 3-way stopcock
on the left side of the sample bottle. or these two valves,
the .former was used to admit purified argon to the system
at the beginning o.f a run, the latter to flush the gas
sample into the analysis apparatus at the end of the run.

27
II. EXPERIMENTAL PROCEDURES
A description of the experimental procedure follows.
An ·appropriate PbO-PbS mixture was placed in a 10 mm. x
60 mm. Coors porcelain combustion boat, and the boat placed
in the reaction tube. The si:;ecer was inserted and the cap
replaced on the end of the reaction tube. The valve, a
·pinch ~lamp, to the bubbler was closed, the valves on both
ends of the sample bottle were opened to the circulation
path, and then the valve to the gas purification system
opened. The valve between the furnace and the sample
bottle was onl.y closed.during cooling of the furnace.
The vacuum pump was started and the equilibrium
apparatus was evacuated. Arter five minutes,' the pumping
was discontinued and the equilibrium apparatus was filled
with purified argon. As soon as the pressure of argon
in the apparatus reached barometric pressure, the valve
to the bubbler was opened and the argon was allowed to
pass through the sample bottle, over the charge, and out
through the'bubbler. The controller and :furnace power
were turned on and the temperature allowed to reach 300°C.
The system was then flushed for 10 minutes at 300°c·1n
order to remove any moisture and adsorbed oxygen.
After flushing wa~ .complete, the gas flow was dis
eontinued. the valve connecting the equilibrium apparatus

28
and the gas purification system was closed, and the desired
operating temperature reset on the controller.
After the .furnace had reached the desired tempera
ture, the circulation pump was turned on and allowed to
circulate. After one hour of circulation, the valve to th€
bubbler was closed and pumping continued for another 12 to
24 hours • .An equilibration period of 24 hours was allowed
at 7oo0 c, and a period of 12 hours at temperatures ·above
7oo 0 c. At the end of the equilibration period, the pump was
stopped and the system opened to the bubbler • . The 3-way
valve on the left side of the sample bottle was first
turned to a neutral position, the other 3-way valve on the
right side to the sample bottle was turned to connect the
sample bottle to the gas analysis apparatus, and finally
the 3-way valve on the lert side of the sample bottle was
turned to connect the argon line to the sample bottle. The
purified argon gas flushed the argon-so2 mixture out of the
sample bottle into the gas analysis apparatus.
As soon as rlushing had commenced, the valve to the
bubbler was closed, the valve between the furnace an~ gas
sample bottle was closed, the controller and furnace power
were turned orr, the furnace-opened, and the charge quickly
cooled.

29
Analysis of the exit gas consisted o:f passing the
argon, S02 mixture through a glass frit which was immersed
in an aqueous solution of H2o2 and NaOH. The so2
was con
sumed according to the following reactions.
S02 -+ H2o2 ~H2so4
H2so4 + 2NaOH ~2H2o + Na2so4 The solution was stirred with a magnetic stirrer to provide
good contact of the gas bubbles with the solution. The gas
.analysis apparatus is illustrated photographically in
Figure 10.
A given quantity of standardized NaOH was added
prior to the flushing operation, and after 40 minutes o:f
flushing the excess was back-titrated with H2so4 •
The end point when the solution changed from basic
to acid was detected by use of a modified methyl-red indi
cator*. The color change at the end point was green in
alkaline to violet-red in acid. The str.ength of the NaOH
and H2so4 solutions ~as adjusted to give the largest
possible value for the net c. c. of NaOH used in the
titration, and at the same time a sharp color change at the
end point.
*For instructions ~or preparation of mod~ied methylr~d· indicator see Appendix I.

30 I
FIG. -10
GAS ANALYSIS APPARATUS

31
The NaOH solutions were standardized no earlier than·
24 hours after preparation, and were kept in a dark enclo
sure. The NaOH solutions were standardized with Fisher's
reagent-grade potassium hydrogen phthalate. Blank samples
o:f NaOH were titrated with H2so4 in order to determine the ·
NaOH equivalence or the H2so4 •
During the course or the investigation, 1 t was :found
that a rather appreciable amount of" so2 was collected inside
o:f the glass frit,·giving correspondingly low results f'or
Ps02• This problem was eliminated by flushing the inside
of the :frit with. the basic solution prior to the titration
with H2so4•
The P802 was calculated by knowing (1) the total
moles of gas mixture in the sample bottle, (2) the moles of'
so2 from the titration, and (3) the total pressure of the
system.
The P802 was measured for various PbO-PbS mixtures,
ranging from 20Pb0/1PbS to 1Pb0/20PbS, at 7oo0 c, 720°c,
74o 0 c and 76o0 c. The reacted mater1als were ground to -200 mesh, and
then analyzed by X-ray diffraction using a Norelco, ~-ray
dirfraction unit with goniometer and strip-chart recorder
attachment. The peak counting rate was 80 counts/second,
and the time constant was 4 seconds. The phases were

32
identified using the A. s. T. M. card file index.

CHAPTER V
EXPERIMENTAL RESULTS
The experimental results of this investigation con
sist of the measured equilibrium values of P802 above
PbO-PbS mixtures at several tempera-tures, and id~ntification
o_t the phases in the reacted materials by interpretation o:f
the X-ray di.ffra.ction data.
The mea.sured. values of -log P~oe obtained for the ..... iC
system PbO-PbS between 7oo0 c and 76o0 c are listed in
tabular form in Table I and are .presented graphically in
Figure 11. A sample caiculation of -log P802 fran experi
mental data is included in Appendix II.
The results of identification of the phases in the
reacted materials are also included in tabular form in
Table I. The X-ray diffraction data that were used to
identify the various phases are not included in thi~s thesis,
but rather a tabulation of the 29 engles used in interpret
ing the data is included in Table II.
Identification of the phases in the PbO-PbS system
from the X-ray dirfraction data was complicated.by tbe fact
that an observed 28 value could often be assigned to two
dirferent phases. Lead oxide and the basic lead sulfates
had several sets of 2Q values that were so close together

Rtm #
1
TABLE I
EQUILIBRIUM Pso2 VALUES FOR THE SYSTElv! Pl:?0-PbS
BETWEEN 7000-760°c TOGETHER WITH THE P~SES IDENTIFIED IN. THE REACTED CHARGES
Temp. oc Atomic foS -Log Pso2 Phases
700° 3.58 3.008 Pb, PbS04·4PbO,
4.54 3.041 Pb, PbS04.4PbO,
s.oo 2.933 Pb, PbS04.4PbO
5.56 2.594 Pb, PbSQ4.4PbO
6.25 2.235 Pb, PbS04.4PbO
8.33 2.047 Pb, PbSQ4.4PbO,
10.00 2.070 Pb, PbS04•4PbO,
16.67 2.063 Pb, PbS04•4PbO,
25.00 . 2.078 Pb, PbS04•4PbO,
42.86 2.oe1 Pb, PbS04•4PbO,
34
PbO
PbO
PbS
PbS
PbS
PbS
PbS

35
TABLE I (continued)
Run# Temp. 0 c Atomic foS -Log Pso2 Phases
2 .720° 2.38 2.953 Pb, PbS04•4FbO, PbO
4.54 2.906 Pb, PbS04.4PbO, PbO
5.oo 2.924 Pb; PbS04.4PbO, PbO
5.56 2.565 Pb, : PbS04. 4Pb0
7.14 · 1.910 Pb, PbS04.4PbO
10.00 1.809 Pb, Pb SO 4 • 4Pb0, PbS
16.67 1.819 Pb, PbS04·4PbO, PbS
25.00 1,819 Pb, PbS04•4PbO, PbS
33.33 1.827 Pb, PbS04•4PbO, PbS
· 40.00 1.826 Pb, PbS0404PbO, PbS
44.44 ·1.845 Pb, PbS04·4PbO, PbS
3 740° 2.38 2.780 Pb, PbS04·4PbO, PbO
4.5·4 2.604 Pb, PbS04·4PbO
5~00 2.334 Pb, : PbS04. 4Pb0

36
TABLE . I (continued)
Run# Temp. Oc Atomic foS -Log Pso2 · ·Phases
5.56 2.009 Pb, PbS04.4PbO
6.25 1.777 Pb, PbS04·4PbO
7.14 1.689 Pb~ PbSQ4.4PbO, PbS04.2PbO
8.33 1.€43 ·pb, PbS, Pl;>S04·2Pb0
10.00 1.646 Pb, PbS, PbS04·2PbO
16.67 1.636. Pb, PbS, FbS04.2PbO
25.00 1.642' Pb, PbS, PbS04.2PbO
42.86 1.656 Pb, PbS, PbSQ4.2PbO
4 7600 3.58 2.409 . Pb, PbS04•4PbO, PbO
4.54 2.414 Pb, PWQ4.4Pb0, PbO
5.00 .2.426 Pb, PbS04• 4_Pb0
5.56 2.099 Pb, PbS04.4~bO
6.25 1.787 Pb, PbSQ4.4PbO
7.14 1.592 Pb, PbSQ4.4PbO, PbS04.2PbO

37 TABLE I (continued)
'Run# Temp. oc . Atomic foS -Log Pso2 Phases
7.94 1.593 Pb, PbS04•4PbO, PbS04.2PbO
8,33 1.542 Pb, PbS04•2PbO
10.00 1.416 Pb; PbS04.2PbO
16.67 1.379 Pb, PbS, PbS04•2PbO
25.00 1.379 Pb, PbS, PbS04•2PbO

j
1.4 f . . I. 6
N 0 fl)
a.
(!) '
0 _J
I
1.8
2.0
2.2
2.4
2.s ·
2.8
3.0
3.2
PbO 2
EQUILIBRIUM
v- 760! c El- 740• c A- 120• c 0- 100• c
4 6 8 IO 12 14 16 18 20 22 24 26
MOLE % S . • .
FIG.- II
Pso2 VALUES FOR THE SYSTEM PbO- PbS
100·- 1so•c
42 44 46 48 PbS
BETWEEN
L.~-~~~~~~~~~~~~~~~~~~~~~--~~~~.~~~~---~a--___.
38

2Q Angle
10.8
11.2
15.0
19.9
21.45
23.4
26.0
27.4 -
28.6 -
29.l -
29.8
30.1
TABLE II
THE 2Q VALUES USED IN INTERPRETING THE X-RAY DIFFRACTION DATA
Phases
PbS04 • 4Pb0 ·
PbS04·2PbO
PbO, PbS04.2PbO
PbS04. 2Pb0
PbS04.2PbO
PbSQ4.2PbO
PbS
27.6 PbSQ4.2PbO, PbSQ4.4PbO
213. 7 PbS04.2PbO, PbS04•4PbO
29.2 PbO, FbS04·4PbO
PbS04·2PbO
PbS
30.2 - 30.3 PbS04·2PbO, PbO
30.85 PbS04•2PbO
31.0 PbS04.4PbO
31.3 Pb
33.6 PbS04 .4PbO
35.8 PbO
36.3 Pb
39
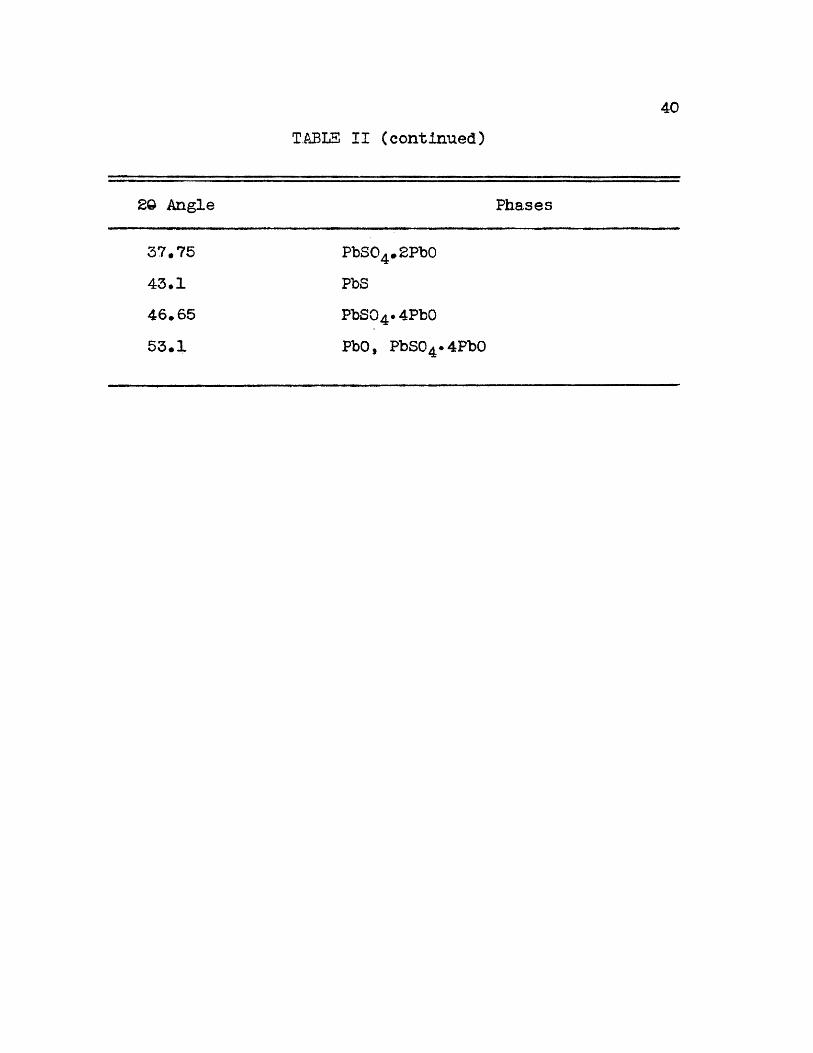
2Q Angle
37.75
43.1
46.65
53.l
T.ABLE II (continued)
PbS04.2PbO
PbS
PbS04·4PbO
PbO, Pbso4.4Pb0
40
Phases

41
that a set of 2Q values appeared as a single dllfraction
peak rather than two adjacent peaks. Identification of PbO
was particularly di.fficult as there were only two .major
peaks, and the 2Q value f'or 100%' peak intensity coincided
with one of the major peaks of Pbso4.4Pb0, which was found ·
to occur with PbO. Fortunately, the only inter.f~rence with
the second major peak o.f PbO was Pbso4 .2PbO, which was never
found to exist in equilibrium with PbO. The values · of dhkl
for the phases Pb, PbS, PbO, PbS04.2PbO, PbS04.4PbO agreed
very well with the values published in the A. s. T. M. card
file index.
The isotherms dep1cted in Figure 11 represent the
variation in equilibrium Pso2 :for the· system FbO-Pbs.
Temperatures less than 7oo0 c were not attempted because the
small va.lues of' P802 were beyond the range of the method of
gas analysis used in this investigation. Several experi
ments were conducted at 78o 0 c, but the entire charge was
molten at this temperature and reaction between the charge
and the porcelain boat was observed. Because of contamina
tion of the reacting materials, measu.rements above 76o 0 c
were discontinued.
Figure 11 shows that the isotherms at 7oo0 c and 720°c have the same general shape • . Both contain horizontals in
the same composition ranges and a diagonal line connecting

42
the two horizontals. The isotherms at 74ooc and 76QOc
have the same general shape, but differ from the isotherms
at 7oooc· and 72ooc _in'that the former have three horizon
tals and two diagonal lines.
The X-ray diffraction results (see Table I) indicate
that for the 7oo0 c and 720°c isotherms the horizpntal. at
the PbO end of the diagram represents the three-phase.
regi·on Pb, PbO, Pbso4.4Pb0, and that the horizontal' at the
PbS end of the diagram represents the three-phase region
Pb, PbS, Pbso4.4Pb0. The X-ray results likewise indicate
that the diagonal line connecting two horizontals of the
same isotherm represents the two-phase region Pb, PbS04.4PbO.
The isotherms at 740°C and 760°C show that there are
three, three-phase regions, and two, two-phase regions.
The X-ray results reveal that the horizontal on the Pb_O
side of the diagram represents the three-phase region Pb,
PbO, PbSo4.4PbO, and that the horizontal on the PbS-side o~
the diagram represents the three-phase region Pb, PbS,
PbS04.2PbO. The horizontal between the above mentioned
horizontals represents the three-phase region Pb, PbS04•4PbO
Pbso4.2Pb0. Two diagonal lines connect the three ho~izon
tals at each isotherm. The diagonal between the three
phase regions Pb, PbO, PbS04•-4PbO, and Pb, PbS04·4PbO,
PbS04.2PbO represents the two-phase region Pb, PbS04·4PbO.

43
The diagonal between the three-phase regions Pb, PbS04 ·4PbO,
PbS04·2PbO and Pb, PbS, PbS04·2PbO represents the two-phase
region Pb, PbS04 ·2PbO~
On the basis of the ob-served variations in condensed
phases with temperature and composition, a phase diagram
:for the system PbO-PbS has been proposed and is illustrated
in Figure 12.
The composition values f'or the boundary lines were
obtained by using the intersection of the extrapolated
horizontal and diagonal lines.
A diagonal line between two horizontals on the same
isotherm indicates solubility of sul.fur and oxygen in
liquid lead, and solid solubility of ·sulfur, lead and
oxygen in basic lead sulrate. Since the solubility curve
of oxygen and sulfur in liquid lead, and the solubility
curves of oxygen, sulfur, and lead in basic sulfates are
not known, it is impossible to indicate the composition
of the liquid or the basic sulfates. In addition to the
solubility curves, tie lines between the solubility curves
would have to be determined experimentally in order to
show the composition or the liquid lead and solid baste
sulrates phases for any point in these two-phase regions.
Because both the liquid lead and basic sulfates are
of undetermined composttion, the words liquid lead have

44
LIQUID
760 LIQUID LEAD LIQUID LEAD
PbS04 4Pb0 Pb 804 • 2Pb0 Q O PbS
PbO ~f 740 .J •
0 . 0 - g otct 1aa•c u 5 !8
:; A. • LIQUID 1.~AD - 720 0
PbS04 · 4Pb0
a.: PbS
~ w 700 I-
1 PbO 2 4 6 8 10 12 14 46 48 PbS
MOLE % s ....
Fl G. - 12
PROPOSED . PHASE DIAGRAM FOR THE SYSTEM PbO- PbS BETWEEN
700° - 760°C - ·····-------·- -- ---

been substituted for the symbol Pb, and the formulas
PbS04·2PbO and PbS04 •4PbO are used to convey the fact
that one of the condensed phases has a: particular basic
sulfate crystal structure where the composition is not
necessarily that indicated by the stoichiometric formula
of the basic sul:fate.
45
The phase diagram for the system PbO-PbS was also
constructed :from the Pb-0-S composition diagrams presented
by Kellogg and Basu, and is illustrated in Figure 13.
Comparing the two phase diagrams shows that the
boundary lines in Figure 13 become areas, where either or
both of the phases have ·a variable composition, 1n Figure
· 12.
Thermodynamic calculations based on the experimental
data will be presented in the next chapter.

I .
! I i I I I
:! I
-<..) 0 -a.. ~
,------- ·---r---1 •b I .. j
PoO 760 i..... l•
0 0 I PbS04 • 4Pb0
f i i.
I N •
. 740 r I o-. j co f lf f I
!
! !
720
Pb
Pb
PbS04 • 2P~O
PbS
PbS04 · 4Pb0
PbS
46
w 700 .r t- I . I
i l ____ L ___ J _ __ J __ ~~L ~-- -· '~-'--L-~~~~~~~~~~~~~~~
PbO 2 4 6 8 10 12 14 . 46 .48 .. PbS MOLE . 4Y• S
. .,..,.
FIG.~ 13
PHASE DIAGRAM, AFTER KELLOGG 8 BASU, FOR THE
PbO- P'oS BETWEEN •100·-1so·c SYSTEM
i ... ... _ . . ... . ......... - ...... --·-··-------------~----------------------~-.J

CHAPTER VI
THERMODYNAMIC CALCULATIONS
The thermodynamic calculations· have been divided in
three parts. The first part is concerned with the the.rmo- ·
dynamic calculations based on the experimental r~sults.
The second part is concerned with the same type of calcu
lations~ but based upon the experimental results of . previous
~nves·t1gators. The third part is concerned with the
graphical representation of the thermodynamic calcu1ations.
Calculations from. Experimental Results. The
equilibrium values of P802 and the re.sults or .the corres
ponding X-ray analysis of the condensed phases, which have
been tabulated in the previous chapter,can be arranged in
a more convenient form ror purposes of calculation. Table
III lists the equilibrium values of -log Pso2 and t~e
equilibria, based upon the results of the X-ray analysis
of the condensed phases, representing these data.
If the· assumption. can be made that the activity of
each condensed phase was unity, then the standard free
energy change (.6.F0 ), hereafter referred to as the free
energy change, of each reaction can be expressed as
fo;t.lows:

.(6-1) Pb+ PbS04 •4Pb0~6PbO + 802
~F0 = -4.576Tlog P802
( 6-2) 3PbS- +. PbSO 4 • 4Pb0 ~ 8Pb ·+ . 4S02
'6.F0 = -4.576(4)Tlog Pso2 (6-3) Pb+ 3(PbS04•2PbO) ,. 2(PbS04•4PbO) + S02
.6.F0 : -4.576Tlog P802
(6-4) 2PbS+ . PbS04 .2PbO 4 • 5Pb + 3S_Q2
~Fo = -4.576T(3)log P_~o2
48
Since the P802
is a direct measure of the free energy
change of' each rea_ction, the free energy · change of reactions
(6-1) through (6-4) can be calculated .from the · experimental
values o:r P802•
The assumption that the activity of each condensed
phase was·unity· was assumed to be valid .for the following
reasons:
l. According to Hansen9 the solubility of su1fur ·
in liquid lead is 3.5 atomic foS at 75o0 c, and the solubil
ity of oxygen in liquid lead is .10 atomic ~oat 75o0 c. This indicates that at 750°C: the activity of Pb is approxi-
mately .96.
2. Lead oxide and lead sulfide have no reported
s:, lid-solubility.
3. The solid-solubility of Pb, O, and.sin the basic
· suirates was rather limited as.: indicated by the fact that

Reaction
6-1
6w2
6-3
6-4
TABLE III
EQUILIBRIA INVESTIGATED TOGETHER WITH THE EQUILIBRIUM VALUES OF Pso2
Equilibrium
Pb+ PbSO 4 • 4Pb0 ~ 6Pb0 + S02.
3PbS + PbSO 4 • 4Pb0 ~ 8Pb -t 4S02
Pb+ 3(PbS04 ·2PbO) ~ 2(PbS04•4PbO)+ S02
2PbS + PbS04•2PbO ~ 5Pb + 3802
_49
Temp 0c -Log Pso2
100° 3.025
720° 2.950
740° 2.779
760°. 2.410
700° ·2.070
720° 1.826
740° · 1.690
7500 1.592
740° .t.640
760° 1.379

the dhk1 values ~or the basic sulfates remained constant
within the error of experimental measurement.
The AF0 r of PbS04.4PbO and PbrS04.2PbO can be
calculated by combining the 6F0 r date for PbO, PbS 1 and
50
_so2 , which is available in the literature, with calculated·
values or l).F0 :f'or the reactions (6-1) through (6-4)-. The
~F0 r equations for PbO, PbS, and so2 are tabulated in
Table :rv. Two values o:f .6F0r of Pbso4 .4Pb0 can be calculated
at each experimental temperature. Us1ng reaction (6-1)
.6F0 f o:f Pbso4.4Pb0 can be calculated at 7oooc, 720°c,
740°c and 760°c. The .6F0 :r of Pbso4 .4PbO at 7oo0 c and 720°c
can be calculated from reaction (6-2)~ and the ~F0 :r of
Pbso4.4Pb0 at 74o0 c and 76o 0 c :Crom the combination of
reactions (6-3) and (6-4).
Th9 .6 F0 f of PbSO 4• 2Pb0 can be calculated at 7 40 °c
and 760°c from reaction (6-4).
The calculations of .6F0 f of PbS04.4PbO and
FbS04•2PbO fol1ow.
A. t::.F0 r of Pbso4.4PbO at 7oo 0 c, 720°c, 74o0 c,
and 76ooc from reaction (6-1).
Pb + PbS04 • 4Pb0 "4 ,. 6Pb0 + S02
4.576T(-Log Pso2> : [6(.6F0 :r PbO)-t- (.6.F0 r S02)J
- [(.6F0 ;r PbS04•4PbO)]

TABLE IV
EQUATIONS FOR THE FREE ENERGY OF FORMATION
OF Pbo(lO), PbS(ll), and S02(lO) AS
A FUNCTION OF TEMPERATURE
~Fof PbO ~ -54,950 - 8.05TlogT+ 50.lT (6000-1150°K)
~For PbS: -38,640+ 20.65T (8580-1200°K)
~F0 r so2 : -86,620 + 17.31T (298°~2000°K)
51

52
· 4.576T(-Log Pso2) "= [6(-54,950-8.05Tlog'Pt- 50.lT) ·
+ (-86, 62.0 + l 7.31T)]
- [AF0 r PbS04·4PbO]
~Fof PbS04 .4PbO - -4.576T(-log Pso2 ) -416,320
-48. 30TlogT + 317. 91T
T : 973°K, -Log Pso2 ~ 3.025, AF0 r PbS04·.4Pb0 :
-260,890 cal.
T : 993°K, -Log Pso2 = 2.950, AF0r PbS04·4PbO -
-257,779 cal.
T 0
-Log Pso2 2.779, • 1013 K, = -254,217 cal..
T : 1033°K, -Log Pso2 - 2.410, --249,696
B. · L:::..F0 r of PbS04•4PbO at 7oo 0 c and 720°c fran
reaction (6-2)
3PbS + PbSO 4 • 4Pb0 ~ 8Pb + 4802
4.576T(4)(-Log P802 ) : [4(.6.F0r so2)] - ·
[3(AF0r PbS)
+(AFof Pbso4 .4Pb0)]
4.576(4)T(-L6g Pso2) = [4(-86, 620 + 17.31T)]
{:_3(-38, 640 + ff).$5T) +
AF0 r PbS04·4PbO]
·~For PbS04·4PbO ~ -4(4.576)T(-Log Pso2) -
230, 560 + 7.29T
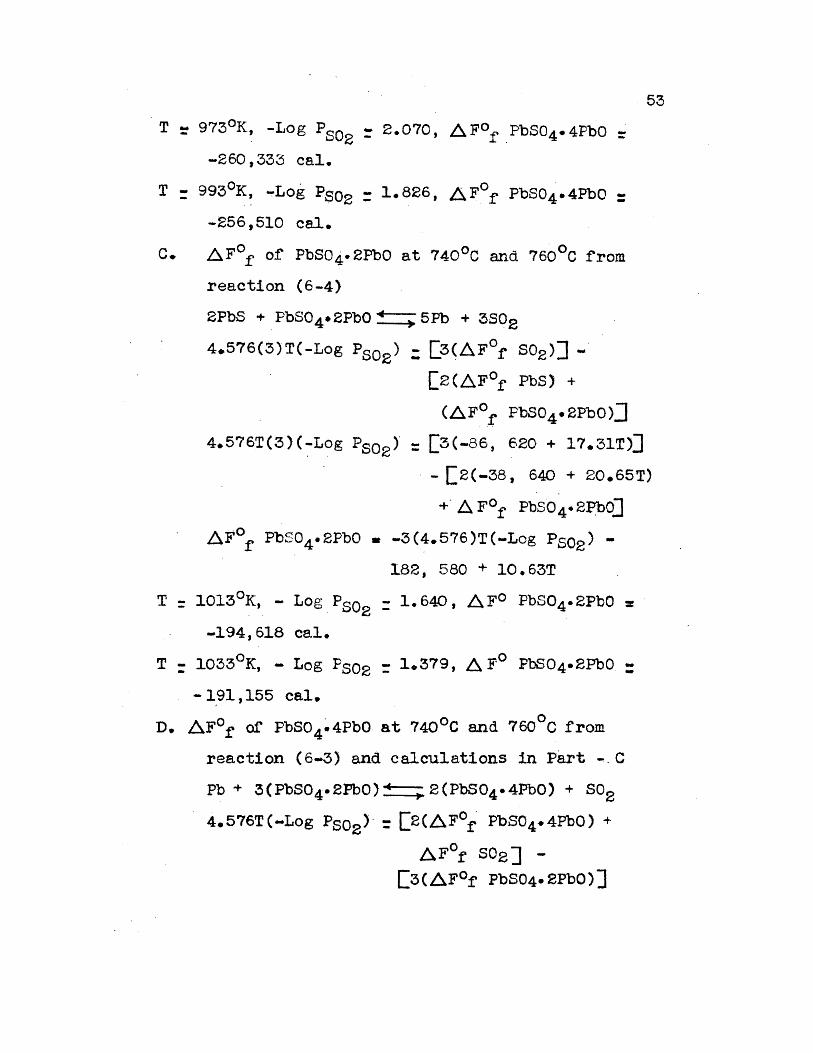
T ~ 973°K, -Log Pso = 2.070, .6F0~ PbS04·4PbO: . 2 .l.
-260 ,333 cal.
0 , 0 T - 993 K~ ~Log Pso2 = 1.826, b.F .f PbS04·4PbO:
-256,510 cal.
c. .6F0r of Pbso4.2Pbo at 74o0 c and 7so0 c .from
reaction (6-4)
2PbS + . PbSO 4 • 2Pb0 ~ 5 Pb + 3S02
4.576(3)T(-Log Pso2) = [3(.L\F0r S02)J - ·
[2(.L\F0 .r PbS) +
(~For PbS04·2PbO)]
4.576T{3)(~Log Pso2l : [3(-86, 620 + l 7.31T)]
53
· - [2(-38, 640 + 20.65T)
+· A F 0r PbS04·2~0]
b.F0 f PbS04 .2PbO • -3(4.576)T(-Log Pso2 )
182, 580 + 10.63T
T : 1013°K, - LogPso2 - 1. 640, 6F0 Pbso4.2Pb0:
-194,618 cal.
T - 1033°K, - Log Pso2 = 1.379, .6F0
PbS04·2PbO -- 1_91, 155 cal.
D. ~For of PbS04~4PbO at 740°C and 760°C from
reaction (6-3) and calculations in Part .. _ C
Pb + 3(PbS04·2Fb0) +----;' 2(PbS04•4PbO) + S02
4.576T(-Log Pso2) · : [2(.6F0:r PbS04·4PbO) +
AF0r S02J -[3(;6.F0 .r PbS04.2PbO)]
--

4.576T(-Log Pso2' - [(-86, 620 + 17.31T)+
2AF0r PbS04_•4PbO] 0 . .
-- [3(.AF_f PbS04•2PbO)]
2AF0 PbS04.4PbO • 4.576T(-Log Pso2>+ 86,620
-l7.31T+ 3AF0 r PbS04·2PbO
T = 1013°K; AF0 :r PbS04 •2PbO ·:: -19.4, 618. cal.;·
-Log P~o2 ~ 1.690
.AF0r Pbso4 .4Pb0: -253,468 cal.
T : l033°K; -~F0 r PbS04.2PbO ~ -191,155 cal.;
-Log ~so2 : 1.592
AF0:r PbS04 .~PbO = -248,600 cal.
54
The results of the above calculations are summarized
·1n Table v.
Calculations from Results o.f Previous Investigations.
Since the experimental data of Reinders, and Schenck and co
workers have been shown to be in error, the thermod~namic
calculations will be limited to the experimental results
of Kellogg and Basu.
Table VI lists th~ equilibria studied by Kellogg
and Basu, and the corresponding AF0 equations f~r these
equilibria. These .AF0 equations were derived from the
experimental va1ues o.f Pso2 with the assumption that the
. ac.tivity of ea.ch condensed phase was unity. Two o.f these ' .
eq~ilibria, .rea~tions (6-1 and (6-4),are the same as those

TABLE V
CALCULATED VALUES OF AF0 f OF Pbso4.4Pb0
AND PbS04·2PbO FROM TEE EXPERIMENTAL DATA
Reaction
(6'.""'l) (6-2)
(6-1) (6-2)
(6-1) (6-4), (6-3)
(6-1) ( 6-4) ,' . ( 6-3) .
Reaction
(6-4) (6-4)
0 Temp- C
70.0° 100°
720° 720°
740° 740°
760° 760°
Temp-°C
-AFor PbS04·4PbO
260,890 cal~ 260,333 cal.
257;779 cal. 256,510 cal.
254;217 cal. 253,468 cal.
249,697 cal~ 248,600 cal •.
194;618 cal~ 191,155 cal.
55

TABLE VI
EQUILIBRIA STUDIED BY KELLOGG AND BASU TOGETHER WI TH 6, F 0 EQUATIONS
(6-.1) Pb+ PbS04 .4Pb0____.6PbO + S02
~ FO = 24. 99T + 7.46 x 10⁻³T2 + 2.81 x 10⁵T-l
-22.496TLogT + 46,340
. (6-4) 2PbS + PbS04 .2PbO~ 5Pb + 3802
. ~ Fo : -20.13T + 23.86 x 10-~T2 + 4.2·3 x l05T-1
-44.924TLogT + 154, 780
(6-5) PbS + 8(PbS04.2PbO) >5(PbS04•4PbO) + 4S02
6.Fo : 83.32T + 30.58 x 10⁻³T2 + 9.14 x 10⁵T-l
-78.703TLogT +153,250
56

studied in this investigation. The other equilibrium, ·
r_eaction (6-5), was not studied in this inve~tigation.
57
Two values of ~For of Pbso4 .4Pb0 can be calculated
at each experimental temperature. The ~F0 r of Pbso4 .4Pb0
at 7o'o0 c, 72ooc, 74o0 c and 76o0 c can be calcula.ted :from . ·
reaction (6-1), and also from the c-ombination of. reactions
(6-4) and (6-5).
The ~For or Pbso4 .2PbO can be calculated at 740°c
and 760°C from reaction (6-4).
The ~For ~qua.tions :for PbO, Pbs,· and S02 were taken
from Table IV.
The calculations ·or~ F 0r of PbS04.4PbO and
·PbS04 .2PbO follow.
A.· b.F0 r of Pbso4.4PbO at 7oo0 c, 720°c~ 740°c,
and 76o 0 c from reaction (6-1)
Pb+ PbS04·4PbO > 6Pb0 + S02
24. 99T + 7. 46 x 10-3T2 + 2.81 x 10⁵T-l -
-22.496TlogT + 46,340 : [(-86,620 +17.31T)
6(-54,950 - 8.05TlogT
+ 50.1T)]
_ -[ ~F0 r PbSQ4 .. 4PbO]
b.Fof Pbso4 .4Pb0 ~ -462,660 + 292.92T -
7.46 x 10⁻³T2 - 2.81 x 10⁵
T-l - 25.80 TlogT

. T: 973°K t::,.F0 f PbS04.4PbO = -260,012 cal.
T ~ 993°K ~F0r PbS04·4PbO :: -£56,209 cal.
T ':1013°K .6.F0r PbS04 .4PbO :-25'2,417 cal.
T :1033°K .6.F0r PbS04·4PbO =-£.47,636 cal.
B. .6.F0 r or Pbso4.4PbO at 7oo0 c, 720°c·, 74o 0 c,
and 76o 0 c using Reactions ( 6-4) ·and ( 6-5)
(6-2); . 3 PbS + PbS04•4PbO , (?Pb + 4802 . ·
where C:6-2) : 1/5 [ 8(6-4) - (~-5)] .
. 58
.6 Fo : 1/5( 8 [ -20.13T + 23.86 x 10⁻³T2 +
4.23 x 10⁵T-l - 44.924TlogT + 154,780]
- [83.32T + ·30.58 x l0-3T~ + 9.14 . .
x 105·T-l - 78.703TlogT + 153~250])
.6F0 : . -48.87T + 32.06 x 10⁻³T2 + ·4.94 x; l05T-l
-56.138TlogT + 216,998 : [4(-86,620 +
17.31T)] .- [ 3(-38,640 + 20.65T) + .
.6. Fo f PbSO 4 • 4Pb0]
.6F0r PbS04·4PbO: - 447,558 - ·32.06 x 10⁻³T2
-4.94 x l05T-l + 56.16T +
56 •. l38TlogT
T = 973°K .6,F0 PbS04e4PbO : -260,557 cal.
T = 993°K .6.F0 PbS04 .4PbO a ~256,836 cal.
T :1013°K t::,.FO PbS04.4PbO ~ -253,132 cal.
T .l033°K .6.F0· PbS04 .4PbO • -249,444 cal.

c. .6.F0 r of Fbso4.2PbO at 74o0 c and 7So0 c from
reaction (6-4)
2PbS + .PbS04 ·2PbO-. 5Pb+ 3802
59
-20.13T+ 23.86 x 10⁻³T2 +· 4.23 x 10⁵T-l+ 154,780
T --T :
-44.924TLogT :[3(-36,620 + 17.31T)]
-{€(-38, 640 + 20. 65T) +
.6_~·0 :f PbS04• 2Pb0]
6F0r FbS04 .2PbO : -337,360 + 30.76T - 23.86
x 10-3T2 - 4.23 x 10⁵T-l
+ 44. 924TlogT
1013°K .6.F0r ~bS04 .2PbO : -194,323 cal.
1033°K .6.F0r PbSO 4 • 2Pb0 · :-191,581 cal.
The results of the above calculations are summarized
in Table VII.
For purposes of comparison, the thermodynamic calcu
lations from the experimental data of both this investiga
tion and .the work of Kellogg and Basu are presented 1n
Table VIII.
Graphical Representation of the Thermodynamic
Celculations. The temperature dependence of .6.F~ is given
by the Gibbs-Helmholtz equation .6.Fo ~o - T AS0 • If
.6.Ho is independent of T, and _ .6. CP equal . to zero, a plot
· _ of .AF0 versus T should yield a straight line where

TABLE VII
CALCULATED VALUES OF b.F0 f OF PbS04•4PbO AND
PbS04•2PbO FROM THE! DATA OF
Reaction
(q-1) .. (6-4), (6-5)
(6.:.1, · (-6-4), (6-5)
(6-1) · (6-4), (6-5)
(6-1) · (6-4), (6-5)
Reaction
(6-4) (6-4) .
KELLOGG AND BASU·
Temp-°C
7000 700°
7200 720°
"7400 740°
7600 760°
Temp-0 c
740° 760°
0 . - .6:F f PbSO 4 • 4Pb0
260;012 cal. 260,557 cal.
256,209 ca1. 256,836 cal.
252;417 cal. 253,132 cal.
247,636 cal~ 249,444 cal. _.
- ~F0r PbS04·2PbO
194,323. cal~ 191,581 cal.
60

61 TABLE ·VIII
SUMMARY OF THERMODYNAMIC CALCULATIONS
COMPARIIDN OF THERMODYNAMIC PROPERTIES
THIS INVESTIGATION KELLOGG AND BASU
Reaction Temp-0c - ~For Reaction Temp-0c - i::).F f
PbS04· .. 4PbO PbS04.4PbO
(6-1) 700° 260,890 caJ.. (6-1) 700° 260,012 cal~ (6-2) 700° 260,333 cal. (6-4),(6-5) 700° 260,557 cal.
(6-1) 720° 257,779 cal. (6-4) 720° 256;209 cal. (6-2) 720° 256,510 cal. ( 6-4), ( 6-5) 720° 256,836 cal.
(6-1) · 74:00 254,217 cal. (6-1) 740° 252, 417 ce.1. (6-3),(6-4) 740° 253,468 cal. (6-4),(6-5) 740° 253,132 eal. ·
(6-1) 760° 249,697 cal. (6-1) 760° 247;636 cal. ( 6-3) , ( 6-4) 760° 248,600 cal. (6-4),(6-5) 760° 249,444 cal •.
Temp-0 c -flFo f
Temp-°C - -!:).For
Reaction PbS04e2PbO Reaction PbS04.2PbO
(6-4) 740° 194,618 cal. (6-4) 740°·., 194,323 cal. (6-4) 760° 191,155 cal. (6-4) 7600 191,581 cal.

slope : - A s0
Intercept = ~Ho
. 62
A plot of AF0 i of PbS04·4PbO versus T is illustrated
in_Figure 14. As indicated in the leg~nd, the values o:f 0 . . .
. AF r o:f P.bso4 .4Pb0 calcul·ated :from the results c:£ this
investigation and also those calculated from · the .work c:£
Kellogg and Basu have been included. ' .
Using the "method of least-squ~res", a- straight 1ine
was drawn through the points representing the data of this
investigation, an~ another straight line . through the points
representing the data of· Kellogg· and Basu.
The equation of the line representing the result s of
·this investigation is as follows·.: ' 0 + AF~ PbS04•4PbO = -444,207 + l88.45T; cal,-.65 Kcal
(7oo 0 -76o0 c), where t..65 Kcal represents an error
limit of one standard deviation (la-). In accordance
1d. th the Gibbs-Helmholtz equation,
~Hof Pbso4.4Pb0 : -444,207 cal,, (7oo 0 -76o0 c)
AS0 f ~bS04 •4PbO = -188 .. 45 e.u.., (7oo0 -76o0c).
The equation of the line through the points of
Kellogg and Basu is
AFof' PbS04 .4P°?O: -450,022 + 194.91T;cal, ±.58Kce.1
(7oo0 -76o0 c); where ~Hof' PbS04·4PbO: -450,022 cal, 0 .
(7oo0-760°c) AS f PbS04·4PbO ~ -194.91 e.u., ·(70o0 .:...·76QOC)

r -- -- -------=~- ----·· ····· ______________________________ &_,·3 I .
248 _
i . I 249::....
I r . : 1 250 L.· : ........ . : ,J l ~ 251 _ !~ · !
~ - 252 i--
i ' . I
. 0253 ;·
..0 ' a.. I . v·254 t-• "i ~2551
0.. 2,6 t-o'+- I l.L.257 t-
. <l . . I 2se t--
259
260
261
[.\ - - - -
/ /
"/ /
/
980
/ /
/
990
KELLOGG a BASU
THIS INVES TIGA110N
/ /
/ /
/ . /
N /
/
0
/ /
/ /
1000 IOIO 1020
Ti K
FIG.-14·-
A I' p/1
1030
I . TEMPERATURE DEPENDENCE OF ~ Ff OF PbS04-
. 4Pb0 BETWEEN I I
f
I 700•-:-7so·c

The calculations of' the two free en~rgy equations,
and the standard deviation error limits are included 1n
Appendix III and IV, respectively.
64
The average deviation of AF0 r' of PbSo4 .4PbO· values
calculated from both free·energy equations is ±.71 Kcal 1n·
the. temperature range 7oo0 c to 76o0 c. The ca.lculation of
the average deviation is included in Table.IX.
Because onl.y two values of .6.F0 r of PbS04 ·2PbO were
calculated from the results of this investigation, no
attempt was made to derive a linear free· energy equation 0 .
for ,6.F f o.f Pbso4.2Pb0 or compare it with a l·inear free
energy equation derived from the data of Kellogg and Basu.

TABLE IX
AVERAGE DEVL~TION OF ~For OF PbS04 .~PbO
VALUES FROM THIS INVESTIGATION AND THOSE FROM KELLOGG AND BASU
A. This Investigation
~F0r PbS04·4PbO = ;..444,207 + l88.45T
T-°C
700° 720°
0 7400 760
B. Kellogg and Basu
260,840 cal. 257,171 cal. 253,302 cal. 249,633 cal.
~F0 f PbS04·4PbO: -450,022+ 194.91T
T-°C
260;377 cal. 256,478 cal. 252; 580 cal. 248,682 cal.
65

TABLE IX (continued)
O' -~Ff PbS04 .4PbO (cai.)
T-<;>C A B d
700° 260, 84.Q 260;377 463 720° 257;171 256;478 693 740° 722 253.,302 252,580 . 760°. 249,633 248, 682 951·
2d = 2829
Average deviation_ - t 2 d. - t 2829 : ± • 71 Kcal - ~- -4-
66

CF..APTER VI I
IQ:NETIC STUDIES
A series of e xper1ments were conducted to determine
qualitatively the effect of (l) temperature, and (2)
PbO/PbS ratio on the rate of so2 evolution, with .the purpose
of gaining an insight into the reaction mechanism(s) in
volved in the approach to equilibrium..
Review of the literature. The kinetic behavior of
the system PbO-PbS has been studied by several investigators,
but with varying results. ·
Kohlmeyer and Monzer12 have stated that the reaction
mechanism consists of (1) formation of "basic sulfates",
and (2) reaction between the "basic sulfates" and PbS to
yield Pb and so2• The exact composition of the "basic
sulfates" was not established. . 13
Merrick has also investigated the kinetics of the
reactions between PbO and PbS, and has proposed the follow
ing mechanism:
l. PbS(solid)~ PbS(vapor)
2. PbS(vapor) transported to PbO solid surface
3. PbS(vapor) + Pb - O(_site)~ Pb - o ••• PbS
(equilibrium chemisorption)

68
4. Pb - o ••• PbS : (xPbO-Pbsif' activated complex~ ·
(x + l)Pb + SOX (adsorbed)
5 • sox (adsorbed)~S03 (gas)·
or
so . x (adsorbed)~ so2 (gas) + !02 (gas)
6 • S03 (gas)~ S02 (gas) + }02 (gas)
7. Transport of so3 , so2 , and o2 gases from solid
surface.
The mechanism proposed by Merrick presents one basic
objection. Since kinetics is tbe rate of approach to
equilibrium, any proposed reaction mechanism must include
a step involving the formation of the equilibrium, reactants.
The results of' the equilibrium studies show tt.at either
PbS04.2PbO or Pbso4.4Pb0 is an equilibrium reactant in the
system PbO-PbS. Consequently, any proposed reaction
mechanism must include a step involving the :formation c£ a
basic sulfate phase.
A more realistic mechanism has been proposed by
Kellogg and Basu. They have proposed the f'ollowing mechan
ism for a mixture of 2Pb0/1PbS at 1100°K:
PbS + 6Pb0~ PbS04·2PbO + 4Pb(liquid)
PbS04 .2PbO + 2PbS >5Pb(liquid) +'3802
(rapid)
(slow)
However, their proposed mechanism was not substantiat
ed by experimental kinetic measurements.

69
On the basis of the above information, a kinetic
study was initiated to determine the reaction mechanism(s)
in the system PbO-PbS~
The apparatus and experimental procedure. The
kinetic measurements consisted of passing argon gas at a
constant flow rate over a charge of PbO and PbS, and measur
ing the .so2 in the ·exit gas as a function or time.
The kinetic apparatus is schematically illustrated
in Figure 15. The argon gas was purified in the srune system
described in the equilibrium studies (see Figures 4 and 5).
The reaction tube and furnace assembly are illustrat
ed in Figure 16. The reaction tube was constructed from
19 mm. vycor glass tubing, and connections were made on both
ends of the tube by means of a series of ground glass joints;
both spherical and conical joints being used. The exit tube
was connected to the gas analysis apparatus by a shar t piece
of rubber tubing. The vycor glass thermocouple protection
tube was sealed to the reaction tube with High-Pyseal seal
ing wax. The ·remaining ~ystem was composed entirely of
pyrex and vycor glass.
A spacer, constructed from vycor tubing, was placed
between the boat and the end of' the reaction tube to pro
vide preheating of the inlet_ gas, and to decrease the
possibility of ~hermal segregation of the gases in the

/ PURIFIED ARSON
~, -··---F-U_R_N-AG_E ____ _
Fl G.-- 15
\ \
\ ~
ARGON+ :S02
\ TO GAS ANALYSIS
SCHEMATIC DIAGRAM ·oF KINETIC APPARATUS
70

----,,,,--.
PURIFIED ARGON
_/
REACTION
FURNACE POWER
FIG.-16
TU6E AND FURNACE ASSEMBLY FOR
KINETIC APPARATUS
THERMOCOUPLE
ARGON + so2
~
--, I
I
TO GAS
ANALYSIS
I I I I I
-·· .... ·-· ·--· . ·-··- . - .. -.. - .. - · .. •»•··---·---· .. . ···-·-· ·-· -·-···-·· - ···-···--···· .. ---.. -·-· · ··-·· ·"-····· .... ... ···-···" ________ ... .---J:

72
reaction zone.
The furnace was a hinged-type tube furnace, contain
ing 'two separate heating coils. Being hinged, the furnace
could be opened to permit rapid cooling of the tube and
sampl'e. Asbestos paper gaskets, constructed f'rom 1}11
asbestos paper tape, were placed around the reac:tion tube
on each end of the furnace to minimize convection currents
and increase thermal sta,bi1ity between the .furnace and tube.
The regulation of the power supply to the furnace
heating elements is schematically illustrated in Figure 9.
Power to the furnace was controlled by means of a Powerstat,
7-i ampere, variable transform.er. The transformer was.
-connected in series with a wneelco, Model 402-8296, _time
proportioning controller. The controller was actuated by a
chromel-alumel thermocouple which extended into the reaction
tube to the end of the boat.
A,Leeds and Northrup precision potentiometer; Model
No. 8662, was connected in parallel with the thermocouple
controller circuit to measure the temperature variance of
the furnace. Temperature control was found to be within
+ ,...oc - G •
The procedure used in making the kinetic measurements
follows. The appropriate PbO-PbS mixture was placed in a
· tai'ed, 10 mm. x 60 mm., Coors porcelain combustion boat and

73
weighed; the difference in weights being the weight of' the ..
mixture. Charge weights were usually 3-4 grams. Af'ter the
boat had been prepared, the reaction tube was evacuated and
filled with puri.fied argon. The furnEce was turned on and
allowed to reach the desired temperature. After the con
troller had maintained the desired .temperature f'or at least
5 minutes, the conical ground joint cap was removed from
the end of the reaction tube, the boat inserted in the fur
nace,. and the cap replaced. During the period that the cap
was·removed, argon gas was directed from the inside of the
tube th.rough the open end of the reaction tube, thus
preventing air from entering the reaction tube. After the
boat was in position and the cap replaced, 2 minutes were
allowed .for the boat to reach thermal equilibrium with the
furnace, then the flow of argon gas was started.
Analysis of the exit gas consisted of passing the
argon, so2 mixture through a glass fri t which was immersed
in an aqueous solution of H2o2 and NaOH. The S02 was con
sumed according to the rollowing reactions:
H2so4 + 2NaOH ~2H2o + Na2po4
The solution was stirred with a magnetic stirrer to provide
good contact of' the gas bubbles with the solution. The gas:
analysis apparatus is illustrated photographically in

74
Figure 10.
The rate of so2 evolution was measured by recording
the.time necessary ror a given quantity of standardized NaOH
to neutralize. The size of: tha NaOH ·additions was adjusted
to give a time period of 1-2 minutes between successive
NaOH additions. Time t.o was determined by star.ting the
stop watch when .05 c.c. excess of NaOH was neutralized.
The time was recorded on a precision, 7 jewel movem.ent,
stop ·watch, graduated in seconds.
The end point when the solution changed from basic
to acid was detected by use of a modif:ied methyl-red
indicator*. The color change at the end point was green
-in alkaline to violet-red in acid. The estimated a~curacy
of detecting the end point was± 3 seconds.
The accuracy of adding NaOH was estimated to be
± .05 c.c., which is~ .lfo cf the reaction completed for a
sample wnere 50 c.c. of NaOH represents 100~ reaction com
pleted. The concentrations o~ the NaOH solutions were such
tha. t lOOfo completeness of the reaction required between
35-70 c.c. of NaOH.
The NaOH solutions were standardized no earlier than
24 hours after preparation, and were kept in a dark enclosure.
*For instructions f'or preparation of' modified methylred indicator see Appendix I.
75
The NaOH solutions were standardized with Fisher's reagent
grade potassium hydrogen phthalate.
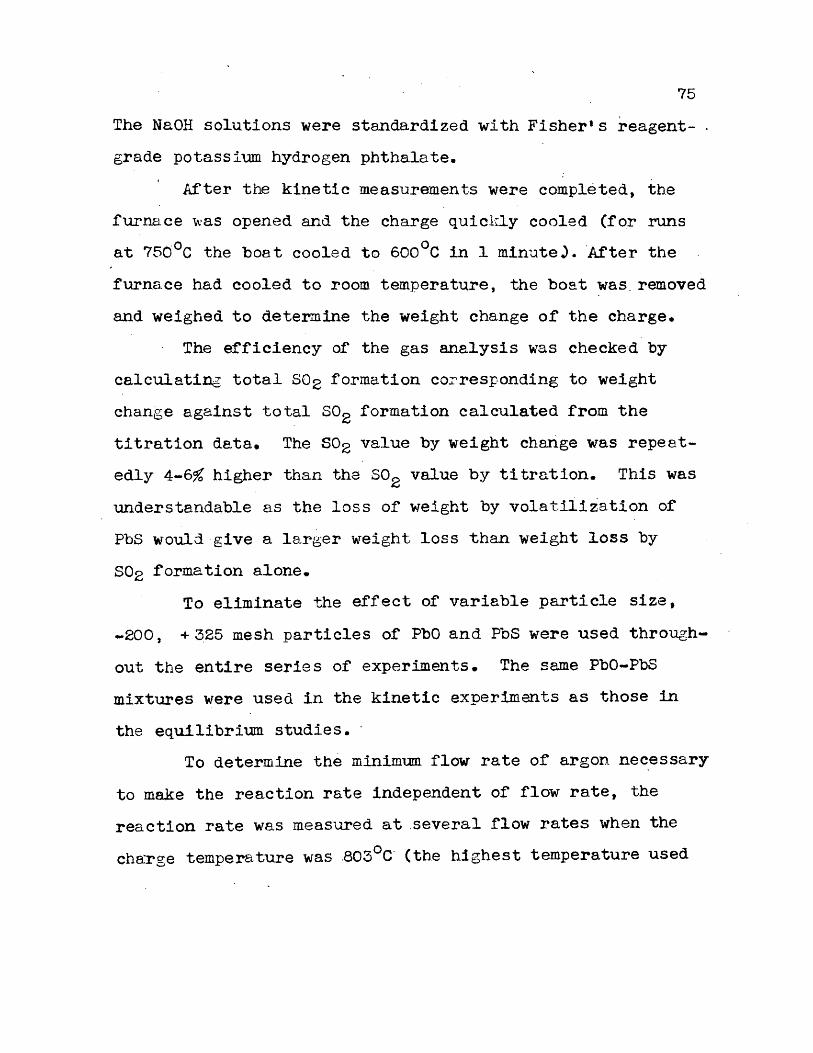
After the kinetic measurements were completed, the
furnace \vas opened and the charge quicld.y cooled (for runs
at 750°c the boat cooled to 6oo 0 c in 1 minuteJ. ·After the
furnace had cooled to room temperat~re, the boat was. removed
and weighed to determine the weight change o:f the charge.
The efficiency of the gas analysis was checke·d by
calculatins total so2 formation co~responding to weight
change against total so2 formation calculated from the
titration data. The so2 value by weight change was repeat
edly 4-6~ higher than the so2 value by titration. This was
understandable as the loss o:f weight by volatilization of
PbS would give a larger weight loss than weight loss by
so2 formation alone.
To eliminate the effect of variable particle size,
-200, + 3_25 mesh particles of PbO and PbS were used through
out the entire series of experiments. The same PbO-PbS
mixtures were used in the kinetic experiments as those in
the equilibrium studies. ·
To determine the minimum flow rate of argon necessary
to make the reaction rate independent of flow rate, the
reaction rate was measured at several flow rates when the
cha:-rge temperature was .803°c· (the highest temperature used

76
in its kinetic measurements).
The temperature dependence of the reaction rate
was'observed by me~sUTing the reaction rate at temperatures
between 704°C and 803°c using a constant PbO/PbS ratio.
The effect of the PbO/PbS ratio on the reaction rat.e
was determined by measuring the re~ction rate ·at copstant
temperatures and various PbO/PbS ratios. In addition to
the -rate measurements, X-ray patterns were obtained from
the reacted materials.
Experimental Results. All of the rate measurements
in this investigation have been expressed as (o(.), percent
of theoretical reaction completed, as a !unct~o~ of time.
This convention was adopted in order to make the reaction
rate· independent of ~harge weight, and to express the
reaction rate of charges not containing the stoichiometric
mixture of 2 moles of PbO to 1 mole of PbS. An attempt
was made to derive an empirical relationship between °'and
time, such that a plot of some flmction of °" versus time
would yield a straight line. However, no rela.tionship
was found that could be used £or any two rate curves which
were taken under different experimental conditions.
The rate curves were first plotted on t x 1 meter,
10 squares to the cm., graph paper in order to detect any
trends or peculiarities that would be unnoticed on conven-

77
tional size graph paper.
The effect or flow rate on the reaction velocity is
illustrated in Figure -17. These data ·are tabulated in
Appendix V. The reaction velocity appeared to increase
with 'increasing flow rate ·until a flow rate of 170 c.c./min.
was reached. Increasing the flow rate beyond 179 c.c./min.
appeared to decrease the reaction rate. The temperature was
constant at 803°C ~nd a charge ratio of 2Pb0/1PbS was used.
The results ·of the temperature dependence of the
reaction rate are tabulated in Appendix VI and illustrated
graphically in Figure 18. The rate was observed to increase
proportionately with increasing temperature, with the excep-o O ·
tion of the increase between the 733 C and 753 C curves. . 0
This rate increase which represents a 20 C increase in
temperature was larger than other increases representing
temperature changes of w 0 c. The flow rate was constant
at 260 c.c./min., and a charge ratio of 2Pb0 to lPbS was
used.
The results of measuring the reaction rate at various
FbO/PbS ratios are tabulated in Appendix VII and illustrated
graphically in Figure 19. The temperature was held constant
at 722°c, and a flow rate o:f 260 c.c./min. was used. No
appreciable reaction occurred .in charges lOPbO/lPbS and
8Pb0/1PbS. The reaction rate was essentially constant over

,, 90
,---i ! i l i I·
~ I
so L . .
I i i O 70 .__ I W I t-, (.)
'1 <( 60 ...__ - ~
' 50 r· ~
' -40 L
~ 30
20
10
10 20
0 - 82 · c.c./MIN. a -· 130 c.c./ MIN. l> - 260 c.c./ -MIN.
a ---- ·-170 c.c.1 M_IN.
30 40
t (MIN)
FIG:- 17
EFFECT OF FLOW RATE . . ON ; 'REACTION VELOCITY
78
I. ' I .
I I
i i
I
I
I
i I
I I !

l I
r----·-- ·-··-------------- . 1 . ~ -- 803° c
100 .. _.
·90~ I .
.. i
SOL ! I
--,-- --- 783° c El ---- 753° c A - 733~C
0 -- 704°C
. - . I . o·. 70·~· ·· w .. . ...... . . · .
~-6oL w . 1-cr . I o· 50l-~ . I
~ 40r 30 r-
1
20
10
10 20 30 40
-t ( MTN )
FIG.- 18
TEMPERATURE DEPENDENCE OF THE
REACTIO.N VELOCITY

I I I I
-I
I ! i
~-;~;~----! IO : I· NO, REACTION I
I 00 r- 8 : 1 NO REACTION l
l
L
eoL I
~ . {
_fa 1·0 · ~ ...... 0 ·~. 6oL ti: ! . '
~ · 50.·~ i i
.. 40 h-~- !
·I 30 L
10
6 : I A
4 .= , - 0
~ : l -- El
I: I. ~ -t
I ~ 2 --.- t->
1 ·:· 4·. -- X·
10 20
t · (MIN)
FIG.- 19
Pb 0/
I~ 6
I: 8
I :'10
30
80
PbS
~
- e (>
I i
L__ ---_J - -- __ J_ ---- -_ _J 40
DEPE-NDENCE OF REACTION VELOCITY ON
Pb O I PbS RATIO

81
the composition range 6Pb0/1PbS to 2Pb0/1PbS, but began
increasing at lPbO/l~bS and continued to do so until the
composition was 1Pb0/8PbS. The. rate a:t iPb0/8PbS. -ana. lPbO/lOPbS was essentially. the same. · The results o:r the
X-ray analysis of the reacted materials are summarized in
Table X • . Tetra-basic lead sul:rate and lee.d were. present
in all or the samples. Lead oxide was pre~ent in charges
containing PbO/PbS ratios greater than 8:1, and lead
sulfide was present in charges containing PbO/PbS ratios
less than 8 :·l. In no event were PbO and· PbS present in the
same sample.
Discu.ssion end conclusions. The results or measuring
the reaction rate a. t various flow rates indicate tha·t a flow
rate of 170 c.c~/min • . was suf'ficient to remove the so2 as
quickly as it was formed, and that rlow retes greater than
260 c.c./min. caused appreciable cooling of the charge and
a subsequent decrease in the reaction rate. Thus, a
maximum flow rate o~ 260 c.c./min. was used jn the remaining
experiments.
The explanation of the large increase in the reaction
rate between 733°c and 753°C appears to lie in the results
obtained from the equilibrium studies. Above 733°C the
equilibrium phases ror a 2P~0/1PbS mixture are Pb, PbS, and
Pb~o4.2PbO, _wh~le be1ow 733°C the equilibrium phases are

TABLE X
X-RAY IDENTIFICATION (F PEA.SES IN PARTIALLY REACTED PbO .. /.PbS MIXTURES
Temp. .... 722°c Flow Rate 260 c. c./min.
PbO/PbS Ratio 1oConversion Phases
10:l o.o Pb, PbS04 .4PbO, PbO
8:1 o •. o Pb, PbS04 .4PbO, PbO
6:·l 20.0 Pb,. PbS04 .4PbO~ PbS
4:1 22.0 Pb, PbS04 .4PbO, PbS
2:1 ·20.0 Pb, PbS04•4PbO, PbS
1::1 32.0 Pb, PbS04·4PbO, PbS
1:2 21.0 Pb, PbS04 .4PbO, PbS
1:4 21.5 Pb, PbS04·4PbO, PbS
1:6 21.5 Pb, PbS04•4PbO, PbS
1:8 9.;3 Pb, PbS04 •4PbO, PbS
1:10 12.0 Pb, PbSO 4 • 4Pb0., PbS
82
Pb, PbS, and Pbsc4.4Pb0. Consequently, th~ reaction
mechanism at temperatures above 733°C might be
6Pb0-+ ::bs--t 'bS04 .2PbO + 4Pb
PbS04 .2PbO + 2PbS-__.,.5Pb + 3$02
and at temperatures lower· than 733°C
8Pb0 + PbS-----+ PbSO 4 • 4Pb0 + · 4Pb
PbS04.4PbO + 3PbS 8Pb + 4S02
83
The ·rac·t that the charge was not in a state of chemica.l
.equilibrium during· the kinetic measurements does not pre
clude the possibility or having only the equilibrium phases
present. As a matter of' fact, the only phases that were
present in the materials obtained from reacting various
PbO/PbS mixtures, see Table X, were the equilibrium phases.
If the equilibrium phases were present below 733°c, it seems .
logical that the equilibrium phases were present above 733°c.
Thus, it was concluded that the increase in rate between
733°c and 75o 0 c was attributed to the change in the-reaction
mechanism, because the equilibrium phases are different
above 733°c. However, the question arises as to why the
reaction
PbSO 4 • 2Pb0 + 2PbS --> 5Pb + 3802
proceeds at a greater rate than the reaction
PbSo4
.4PbO + 3PbS ----..8Pb + 4802 •
There does not seem to·be an immediate solution from the

84
data that .were obtained in this investigation.
The sudden increase in reaction rate .in going from
8Pb0/1PbS to 6PbO/lPbS results, no doubt, from the change
in the reaction mechanism as indicated by the X-ray analy
. sis of the reacted materials. In charges containing more
PbO than 6Pb0/lPbS the proposed mechanism is a·s .follows!
8Pb0 + PbS~ PbS04 ·4PbO + 4Pb (fast)
PbS04·4PbO + Pb > 6Pb0 + S02 · (very slow)
and in charges containing more PbS that 8Pb0/1PbS the pro
posed mechanism is as follows:
8Pb0 + PbS > PbS04•4PbO + 4Pb
PbS04·4PbO + 3PbS > 8Pb + 4S02 •
(fast)
(slow)
Again the question arises as to why the difference in the
relative ·rates of the two mechanisms.
The explanation of the constant rate at ratios
between 6Pb0/1PbS and 2Pb0/1PbS, and the increased rate
at ratio.s between 2Pb0/1PbS and 1Pb0/8PbS may be :round by
calculating the moles of PbS04•4PbO and PbS per mole of Pb
which are present at various PbO/PbS ratios after the PbO
and PbS have reacted to form PbS04·4PbO and Pb. These
calculations are illustrated graphically in Fig\lre 20. At
all PbO/PbS ratios, the number of moles of PbS04.4PbO per
mole o~ Pb is the same. However, the number of mo1es of
PbS per mo1e of Pb increases as the PbO/PbS ratio decreases.

-·- -- ·· -·· ----------·----3 ~----
. a __ _; \r".',:
. 7 .. - .:.,~}
6 . - r~~ ~'+'
5 '. . \
4. ~ 0 - --- MOLES Pb S04
· 4Pb0 I MOLE Pb ,,
MOLES PbS/MOLE Pb
2 ~-I I
I \
? '\ I
I
I I \ (/) I i._ _o ·9~a.. .a·~ ' .7~ 0 .6 l-~ I
a.. .5 -I
,4 ~---1 I
.3 ~-I I I
.2L
I
i
} i } .
. !
! . l (:.") L. -~.:L--
0
_ l __ ___ __ l ~ _ _L ___ J_.· __ J __ . _L __ I r 2 . 3 4 s: s 1 8
l 9 10
M9~ES . OF Pb SCk ·· 4Pb0 O.R PbS I MOLE Pb
FIG.-20''
~ i i I I I I
!
~ --------- t. I· I I - .. T-~~
II · 12 13 14 10
MOLES OF PbSO- 4 PbO AND PbS I MOLE OF Pb . AT VARIOUS PbO I PbS RATIOS ~- -·--·· - · --~----· .. 3---------------------------------,-.---------

Between 6Pb0/1PbS and 2Pb0/1PbS the ratio of PbS to
PbS04·4PbO slowly increases. The mean rree _path between . . .
the. PbSo4.4PbO and PbS particles: was decreased, but the
86
rate change was not dete_cted experimentally. However, the
PbS/PbS04 ·4PbO ratio increased almost exponentially at
ratios less than 2Pb0/1PbS, and the rate was noticeably
increased. The same rate at 1Pb0/8PbS and lPbO/lOPbS
indicated that dii'fusion of the Pbso4 .4Pb0 and PbS particles
through the molten Pb was no longer rate controlling, but
rather the chemic_al reaction between PbSo4.4PbO and PbS.
The conclusions as to the kinetic behavior of the
system PbO-PbS can be summarized as follows:
A. At temperatures below 733°C three .possibilities exist.
l. The reaction mechanism for charges containing
PbO/PbS ratios greater than 8:1
8Pb0 + PbS~ PbS04·4PbO + 4Pb
PbSO 4 o 4Pb0 + Pb----> 6Pb0 + 802
(fast)
(very stow)
2. The reaction mechanism for charges containing
PbO/PbS ratios less than 8: but greater than 1:8.
8Pb0 + PbS ~ PbS04 • 4Pb0 + 4Pb (fast)
PbS04•4FbO + 3PbS >8Pb + ,4802 (slow, where
the rate is dependent upon the rate of diffusion of
PbS and PbS04·4PbO in ·the molten Pb.)
3. The reaction· mechanism :for charges containing

87
PbO/PbS ratios less·than 1:8.
8Pb0 + PbS -~) PbSO 4• 4Pb0 + 4Fb (fast)
PbSo4 .4FbO + 3PbS ----,.8Pb + 4S02 (slow, where the
ra.te is dependent upon .the rate of the ·chemical
reaction between Pbso4 .4Pb0 and PbS.)
B. ?it temperatures above. 733°C only one mechanism was
proposed.
The reaction mechanism for 2Pb0/1PbS is as follows:
6Pb0 + PbS ~ PbSO 4 • 2Pb0 + 4Pb
PbS04•2PbO + 2PbS--.+5Pb + 3802
(:rast)
(slow)
The results of this investigation are in ae;reement
with the findings of Kohlmeyer· and Menzer wh~re the "basic
sulfates" formed by PbO and PbS have been more specifically
identified es FbS04.4PbO and Pbso4.2Pb0.
The proposed mechanism of Kellogg has been substan~
tiated, and expanded to include the reactions between
PbS04.4PbO and PbS, and PbS04.4PbO and Pb.
Although the results of this investigation~do not
contradict the proposed mechanism of Merrick, the absence
of .a step involving the formation and subsequent reaction
of basic lead sulfates -detracts from the reality of his
mechanism. Perhaps the equation 2PbS04.xPbO + · (2 + ~)PbS
--. -> (4 + 3x)Pb + (4 + x)so2 should replace his equation
(xPbO-Pbs):f= activated complex • (x+ l)Pb + S02 (adsorbed).

CH.APTER VIII
SUMMARY AND CONCLUSIONS
The thermodynamic behavior of the system PbO-PbS was
studied by measuring the Pso2 in argon-so2 mixtures equi11-
bra.ted with various PbO.-PbS mixtures between 7oo0 -76ooc,·
and analyzing the condensed phases by means ·o~ the X-ray.
The reaction mechanism(s) involved in the approach
to equilibrium were studied by determining. the er~ect of
temperature and PbO/PbS ratio on the rate of' so2 evolution.
The PbO-PbS mixtures were prepared in the laboratory
by mixing purified PbS and PbO in various PbO/PbS mo1e ratios
· between 20 :1 and l: 20.
The method of so2 analysis consisted of passing the
argon-so2 mixtures through a glass frit immersed in a water
solution of H2o2 arid NaOH, and measuring the· NaOH co~sumed
by the so2 • The analysis was found to be accurate and
reproducible.
At constant temperature the variation of Pso2 with
composition was found to consist or several horizontal lines
connected by diagonal lines. Below 733°c the isotherms con
sisted of' two horizontals connected by one diagonal_line.
Above 733°c the isotherms consisted of three hori20nta.ls
connected by two diagonal lines.

89
Isotherms were constructed a.t 7oo0 c, 7?o0 c, 74o0 c and 760~C. The values of P802 were not measured below 7oooc
because the P802 values were too small to ~e accurately
·measured by the ~ethod of gas_ analysis employed in this
investigation. Measurements above ·760°C were avoided
because o:f the observed.contamination of the ·reacting
material by the porcelain boats at the higher ~emperatures.
X-ray analysis of the condensed phases showed that
the horizontals represented areas of three-phase ·stability,
and the diagonal· lines areas of two-phase s 1a bili ty. At
least one of the condensed phases was -a basic sulfate or
lead. Liquid lead also was one of the condensed phases
in each phase region. ·
The diagonal lines indicated· solubility of sulfur
and oxygen in liquid lead, and solid-solubility or sulfur,
oxygen, and.lead in the basic sulfates. Because of the lack
of knowledge of the solubility curves for liquid lead and
basic sulfates of lead, the exact composition of the lead
and basic sul..fates could not be established.
A phase diagram for the system PbO-PbS was proposed.
The proposed diagram was compared to the diagram constructed
from the Pb-0-S composition diagrams of Kellogg and Basu.
A region of two-phase stability is indicated as a line on
the diagram rrom Kellogg and Basu, and as an area on the

90
diagram from this investigation. The composition of the
liquid lead was not indicated, and the symbols Pbso4 .4Pb0
and Pbso4.2PbO were restricted to mean that one of the
condensed phases ha'd a particular basic sulfate structure,
but the composition was not necessarily that indicated by
the stoichiometric formula.
Below 733°C, the phas·e regions in going from PbO to
PbS are (1) PbO, Pb1 , PbS04.4PbO, (2) Pb1 , Pbso4.4Pb0, and
(3) PbS, Pb1 , PbS04·4PbO. Above 733°C, the phase regions
in going from PbO to PbS are (1) PbO, Pb1 , PbS04 .4PbO, (2)
Pb1
, PbS04•4PbO, (3) Pb1 , PbS04•4PbO, PbS04•2PbO, (4) Pb1,
PbS04•2PbO, and (5) PbS, Pb1, PbS04•2PbO.
The thermodynamic calculations of the experimental
data consisted of the derivation of a linear equation for
the ..6.F0 r of · PbS04·4PbO in the temperature range 7oo 0 c -
760°C. The thermodynamic calculations of the experimental
data of Kellcgg and Basu likewise consisted of the deriva
tion of a linear equation for the .6F0r of PbS04·4PbO in •
the temperature range 7oo0 c - 760°c. The linear free energy
equations and the .6 H0r and ~s0 :r of PbS04 ·4PbO calculated
in accordance with the· Gibbs-Helmholtz equation are summari
zed in Table XI.
Because of the limited experimental data on the
.6Fof of PbS04.2PbO, only two values were determined

TABLE XI
LINEAR FREE ENERGY EQUATIONS FOR
.6. F 0 f OF PbS04 • 4Pb0
A. This Investigation:.
.6.F0 r PbS04 .4PbO ~ -444,207 + 188.45T; ± .65 Kcal c 7ooo-7.6o?c)
where ~H0 r Pbso4 .4Pb0 = -444,207 cal.
~s0r PbS04·4PbO :! -l88.4f e ... u.
B. Kellogg and Basu:
,6.F0 r PbS04·2PbO ~ -450,022 + l94.91T;± .• 58 Kcal (7uoo-76ooc)
where b.H0r Pbso4 .4Pb0: -450,022 cal.
~ s0 '£ PbS04· 4Pb0 - -194. 91 e. u.
91

92 . 0
experimentally, a free energy equation for f:l.F f of
PhS04-2PbO was not derived.
The small deviation, ±.65 Kcal, of ~he experimental
data from the Cl. F 0 r' of Pbso4 • 4Pb0 values calculated from the
linear free energy equation indicates that the ~H0 r of
Pbso4 .4Pb0 is essentially constant and that ~CP is approx
imately zero in the temperature range studied.·
The close agreement of ~F0 r of Pbso4 .4Pb0 values
calculated at the same temperature, but from different
reactions, indicates that although the activity of each
condensed phase may not be unity, the activity of each
condensed phase is approximately constant within the range
of experimental detection.
The accuracy and reproducibility of' the experimental
technique can be evaluated as follows. The average devia
tion of i.71 Kcal between the ~F0 r of PbS04 .4PbO values
calculated from the linear free energy equation derived from
the experimental data and the linear free energy equation
derived from the data of another technique is well within
the accepte~ experimental accuracy oft 1 Kcal for most
free energy data. The excellent reproducibility of the
experimental technique is evidenced by the large number or points that were taken for the 8-48 mole foS horimntal on
the 720oc isotherm, end the . small variance of any point from

93
the horizontal line.
On tha basis of the results obtained in this
investigation, serious objection is raised as to the valid
ity of the Pb-0-~ composition diagrams · proposed by Kellogg
and Basu. The diagrams as presented, see Figures 1 and 2,
do 'not violate any principles of construction. However,
these diagrams indicate that pure lead is · one .of -the stable
phases, while it is an established fact ·that both sulfur .
and oxygen are soluble in liquid lead. The importance of
this solubility was established by the fact that the two
phase regions (Pb1 and basic lead sulfate) appeared as
regions of liquid and solid-solubility on the Pso2-compos1-
tion isotherms. Although the degree of solid-solubility in
basic lead sulfate is probably small, the possibi1:-ity of'
solid-solubility or the basic sulfates together with liquid
solubility of lead must be taken into consideration in
construction of the Pb-0-S composition diagrams. In this
respec~, the Pb-0-S composition diagrams are likely to be
more complex th.an those presented by Kel1cg g and Basu.
Since the solubility curves for· liquid lead and condensed
basic sulfates are not · available, the only correction to
the diagrams of Kellogg and Basu is the indication that the
lines representing two-phase regions are in reality areas of
two-phase stability. The corrections ·to the composition

94
diagram Pb-0-S for temperatures above 733°C are illustrat
ed in Figure 21.
It is recommended that in order to complete the
P0
bO-PbS phase diagram, and possibly· to obtain a better
understanding of the Pb-0-S ternary diagram, ·cooling curves
be obtained for various PbO-PbS mixtures as well as chemical
8!1Etlysis of the liquid lead phase. The degre~ of solid
solubility in basic lead sulf'ate could possibly be determin
ed by accurately measuring the lattice parameters of the
basic suli'ate with a more refined X-ray technique, and
correlating the changes in lattice parameters with composi
tion of the basic lead sulfate phases.
The data of the kinetic measurements could not be
treated in a quantitative manner because of the inapplica
bility· of classical reaction kinetics to systems involving
solids, liquids, and gases, where the activity of each solid
phase was unity. The results were treated in a qualitative
manner to illustrate the effect of temperature and PbO/PbS ,
ratio on the rate of so2 evolution, for the purpose of
gaining an insight into the reaction mechanisms in the
system PbO-PbS.
The results of the kinetic study indicated ~hat the
reaction mechanism between PbO and PbS is (1) conversion of
all of the PbO or PbS (whichever is the minor constituent)

'l!
•.;-
.~
> _. ·
PbSO • 4
-/ ,lio: .. . PhO
-~.lG .. ~ 2l ·
CORREOTfD COMPOSITnt· 'DfAGRAM FOR--:~E, .. Pb- s-.o.: SYSTEM .A80VE 733•c.
95

96
to either PbS04 ·4PbO or PbS04·2FbO, and (2) reaction
between the basic sulfate and either Pb or PbS to produce
so2 • In mixtures containing more PbO than 8Pb0/1PbS the
so2 producing reaction is
PbS04 ·4PbO + Pb 6Pb0 + S02 •
In -mixtures containing more PbS than 8Fb0/1PbS the reaction
is
2(PbS04•XPbO) + (2+ x)PbS ~(4+ 3x)Pb + (4+x)S02,
where xis 2 at higher temperatures (greater than 733°C) '
and 4 at lower temperatures (less than 733°C).
Perhaps the conclusion o.f greatest signi.ficance is
that the equilibrium 2Pb0 + PbS~ 3Pb + S02 , which is
thought to be the basis o.f ore-hearth roasting, is unstable
at all PbO/PbS ratios in the temperature range 7oo0c to
760°c. The results of the equilibrium and kinetic measure
ments show that the reaction sequence for a mixture of 2
moles or PbO and 1 mole of PbS is as follows:
A. Below 733°c
8Pb0 + PbS--+ 4Pb + PbS04·4PbO
PbSO 4 • 4Pb0 + 3~bS =:::::; 8Pb + 4502
B. Above 733°c
6Pb0 + PbS ----+ 4Pb + PbSO 4 • 2Pb0
(Fast, non-equilibrium)
(Slow, stable equilibrium)
(Fast, non-equilibrium)

97
PbSO 4 • 2Pb0 t 2PbS =:::::; 5Pb + 3S02 (Slow, stable equilibrium)
Using the thermodynamic data available in the 11ter-
·ature and the results of this investigation, calculations
of a quantitative nature can be made to determine the effect
·of _temperature, composition, and pressure on .processes .
involving lead oxide and lead sulfide. This, it is hoped,
will lead to eventual improvement of existing processes, or
the possible development of a new process.
In addition, the results of the kinetic measurements
can be used to predict the qualitative effect of temperature
and composition·on the rate of processes involving lead
oxide and lead sulfide.

BIBLIOGRAPHY
1. Schenck, R. end W. Rassback "Uber die chemischen Gleichgewichte bei der Reaktion Zwischen Belisulfid und seinen Oxydationsprod.ukten". (An Account of the Chemical Equilibria in the case of the Reactions between Lead Sulfide and its Oxidation Products.) ~· d. D. Chem. Ges., 41, ·p. ~917, (1908).
2. Reinder~.w. "Physikalisch-Chemische Studien Uber die Rostprozesse". (Physical Chemical Studies Concerning Roasting Processes.) z. anorg. Chem., ~3,.p. 213, (1915). --
· 3. Schenck, R. and A. Albers •Uber die chemischen Gleichgewichte Zwischen Bleisulfid und seinen Rostprodukten 11 • (An account of the Chemical Equilibric between Lead Sulfide and its Roast Products.) z. anorg. Chem., 105, p. 145, (1919).
4. Schenck, R. · and W. Borkenstein •Uber die Chemischen Gleichgewichte Zwischen". (An account of the Chemical Equilibria between Lead Sulfide and its Roast Products.) ~. anorg. Chem.·, 142, p. 143, (1925).
5. Kellogg, H.H. and S.K. Ba.su "Thermodynamic Properties of the System Pb-S-0 to 1100°K." Trans. AlME,' 218, p. 70-81, (1960).
6. Lander, J.J'. "The Basic Sul:f'ates of Lead." Trans. Electro-chem. Soc., 95, p. 174, (1949)
7. Darken, L.S. and R.W~ Gurry · "The System Iron-Oxygen.", . J. Am~ Chem. Soc., 67, p. 1398, (1945) ~
8. Gillham, E.W.F. in Flue Gas. 11
.(1946 ).
"The Determination of Oxides of Sullur J. Soc. Chem. Industry, 65, p. 370,
9. Hansen, M. Constitution of .Binary Alloys. 2nd ed., McGraw-Hill, New York, p. 1065, p. 1100, (1958).
10. Kubaschewski, o. and E. Evans Metallurgical Thermochemistry. 3rd ed., Pergamon Press, New York (1958).
11. Stubbles, J.R. and C.E.· Birchenall

99
of the Lead-Lead Sulfide Equilibrium between 585° and 920°c.A Trans. AIME., 215, p. 535-538, (1959).
12. Kohlmeyer, E.J. and W. Monzer "Uber die Reaktionen von Bleisul.fid mit Bleioxyd bzw. Sulfat." (.An Account of the Reactions of Lead Sulfide with · Lea_d Oxide, or Sulfate.) z. anorg. Chern., 252, p. 74-85, (1943).
13. Merrick, s. ttA Kinetic Study of the Roast-Reaction of Lead Sulfide." M •. t. Sc. Thesis, University of British Columbia, p. 65,- (1957).
14. Mellor, J.W. Higher Mathematics. 4th Ed~, Dover Publications, Inc., p. 327, (1955).

APP~1)ICES
APPENDIX I
PREFARATION' OF MODIFIED METHYL-RED INDICATOR
Modified methyl-red indicator was prepared by the
formula given by Gi1lham8• The color was violet-red in
acid solutions, colorless in neutral solutions, and green
in alkaline solutions. Procedure for preparation of
modified methyl-red indicator follows.
1. Dissolve 0.40 grams of methyl-red 1n 15.2 ml. of
1/10 N. Na.OH,
2. dissolve 0.20 grams of methylene blue chloride
1n distilled water, and
3. mix the two solutions and dilute to one liter.

APPENDIX II .
SAMPLE CALCULATIONS OF -LOG Pso2
FROM EXPER!MENTAL DATA :
Run #3 Furnace Temperature_ : 740°c
Sample: 6Pb0/1PbS: 7.14 Mole fo S
Volume of gas bottle - .2745 Liters
Pressure= 745.7/760: .98118 atm.
Gas Temp.: 27. s0 c + 273 = 300. s°K
nT = ~: (.98118)(.2745)/(.08205)(300.5)
n.ir = 1.09237 x 10⁻² Moles
c.c. NaOH Added
c.c. c.c. c.c.
- 20.00 Na.OH - 9.30 H2S04 .
c.c. NaOH consumed by so2 10.70
n.502 .... 10.70 x 2.1267 x 10-5 Moles so2·
- 2.27557 x 10⁻⁴ Moles
nso2 x PT nT
c.c. NaOH
: (2.27557 x 10⁻⁴/1.09237 x 10-2 ) x .98118 -2
: 2.0439 x 10
Log P802 : -2 +_.31046: -1.68954
:. - Log Pso2 = 1.689

APPENDIX III .
CALCULATION OF THE LINEAR FREE ENERGY EQUATIONS
USING THE METHOD OF LEAST SQUARES
Method of Least Squares (l4) for y: mx + b
m : ~n~ :l:yx - ~x~y (n) ~x2 - (~x)2
~
b :~r 2:Y -4x ~~ (n) .~x2 - (:l:x)
where y : /;),. F 0 t: PbSO 4 • 4Pb0
x: T° K
A. Data .from this investigation •.
# x x2 y XY
1 973 94.6729.104 -260,890 -253_, 845 , 970
2 973 94.6729.104 -260,333 -253,304,009
3 993 , 4
98. 6049.10· -257,779 -255,974,547
4 993 98. 6049·104 -256,510 -254,714,430
5 1013 102. 6169.104 -254,217 -257,521,821 -
6 1013 102.6169.104 -253,468 -256, 763,084
7 1033 106.7089.104 -249,697 -257,937,001
8 1033 ,106. 7089, 104 -248, 600 -256,803,800
~X:8024.0, :;Ex2 : 805.2072.104 , ~y : -2,041,494 ~xy :
~2,046,864,662
( ~x) 2 = 64.384,576 x 104 ,
:;EX • ~ y : -16, 380, 947, 856.0

B.
II
1
2
3
4
c:: v
APPENDIX. III (continued)_
('")
~X,::, • ~y: -16,438,256,675,568
~x • ~x.y :. -16,424,042,047 ,888
m : (8) [-2,046,864,662] .. G-16,380,947,856] (8) [ 8,052,072] - [6.4,3,'.34,576]
m = (-16,374,917,296) + (16,380,947,856) 64,416,576 - 64,384,576
m = 6,030, 560 .32,000
m = 188.455
b = -16,438,256,675,568 ~ 16,424,042,047,888 (8)(8,052,072) - 64,384,576
b = -14i214,627,680 c = 64,416,576 - 64,384,576
b = -14,214.627,680 32,000
·b :: -444,207
• ~ Fo! Pbso4 .4Pb0 : -444,207 + l88.45T • •
Data from Kellogg and Basu.
x x2 y XY
973 946,729 -260,012 -252,991,676
973 ' 946,729 -260,557 -253,521,961
993 986,049 -256,209 -254,415,537
993 986,049 -256,836 -255,038,148
1013 1,026,169 -252,417 --255,698,421
103

#
6
7
8
~x =
APPENDIX' III (continued)
x x2 y
1013 1,026,169 -25G,I~2
1033 1,067 ,089 -247,636
1033 1,067,089 -249,444
8,024 ~x2 : <3,052,072 ~y : -2,036,243
( ~x)2 : 64,384,576
~ x • ~ y : - 16 , 338 , 813 , 832
~x2 • ~Y = - 16, 395, 975, 245, 496
~ • ~xy ~ - 16,381,574,522,376
104
XY
-256,422,716
-255,807,988
-257,675,652
~xy = -2,041,572,099
m • - -16 338 813 832 64,384,576
m = -16,332,576,792 + 16 1 338 I 813 a 832, 64,416,576 ... 64,384,576
m - 6,237.040 - 32,000
m - 194.908 -b - (-16,395,975,245,496) - (-16,381,574,522,376)
32,000 -
b: -14,400,723.120 32,000
b : ' -450,022
• •• ~ Fo PbS04• 4Pb0 : -450 ,022 + 194, 908T

AP·PENDIX IV
CALCULATION OF ERROR LlMITS · OF THE LINEAR FREE ENERGY EQUATIONS
Error limit equals one . standard deviation (1 a- ) •
The f onnula for calculating tr is as follows:. 2· l
(J : ~ [_ ~ (d) . )2 \.:n-1.
· where d - the deviation of a single measurement
· n = number of samples
A.'. Error Limit for Linear Free Energy F,quation From This
Investigation.
I::,. F0 f PbSO 4 • 4Pb0 (Exp.) _6F0 f PbS04· 4Pb0 d d2
(Equation) ·
. -260 ,"890 -260 ,840 50 2,500 ..
-260,333 -260,840 507 · 257 ,049
-257,779 -257,1'71 608 369,664
-256,510 -257,171 661 436,921
-254,217 -253,302 915 837,225
. -259,468 -253,302 166 27,556
-249,697 -249,633 64 4,096
-248, 600 -249,633 1033 1,067,089
~d2 - 3,002,100 -

106
APPENDIX ·IV (continued)
u: "' ~ 1 00~ 1 100"3':; €e,an.:v! c; : ;: • 655 -Kcal
B. Error Limit for Linear Free Energy Equation .from
· Kellogg and Basu.
!::,. F 0 r PbSO 4 • 4Pb0 (Exp) l:l. Fo f PbS04-4PbO d (Equation)
-260,012 -260,377 365
-260,557 -260,377 180
-256,209 ~256,478 269
-256,836 -256,478 358
-252,417 -252,5'80 163
-252,132 -252,580 ·552
-247, 636 -248,682 1046
-249,444 -248,682 762
~d2 = . u= '+
(j: ;
@.·37~,18!) t = + ~8,883.9t .582 Kcal
d2
133,225
32,400
72,361
128, 164
26,569
304,704
l _,094,116
580,644
2,372,183

Run#
1
APPEI'-J'"DIX V .
KINETIC DATA:. REACTION VELOCITY VERSUS FLOW RATE
Temperature: 803°c
PbO/PbS: 2 :1
Flow Rate -(c. c./min.) Time - (Min)
82 0
1.0.
2.23
3.32
4 •. 45
5.63
6.90
8.25
9.75
11.38
13.08
14.73
16.43
18.20
20.25
21.03
(% Reacted)
0
1.83
7.33
12.82
18.32
23.82
29.31
34.81
40.31
45.80
51.30
56.80
62.29
67.79
73.29
75.12

108
APPENDIX V (continued)
Flow Rate~ Run# ( c. c ./min.) Time - (Min) · (~ Reacted)
l 82 21.88 76.95
22.75 78.78
23.73 80.62
25.00 82;.45
31.65 84.28
34.2S 84.46
36.00 84.65
2 130 1.00 1.49
2.12 5.97
3.05 10.45
4.88 19.41
5.87. 23.89 . ~
6.90 28.37
8.00 32.84
9.22 37.32
10.47 41.80
11.83 46.28
13.30 50.76
14.78 55.24

109
APPENDrx·v (continued)
Flow Re.te -Time· -Run # ( c. c ./min.) (Min) Ci Reacted)
2 130 16.28 59.78
17.80 64.20
19.27 68.68
21.22 74.65
22.33 77.64
23.52 80.62
24,.92 83.61
27.43 86.59
33.50 87.34
170 l.~5 1.67
2.32 6.67
:1.07 11.67 . -
3.87 16.67
4.67 21.67
6.55 26.67
6.47 31.67
7.48 36.68
8.58 41.68
9.77 46.69

110
APPENDIX ·v (continued)
Flow Rate -Run# ( c .• c .• /min.) Time · - (Min) (" Reacted)
3 170 11.03 51.69
12.30 56.69
13.55 61.69
14.80 66.70
16.01 71.70
17.62 76.70
20.30 83.37
4 260 .85 1.52
1.·ao 6~10
2.57 10.68
3.32 15.25
4.10 19.83
4.95 24~41
5.83 28.98
6.77 33.56
7.80 38.13
8.90 . 42. 71
10.07 47.28
11.35 51.86

111
APPENDIX V (continued)
Flow Rate -Run # (c.c~/min.) Time ·- (Min) (fo Reacted)
4 260 12.70 56.44
14.08 61.01
15.47 65.59
16.83 70.16
18.67 76.27
19.18 77.79
19.67 79.32
20.78 82.37
22.48 . 85.42
·24.07 86.'18
27.18 86.64
30.00 86.94
36.00 87.32 .
50.00 87.74

Run#
5
APPENDIX VI
KINETIC DATA:. TEMPERATCRE DEPENDE~CE OF REACTION VELOCITY
Flow Rate : · 260 c. c./min
PbO/PbS: 2:l
Temp.(°C) Time - (Min)
704° 5~38
7.75
10.05
12.2a-
14.38
16.42
18.47
ro.68
22.80
25.02
27 •. 13
29.65
31.97
34.28
36.58
39.00
(~ Reacted)
1.30
2.60
3.91
5.21
6.51
7·.a1
9.11
10.42
11.72
13.02
14.32
15.62
16.93
18.23
19.53
20.83

113
APPENDIX ·vI (continued)
Run# Temp.( 0 q) Time - .(Min') (~Reacted)
5 704° 41~45 22.13
43.93 23.44
46.50 24.74
49.08 26.04
51.65 27.34
54.28 28.64
6 733° 2.07 1.53
3.43 3.06
4.92 4.59
6.53 6~12
8.33 7.65
10.17 9.18
12.13 lQ.71
·14.08 12.24
16.17 13.77
l.8.33 15.30
20.48 16.83
22.63 18.36
24.83 19.89
27.05 21.42

114
APPENDIX VI (continued)
Run# Temp. (OC) Time - (Min) ('% Reacted)
6 733° 29.23 22.95
31.47 24.48
33.73 26-.0l
35.97 27.54
38 •. 23 29.07
40.43 30.60
42.72 32.13
44.97 33.66
47.18 35.19
49~45 36.72
51.70 38.25
53.87 39.78.
7 753° 1.73 1.42 -
3.50 4.26
s.12 7.09
6.58 9.93
8.03 12.76
9.48 15.60
10.93 18.44
12.40 21.27

115
APPENDIX'VI (continued)
Run# Temp (°C) Tim~ - (Min) '" Reacted)
7 753° 13.85 2·4.11
15 •. 33 26.94
1.6.78 29.78
18.33 32.62
19.88 35.46
21..50 38.29
23.12 41.13
24.78 43.97
· 26.52 46.80
28~30 49.64
30.12 52.48
32.02 55.32
33.98 58.15 -
36.07 60.99
38.23 63.83
40.48 66.66
44.07 70.91
46.73 73.75
49.60 76.59
53.00 79.42

116
APPENDIX VI (continued)
·Run# Temp (°C~ Time - (Min) (9' Reacted)
8 783° 1.57 1.34
2.57 4.03
3.40 6.72
4.17 9.41
4.93 12·.07
5.72 14.78
6.50 · 17.47
7.33 20.15
8.13 22.84
9.·00 25.53
9.87 28.21
10.72 30.90
11.63 33.59 ·
12.57 36-". 28
13.52 38.96
14.52 41.65
15.55 44.34
16.62 4_7.02
17.73 49.71
18.87 52.40

117
APPENDIX VI (continued)
Run# Temp (OC) Time - (Min) (~ Reacted)
8 783° 20.:08 55.08
21.33 57.77
22.67 60.4.6
24.12 63.14
26.48 67.18
28.32 69.86
29.25 - 71.21
30.25 72.55
31.23 73.89
32.·23 75.24
33.22 76.58
34.25 77.93_
35.28 79.27 ·
36.32 80~62
37.37 81.96
38.50 83.30
39.97 84.65
41.62 85.~9
803° (See Run #4)

Run#
9·
10
ll
12
APPENDIX VII
KINETIC DATA: DEPE.t.1mENCE OF REACTION · VELOCITY ON PbO/PbS RATIO
· Flow Rate: ·260 c.c./Min
Temperature:: . 722°c
PbO/PbS Ratio Time - (Min) . (9' Reacted)
10:1 (Reaction Velocity = 0)
8:1 4.58 2.00
·4.00
6:1 1.25 .1.42
2.42 2.84
4.62 5.68
7.88 8.52
13.05 11.36
22.25 14.20
28.50 15.62
36.42 17.04
46.17 18.46
4:1 1.83 1·.79
3.62 3.58
5.95 5.36

119
APPENDIX VII (continued)
Run# PbO/PbS Ratio Time - (Min) (~ Reacted)
12 4:1 9.oo 7.15
12.58 8.94
16 •. 67 10..72
21.25 12.51
23.50 13 •. 41
26.05 14.~0
28.62 " 15.19
31.42 16.09
34.02_ 16.98
36.78 17.88
39.67 18.77
42.25 19.66
45.42 20.56
48.35 21-.45
13 2:1 1.60 1.10
:3.40 2.19
5.42 3.28
7.78 4.38
10.12 5.48
12.75 6.57

120
APPENDIX, VII (continued)
Run# PbO/PbS Ratio Time - (Min) (fo Reacted)
13 2:1 15.35 7.67
18.20 8.76
21.03 9.86
24.10 10.95
27.10 12·.05
30.13 13.14
33.13 14.24
36.33 15.33
39.72 16.43
42.93 17.52
46.32 18.62
49.60 19.72
14 1:1 1.43 1.37
2.88 2.75
4.33 4.12
5.78 5.49
7.42 6.8'7
I 8.95 a.24
10.57 9.61
12.17 10.99

121
APPENDIX .VII (continued) .
Run# PbO/FbS Ratio Time - (Min.) (foReacted)
14 1:1 13.88 12.36
15.67 13.73
17.47 15.11
19.33 16.48
2J..28 17.85
23.35 19.23
25.58· 20.60
27.87 21.98
. 30.33 23.35
32·.95 24.72
35.73 .26.10
38.52 27.47
41.52 28.84
45.00 30.22
48.28 31.59
15 1:2 1.33 2.29
2.73 4.57
4.18 6.86
5.63 9.15
7.22 11.43

122
APPENDIX.VII (continued)
Run# PbO/PbS Ratio Time-(Min) (~ Reacted)
15 1:2 8.88 13.72
10.73 16.01
12.62 18.29
14.63 20.5.8
16.65 22.87
19.00 25.15
21.35· 27.44
23.78 29.73
26.45 32.01
29.13 34.30
32.00 36.59
35.00 38.8?
37.97 41.16
41.15 43.45
44.40 45.74
47.83 48.02
51.43 50.31
~5.12 52.59
16 1:4 1.30 3.26
2.58 6.52

123
APPENDIX .VII (continued)
Run# PbO/PbS Ratio Time - (Min) (" R_eacted)
16 1::4 4.05 9.78
5.65 13.03
7.23 1~.29
9.13 19.5~
11.12 22.·a1
13.27 26.07
15.58· 29.32
17.98 32.58
20.58 35.84
23.35 39.10
26.25 42.36
29.45 45.62
32.73 48.88
36.18 52.13
39.97 55.39
43.78 58.65
47.88 61.91
17 1:6 1.45 5.42
2.97 10.85
4.58 16.28

124
APPENDIX .VII (continued)
Run# PbO/PbS Ratio Time - (Min) (~ Reacted)
17 1:6 6..45 21.70
8.52 27.13
10.80 32.56
1.3.42 37.98
16.23 43.41
19.47 48.83
22.98 54.26
26.87 59.68
31.13 65.11
37.40 70.16
18 1:8 1.67 6.79
3.35 13.58
5.27 20.37
7.43 27.16
9.87 33.94
12.75 40.73
15.98 47.52
'19.50 54.-31
23.92 61.10
27.17 64.50

125
APPENDIX. VII ( continued)
Run# PbO/PbS Ratio Time - (Min) (~ Reacted)
18 1:8 34.58 67.89
43.58 69.25
J.9 1:10 1.57 7.85
3.50 15.70
5.77 23.55
8.40 31.40
11.67 39.25
15.27 47.10
19 •. 58 54.94
25.65 62.89
50.75 70.64

VITA
The author was born on October 2,. 1936 in Miles C.ity 1
Montana. He received his primary and secondary education
in Big Timber, Montana. He entered the Montana School of:
Mines, in Butte, Montana in September, 1954, receiving a
Bachelor of Science Degree in Metallurgical Engineering _
in June, 1958 • .
He has been enrolled in the Graduate School of the
University of' Missouri School of Mines and Metallurgy since
September, 1958. He was appointed an Assistant Instructor
in Metallurgical Engineering in September, ·1959.