a thermodynamic investigation of the...
TRANSCRIPT

A THERMODYNAMIC INVESTIGATION OF THE EARLY AFTERNOON WET MICROBURST PRE·STORM ENVIRONMENT OVER SOUTHERN
ALABAMA AND THE WESTERN FLORIDA PANHANDLE
Jeffrey Mark Medlin and Jack Cullen
NOANNational Weather Service Weather Forecast Office
Mobile, Alabama
Abstract
Using Eglin Air Force Base, Florida afternoon rawinsonde sounding data, this study investigated the thermodynamic characteristics of the summertime, U.S. Gulf Coast, wet microburst environment. Uniquely, these soundings sampled the troposphere during a period (1700-2100 UTC) of weak vertical wind shear, peak boundary layer mixing, and thermodynamic instability prior to the release of deep convection. Using data over a six-year period (1998-2003), mean soundings were generated to operationally distinguish between wet microburst event and non-event days. A composite of summer month mean soundings was generated to illustrate the effects of seasonal progression on the regional thermal and moisture vertical profiles.
The event day mean sounding is warmer and moister below the melting level and vice versa above the melting level. It possesses a greater surface to freezing level lapse rate and a higher absolute value of boundary layer moisture compared to the non-event mean sounding. The chance of a wet microburst occurring becomes relatively higher when mixed-layer convective available potential energy >3095 J kgl, surface-900 hPa mean mixing ratio >17.6 g kgl, surface-freezing level lapse rates >7.97°C km-t, and relatively lower when mixed-layer convective available potential energy <1350 J kgl, surface-900 hPa mean mixing ratio <13.5 g kgl, and surfacefreezing level lapse rates <6.84°C km-1
• Seventy-five percent of the non-event mixed-layer convective available potential energy distribution is <1350 J kgl, which in itself, provides a great deal of confidence when forecasting the non-event. Not unlike past studies, results reveal that in order for a microburst to occur in this type of environment, enough thermodynamic instability must first exist in order to produce a strong enough updraft to reach well into the dry layer.
1. Introduction
Fujita (1985) defines extreme convective wind events as microburst or macroburst based upon their horizontal dimensions (i.e., <4 km, microburst). For microbursts, the sub-classification as 'dry' or 'wet' depends on whether significant precipitation is present below cloud base. In the MIST (Microburst and Severe Thunderstorm) field project conducted in northern Alabama, Atkins and
61
Wakimoto (hereby AW 1991) showed that wet microbursts form in environments characterized by lowlevel moisture overlain by a mid-level dry layer (which was usually advected from the northwest).
A thorough literature review reveals very few wet microburst, pre-storm environmental studies. This is especially true for the U.S. Gulf Coast region. The majority of research has been focused in the areas of dry microburst, radar, and modeling research. Caracena and Maier (1987) examined a wet microburst producing storm in southern Florida and substantiated some of the thermodynamic characteristics noted by AW (1991). McCann (1994) addressed certain thermodynamic parameters that could be routinely operationally measured to estimate microburst gust potential using a wind index equation (WINDEX). For a thorough listing of past microburst-related research see Croft et al. (2004).
In the mid 1990s, Bradshaw and Weeks l specifically researched the characteristics of the wet microburst environment in Alabama. Based on the 0000 UTC Centreville, Alabama (CKL) sounding, they examined 152 June, July and August (JJA) wet microburst days. Key findings include wet microburst peak occurrence around 2100 UTC and formation in environments characterized by large surface-freezing level lapse rates (> 6.8°C km-l), steep 850-500 hPa lapse rates, and relatively moist conditions below the melting level (as evidenced by smaller dewpoint temperature depressions below the melting level). They also showed that the 700-500 hPa lapse rate offered little discriminatory potential between wet microburst event and non-event days.
Srivastava (1985) considered the processes that drive a microburst downdraft based on the physical environment. These processes are represented in Eq.1.
iW + w iW + .ulwlw = a & 1 2 3
I1Tv g-- gMr - gMc
Tve 4 5 6
(1)
In order, the terms in Eq. 1 are (1) vertical acceleration, (2) the contribution to vertical motion through vertical advection, (3) mixing\entrainment, (4) the contribu-
1 Comparative results obtained from Bradshaw and Weeks (1995) unpublished local study.

62
tion to downward vertical motion from negative buoyancy, (5) the contribution to negative buoyancy due to the weight of rainwater, and (6) the contribution to negative buoyancy due to the weight of cloud water. Futher, g is gravitational acceleration, w is vertical motion, t is time, z is height, J.L accounts for mixing, Tv and Tve,
respectively, represent the virtual temperature of the parcel and environment. Mr and Me, respectively, are the mixing ratios of rain and cloud water. The pressure perturbation term is absent because observations have shown that vertical pressure gradients do not contribute significantly to downdraft acceleration in weakly sheared environments. It should be mentioned that the omitted terms can potentially cause digressions between simplified conceptual models and real atmospheric processes.
It is important to understand the processes that drive a microburst downdraft and to also know which variables can be routinely operationally measured without in situ measurements. Term 2 (vertical advection) magnitude is very small, thus it vanishes. Term 3 (mixing and entrainment) is not very well understood and its omission is justified by an assumption that heat, water vapor, liquid water and momentum are well mixed. Terms 5 and 6 contain an unknown (i.e., requiring in situ measurements) mixture of both rain and cloud water, and are, therefore, ignored. After scaling and assumptions, Terms 1 and 4 remain and are equated in Eq. 2.
iW I1Tv -~g-a Tve (2)
Equation 2 states that vertical acceleration is a function of buoyancy. Upon further examination, negative buoyancy is contributed to via the processes of melting, evaporation and water loading. Srivastava (1985) showed that the process of evaporation is on a scale nearly an order of magnitude greater than melting. It should also be noted that the process of evaporation is very sensitive to droplet diameter.
In consideration of how a wet microburst downdraft may initially evolve in the weakly sheared Southeastern U.S. summertime environment, dry air would first theoretically entrain (Eq.1, Term 3) into the middle levels ofa developing cumulonimbus cloud. At some point, and due to a combination of melting, evaporational cooling, and the weight of rainwater (Eq.1, Terms 5 and 6), the updraft would then become negatively buoyant. Initially, higher cloud water, liquid water, and ice content near the level where the downdraft originates would then contribute to greater negative buoyancy. Small hail and graupel falling below the melting level would also act to provide additional negative buoyancy via the melting process. Below the melting level, the rate of descent is dictated by the ambient lapse rate and relative humidity. Thus, steep lapse rates must maintain the negative buoyan~y of the parcel in the face of decreasing evaporation rates.
Using afternoon soundings from Eglin Air Force Base, Florida (KVPS), this research investigated the regional thermodynamic structure of summertime wet microburst environments over southern Alabama and northwestern Florida. Mean soundings were generated to operational-
National Weather Digest
Gulf of Mexico
Fig. 1. Regional distribution of severe thunderstorm wind gusts for all 1998-2003 JJA days and location of KVPS sounding site (square). Note that some of the 17 event days were associated with more than one report.
ly distinguish between wet microburst event and nonevent days. A monthly JJA mean sounding composite was also constructed to illustrate the effects of summer season progression on the regional thermal and moisture vertical profiles. Within this manuscript, Section 2 describes data types, assumptions, and methodologies used to conduct this research. Section 3 presents a composite of monthly mean soundings, and discusses the evolution of the regional thermal and moisture profiles between June and August. Section 4 presents boundary layer moisture, various layer lapse rate, and thermodynamic instability data associated with event versus nonevent day mean soundings. Section 5 summarizes research results and provides a brief discussion on how these compare to those of similar past studies.
2. Data Types and Methods
a. Sounding data
A wet microburst event day was defined as any day that a severe thunderstorm wind gust ~25.7 m S-l or ~50 kt) occurred within 125 km radius of KVPS from 1700-0000 UTC. Reports were obtained from the National Oceanic and Atmospheric Administration (NOAA) Storm Data Publication (1998-2003). Figure 1 shows the spatial distribution of24 reports over south central Alabama and the northwestern Florida Panhandle associated with study event days.
The KVPS upper air site is located on the west side of Choctawhatchee Bay in the northwestern Florida Panhandle. The location is <10 km from the coastline. Rawinsonde soundings were released on an irregular basis by the U.S. Air Force, usually Monday through Friday and twice daily. Generally, release times were 1200-1400 UTC, and again from 1700-2100 UTC. This study examined those afternoon soundings determined to be in weak G;.003 S-l, 0-2.5 km) vertical wind shear (Klemp and Wilhelmson 1978; and Weisman and Klemp 1982).

~------------------------ - ----- --
Volume 30 December 2006
Monthly Sounding Distribution Jun-Jul-Aug (1998-2003)
80.---------------------------~--~
60
"'iii '0 40 +-----1; I-
20
o June July August
. Month
o Event IiITIl Non-Event
Fig.2. Monthly distribution of soundings for event days (17, solid) and non-event days (176, hatched).
Of a possible 270 JJA sounilings from 1998-2003, 193 were retained for examination. Seventy-seven were eliminated for the following reasons: release time outside of the 1700-2100 UTC time range (25); rainfall contamination (22); incomplete and/or missing data (14), 0-2.5 km vertical wind shear >.003 sec-! (8); no matching derived parameters from the NOAAINWS Storm Prediction Center (SPC) database (6); and being influenced by a tropical cyclone in close proximity (2). The data from each is based upon the mandatory and significant level data (incluiling the surface and 925 hPa) and were interpolated to the nearest 50 hPa. Of the 193 sounilings, 17 event
Table 1. Confidence interval estimates for the difference in means of event day versus non-event day thermodynamic parameters derived using the t-test. Dashes (-) indicate <95% confidence level.
Parameter
Lapse Rates (OC km') 0-1 km lapse rate 0-2 km lapse rate 0-3 km lapse rate 2-4 km lapse rate 3-6 km lapse rate 4-6 km lapse rate 6-8 km lapse rate 850-500 mb lapse rate 700-500 mb lapse rate sfc-freezing level lapse rate
Moisture
Confidence interval estimate for the difference in means
95 99 99
99
99
sfc-900 mb mean mixing ratio (g kg-')
CAPE (J kg-') MLCAPE MUCAPE SBCAPE
99 99 99
63
"
"
"
" . " , "
.. 1C '" Sloe MSL KNOTS
Fig. 3. Mean monthly Skew-T/Log-p sounding composite for June (red), July (blue), and August (green) based on all data for the period 1998-2003 (includes all event and non-event days) . Temperatures are solid and dewpoint temperatures are dashed.
and 176 non-event sounilings remained (see Fig. 2 for monthly distributions).
Mean sounilings and derived parameters were generated using the RAOB2 (2003) Program. It is worth mentioning that the five more populated coastal counties within the prescribed 125 km radius ofKVPS contributed the majority ofthe total reports (75.2%). This establishes that a population bias exists where accurate severe wind gust reporting is concerned and also points to the fact that wet microbursts may have occurred on some nonevent days over less populated areas.
b. Derived parameters
Derived thermodynamic parameters were obtained from the NWS SPC (see Table 1). These parameters were selected in order to test, and potentially validate, the terms in Eq. 1 with respect to the processes that drive a microburst downdraft. Convective available potential energy (CAPE) computations were performed using virtual equivalent potential temperature (Doswell and Rasmussen 1994) and include surface-based (SB), most unstable (MU), and mixed layer (ML) methods. By definition, SB represents a parcel lifted from the surface and MU is the most unstable parcel (i.e., highest virtual equivalent potential temperature over the lowest 300 hPa). ML uses the mean potential temperature and mixing ratio combination over the lowest 100 hPa. Using the t-test, confidence interval estimates for the difference in means between event and non-event day thermodynamic parameters are given in Table 1.
2 NOTE: Mention or display of a trademark, proprietary product, or firm in text or figures does not constitute an endorsement by the National Weather Service (NWS), NOAA, or the Department of Commerce, and does not imply approval to the exclusion of other suitable products or firms.
I'
I I I
64
., ...
." " '" 3! ., 'C Mst
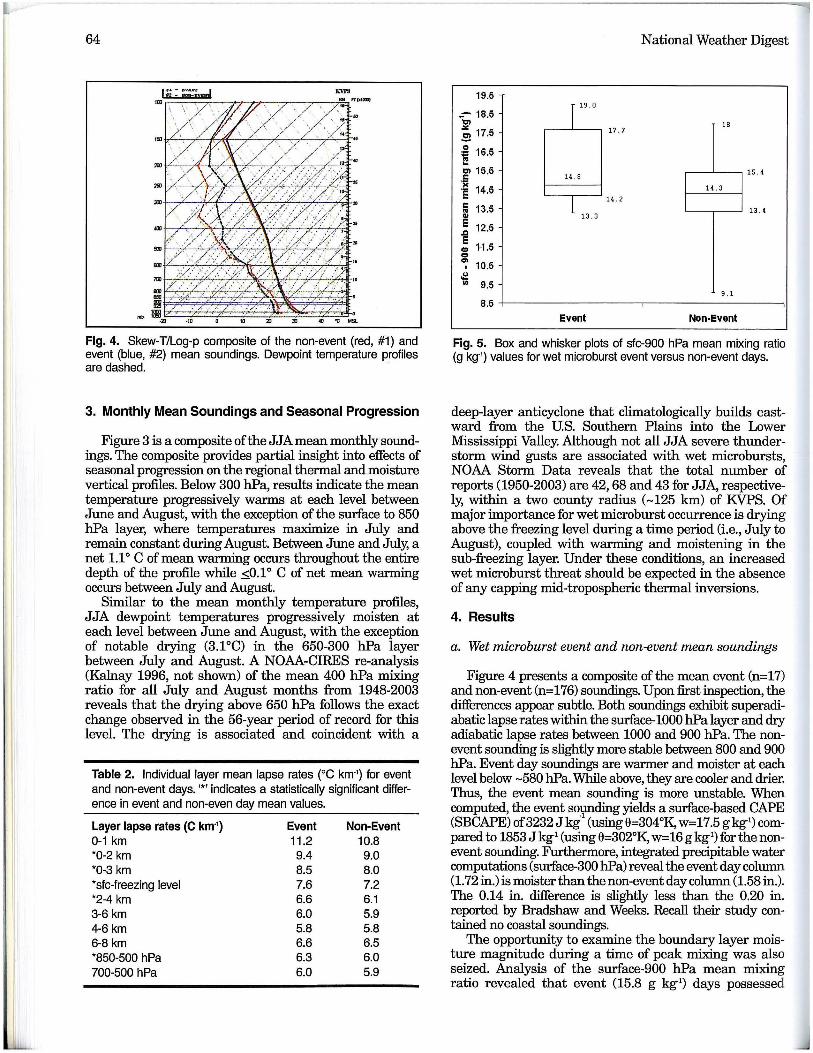
Fig. 4. Skew-T/Log-p composite of the non-event (red, #1) and event (blue, #2) mean soundings. Oewpoint temperature profiles are dashed.
3. Monthly Mean Soundings and Seasonal Progression
Figure 3 is a composite of the JJA mean monthly soundings. The composite provides partial insight into effects of seasonal progression on the regional thermal and moisture vertical profiles. Below 300 hPa, results indicate the mean temperature progressively warms at each level between June and August, with the exception of the surface to 850 hPa layer, where temperatures maximize in July and remain constant during August. Between June and July, a net 1.1° C of mean warming occurs throughout the entire depth of the profile while ~0.1 ° C of net mean warming occurs between July and August.
Similar to the mean monthly temperature profiles, JJA dewpoint temperatures progressively moisten at each level between June and August, with the exception of notable drying (3.1°C) in the 650-300 hPa layer between July and August. A NOAA-CIRES re-analysis (Kalnay 1996, not shown) of the mean 400 hPa mixing ratio for all July and August months from 1948-2003 reveals that the drying above 650 hPa follows the exact change observed in the 56-year period of record for this level. The drying is associated and coincident with a
Table 2. Individual layer mean lapse rates (Oe km') for event and non-event days. '*' indicates a statistically significant difference in event and non-even day mean values.
Layer lapse rates (C km") 0-1 km *0-2 km *0-3 km *sfc-freezing level *2-4 km 3-6 km 4-6 km 6-8 km *850-500 hPa 700-500 hPa
Event 11.2
9.4 8.5 7.6 6.6 6.0 5.8 6.6 6.3 6.0
Non-Event 10.8 9.0 8.0 7.2 6.1 5.9 5.8 6.5 6.0 5.9
National Weather Digest
19.5
~- 18.5 '1;1) .:.: S 17.5
r 19 . a
!8 17.7
0 16.5 i ... g> 15.5 'x '!!! 14.5 c: 13.5 ~ GI E 12.5 ~ e 1·1.5
15. 4 14 .8
I 14. 3
1 13. 3
14 . 2 I 13.4
e ... 10.5 .
oI:! .. 9.5 9. 1
8.5 Event Non-Event
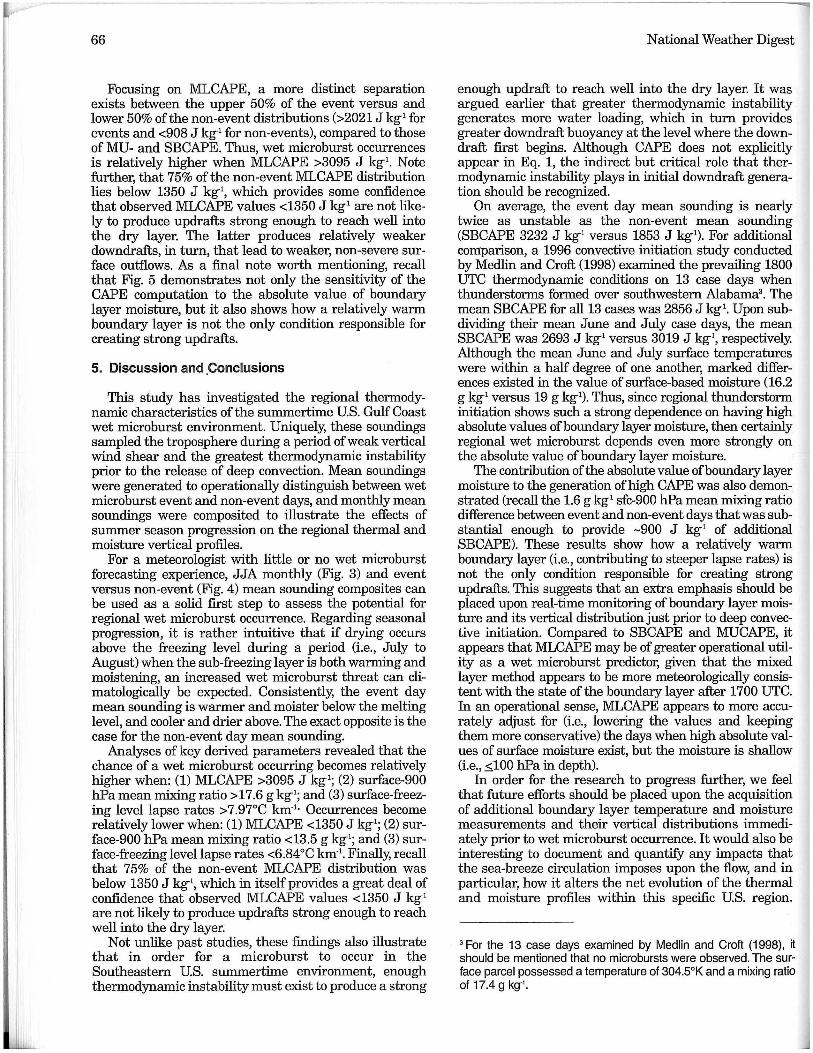
Fig. 5. Box and whisker plots of sfc-900 hPa mean mixing ratio (g kg") values for wet microburst event versus non-event days.
deep-layer anticyclone that climatologically builds eastward from the U.S. Southern Plains into the Lower Mississippi Valley. Although not all JJA severe thunderstorm wind gusts are associated with wet microbursts, NOAA Storm Data reveals that the total number of reports (1950-2003) are 42, 68 and 43 for JJA, respectively, within a two county radius (-125 km) of KVPS. Of major importance for wet microburst occurrence is drying above the freezing level during a time period (i.e., July to August), coupled with warming and moistening in the sub-freezing layer. Under these conditions, an increased wet microburst threat should be expected in the absence of any capping mid-tropospheric thermal inversions.
4. Results
a. Wet microburst event and non-event mean soundings
Figure 4 presents a composite of the mean event (n=17) and non-event (n=176) soundings. Upon first inspection, the differences appear subtle. Both soundings exhibit superadiabatic lapse rates within the surface-lOOO hPa layer and dIy adiabatic lapse rates between 1000 and 900 hPa. The nonevent sounding is slightly more stable between 800 and 900 hPa. Event day soundings are warmer and moister at each level below -580 hPa. While above, they are cooler and drier. Thus, the event mean sounding is more unstable. When computed, the event sounding yields a surface-based CAPE
.! (SBCAPE) of3232 J kg (using 8=304 oK, w=17.5 g kg!) com-pared to 1853 J kg! (using 8=302°K, w=16 g kg!) for the nonevent sounding. Furthermore, integrated precipitable water computations (surface-300 hPa) reveal the event day column (1.72 in.) is moister than the non-event day column (1.58 in.). The 0.14 in. difference is slightly less than the 0.20 in. reported by Bradshaw and Weeks. Recall their study contained no coastal soundings.
The opportunity to examine the boundary layer moisture magnitude during a time of peak mixing was also seized. Analysis of the surface-900 hPa mean mixing ratio revealed that event (15.8 g kg!) days possessed

Volume 30 December 2006
_ 9.5
~ 9
~ 8.5 II)
: 8 II)
So 7.5 .. = 7 ~ - 6.5 ~
.~ 6 $
oIj: 5.5 <>
7 . 98
7 . 75 ~8 ' 53
7.18
6 . 82
8.89
,---=-"-----,7 . 45
'--------.-_-' 6 . 83
5 . 42
'Iii 5 +--------------,----------1 Even! Non-Event
Fig. 6. Box and whisker plots of sfc-freezing level lapse rate (Oe km-') values for wet microburst event and non-event days.
higher absolute moisture values than non-event (14.2 g kg-I) days. The 1.6 g kgl difference is substantial enough to provide -900 J kgl of additional SBCAPE given a constant surface temperature of 304 OK (or 32.8°C). For additional comparison, McCann (1994) presented eight Southeast U.S. wet microburst cases, whose surface-900 hPa mean mixing ratio also averaged 15.8 g kgl_
Figure 5 is a "box and whiskers"plot of the surface-900 hPa mean mixing ratio distributions on wet microburst event and non-event days. Upon comparing the upper half (3rd and 4th quartiles) of the event distribution to the lower 50% of the non-event distribution (1st and 2nd quartiles), there exists a separation between the distribution halves (>14.7 g kgl for events and <14.4 g kgl for non-event). These data reveal that the chance of a wet microburst occurring is relative higher for values> 17.6 g kg\ and relatively lower for values <13.5 g kgl. These results show how having high absolute values of boundary layer moisture, as opposed to having solely a warm boundary layer, is not the only condition responsible for creating strong updrafts, as will later be shown.
b. Layer lapse rates
To assess various layer lapse rate contributions to the maintenance of negative buoyancy within the downdraft, the surface-l km, surface-2 km, surface-3 km, 2-4 km, 3-6 km, 4-6 km, 6-8 km, 850-500 hPa, 700-500 hPa, and surface-freezing level layer lapse rates were examined. Results are shown in Table 2. Overall, the mean lapse rate was greater on event days than non-event days for all layers except 4-6 km where they were equal. Differences in means are statistically significant at the 95% confidence level for the 0-2 km, 0-3 km, surfacefreezing level, 2-4 km, and the 850-500 hPa layers (Table nit should be mentioned-that those layers with statistically insignificant (i.e., <95% confidence leveD differences in their means contained data points above the freezing level as the upper limit in their computation. The data in Fig. 6 suggest that wet microburst occurrence depends on having steep lapse rates below the melting level.
Table 2 reveals that the mean event and non-event surface to freezing level lapse rates are 7.6°C km-I and
65
8000
7000 6991 6991
6000 5494 5494
-:- 5000 I:Il 4646 ~
::: 4000 w 3753 3614 3613
~ 3000 3365 3374
3096 2901 2901
2485 253
2000 2022
1349 1464 148
1000 1092 907
638 396
0 94 94
M.CAPE M.CAPE MJCAPE MJCAPE SBCAPE SBCAPE Event NonEvent Event Non Event Event Non Event
Fig. 7. Box and whisker plots of ML-, 8B-, and MUeAPE (J kg-') values for wet microburst event and non-event days.
7.2°C km-I, respectively. Similar to the event and non-event boundary layer mixing ratio distributions (Fig. 5), the lapse rate data in Fig. 6 also show a separation between the highest 50% of the event and lowest 50% of the non-event distributions. Apparently, the chance of a wet microburst becomes relatively higher for values >7 .97°C km-I, and relatively lower for values <6.84°C km-!. These results are similar to those of Bradshaw and Weeks who found that surface to freezing level lapse rates peaked in the 7.3-7.7°C km-! range on wet microburst event days (taken from proximity soundings that comprised a ten county group centered on CKL, n = 43 days), and that the phenomena becomes more likely when the lapse rate increased by ;:::,0.5°C km-I over the seasonal normal of 6.8°C km-!.
c. Instability
Although CAPE does not explicitly appear in Eq. 1, stronger updrafts supply greater amounts of ice and supercooled water droplets above the melting level when compared to their weaker updraft (i.e., lower CAPE) counterparts. The role that evaporation and water loading play in the generation of negative buoyancy was discussed in Section 1. The latter was verified during MIST when AW (1991) observed that the updrafts associated with wet microburst-producing thunderstorms were vertically deeper than those that did not produce microbursts, and that their precipitation cores were mainly composed of ice. Thus, it was considered important for this research to have explored the operational forecast utility of each CAPE type (i.e., MU-, :ML-, and SBCAPE).
Figure 7 is a "box and whiskers" plot comparing the MU-, :ML-, and SBCAPE distributions for wet microburst event and non-event days. Similar to the boundary layer moisture and layer lapse rate distributions, each CAPE type shows a separation between the upper two quartiles of the event and lower two quartiles of the non-event distributions. Also, note that the MUCAPE and SBCAPE values are nearly equal since the surface parcel is nearly always the most unstable parcel in this type of environment during this time of year (Medlin and Croft 1998).
I I I
t
I
I
I /.
I I I , I
66
Focusing on MLCAPE, a more distinct separation exists between the upper 50% of the event versus and lower 50% of the non-event distributions (>2021 J kgl for events and <908 J kgl for non-events), compared to those of MU- and SBCAPE. Thus, wet microburst occurrences is relatively higher when MLCAPE >3095 J kgl. Note further, that 75% of the non-event MLCAPE distribution lies below 1350 J kgl, which provides some confidence that observed MLCAPE values <1350 J kgl are not likely to produce updrafts strong enough to reach well into the dry layer. The latter produces relatively weaker downdrafts, in turn, that lead to weaker, non-severe surface outflows. As a final note worth mentioning, recall that Fig. 5 demonstrates not only the sensitivity of the CAPE computatjon to the absolute value of boundary layer moisture, but it also shows how a relatively warm boundary layer is not the only condition responsible for creating strong updrafts.
5. Discussion and .Conclusions
This study has investigated the regional thermodynamic characteristics of the summertime US. Gulf Coast wet microburst environment. Uniquely, these soundings sampled the troposphere during a period of weak vertical wind shear and the greatest thermodynamic instability prior to the release of deep convection. Mean soundings were generated to operationally distinguish between wet microburst event and non-event days, and monthly mean soundings were composited to illustrate the effects of summer season progression on the regional thermal and moisture vertical profiles.
For a meteorologist with little or no wet microburst forecasting experience, JJA monthly (Fig. 3) and event versus non-event (Fig. 4) mean sounding composites can be used as a solid first step to assess the potential for regional wet microburst occurrence. Regarding seasonal progression, it is rather intuitive that if drying occurs above the freezing level during a period (i.e., July to August) when the sub-freezing layer is both warming and moistening, an increased wet microburst threat can climatologically be expected. Consistently, the event day mean sounding is warmer and moister below the melting level, and cooler and drier above. The exact opposite is the case for the non-event day mean sounding.
Analyses of key derived parameters revealed that the chance of a wet microburst occurring becomes relatively higher when: (1) MLCAPE >3095 J kgl; (2) surface-900 hPa mean mixing ratio >17.6 g kgl; and (3) surface-freezing level lapse rates >7.97°C km-I. Occurrences become relatively lower when: (1) MLCAPE <1350 J kgl; (2) surface-900 hPa mean mixing ratio <13.5 g kgl; and (3) surface-freezing level lapse rates <6.84°C km-I. Finally, recall that 75% of the non-event MLCAPE distribution was below 1350 J kg\ which in itself provides a great deal of confidence that observed MLCAPE values <1350 J kgl are not likely to produce updrafts strong enough to reach well into the dry layer.
Not unlike past studies, these findings also illustrate that in order for a micro burst to occur in the Southeastern US. summertime environment, enough thermodynamic instability must exist to produce a strong
National Weather Digest
enough updraft to reach well into the dry layer. It was argued earlier that greater thermodynamic instability generates more water loading, which in turn provides greater downdraft buoyancy at the level where the downdraft first begins. Although CAPE does not explicitly appear in Eq. 1, the indirect but critical role that thermodynamic instability plays in initial downdraft generation should be recognized.
On average, the event day mean sounding is nearly twice as unstable as the non-event mean sounding (SBCAPE 3232 J kgl versus 1853 J kgl). For additional comparison, a 1996 convective initiation study conducted by Medlin and Croft (1998) examined the prevailing 1800 UTC thermodynamic conditions on 13 case days when thunderstorms formed over southwestern Alabama3
• The mean SBCAPE for all 13 cases was 2856 J kgl. Upon subdividing their mean June and July case days, the mean SBCAPE was 2693 J kgl versus 3019 J kg\ respectively. Although the mean June and July surface temperatures were within a half degree of one another, marked differences existed in the value of surface-based moisture (16.2 g kgl versus 19 g kgl). Thus, since regional thunderstorm initiation shows such a strong dependence on having high absolute values of boundary layer moisture, then certainly regional wet microburst depends even more strongly on the absolute value of boundary layer moisture.
The contribution of the absolute value of boundary layer moisture to the generation of high CAPE was also demonstrated (recall the 1.6 g kgl sfc-900 hPa mean mixing ratio difference between event and non-event days that was substantial enough to provide -900 J kgl of additional SBCAPE). These results show how a relatively warm boundary layer (i.e., contributing to steeper lapse rates) is not the only condition responsible for creating strong updrafts. This suggests that an extra emphasis should be placed upon real-time monitoring of boundary layer moisture and its vertical distribution just prior to deep convective initiation. Compared to SBCAPE and MUCAPE, it appears that MLCAPE may be of greater operational utility as a wet microburst predictor, given that the mixed layer method appears to be more meteorologically consistent with the state of the boundary layer after 1700 UTe. In an operational sense, MLCAPE appears to more accurately adjust for (i.e., lowering the values and keeping them more conservative) the days when high absolute values of surface moisture exist, but the moisture is shallow (i.e., ~100 hPa in depth).
In order for the research to progress further, we feel that future efforts should be placed upon the acquisition of additional boundary layer temperature and moisture measurements and their vertical distributions immediately prior to wet microburst occurrence. It would also be interesting to document and quantify any impacts that the sea-breeze circulation imposes upon the flow, and in particular, how it alters the net evolution of the thermal and moisture profiles within this specific US. region.
3 For the 13 case days examined by Medlin and Croft (1998). it should be mentioned that no microbursts were observed. The surface parcel possessed a temperature of 304.5°K and a mixing ratio of 17.4 g kg-'.
l
Volume 30 December 2006
More observations are also needed to correlate the location of elevated high radar reflectivity (>55 dBz) cores to the processes of evaporation, melting and water loading, and to better understand the role of mixed-phase precipitation in driving a microburst downdraft. Finally, verification of the wet microburst phenomena must improve. Recent experience has shown that many wet microburst events go undetected. Verification would tremendously improve if the following suggestions were acted upon:
• Each future mesonet site be equipped with the ability to record a 24 h maximum wind gust and the exact time of occurrence.
• Single-Doppler velocity data were used as verification. This would include a more aggressive documentation of near-surface divergence signatures and their peak radial velocity values.
• Radar reflectivity data were used to document the magnitude of a radar reflectivity core and the height to which it was elevated. In turn, these could be correlated to wind gust magnitude at the surface.
Acknowledgments
It is a pleasure to aclmowledge the contributions of several individuals without whose efforts this research would not have been possible. Regarding the collection of data, the authors would like to thank the NOAAlNational Weather Service (NWS) Weather Forecast Office (WFO) Mobile, Alabama staff along with Ryan Decker (University of Alabama-Huntsville) and Rhonda Smart (Jackson State University). Denisha Dean (University of South Alabama, USA) assisted with the generation of the upper air sounding data base. We also wish to thank John Hart (SPC) for providing the derived data in a spreadsheet format. A special thanks is also extended to Dr. Paul Croft (Kean University) and Dr. Sytske Kimball (USA) for providing their in-depth reviews ofthis manuscript. Finally, we aclmowledge the reviewers for providing numerous insightful comments and suggestions that have greatly improved this manuscript.
Authors
Jeffrey Mark Medlin is currently the Science and Operations Officer of the WFO in Mobile, Alabama. Since
. 1986 and while employed by the NWS, he has worked at the Warning Decision Training Branch in Norman, Oklahoma, and in the following NWS Offices: Charleston, West Virginia; Cincinnati, Ohio; and Columbia, South Carolina. Jeffrey's main research interests lie in the areas of thunderstorm structure, dynamics, satellite and radar meteorology, the operational uses of isentropic analysis, and a host of other mesoscale phenomena. Jeffrey earned a B.S. in Meteorology from North Carolina State University in 1988 and a M.S. in Atmospheric Science from the University of Alabama in Huntsville in 2001.
Jack Cullen is currently a Meteorologist Intern at the WFO in Mobile. Jack began his career at WFO Mobile, Alabama after graduating with a B.S. in Meteorology from USA in 2004. His main research interests include radar warning meteorology and severe thunderstorm forecasting.
67
References
Atkins, N. T., and R. M. Wakimoto, 1991: Wet microburst activity over the Southeastern United States: Implications for forecasting .. Wea. Forecasting, 6, 470-482.
Caracena F., and M. W. Maier, 1987: Analysis of a microburst in the FACE meteorological mesonetwork in Southern Florida. Mon. Wea. Rev., 115, pp. 969-985.
Croft, P. J ., P. Pyle and S. Blair, 2004: Preliminary Investigation 'Of Observed Microburst Characteristics and Forecast Methods. [Technical report available from Department of Geosciences, Hanna Hall, RM 314, University of Louisiana - Monroe, Monroe, LA 71209J.
Doswell, C.A., III, and E. N. Rasmussen, 1994: The effect of neglecting the virtual temperature correction on CAPE calculations. Wea. Forecasting, 9, 625-629.
Environmental Research Services, 2003: RAOB. The Complete Rawinsonde Observation Program. [Available online at http://www.raob.comJ.
Fujita, T. T., 1985: The Downburst: Microburst and Macroburst. The University of Chicago Press, 122 pp.
Kalnay, E., 1996: The NCEP/NCAR Reanalysis 40-year Project. Bull. Amer. Meteor. Soc., 77, 437-471.
Klemp, J. B., and R. B. Wilhelmson, 1978: The simulation of three-dimensional convective storm dynamics. J. Atmos. Sci., 35, 1070-1096.
Medlin, J. M., and P. J. Croft, 1998: A preliminary investigation of weak shear summertime convective initiation for extreme Southwest Alabama. Wea. Forecasting, 13, 717-728.
McCann, Donald W. 1994: WINDEX-A new index for forecasting microburst potential. Wea. Forecasting, 9, pp. 532-541.
NCDC, 1998: Storm Data. Vol. 40, [Available from NOAAlNational Climatic Data Center, 151 Patton Avenue, Asheville, NC 28801-5001.]
__ , 1999: Storm Data, Vol. 41.
__ , 2000: Storm Data, Vol. 42.
__ , 2001: Storm Data, Vol. 43.
__ , 2002: Storm Data, Vol. 44.
__ , 2003: Storm Data, Vol. 45.
Srivastava, R. C., 1985: A simple model of evaporatively driven downdraft: Application to microburst downdraft. J. Atmos. Sci., 42, No. 10, pp.1004-1023.
Weisman, M. L., and J . B. Klemp, 1982: The dependence of numerically simulated convective storms on vertical wind shear and buoyancy. Mon. Wea. Rev., 114,504-520.
I I