a theoretically based index of ... - postlab :: home · consciousness a theoretically based index...
TRANSCRIPT
DOI: 10.1126/scitranslmed.3006294, 198ra105 (2013);5 Sci Transl Med
et al.Adenauer G. CasaliProcessing and BehaviorA Theoretically Based Index of Consciousness Independent of Sensory
Editor's Summary
a prerequisite for deployment in the clinic.robust measure that distinguishes conscious from unconscious states well enough to be used on an individual basis,
appears to be aet al.of being derived from a simple noninvasive measurement. The new index reported by Casali The validity of PCI for clinical application will need to be assessed in prospective trials, but it has the advantage
conscious state showing intermediate values (0.32 to 0.49).unconscious (0.19 to 0.31), the two with locked-in syndrome clearly aware (0.51 to 0.62), and those in a minimally patients clearly reflected the state of their consciousness, with the six patients in a vegetative state clearlyin a vegetative state or minimally conscious state, or exhibited locked-in syndrome. The PCI values from these from stroke or trauma. Here, too, the authors found promising results in those who had emerged from coma but wereconventional assessment methods? In these people, consciousness varies widely, as does the underlying damage
However, what about patients who suffer brain damage and who exhibit various levels of consciousness by
0.31.''unconscious'' values for the PCI: midazolam deep sedation, 0.23 to 0.31; propofol, 0.13 to 0.30; and xenon, 0.12 topatients given various amounts of the anesthetics midazolam, xenon, and propofol. These agents too caused low completely different way of inducing unconsciousness had the same effect on PCI, the authors assessed data fromawake healthy people, but fell to 0.18 to 0.28 during nonrapid eye movement (NREM) sleep. Then, to see whether a comparing the unique information in each, the authors derived PCI values. The values ranged from 0.44 to 0.67 in 32brains with transcranial magnetic stimulation. By calculating the likely brain regional sources of the signals and then
The authors used data already collected from previous experiments, in which they had stimulated people's
brain's response to a magnetic stimulus. The PCI could allow tracking of consciousness in individual patients.index of human consciousness [the perturbational complexity index (PCI)] that reflects the information content of theextended their previous work on electrical correlates of consciousness to define an electroencephalographic-derived
haveet al.have locked-in syndrome (in which they are aware but cannot respond) are unconscious. Here, Casali provide reliable reactions, and a more precise index is needed to avoid, for example, the conclusion that people whocrudest of tools to detect when a person is not aware. The usual question or physical stimulus does not always
but physicians have only the−−think anesthesia−−Manipulation of consciousness is an everyday medical trick
Quantifying the Unquantifiable
is a registered trademark of AAAS. Science Translational Medicinerights reserved. The title NW, Washington, DC 20005. Copyright 2013 by the American Association for the Advancement of Science; alllast week in December, by the American Association for the Advancement of Science, 1200 New York Avenue
(print ISSN 1946-6234; online ISSN 1946-6242) is published weekly, except theScience Translational Medicine
on
Aug
ust 1
6, 2
013
stm
.sci
ence
mag
.org
Dow
nloa
ded
from

http://stm.sciencemag.org/content/5/198/198ra105.full.htmlcan be found at:
and other services, including high-resolution figures,A complete electronic version of this article
http://stm.sciencemag.org/content/suppl/2013/08/12/5.198.198ra105.DC1.html can be found in the online version of this article at: Supplementary Material
http://stm.sciencemag.org/content/scitransmed/2/19/19ra13.full.html http://stm.sciencemag.org/content/scitransmed/3/110/110ec190.full.html
http://stm.sciencemag.org/content/scitransmed/4/122/122ec31.full.html http://stm.sciencemag.org/content/scitransmed/4/131/131ec72.full.html
can be found online at:Related Resources for this article
http://www.sciencemag.org/about/permissions.dtl in whole or in part can be found at: article
permission to reproduce this of this article or about obtaining reprintsInformation about obtaining
is a registered trademark of AAAS. Science Translational Medicinerights reserved. The title NW, Washington, DC 20005. Copyright 2013 by the American Association for the Advancement of Science; alllast week in December, by the American Association for the Advancement of Science, 1200 New York Avenue
(print ISSN 1946-6234; online ISSN 1946-6242) is published weekly, except theScience Translational Medicine
on
Aug
ust 1
6, 2
013
stm
.sci
ence
mag
.org
Dow
nloa
ded
from

R E S EARCH ART I C L E
CONSC IOUSNESS
A Theoretically Based Index of ConsciousnessIndependent of Sensory Processing and BehaviorAdenauer G. Casali,1*† Olivia Gosseries,2* Mario Rosanova,1 Mélanie Boly,2‡
Simone Sarasso,1 Karina R. Casali,1,3 Silvia Casarotto,1 Marie-Aurélie Bruno,2
Steven Laureys,2 Giulio Tononi,4 Marcello Massimini1,5§
Aug
ust 1
6, 2
013
One challenging aspect of the clinical assessment of brain-injured, unresponsive patients is the lack of an objectivemeasure of consciousness that is independent of the subject’s ability to interact with the external environment.Theoretical considerations suggest that consciousness depends on the brain’s ability to support complex activitypatterns that are, at once, distributed among interacting cortical areas (integrated) and differentiated in space andtime (information-rich). We introduce and test a theory-driven index of the level of consciousness called the per-turbational complexity index (PCI). PCI is calculated by (i) perturbing the cortex with transcranial magnetic stimu-lation (TMS) to engage distributed interactions in the brain (integration) and (ii) compressing the spatiotemporalpattern of these electrocortical responses to measure their algorithmic complexity (information). We test PCI on alarge data set of TMS-evoked potentials recorded in healthy subjects during wakefulness, dreaming, nonrapid eyemovement sleep, and different levels of sedation induced by anesthetic agents (midazolam, xenon, and propofol),as well as in patients who had emerged from coma (vegetative state, minimally conscious state, and locked-in syn-drome). PCI reliably discriminated the level of consciousness in single individuals during wakefulness, sleep, andanesthesia, as well as in patients who had emerged from coma and recovered a minimal level of consciousness. PCIcan potentially be used for objective determination of the level of consciousness at the bedside.
on
rg
stm.s
cien
cem
ag.o
Dow
nloa
ded
from
INTRODUCTION
A fundamental shortcoming of clinical practice is the lack of a reliablemethod to objectively assess the level of consciousness. Currently,the clinical evaluation of consciousness relies on the patient’s ability tointeract with the surrounding environment and to demonstrate his orher subjective experience. Under some conditions, however, such as duringsurgical anesthesia or after severe brain injury, patients may be con-scious but disconnected from the external environment because theirsensory, motor, or executive functions are impaired (1–3). Under thesecircumstances, an individual’s level of consciousness cannot be assessed.Here, we develop an index that aims to overcome this problem.
Phenomenologically, each conscious experience is both differentiated(that is, it has many specific features that distinguish it from a largerepertoire of other experiences) and integrated (that is, it cannot bedivided into discrete, independent components). Neurophysiologically,these fundamental properties of subjective experience rely on the abilityof multiple, functionally specialized areas of the thalamocortical systemto interact rapidly and effectively to form an integrated whole (4–7).Hence, an emerging idea in theoretical neuroscience is that conscious-ness requires an optimal balance between functional integration andfunctional differentiation in thalamocortical networks, otherwise defined
1Department of Biomedical and Clinical Sciences ‘Luigi Sacco’, University of Milan, 20157Milan, Italy. 2Coma Science Group, Cyclotron Research Centre and Neurology Department,University and University Hospital of Liège, 4000 Liège, Belgium. 3Institute of Science andTechnology, Federal University of São Paulo, 12231-280 São José dos Campos, Brazil.4Department of Psychiatry, University of Wisconsin, Madison, WI 53719, USA. 5Istituto DiRicovero e Cura a Carattere Scientifico, Fondazione Don Carlo Gnocchi, 20148 Milan, Italy.*These authors contributed equally to this work.†Present address: Faculty of Medicine Clinics Hospital, University of São Paulo, 05403-000São Paulo, Brazil.‡Present address: Department of Psychiatry, University of Wisconsin, Madison, WI53719, USA.§Corresponding author. E-mail: [email protected]
www.Scienc
as brain complexity (8–11). This complexity should be high when con-sciousness is present and low whenever consciousness is lost in sleep,anesthesia, or coma (10, 12, 13).
Theoretical indices based on this principle have been designedto assess the joint presence of differentiation and integration in neu-ral systems (14–16). These metrics are only applicable, however, tosimple systems of simulated elements or under highly restrictive as-sumptions and have not been tested on human brains. Currently usedempirical indices of consciousness, instead, are based either on inte-gration alone [as judged by the extent or synchronization of corticalactivation (17, 18)] or on differentiation alone [as judged by entropyor spectral content (19, 20)], and do not reliably assess conscious-ness in individual patients or across many different conditions. In arecent series of experiments, we assessed the electroencephalographic(EEG) response to transcranial magnetic stimulation (TMS) duringphysiological (21, 22), pharmacological (23), and pathological (24)loss of consciousness. We found that, compared to responses of con-scious, wakeful individuals, brain responses of people who had lostconsciousness became either local (suggesting a loss of integration)or global but stereotypical (suggesting a loss of differentiation). Never-theless, these studies did not allow us to quantify brain complexity acrosssubjects and conditions, a requirement for a reliable, unified measure-ment scale.
Here, we introduce an empirical measure of brain complexity, theperturbational complexity index (PCI), which gauges the amount of in-formation contained in the integrated response of the thalamocorticalsystem to a direct perturbation. We test PCI on a large data set of TMS-evoked potentials recorded from healthy subjects during wakefulness,dreaming, nonrapid eye movement (NREM) sleep, and different levelsof sedation induced by different anesthetic agents (midazolam, xenon,and propofol), as well as from brain-injured patients who had emergedfrom coma (overall, 208 sessions in 52 subjects).
eTranslationalMedicine.org 14 August 2013 Vol 5 Issue 198 198ra105 1
R E S EARCH ART I C L E
RESULTS
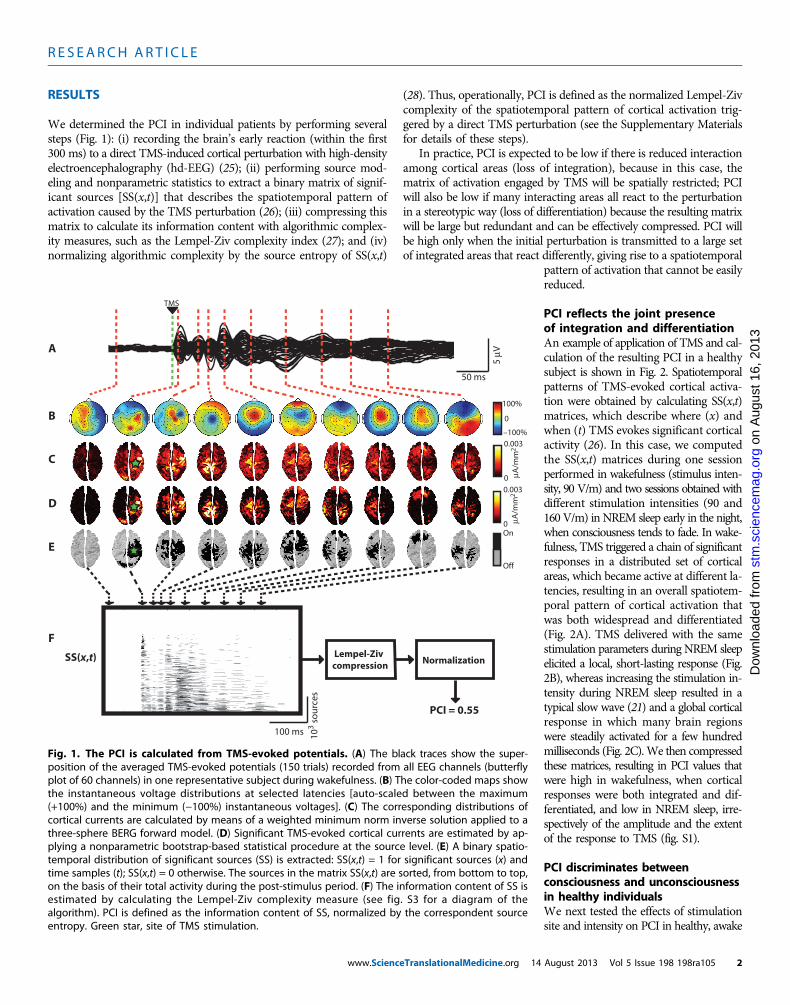
We determined the PCI in individual patients by performing severalsteps (Fig. 1): (i) recording the brain’s early reaction (within the first300 ms) to a direct TMS-induced cortical perturbation with high-densityelectroencephalography (hd-EEG) (25); (ii) performing source mod-eling and nonparametric statistics to extract a binary matrix of signif-icant sources [SS(x,t)] that describes the spatiotemporal pattern ofactivation caused by the TMS perturbation (26); (iii) compressing thismatrix to calculate its information content with algorithmic complex-ity measures, such as the Lempel-Ziv complexity index (27); and (iv)normalizing algorithmic complexity by the source entropy of SS(x,t)
www.Scienc
(28). Thus, operationally, PCI is defined as the normalized Lempel-Zivcomplexity of the spatiotemporal pattern of cortical activation trig-gered by a direct TMS perturbation (see the Supplementary Materialsfor details of these steps).
In practice, PCI is expected to be low if there is reduced interactionamong cortical areas (loss of integration), because in this case, thematrix of activation engaged by TMS will be spatially restricted; PCIwill also be low if many interacting areas all react to the perturbationin a stereotypic way (loss of differentiation) because the resulting matrixwill be large but redundant and can be effectively compressed. PCI willbe high only when the initial perturbation is transmitted to a large setof integrated areas that react differently, giving rise to a spatiotemporal
eTranslationalMedicine.org 14
on
Aug
ust 1
6, 2
013
stm
.sci
ence
mag
.org
Dow
nloa
ded
from
pattern of activation that cannot be easilyreduced.
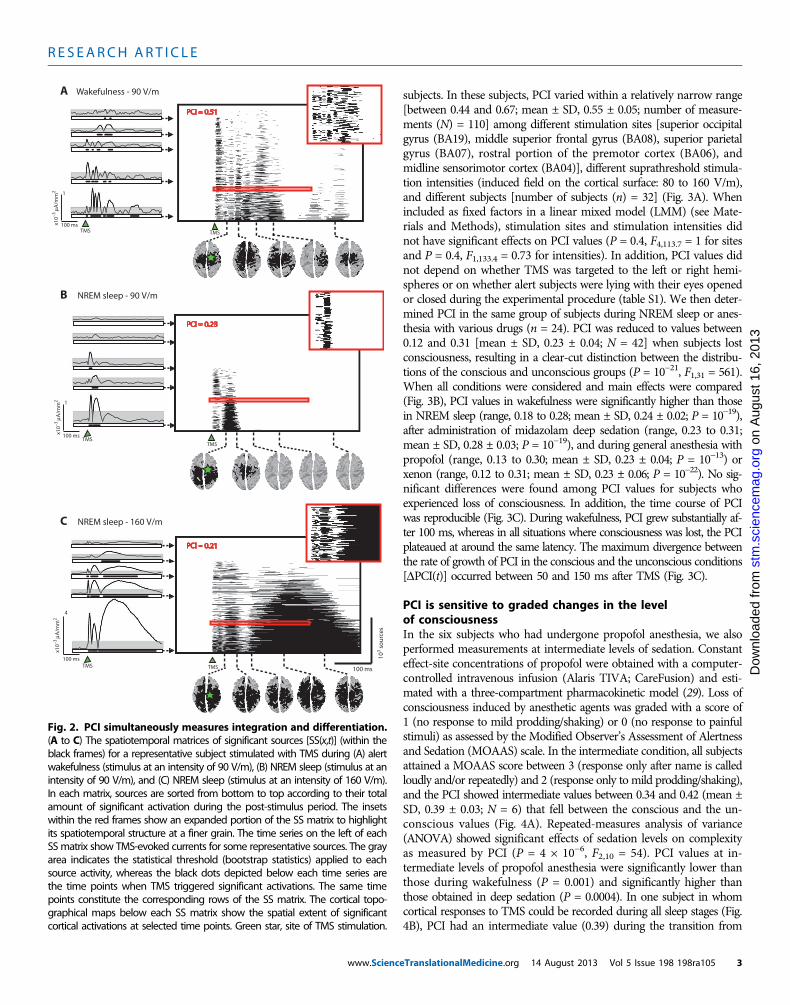
PCI reflects the joint presenceof integration and differentiationAn example of application of TMS and cal-culation of the resulting PCI in a healthysubject is shown in Fig. 2. Spatiotemporalpatterns of TMS-evoked cortical activa-tion were obtained by calculating SS(x,t)matrices, which describe where (x) andwhen (t) TMS evokes significant corticalactivity (26). In this case, we computedthe SS(x,t) matrices during one sessionperformed in wakefulness (stimulus inten-sity, 90 V/m) and two sessions obtained withdifferent stimulation intensities (90 and160 V/m) in NREM sleep early in the night,when consciousness tends to fade. In wake-fulness, TMS triggered a chain of significantresponses in a distributed set of corticalareas, which became active at different la-tencies, resulting in an overall spatiotem-poral pattern of cortical activation thatwas both widespread and differentiated(Fig. 2A). TMS delivered with the samestimulation parameters during NREM sleepelicited a local, short-lasting response (Fig.2B), whereas increasing the stimulation in-tensity during NREM sleep resulted in atypical slow wave (21) and a global corticalresponse in which many brain regionswere steadily activated for a few hundredmilliseconds (Fig. 2C).We then compressedthese matrices, resulting in PCI values thatwere high in wakefulness, when corticalresponses were both integrated and dif-ferentiated, and low in NREM sleep, irre-spectively of the amplitude and the extentof the response to TMS (fig. S1).
PCI discriminates betweenconsciousness and unconsciousnessin healthy individualsWe next tested the effects of stimulationsite and intensity on PCI in healthy, awake
A
B
C
D
E
5 µV
50 ms
103 s
ou
rces
100 ms
SS(x,t)
µ A/m
m2
100%
0
–100%
On
Off
0.003
0
TMS
F Lempel-Zivcompression Normalization
PCI = 0.55
µA/m
m2
0
0.003
Fig. 1. The PCI is calculated from TMS-evoked potentials. (A) The black traces show the super-position of the averaged TMS-evoked potentials (150 trials) recorded from all EEG channels (butterfly
plot of 60 channels) in one representative subject during wakefulness. (B) The color-coded maps showthe instantaneous voltage distributions at selected latencies [auto-scaled between the maximum(+100%) and the minimum (−100%) instantaneous voltages]. (C) The corresponding distributions ofcortical currents are calculated by means of a weighted minimum norm inverse solution applied to athree-sphere BERG forward model. (D) Significant TMS-evoked cortical currents are estimated by ap-plying a nonparametric bootstrap-based statistical procedure at the source level. (E) A binary spatio-temporal distribution of significant sources (SS) is extracted: SS(x,t) = 1 for significant sources (x) andtime samples (t); SS(x,t) = 0 otherwise. The sources in the matrix SS(x,t) are sorted, from bottom to top,on the basis of their total activity during the post-stimulus period. (F) The information content of SS isestimated by calculating the Lempel-Ziv complexity measure (see fig. S3 for a diagram of thealgorithm). PCI is defined as the information content of SS, normalized by the correspondent sourceentropy. Green star, site of TMS stimulation.August 2013 Vol 5 Issue 198 198ra105 2
R E S EARCH ART I C L E
www.Scienc
on
Aug
ust 1
6, 2
013
stm
.sci
ence
mag
.org
Dow
nloa
ded
from
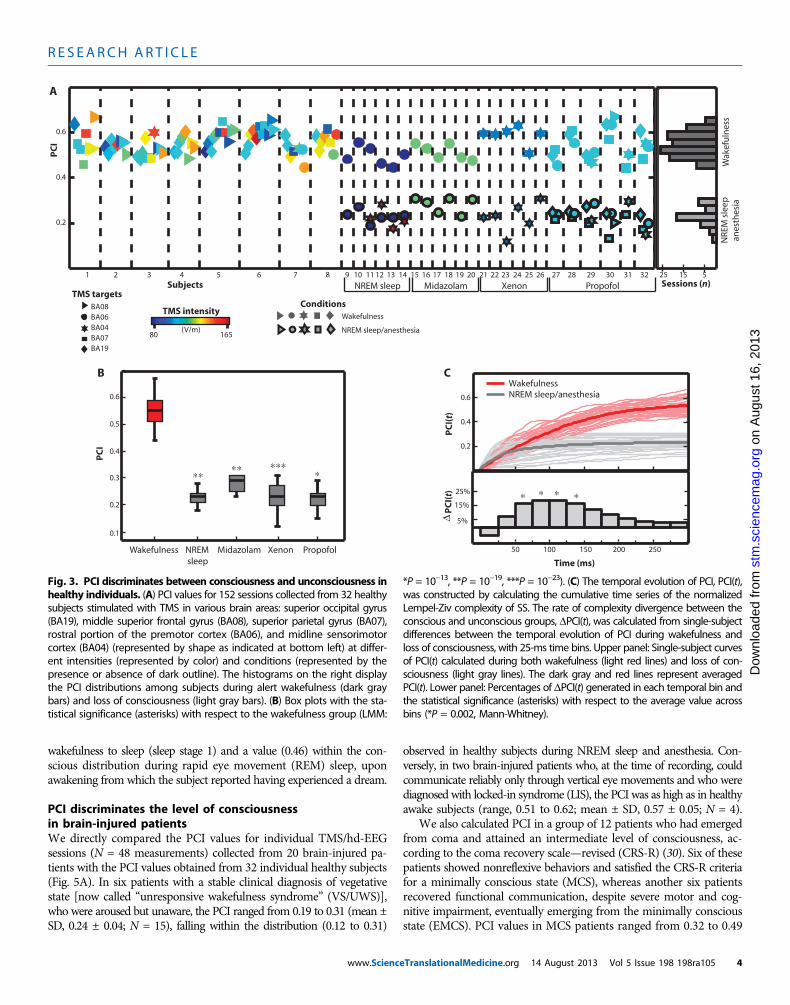
subjects. In these subjects, PCI varied within a relatively narrow range[between 0.44 and 0.67; mean ± SD, 0.55 ± 0.05; number of measure-ments (N) = 110] among different stimulation sites [superior occipitalgyrus (BA19), middle superior frontal gyrus (BA08), superior parietalgyrus (BA07), rostral portion of the premotor cortex (BA06), andmidline sensorimotor cortex (BA04)], different suprathreshold stimula-tion intensities (induced field on the cortical surface: 80 to 160 V/m),and different subjects [number of subjects (n) = 32] (Fig. 3A). Whenincluded as fixed factors in a linear mixed model (LMM) (see Mate-rials and Methods), stimulation sites and stimulation intensities didnot have significant effects on PCI values (P = 0.4, F4,113.7 = 1 for sitesand P = 0.4, F1,133.4 = 0.73 for intensities). In addition, PCI values didnot depend on whether TMS was targeted to the left or right hemi-spheres or on whether alert subjects were lying with their eyes openedor closed during the experimental procedure (table S1). We then deter-mined PCI in the same group of subjects during NREM sleep or anes-thesia with various drugs (n = 24). PCI was reduced to values between0.12 and 0.31 [mean ± SD, 0.23 ± 0.04; N = 42] when subjects lostconsciousness, resulting in a clear-cut distinction between the distribu-tions of the conscious and unconscious groups (P = 10−21, F1,31 = 561).When all conditions were considered and main effects were compared(Fig. 3B), PCI values in wakefulness were significantly higher than thosein NREM sleep (range, 0.18 to 0.28; mean ± SD, 0.24 ± 0.02; P = 10−19),after administration of midazolam deep sedation (range, 0.23 to 0.31;mean ± SD, 0.28 ± 0.03; P = 10−19), and during general anesthesia withpropofol (range, 0.13 to 0.30; mean ± SD, 0.23 ± 0.04; P = 10−13) orxenon (range, 0.12 to 0.31; mean ± SD, 0.23 ± 0.06; P = 10−22). No sig-nificant differences were found among PCI values for subjects whoexperienced loss of consciousness. In addition, the time course of PCIwas reproducible (Fig. 3C). During wakefulness, PCI grew substantially af-ter 100 ms, whereas in all situations where consciousness was lost, the PCIplateaued at around the same latency. The maximum divergence betweenthe rate of growth of PCI in the conscious and the unconscious conditions[DPCI(t)] occurred between 50 and 150 ms after TMS (Fig. 3C).
PCI is sensitive to graded changes in the levelof consciousnessIn the six subjects who had undergone propofol anesthesia, we alsoperformed measurements at intermediate levels of sedation. Constanteffect-site concentrations of propofol were obtained with a computer-controlled intravenous infusion (Alaris TIVA; CareFusion) and esti-mated with a three-compartment pharmacokinetic model (29). Loss ofconsciousness induced by anesthetic agents was graded with a score of1 (no response to mild prodding/shaking) or 0 (no response to painfulstimuli) as assessed by the Modified Observer’s Assessment of Alertnessand Sedation (MOAAS) scale. In the intermediate condition, all subjectsattained a MOAAS score between 3 (response only after name is calledloudly and/or repeatedly) and 2 (response only to mild prodding/shaking),and the PCI showed intermediate values between 0.34 and 0.42 (mean ±SD, 0.39 ± 0.03; N = 6) that fell between the conscious and the un-conscious values (Fig. 4A). Repeated-measures analysis of variance(ANOVA) showed significant effects of sedation levels on complexityas measured by PCI (P = 4 × 10⁻⁶, F2,10 = 54). PCI values at in-termediate levels of propofol anesthesia were significantly lower thanthose during wakefulness (P = 0.001) and significantly higher thanthose obtained in deep sedation (P = 0.0004). In one subject in whomcortical responses to TMS could be recorded during all sleep stages (Fig.4B), PCI had an intermediate value (0.39) during the transition from
x10–3
µA/m
m2
100 ms
103 s
ou
rces
TMS
A
B
C
PCI = 0.51
PCI = 0.21
PCI = 0.23
100 ms
TMS
TMS
x10–3
µA/m
m2
100 ms
4
1
x10–3
µA/m
m2
100 ms
1
TMS
TMSTMS
Wakefulness - 90 V/m
NREM sleep - 90 V/m
NREM sleep - 160 V/m
Fig. 2. PCI simultaneously measures integration and differentiation.(A to C) The spatiotemporal matrices of significant sources [SS(x,t)] (within the
black frames) for a representative subject stimulated with TMS during (A) alertwakefulness (stimulus at an intensity of 90 V/m), (B) NREM sleep (stimulus at anintensity of 90 V/m), and (C) NREM sleep (stimulus at an intensity of 160 V/m).In each matrix, sources are sorted from bottom to top according to their totalamount of significant activation during the post-stimulus period. The insetswithin the red frames show an expanded portion of the SS matrix to highlightits spatiotemporal structure at a finer grain. The time series on the left of eachSSmatrix show TMS-evoked currents for some representative sources. The grayarea indicates the statistical threshold (bootstrap statistics) applied to eachsource activity, whereas the black dots depicted below each time series arethe time points when TMS triggered significant activations. The same timepoints constitute the corresponding rows of the SS matrix. The cortical topo-graphical maps below each SS matrix show the spatial extent of significantcortical activations at selected time points. Green star, site of TMS stimulation.eTranslationalMedicine.org 14 August 2013 Vol 5 Issue 198 198ra105 3
R E S EARCH ART I C L E
on
Aug
ust 1
6, 2
013
stm
.sci
ence
mag
.org
Dow
nloa
ded
from
wakefulness to sleep (sleep stage 1) and a value (0.46) within the con-scious distribution during rapid eye movement (REM) sleep, uponawakening from which the subject reported having experienced a dream.PCI discriminates the level of consciousnessin brain-injured patientsWe directly compared the PCI values for individual TMS/hd-EEGsessions (N = 48 measurements) collected from 20 brain-injured pa-tients with the PCI values obtained from 32 individual healthy subjects(Fig. 5A). In six patients with a stable clinical diagnosis of vegetativestate [now called “unresponsive wakefulness syndrome” (VS/UWS)],who were aroused but unaware, the PCI ranged from 0.19 to 0.31 (mean ±SD, 0.24 ± 0.04; N = 15), falling within the distribution (0.12 to 0.31)
www.Scienc
observed in healthy subjects during NREM sleep and anesthesia. Con-versely, in two brain-injured patients who, at the time of recording, couldcommunicate reliably only through vertical eye movements and who werediagnosed with locked-in syndrome (LIS), the PCI was as high as in healthyawake subjects (range, 0.51 to 0.62; mean ± SD, 0.57 ± 0.05; N = 4).
We also calculated PCI in a group of 12 patients who had emergedfrom coma and attained an intermediate level of consciousness, ac-cording to the coma recovery scale—revised (CRS-R) (30). Six of thesepatients showed nonreflexive behaviors and satisfied the CRS-R criteriafor a minimally conscious state (MCS), whereas another six patientsrecovered functional communication, despite severe motor and cog-nitive impairment, eventually emerging from the minimally consciousstate (EMCS). PCI values in MCS patients ranged from 0.32 to 0.49
NREM sleep Midazolam
Wak
efu
lnes
sN
REM
sle
ep a
nes
thes
ia
A
B
TMS targets
80 165
TMS intensity
Subjects
(V/m)
Xenon Propofol
Wakefulness
ConditionsBA08BA06BA04BA07BA19
PC
I
PC
I(t)
Time (ms)
C
PC
I(t)
∆
0.4
0.6
0.2
WakefulnessNREM sleep/anesthesia
Sessions (n)1 2 3 4 5 6 7 8 9 10 11 12 13 14 15 16 17 18 19 20
0.4
0.6
21 22 23 24 25 26 27 28 29 30 31 32
0.2
50 100 150 200 250
5%
25%
15%
15 525
NREM sleep
Midazolam Xenon PropofolWakefulness
PC
I
0.3
0.1
0.5
0.6
0.4
0.2
∗∗
NREM sleep/anesthesia
∗∗
∗ ∗ ∗ ∗
∗ ∗∗∗
Fig. 3. PCI discriminates between consciousness and unconsciousness inhealthy individuals. (A) PCI values for 152 sessions collected from 32 healthy
*P = 10−13, **P = 10−19, ***P = 10−23). (C) The temporal evolution of PCI, PCI(t),was constructed by calculating the cumulative time series of the normalized
subjects stimulated with TMS in various brain areas: superior occipital gyrus(BA19), middle superior frontal gyrus (BA08), superior parietal gyrus (BA07),rostral portion of the premotor cortex (BA06), and midline sensorimotorcortex (BA04) (represented by shape as indicated at bottom left) at differ-ent intensities (represented by color) and conditions (represented by thepresence or absence of dark outline). The histograms on the right displaythe PCI distributions among subjects during alert wakefulness (dark graybars) and loss of consciousness (light gray bars). (B) Box plots with the sta-tistical significance (asterisks) with respect to the wakefulness group (LMM:
Lempel-Ziv complexity of SS. The rate of complexity divergence between theconscious and unconscious groups, DPCI(t), was calculated from single-subjectdifferences between the temporal evolution of PCI during wakefulness andloss of consciousness, with 25-ms time bins. Upper panel: Single-subject curvesof PCI(t) calculated during both wakefulness (light red lines) and loss of con-sciousness (light gray lines). The dark gray and red lines represent averagedPCI(t). Lower panel: Percentages of DPCI(t) generated in each temporal bin andthe statistical significance (asterisks) with respect to the average value acrossbins (*P = 0.002, Mann-Whitney).
eTranslationalMedicine.org 14 August 2013 Vol 5 Issue 198 198ra105 4

R E S EARCH ART I C L E
(mean ± SD, 0.39 ± 0.05;N = 15), and in all cases, PCI values were abovethe maximum values observed during physiological and pharmacologicalloss of consciousness. Similarly, in EMCS patients, PCI values were in-variably above the sleep/anesthesia–loss of consciousness distribution,with PCI ranging from 0.37 to 0.52 (mean ± SD, 0.43 ± 0.05; N = 14).
We assessed the significance of the stimulation site and level ofconsciousness on PCI values (see Materials and Methods) and foundthat PCI was significantly affected by the patient’s level of conscious-ness (P = 3 × 10⁻⁸, F3,17.4 = 42) and that there were no significanteffects of stimulation site on PCI values (P = 0.9, F3,37 = 0.2). Whenmain effects were compared (Fig. 5B), MCS patients exhibited a meanPCI value significantly higher than that in VS/UWS patients (P = 2 ×10⁻⁵) and significantly lower than that in LIS patients (P = 0.0001).Similarly, PCI in EMCS patients was significantly higher than that
www.Scienc
in VS/UWS patients (P = 8 × 10⁻⁷) and significantly lower than thatin LIS subjects (P = 0.002).
on
Aug
ust 1
6, 2
013
stm
.sci
ence
mag
.org
ded
from
DISCUSSION
Here, we have developed and tested a theoretically based measure ofconsciousness, the PCI. Empirically, PCI provides a data-driven metricthat can discriminate level of consciousness in single subjects under dif-ferent conditions: wakefulness; dreaming; the LIS; the MCS; the EMCS;intermediate levels of sedation; NREM sleep; midazolam-, xenon-, andpropofol-induced loss of consciousness; and the vegetative/unresponsivewakefulness state.
Various brain-based empirical measures have been proposed as po-tential neurophysiological markers of the level of consciousness. Thesemetrics belong to one of two general categories (13). The first embracesmethods that aim to quantify the information or spectral content ofbrain signals, such as the approximate entropy (20), the spectral en-tropy (19), and the bispectral index [Aspect Medical System (31)]. Thesecond category includes methods that evaluate the spatial extent orsynchronization of brain activations, such as late event–related poten-tials (32), measures of effective connectivity derived from dynamiccausal modeling analysis (33) or from TMS/EEG data (24, 34), andGranger causality and coherence analysis of electrophysiological (17)or metabolic time series (35). Although each of these metrics tends toshow group-level differences between specific conditions in which con-sciousness is absent or present, they are less reliable when it comes todetecting reproducible and graded changes in single individuals underdifferent conditions (sleep, anesthesia, and brain injury). For example,the bispectral index is widely variable among subjects and anestheticagents (36) and cannot reliably discriminate between conscious and un-conscious brain-injured individuals (37); similarly, late event–relatedpotentials, such as the mismatch negativity, P300 and P400, can be ab-sent in conscious subjects and present in unconscious subjects (38, 39).On the other hand, previous TMS/EEG measures of effective connec-tivity may discriminate between individual patients but are qualitativeand insensitive to graded changes in the level of consciousness (24),
eTranslationalMedicine.org 14
Dow
nloa
whereas coherence and Granger causalitycan actually be increased during loss ofconsciousness induced by propofol anes-thesia (40, 41).
The index described here, PCI, gaugesat once both the information content andthe integration of the overall output of thecorticothalamic system by measuring thealgorithmic complexity of the brain’s responseto a perturbation. Unlike other measures ofcomplexity that are applied to spontaneousbrain signals, PCI only assesses informa-tion that is generated through determinis-tic interactions within the thalamocorticalsystem. In this way, the resulting measuredcomplexity is minimally affected by ran-dom processes, such as noise and muscleactivity, or by patterns that are not genu-inely integrated, such as those generated byisolated neuronal sources or common driv-ers. On the other hand, PCI is distinct
A SleepPropofol anesthesia
PC
I
Subjects
B
Groups comparisonSubject
REM
S1
NREM
Wake
0.4
0.6
0.2
927 28 29 323130
*
**
WakefulnessIntermediateDeep
Fig. 4. PCI is sensitive to graded changes in the level of consciousness.(A) PCI calculated in six subjects (same subjects, 27 to 32, as Fig. 3A) during
wakefulness, intermediate, and deep levels of anesthesia with propofol. Right:Box plots with the statistical significance between pairs of conditions (*P =0.001, **P = 0.0004, repeated-measures ANOVA). (B) PCI calculated in one sub-ject (subject 9 in Fig. 3A) during wakefulness, sleep stage 1 (S1), NREM, andREM sleep. The gray and the red dashed lines represent the maximumcomplexity observed during unconsciousness (PCI = 0.31) and the minimumcomplexity observed during alert wakefulness (PCI = 0.44) across all subjects(Fig. 3A), respectively.Healthysubjects
A B
TMS targets
***
***
Patients
VS/UWS MCS EMCS LIS
CRS-R: 3 4 4 5 5 5 9 10 10 12 14 15 15 16 20 21 21 23
LISEMCSMCSVS/UWS
Wak
efu
lnes
sN
REM
sle
ep
VS MCS EMCS LIS
PC
I
PC
I
****
33 34 35 36 37 38 39 40 41 42 43 44 45 46 47 48 49 50 51 52
0.1
0.7
0.5
0.3
0.1
0.7
0.5
0.3
anes
thes
ia
UWS
Fig. 5. PCI discriminates the level of consciousness in brain-injured patients. (A) PCI values for 48 TMSsessions collected from 20 severely brain-injured patients (TMS was targeted to both left and right BA08 and
BA07, as indicated at top left). Right: Distribution of PCI values from healthy individuals. (B) Box plots for PCIin brain-injured patients with the statistical significance between pairs of conditions (LMM: *P = 0.002, **P =0.0001, ***P = 2 × 10⁻⁵, ****P = 8 × 10⁻⁷). Gray and red dashed lines in (A) and (B) represent the maximumcomplexity observed during unconsciousness (PCI = 0.31) and the minimum complexity observed duringalert wakefulness (PCI = 0.44) in healthy subjects, respectively.August 2013 Vol 5 Issue 198 198ra105 5

R E S EARCH ART I C L E
on
Aug
ust 1
6, 2
013
stm
.sci
ence
mag
.org
Dow
nloa
ded
from
from measures of integration that rely on the spread or synchroni-zation of neuronal activation because it is low when neural activa-tion is spatially extended but undifferentiated and stereotypical (Fig. 2).This aspect is relevant because hypersynchronous or widespread cor-tical activations can be observed when consciousness is lost duringanesthesia (1, 41), NREM sleep (21, 42), and generalized seizures(43, 44).
As long as the initial perturbation triggered a significant response(fig. S2), PCI was reproducible within and across subjects and variedwith the level of consciousness in a graded fashion (Figs. 3 and 4). PCIbehaved in the same way whether loss of consciousness was caused bya physiological process (sleep) or by a pharmacological interventionwith anesthetic agents (midazolam, xenon, and propofol) with differ-ent mechanisms of action, suggesting that our index captures a neuralcorrelate of the level of consciousness that is general and reliable. No-tably, the rate at which PCI increased was reproducible within andacross subjects and changed only when the level of consciousness wasaltered (Fig. 3C). Although immediately after TMS stimulation, PCIincreased with similar rates in all consciousness states, values duringwakefulness started to diverge from values during loss of consciousnessabout 100 ms after stimulation. These latencies are consistent with thetime scale required to develop a conscious sensory experience (45) andwith the time required to build up distributed causal interactions in thal-amocortical networks through feed-forward and reentrant connections(46, 47).
Many patients emerge from coma and exhibit signs of an interme-diate level of consciousness, ranging from simple visual fixation to aconfused state in subjects with severe cognitive disability. Assessingconsciousness in these patients can be particularly difficult becauseclinical signs are often fluctuating and unreliable and may be con-founded by reflexive motor activity (2, 48). Calculating PCI allowedcomparison, in the same coordinate space, of individual brain-injuredpatients who emerged from coma with healthy subjects during con-scious wakefulness and loss of consciousness (Fig. 5). In patients witha stable clinical diagnosis of a VS/UWS, PCI was as low as in healthysleeping and anesthetized subjects, despite preserved levels of behav-ioral arousal. Conversely, PCI was as high as in healthy awake subjectsin two brain-injured patients with LIS. Notably, the PCI in patientswith MCS and EMCS tended to be lower than that observed in healthyawake subjects but was always above the highest value (0.31) found inconditions in which consciousness was unambiguously lost (NREMsleep, anesthesia, and VS). Thus, PCI differs from TMS/EEG measuresof effective connectivity (24), which are unable to detect graded changesin the level of consciousness. On the other hand, the fact that PCI inMCS, EMCS, and LIS patients was invariably above the maximum val-ue detected during loss of consciousness distinguishes PCI from mea-sures of brain activation to sensory or verbal stimulation, which arecharacterized by a significant rate of false negatives in brain-injured pa-tients (18, 49, 50).
From a practical standpoint, PCI may permit the comparison ofdifferent subjects and different conditions within the same coordinatespace. Most important, it can establish a reliable measurement scale bydefining a range of values for various conditions in which conscious-ness is present (wakefulness and dreaming) and absent (NREM sleepand different types of anesthesia). This is a key requirement for vali-dation of a neurophysiological marker that may then be applicable tosingle individuals whose level of consciousness is unknown, such as thosewith complete LIS, ambiguous noncommunicating brain-injured or end-
www.Scienc
staged demented patients, catatonic psychiatric patients, and paralyzedsubjects who are at risk of regaining awareness during surgical anes-thesia (1).
Although our study suggests that a high PCI value in a subject whois otherwise totally unable to interact with the external environmentindicates that she or he is conscious, this conclusion is subject to lim-itations. One is the relatively small number of brain-injured patients(n = 20) that we have used for testing PCI. Further studies are neededto demonstrate that, in an independent, larger sample of patients whoare clinically MCS, the PCI values are invariably distinguishable fromthose obtained from unconscious subjects. It will be equally important toverify in an independent sample that PCI values are high in subjects whoare behaviorally unresponsive but conscious. Thus, PCI should be fur-ther tested in dissociated states, such as during dreaming and ketamineanesthesia, when subjects are conscious but temporarily disconnectedfrom the external environment. PCI should also be validated in selectedpatients who are clinically VS but show consistent neural responses toverbal instructions (51).
An important caveat is that, although PCI does not depend onthe cortical site of stimulation in healthy brains, it may be inaccurate inbrain-injured patients when the TMS perturbation is applied to a struc-turally damaged portion of the cortical surface. PCI can be reliablycalculated only if the TMS stimulation effectively elicits a significantcortical response (fig. S2). This problem can be avoided by using animaging-guided TMS positioning system to avoid targeting damagedcortical sites.
Here, we have reported PCI, a potentially useful index of con-sciousness that evaluates the compressibility of the brain responseto TMS, a perturbation that directly engages large portions of the thal-amocortical system (26, 52) without requiring the subjects to performany sensory, motor, or cognitive task. In this way, the capacity for con-sciousness can be assessed on the basis of the complexity of corticalinteractions, independent of the subjects’ capacity or willingness to re-act to external stimuli/commands. PCI is calculated from principlesderived from theoretical neuroscience, and its apparent usefulnesssupports the notion that consciousness is linked to complexity,measured as the information content of distributed causal interac-tions in the brain (10, 15).
MATERIALS AND METHODS
Study designIn this hypothesis-generating study, we tested a measure of complexity(PCI) based on 208 TMS/EEG measurements (N = 208) in 52 subjects(n = 52). To this aim, we adopted, in the first part of the study, a within-subject, open-label design to test for differences in PCI derived fromTMS-EEG responses in healthy subjects. Here, we measured changesin PCI between the conscious (wakefulness) and the unconscious (sleep-and anesthesia-mediated loss of consciousness) conditions, thus creat-ing two reference data distributions obtained under systematicallycontrolled conditions, in which the level of consciousness was known(n = 32; N = 152). In the second part of the study, we measured PCIdifferences in a cross-sectional, open-label design including differentgroups of chronic neurological patients (VS, MCS, EMCS, and LIS).Here, we assessed the reliability of the proposed index in discriminat-ing individuals with a stable clinical diagnosis (n = 20; N = 48) andcompared the obtained results to the same frame of reference derived
eTranslationalMedicine.org 14 August 2013 Vol 5 Issue 198 198ra105 6
R E S EARCH ART I C L E
on
Aug
ust 1
6, 2
013
stm
.sci
ence
mag
.org
Dow
nloa
ded
from
from the first part of the study. For a detailed description of healthysubjects as well as patients’ selection criteria and group assignment, seethe “Protocols” section.
ProtocolsPCI was calculated on a data set recorded in previously publishedstudies (24 subjects, 57 TMS/EEG measurements) as well as on a new-ly recorded data set (28 subjects, 151 TMS/EEG measurements). Spe-cifically, the data on sleep (subjects 9 to 14) were derived from studiesby Massimini et al. (22, 53), the data on midazolam-induced loss ofconsciousness (subjects 15 to 20) were from a study by Ferrarelli et al.(23), and the data from brain-injured patients (patients 34 to 40, 42 to44, and 51 to 52) were from a study by Rosanova et al. (24). Newlyacquired data include control measurements during wakefulness (sub-jects 1 to 8); measurements during wakefulness and xenon anesthesia(subjects 21 to 26); measurements during wakefulness, propofol seda-tion, and anesthesia (subjects 27 to 32); and a subset of brain-injuredpatients (patients 33, 41, and 45 to 50). Below, we outline the specificprotocols.
Control measurements in wakefulness (subjects 1 to 8). Inthese experiments, performed on eight healthy subjects (three females,five males; age range, 23 to 46), several experimental parameters werevaried systematically within and across individuals: site of stimulation,intensity of stimulation, and eyes opened/closed. In each subject, mul-tiple sessions of ~200 stimuli were collected with TMS targeted to thesuperior occipital gyrus (BA19), the middle superior frontal gyrus(BA08), the superior parietal gyrus (BA07), the rostral portion ofthe premotor cortex (BA06), and the midline sensorimotor cortex(BA04). The maximum electrical field at the cortical target was variedwithin the range 80 to 160 V/m. During the recordings, subjects werelying on an ergonomic chair and either looking at a fixation point on ascreen (eyes open condition) or keeping their eyes closed. Data con-taminated by muscular artifacts or with a low signal-to-noise ratiowere excluded, resulting in a total of 72 TMS sessions (see table S1,subjects 1 to 8). Protocol and informed consents were approved by thelocal ethical committee (Ospedale “L. Sacco” in Milan, Italy).
Measurements in wakefulness and sleep (subjects 9 to 14).PCI was calculated on TMS/EEG data collected in six healthy subjectsprogressing from wakefulness to NREM sleep (22). In these experi-ments, the first TMS-EEG session (~250 stimuli) was acquired whilethe subjects were alert and relaxed, with their eyes opened. Stimuli weretargeted to the rostral portion of the right premotor cortex (BA06), re-sulting in an electric field at the cortical target of about 90 V/m (see tableS1, subjects 9 to 14). A second TMS-EEG session was collected, with thesame stimulation intensity, after subjects entered a consolidated period(>5 min) of NREM sleep stage 3. In four of the six subjects, a third ses-sion was also recorded in which TMS was delivered at higher intensity(160 V/m) to the midline sensorimotor cortex (BA04). In one additionalsubject, TMS-evoked potentials were recorded during the transition fromwakefulness through stage 1 to NREM (stages 2 and 3) and during REMsleep (53). Protocol and informed consents were approved by the localethical committee (University of Wisconsin, Madison, WI).
Measurements in anesthesia (subjects 15 to 32). Midazolam(subjects 15 to 20). PCI was calculated on TMS-evoked potentials ac-quired in six healthy subjects before and after midazolam-induced lossof consciousness (23). The first TMS-EEG session was collected in eachsubject before midazolam injection, with stimuli targeted to the rostralportion of the right premotor cortex (BA06) at an intensity of about
www.Scienc
120 V/mwhile subjects were lying on a bed with eyes closed (see table S1,subjects 15 to 20). Midazolam was then given until the subject was un-responsive (level 1 of the MOAAS), with a maximum dose of 0.2 mg/kg.A second TMS session was then collected during loss of consciousness.Protocol and informed consents were approved by the local ethical com-mittee (University of Wisconsin, Madison, WI).
Xenon (subjects 21 to 26). Six healthy volunteers (two males, fourfemales; mean age, 23; range, 18 to 28) participated in this study. Thefirst TMS-EEG session was collected during wakefulness with stimulitargeted over the right motor cortex (BA04) at an intensity of about100 V/m while subjects were lying on a bed with eyes open (see table S1,subjects 21 to 26). During a 40-min period, xenon was introduced pro-gressively by a certified anesthesiologist after performing a denitrogena-tion with 100% oxygen through a facial mask. Anesthesia was maintainedwith xenon (62.5 ± 2.5% in oxygen) with a closed-circuit anesthesiamachine (PhysioFlex; Dräger Medical Deutschland GmbH). Subjectswere ventilated with pressure control maintaining normocapnia andreceived between 24 and 32 liters of xenon in total. Stimulations withthe same parameters as for wakefulness were then performed duringloss of consciousness (level 1 of the MOAAS). Protocol and informedconsents were approved by the local ethical committee of the Medi-cine Faculty of the University of Liège (Medical School of the Univer-sity of Liège, Belgium).
Propofol (subjects 27 to 32). Six healthy volunteers (three males, threefemales; mean age, 24; range, 20 to 27) participated in this study. In allsubjects, TMS-EEG measurements were performed first during wake-fulness while subjects were lying on a bed with eyes open (see table S1,subjects 27 to 32) and then during an intermediate level of sedation(levels 2 to 3 of the MOAAS) followed by anesthesia with loss of con-sciousness (level 1 of the MOAAS). Across these conditions, TMS wastargeted over the motor (BA04), premotor (BA06), parietal (BA07), andoccipital (BA19) areas at an intensity of about 110 V/m. Propofol anes-thesia was induced by a certified anesthesiologist through an intra-venous catheter placed into a vein of the right hand or forearm. A secondcatheter was also placed into the opposite arm for blood sampling.Throughout the study, the subjects breathed spontaneously, and addi-tional oxygen (5 liters/min) was given through a loosely fitting plasticface mask. Anesthesia was obtained with a computer-controlled intra-venous infusion of propofol to obtain constant effect-site concentra-tions (Alaris TIVA; CareFusion). The propofol plasma and effect-siteconcentrations were estimated with a three-compartment pharmaco-kinetic model (29). Protocol and informed consents were approved bythe local ethical committee of the Medicine Faculty of the Universityof Liège (Medical School of the University of Liège, Belgium).
Measurements in brain-injured patients (subjects 33 to 52).TMS/EEG measurements were performed in 20 brain-injured patientswho, after a period in a coma, evolved toward various clinical condi-tions (table S2). These patients were repeatedly evaluated (four times,every other day) for a period of 1 week (evaluation week) by means ofthe CRS-R (30) to avoid diagnostic errors resulting from fluctuationsin responsiveness and to obtain a stable clinical diagnosis. Six pa-tients showed only reflexive behavior and were diagnosed as being ina vegetative/unresponsive state (VS/UWS) during the four behavioralevaluations. Six patients were unable to communicate but showed signsof nonreflexive behaviors, such as visual tracking or responding tosimple commands, and satisfied the CRS-R criteria for an MCS in at leastthree evaluations, including the one performed on the day of the TMS/EEGsession. Six patients recovered functional communication, despite severe
eTranslationalMedicine.org 14 August 2013 Vol 5 Issue 198 198ra105 7
R E S EARCH ART I C L E
on
Aug
ust 1
6, 2
013
stm
.sci
ence
mag
.org
Dow
nloa
ded
from
motor and cognitive impairment, and were studied as they emerged fromthe minimally conscious state (EMCS). The two remaining patients couldcommunicate reliably through eye movements and were diagnosed asaffected by a LIS. In each patient, TMS was targeted to four cortical sitesby means of the navigation system: the left and right medial third ofthe superior parietal gyrus (BA07) and the left and right medial thirdof the superior frontal gyrus (BA08). In practice, all four cortical siteswere not always accessible in all subjects because of skull breaches andinternal drain placement. In all cases, we avoided stimulating over cor-tical lesions that were clearly visible in computed tomography/magneticresonance imaging scans because the EEG response of these areas maybe absent or unreliable. The study was approved by the local ethical com-mittee of the Medicine Faculty of the University of Liège (Medical Schoolof the University of Liège, Belgium) and by the local ethical committee ofthe European Foundation for Biomedical Research (FERB, Italy). Writteninformed consent was obtained by the patient’s legal surrogates as wellas from the patients who retained functional communication.
Extracting the deterministic patterns of cortical activationand calculating PCITMS-evoked potentials were recorded with a 60-channel TMS-compatibleEEG amplifier, and stimuli were delivered by means of a Focal Bipulse8-Coil, driven by a Mobile Stimulator Unit and combined with a mag-netic resonance–guided navigation system as described (22, 26). Theprimary electromagnetic sources of scalp EEG activity were localizedby performing source modeling, and the responses of the brain wereestimated by applying a nonparametric bootstrap-based statistical pro-cedure to TMS-evoked cortical currents (see the Supplementary Mate-rials for details on source modeling and statistics). In this way, a binaryspatiotemporal distribution of significant sources [SS(x,t)] was calculated:SS(x,t) = 1 for significant sources (x) and time samples (t); SS(x,t) = 0otherwise (Fig. 1). The matrix SS can be used to derive general indicesof cortical responsiveness, such as the significant current density (SCD)and significant current scattering (SCS), estimating cortical reactivityand cortico-cortical connectivity, respectively (26). For the studies reportedhere, we applied the Lempel-Ziv measure of algorithmic complexity (27)to the binary matrix SS(x,t) to evaluate the information content of cortico-cortical causal interactions above and beyond the strength (SCD) or theextent (SCS) of the response to TMS. The Lempel-Ziv complexity (cL)approximates the amount of nonredundant information contained ina binary sequence of length L by estimating the minimal number of dif-ferent patterns necessary to describe the sequence. The asymptotic be-havior of this measure for random sequences is LH(L)/log2L, whereH(L)is the source entropy
HðLÞ ¼ −p1log2ðp1Þ − ð1 − p1Þlog2ð1 − p1Þ ð1Þ
and p1 is the fraction of “1” contained in the binary sequence of lengthL (27). We define the PCI as the normalized Lempel-Ziv complexity
cL ¼ cLlog2L
LHðLÞ ð2Þ
of the TMS-evoked spatiotemporal patterns of cortical activation,SS(x,t). The normalization of the Lempel-Ziv measure by the sourceentropy of SS(x,t) results in a complexity measure that is minimally
www.Scienc
dependent on the total amount of significant activity and maximallydependent on the formation of patterns in the data. Asymptoticallyin L, PCI = 1 for maximally complex TMS-evoked potentials (see theSupplementary Materials for further details on calculating PCI).
Statistical analysisStatistical models. To assess significant effects on PCI values, the
following models were implemented in SPSS v17.Healthy subjects. Significant effects of the subject’s conditions and
stimulation parameters on PCI values depicted in Fig. 3A were ac-cessed by LMMs. Estimation of fixed effects and covariance param-eters was performed with the restricted maximum likelihood (ReML)method. Null hypotheses were tested with type III F statistics and re-jected if P < 0.05. Main effects of multiple-level factors were compared,and normal-based 95% confidence intervals were adjusted withBonferroni’s method. PCI values were initially modeled including fixedfactors associated with stimulation site, stimulation intensity, and a binaryclassifier of subject’s conditions (wakefulness/loss of consciousness). Themodel also included a random factor associated with the intercept foreach subject to handle the unbalanced repeated measures and a randomsubject-specific effect of loss of consciousness. This additional randomfactor allows the variance of PCI during wakefulness to differ from thatduring loss of consciousness. Finally, residual covariances were assumedto be diagonal and homogeneous. Because no significant effects of thestimulation parameters were observed, the model was restricted to therandom factors and a single categorical fixed factor with one level foreach condition: wakefulness, sleep, propofol, midazolam, and xenon(Fig. 3B).
Levels of propofol anesthesia. The balanced repeated-measures datadepicted in Fig. 4A were analyzed by repeated-measures ANOVA toassess significant effects of different levels of propofol anesthesia. In ad-dition to normality, data were also tested for sphericity with Mauchly’stest (P = 0.3). Pairwise comparisons were adjusted with Bonferroni’smethod.
Patients. PCI values in brain-injured patients (Fig. 5A) were mod-eled by an LMM, estimated by the ReML method and tested by type IIIF statistics. The model included a random intercept for each patient andtwo categorical fixed factors: stimulation site (BA08L, BA08R, BA07L,and BA07R) and patient’s clinical diagnoses (VS, MCS, EMCS, and LIS).Because no significant effect of site was observed, the model was restrictedto the random intercept and the fixed factor associated to the clinicaldiagnoses (Fig. 5B). Main effects were compared, and normal-based95% confidence intervals were adjusted with Bonferroni’s method.
All distributions of PCI values were tested for normality (P > 0.05)with the Shapiro-Wilk test.
Results. In the text, data are shown as means ± SD. In figures, boxplots are depicted with sample minimum and maximum (vertical lines),lower and upper quartiles (boxes), and medians (horizontal lines).
SUPPLEMENTARY MATERIALS
www.sciencetranslationalmedicine.org/cgi/content/full/5/198/198ra105/DC1Materials and MethodsFig. S1. Strength, extent, and complexity of cortical responses to TMS.Fig. S2. Source entropy and signal-to-noise ratio for all TMS sessions.Fig. S3. Diagram of the Lempel-Ziv algorithm.Fig. S4. TMS-evoked potentials in a single subject.Fig. S5. Correlation of PCI and PCIT.
eTranslationalMedicine.org 14 August 2013 Vol 5 Issue 198 198ra105 8

R E S EARCH ART I C L E
Table S1. Stimulation parameters for TMS sessions during wakefulness.Table S2. Brain-injured patients.References (54–61)
on
Aug
ust 1
6, 2
013
stm
.sci
ence
mag
.org
Dow
nloa
ded
from
REFERENCES AND NOTES1. M. T. Alkire, A. G. Hudetz, G. Tononi, Consciousness and anesthesia. Science 322, 876–880
(2008).
2. S. Laureys, A. M. Owen, N. D. Schiff, Brain function in coma, vegetative state, and relateddisorders. Lancet Neurol. 3, 537–546 (2004).
3. R. D. Sanders, G. Tononi, S. Laureys, J. W. Sleigh, Unresponsiveness ≠ unconsciousness.Anesthesiology 116, 946–959 (2012).
4. S. Dehaene, J. P. Changeux, Experimental and theoretical approaches to conscious processing.Neuron 70, 200–227 (2011).
5. K. Friston, Beyond phrenology: What can neuroimaging tell us about distributed circuitry?Annu. Rev. Neurosci. 25, 221–250 (2002).
6. S. Laureys, The neural correlate of (un)awareness: Lessons from the vegetative state.Trends Cogn. Sci. 9, 556–559 (2005).
7. G. Tononi, C. Koch, The neural correlates of consciousness: An update. Ann. N. Y. Acad. Sci.1124, 239–261 (2008).
8. A. K. Seth, E. Izhikevich, G. N. Reeke, G. M. Edelman, Theories and measures of consciousness:An extended framework. Proc. Natl. Acad. Sci. U.S.A. 103, 10799–10804 (2006).
9. O. Sporns, The human connectome: A complex network. Ann. N. Y. Acad. Sci. 1224, 109–125(2011).
10. G. Tononi, An information integration theory of consciousness. BMC Neurosci. 5, 42 (2004).11. G. Tononi, G. M. Edelman, Consciousness and complexity. Science 282, 1846–1851 (1998).12. M. Boly, Measuring the fading consciousness in the human brain. Curr. Opin. Neurol. 24,
394–400 (2011).13. A. K. Seth, Z. Dienes, A. Cleeremans, M. Overgaard, L. Pessoa, Measuring consciousness:
Relating behavioural and neurophysiological approaches. Trends Cogn. Sci. 12, 314–321(2008).
14. A. K. Seth, A. B. Barrett, L. Barnett, Causal density and integrated information as measuresof conscious level. Philos. Trans. A Math. Phys. Eng. Sci. 369, 3748–3767 (2011).
15. G. Tononi, Consciousness as integrated information: A provisional manifesto. Biol. Bull.215, 216–242 (2008).
16. G. Tononi, O. Sporns, G. M. Edelman, A measure for brain complexity: Relating functionalsegregation and integration in the nervous system. Proc. Natl. Acad. Sci. U.S.A. 91, 5033–5037(1994).
17. A. K. Engel, W. Singer, Temporal binding and the neural correlates of sensory awareness.Trends Cogn. Sci. 5, 16–25 (2001).
18. B. Kotchoubey, Event-related potential measures of consciousness: Two equations withthree unknowns. Prog. Brain Res. 150, 427–444 (2005).
19. R. W. Johnson, J. E. Shore, Relative-Entropy Minimization with Uncertain Constraints—Theory andApplication to Spectrum Analysis (Defense Technical Information Center, Washington, 1984).
20. S. M. Pincus, I. M. Gladstone, R. A. Ehrenkranz, A regularity statistic for medical data analysis.J. Clin. Monit. 7, 335–345 (1991).
21. M. Massimini, F. Ferrarelli, S. K. Esser, B. A. Riedner, R. Huber, M. Murphy, M. J. Peterson,G. Tononi, Triggering sleep slow waves by transcranial magnetic stimulation. Proc. Natl. Acad.Sci. U.S.A. 104, 8496–8501 (2007).
22. M. Massimini, F. Ferrarelli, R. Huber, S. K. Esser, H. Singh, G. Tononi, Breakdown of corticaleffective connectivity during sleep. Science 309, 2228–2232 (2005).
23. F. Ferrarelli, M. Massimini, S. Sarasso, A. Casali, B. A. Riedner, G. Angelini, G. Tononi, R. A. Pearce,Breakdown in cortical effective connectivity during midazolam-induced loss of consciousness.Proc. Natl. Acad. Sci. U.S.A. 107, 2681–2686 (2010).
24. M. Rosanova, O. Gosseries, S. Casarotto, M. Boly, A. G. Casali, M. A. Bruno, M. Mariotti,P. Boveroux, G. Tononi, S. Laureys, M. Massimini, Recovery of cortical effective connectivityand recovery of consciousness in vegetative patients. Brain 135, 1308–1320 (2012).
25. R. J. Ilmoniemi, J. Virtanen, J. Ruohonen, J. Karhu, H. J. Aronen, R. Näätänen, T. Katila, Neuronalresponses to magnetic stimulation reveal cortical reactivity and connectivity. Neuroreport 8,3537–3540 (1997).
26. A. G. Casali, S. Casarotto, M. Rosanova, M. Mariotti, M. Massimini, General indices to charac-terize the electrical response of the cerebral cortex to TMS. Neuroimage 49, 1459–1468 (2010).
27. A. Lempel, J. Ziv, On the complexity of finite sequences. IEEE Trans. Inform. Theory 22, 75–81(1976).
28. F. Kaspar, H. G. Schuster, Easily calculable measure for the complexity of spatiotemporalpatterns. Phys. Rev. A 36, 842–848 (1987).
29. B. Marsh, M. White, N. Morton, G. N. Kenny, Pharmacokinetic model driven infusion ofpropofol in children. Br. J. Anaesth. 67, 41–48 (1991).
30. J. T. Giacino, K. Kalmar, J. Whyte, The JFK Coma Recovery Scale-Revised: Measurementcharacteristics and diagnostic utility. Arch. Phys. Med. Rehabil. 85, 2020–2029 (2004).
www.Scienc
31. J. C. Sigl, N. G. Chamoun, An introduction to bispectral analysis for the electroencephalogram.J. Clin. Monit. 10, 392–404 (1994).
32. G. Plourde, T. W. Picton, Long-latency auditory evoked potentials during general anesthesia:N1 and P3 components. Anesth. Analg. 72, 342–350 (1991).
33. M. Boly, M. I. Garrido, O. Gosseries, M. A. Bruno, P. Boveroux, C. Schnakers, M. Massimini,V. Litvak, S. Laureys, K. Friston, Preserved feedforward but impaired top-down processesin the vegetative state. Science 332, 858–862 (2011).
34. A. Ragazzoni, C. Pirulli, D. Veniero, M. Feurra, M. Cincotta, F. Giovannelli, R. Chiaramonti,M. Lino, S. Rossi, C. Miniussi, Vegetative versus minimally conscious states: A study usingTMS-EEG, sensory and event-related potentials. PLoS One 8, e57069 (2013).
35. A. Vanhaudenhuyse, Q. Noirhomme, L. J. Tshibanda, M. A. Bruno, P. Boveroux, C. Schnakers,A. Soddu, V. Perlbarg, D. Ledoux, J. F. Brichant, G. Moonen, P. Maquet, M. D. Greicius, S. Laureys,M. Boly, Default network connectivity reflects the level of consciousness in non-communicativebrain-damaged patients. Brain 133, 161–171 (2010).
36. K. Kaskinoro, A. Maksimow, J. Långsjö, R. Aantaa, S. Jääskeläinen, K. Kaisti, M. Särkelä, H. Scheinin,Wide inter-individual variability of bispectral index and spectral entropy at loss of consciousnessduring increasing concentrations of dexmedetomidine, propofol, and sevoflurane. Br. J. Anaesth.107, 573–580 (2011).
37. C. Schnakers, S. Majerus, S. Laureys, Bispectral analysis of electroencephalogram signalsduring recovery from coma: Preliminary findings. Neuropsychol. Rehabil. 15, 381–388 (2005).
38. C. Fischer, J. Luaute, D. Morlet, Event-related potentials (MMN and novelty P3) in perma-nent vegetative or minimally conscious states. Clin. Neurophysiol. 121, 1032–1042 (2010).
39. Y. Höller, J. Bergmann, M. Kronbichler, J. S. Crone, E. V. Schmid, S. Golaszewski, G. Ladurner,Preserved oscillatory response but lack of mismatch negativity in patients with disordersof consciousness. Clin. Neurophysiol. 122, 1744–1754 (2011).
40. A. B. Barrett, M. Murphy, M. A. Bruno, Q. Noirhomme, M. Boly, S. Laureys, A. K. Seth, Grangercausality analysis of steady-state electroencephalographic signals during propofol-induced an-aesthesia. PLoS One 7, e29072 (2012).
41. G. G. Supp, M. Siegel, J. F. Hipp, A. K. Engel, Cortical hypersynchrony predicts breakdown ofsensory processing during loss of consciousness. Curr. Biol. 21, 1988–1993 (2011).
42. P. Achermann, A. A. Borbely, Temporal evolution of coherence and power in the humansleep electroencephalogram. J. Sleep Res. 7 (Suppl. 1), 36–41 (1998).
43. M. Arthuis, L. Valton, J. Régis, P. Chauvel, F. Wendling, L. Naccache, C. Bernard, F. Bartolomei,Impaired consciousness during temporal lobe seizures is related to increased long-distancecortical–subcortical synchronization. Brain 132, 2091–2101 (2009).
44. H. Blumenfeld, M. Westerveld, R. B. Ostroff, S. D. Vanderhill, J. Freeman, A. Necochea, P. Uranga,T. Tanhehco, A. Smith, J. P. Seibyl, R. Stokking, C. Studholme, S. S. Spencer, I. G. Zubal, Selectivefrontal, parietal, and temporal networks in generalized seizures. Neuroimage 19, 1556–1566(2003).
45. T. Bachmann, Microgenetic Approach to the Conscious Mind (John Benjamins, Amsterdam,2000).
46. C. N. Boehler, M. A. Schoenfeld, H. J. Heinze, J. M. Hopf, Rapid recurrent processing gatesawareness in primary visual cortex. Proc. Natl. Acad. Sci. U.S.A. 105, 8742–8747 (2008).
47. V. A. F. Lamme, P. R. Roelfsema, The distinct modes of vision offered by feedforward andrecurrent processing. Trends Neurosci. 23, 571–579 (2000).
48. S. Majerus, H. Gill-Thwaites, K. Andrews, S. Laureys, Behavioral evaluation of consciousnessin severe brain damage. Prog. Brain Res. 150, 397–413 (2005).
49. J. C. Bardin, J. J. Fins, D. I. Katz, J. Hersh, L. A. Heier, K. Tabelow, J. P. Dyke, D. J. Ballon, N. D. Schiff,H. U. Voss, Dissociations between behavioural and functional magnetic resonance imaging-based evaluations of cognitive function after brain injury. Brain 134, 769–782 (2011).
50. M. M. Monti, M. R. Coleman, A. M. Owen, Neuroimaging and the vegetative state: Resolvingthe behavioral assessment dilemma? Ann. N. Y. Acad. Sci. 1157, 81–89 (2009).
51. A. M. Owen, M. R. Coleman, M. Boly, M. H. Davis, S. Laureys, J. D. Pickard, Detecting aware-ness in the vegetative state. Science 313, 1402 (2006).
52. M. Rosanova, A. Casali, V. Bellina, F. Resta, M. Mariotti, M. Massimini, Natural frequencies ofhuman corticothalamic circuits. J. Neurosci. 29, 7679–7685 (2009).
53. M. Massimini, F. Ferrarelli, M. Murphy, R. Huber, B. Riedner, S. Casarotto, G. Tononi, Corticalreactivity and effective connectivity during REM sleep in humans. Cogn. Neurosci. 1, 176–183(2010).
54. P. Berg, M. Scherg, A fast method for forward computation of multiple-shell spherical headmodels. Electroencephalogr. Clin. Neurophysiol. 90, 58–64 (1994).
55. Z. Zhang, A fast method to compute surface potentials generated by dipoles within mul-tilayer anisotropic spheres. Phys. Med. Biol. 40, 335–349 (1995).
56. K. Friston, R. Henson, C. Phillips, J. Mattout, Bayesian estimation of evoked and inducedresponses. Hum. Brain Mapp. 27, 722–735 (2006).
57. J. Mattout, C. Phillips, W. D. Penny, M. D. Rugg, K. J. Friston, MEG source localization undermultiple constraints: An extended Bayesian framework. Neuroimage 30, 753–767 (2006).
58. C. Phillips, J. Mattout, M. D. Rugg, P. Maquet, K. J. Friston, An empirical Bayesian solution tothe source reconstruction problem in EEG. Neuroimage 24, 997–1011 (2005).
59. J. Lv, D. M. Simpson, S. L. Bell, Objective detection of evoked potentials using a bootstraptechnique. Med. Eng. Phys. 29, 191–198 (2007).
eTranslationalMedicine.org 14 August 2013 Vol 5 Issue 198 198ra105 9
R E S EARCH ART I C L E
60. D. Pantazis, T. E. Nichols, S. Baillet, R. M. Leahy, A comparison of random field theory andpermutation methods for the statistical analysis of MEG data. Neuroimage 25, 383–394 (2005).
61. M. Li, P. Vitányi, An Introduction to Kolmogorov Complexity and Its Applications (Springer,New York, ed. 3, 2008).
Acknowledgments: We thank T. D’Oliveira Silva for technical contributions and suggestionsfor the implementation of the Lempel-Ziv algorithm, M. Mariotti for administrative supervisionof control experiments in healthy subjects, J.-F. Brichant for administrative supervision ofpropofol and xenon studies, P. Boveroux and D. Ledoux for their help in patients’ medical assist-ance during the experiments, S. Rex and R. Rossaint for providing xenon material, and F. Ferrarellifor his contribution in the acquisition of midazolam data. Funding: This study was funded by theBelgian National Funds for Scientific Research (FNRS), EU grant FP7-ICT-2011-9, n. 600806 “Corticonics”;PUR 2009 and “Dote ricerca”: FSE, Regione Lombardia (University of Milan); Prin2008 (Italian Gov-ernment); Fonds Léon Fredericq, James S. McDonnell Foundation; Mind Science Foundation;European Commission (Mindbridge, DISCOS, DECODER & COST); Concerted Research Action (ARC06/11-340); Public Utility Foundation “Université Européenne du Travail”; and “Fondazione Europea diRicerca Biomedica.” O.G., M.B., and M.-A.B. are Postdoctoral Fellows and S.L. is Research Director
www.ScienceT
at FNRS. Author contributions: Conception and design of PCI: A.G.C. and M.M.; experimentaldesign for sleep and midazolam: G.T. and M.M.; experimental design for propofol, xenon, and pa-tients: O.G., M.R., S.L., and M.M.; clinical evaluation of patients: O.G.; experimental execution forsleep and midazolam: S.S., G.T., and M.M.; experimental execution for propofol, xenon, and pa-tients: O.G., M.R., M.B., S.C., M.-A.B., S.L., and M.M.; data analysis: A.G.C., O.G., M.R., M.B., S.S., K.R.C.,and S.C.; wrote the paper: A.G.C., G.T., and M.M. Competing interests: The authors declare thatthey have no competing interests.
Submitted 3 April 2013Accepted 10 June 2013Published 14 August 201310.1126/scitranslmed.3006294
Citation: A. G. Casali, O. Gosseries, M. Rosanova, M. Boly, S. Sarasso, K. R. Casali, S. Casarotto,M.-A. Bruno, S. Laureys, G. Tononi, M. Massimini, A theoretically based index of consciousnessindependent of sensory processing and behavior. Sci. Transl. Med. 5, 198ra105 (2013).
ranslationalMedicine.org 14 August 2013 Vol 5 Issue 198 198ra105 10
on
Aug
ust 1
6, 2
013
stm
.sci
ence
mag
.org
Dow
nloa
ded
from