a technology perspective and optimized workflow to
TRANSCRIPT

A TECHNOLOGY PERSPECTIVE AND OPTIMIZED WORKFLOW TO
INTELLIGENT WELL APPLICATIONS
A Thesis
by
MUSAGA WASI FOMBAD
Submitted to the Office of Graduate and Professional Studies of
Texas A&M University
in fulfillment of the requirements for the degree of
MASTER OF SCIENCE
Chair of Committee, Eduardo Gildin
Co-Chair of Committee, Ding Zhu
Committee Member, Richard Malak
Head of Department, Dan Hill
May 2016
Major Subject: Petroleum Engineering
Copyright 2016 Musaga W. Fombad

ii
ABSTRACT
Today’s oil and gas industry is faced with several geographic and economic challenges
that have significantly increased the pressure on companies engaged in oil and gas
exploration and production. Technical as well as economic challenges like the highly
volatile crude oil prices, global competition for depleting resources and pressure from
shareholders for return on investment are threatening to the industry. In the quest to
address these challenges, operators are continuously seeking advanced technology that
could increase production, improve recovery, and minimize cost. Although advanced
technology such as 3D and 4D seismic downhole sensors have significantly improved
the amount of accessible realtime information, the amount of data is often massive and
too complex to accurately analyze.
Within the past decade, significant advances in drilling and completion techniques have
been made to enable more active monitoring and control of production wells. Smart well
technology, also known as Intelligent Well Completions (IWC), is one of such
technologies that integrates permanent downhole sensors with surface-controlled
downhole flow control valves, enabling operators to monitor, evaluate, and actively
manage production (or injection) in real time. All of this is achieved without any well
interventions, thus completely eliminating the risk and economic losses associated with
well intervention.
A comprehensive review of smart well technology, as well as real-world case studies
will be presented. A case study simulation is performed to evaluate the additional value
that is derived by adopting smart well technology. The simulation results clearly indicate
that adopting smart well technology significantly reduced field water cut, accelerated the
productions time and improved the Net Present Value (NPV) of the project.
Finally, a workflow is presented which can be used to assess to applicability of a given
field with multiple producing wells.

iii
DEDICATION
First off, I will like to thank God for granting me the resilience to make it this far in my
academic career.
Every challenging work requires self-effort as well as support from others especially
those who are close to our heart. I will like to dedicate the efforts of this work to my
brother Bayong T. Fombad whose strength and good spirit has always served as a source
of inspiration to me, and has challenged me to always put in my best effort in everything
I do.

iv
ACKNOWLEDGEMENTS
I will like to use this opportunity to express my deepest sense of gratitude to my advisor
Dr. Eduardo Gildin for his full support, guidance and understanding throughout my
research study. This thesis work will not be complete without his patience and timely
counsel.
I would like to thank Dr. Ding Zhu and Dr. Richard Malak for their willingness to serve
on my advisory committee.
I would also like to thank all my friends and colleagues for their support, and recognize
the department faculty and staff for providing me with all the resources and a great
environment to succeed in my studies.
Finally I will like to extend special thanks to my sweet and loving parents. Their
affection and continuous encouragement was very instrumental in all my achievements
and for that I am forever grateful.

v
TABLE OF CONTENTS
Page
ABSTRACT ............................................................................................................ ii
DEDICATION ....................................................................................................... iii
ACKNOWLEDGEMENTS ................................................................................... iv
TABLE OF CONTENTS ........................................................................................ v
LIST OF FIGURES ............................................................................................... vii
LIST OF TABLES .................................................................................................. x
CHAPTER I INTRODUCTION ............................................................................. 1
1.1 Statement of the Problem and Motivation .................................................... 1
1.2 Research Objectives ..................................................................................... 3
1.3 Scope of Work and Limitations .................................................................... 5
1.4 Report Outline .............................................................................................. 6
CHAPTER II LITERATURE REVIEW ................................................................. 7
2.1 Overview and Historical Development ........................................................ 7
2.2 Academic Literature ..................................................................................... 8
2.3 Key Industry Players .................................................................................. 10
2.3.1 Halliburton ........................................................................................ 11
2.3.2 Schlumberger .................................................................................... 16
2.4 Technology Design and Mechanism .......................................................... 18
2.4.1 ICD ................................................................................................... 20
2.4.2 ICV ................................................................................................... 22
2.4.3 Sliding Sleeves ................................................................................. 24
2.5 Passive versus Active Inflow Control Completion .................................... 25
2.6 Application of Smart Well Technology ..................................................... 26
2.6.1 Intelligent Injection .......................................................................... 26
2.6.2 Intelligent Gas Lift ........................................................................... 28
2.6.3 Optimal Reservoir Management (Water or Gas Shut-off) .............. 29
2.6.4 Commingled Production ................................................................... 30
2.6.5 Flow Profiling ................................................................................... 31
2.6.6 Dump Flooding ................................................................................. 32
2.6.7 Reservoir Characterization ............................................................... 33
2.7 Benefits of Intelligent Wells ....................................................................... 34

vi
2.8 Real World Case Studies ............................................................................ 35
CHAPTER III SIMULATION WORKFLOW AND METHODOLOGY ........... 37
3.1 Introduction ................................................................................................ 37
3.2 Reservoir Simulation .................................................................................. 38
3.2.1 Reservoir Simulation Overview ....................................................... 38
3.2.2 Reservoir Simulation Benchmarks ................................................... 49
3.3 UNISIM-I-D Benchmark Model ................................................................ 49
3.3.1 Simulation with Commercial Reservoir Simulators ......................... 53
3.4 Methodology/Test Cases ............................................................................ 56
3.4.1 Base Case Scenario ........................................................................... 56
3.4.2 Conventional Water Management Operation ................................... 56
3.4.3 Intelligent Well Modifications ......................................................... 57
3.5 Sensitivity Analysis .................................................................................... 62
3.6 Economic Evaluation .................................................................................. 63
CHAPTER IV RESULTS AND DISCUSSIONS ................................................. 69
4.1 Overview .................................................................................................... 69
4.2 Base Case Scenario ..................................................................................... 69
4.3 Conventional Water Management .............................................................. 72
4.4 Intelligent Well Modifications ................................................................... 76
4.4.1 ON-OFF Control ............................................................................... 77
4.4.2 Feedback ON-OFF Control ............................................................... 80
4.5 Well Analysis ............................................................................................. 84
4.6 Summary ..................................................................................................... 88
4.7 Economic Analysis ..................................................................................... 94
4.8 Sensitivity Analysis .................................................................................... 95
CHAPTER V CONCLUSIONS AND RECOMMENDATIONS ........................ 98
5.1 Conclusions ................................................................................................ 98
5.2 Recommendations ...................................................................................... 99
REFERENCES .................................................................................................... 100
APPENDIX ......................................................................................................... 104
vii
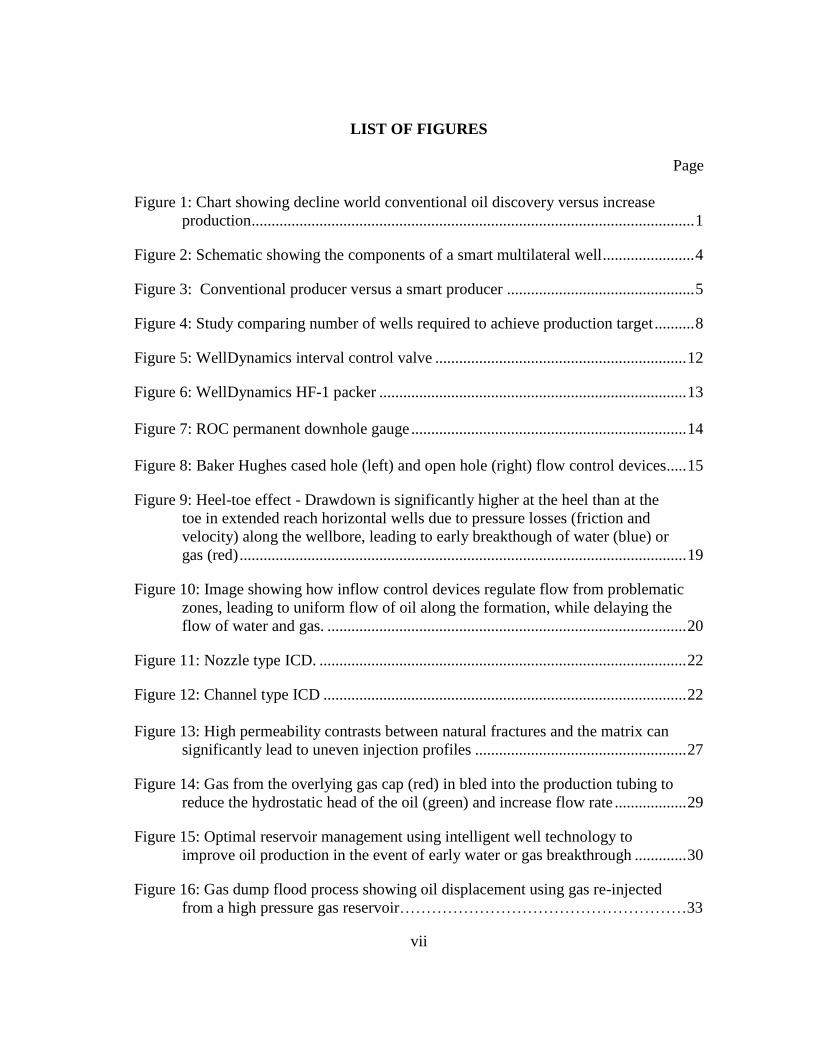
LIST OF FIGURES
Page
Figure 1: Chart showing decline world conventional oil discovery versus increase
production ............................................................................................................... 1
Figure 2: Schematic showing the components of a smart multilateral well ....................... 4
Figure 3: Conventional producer versus a smart producer ............................................... 5
Figure 4: Study comparing number of wells required to achieve production target .......... 8
Figure 5: WellDynamics interval control valve ............................................................... 12
Figure 6: WellDynamics HF-1 packer ............................................................................. 13
Figure 7: ROC permanent downhole gauge ..................................................................... 14
Figure 8: Baker Hughes cased hole (left) and open hole (right) flow control devices..... 15
Figure 9: Heel-toe effect - Drawdown is significantly higher at the heel than at the
toe in extended reach horizontal wells due to pressure losses (friction and
velocity) along the wellbore, leading to early breakthough of water (blue) or
gas (red) ................................................................................................................ 19
Figure 10: Image showing how inflow control devices regulate flow from problematic
zones, leading to uniform flow of oil along the formation, while delaying the
flow of water and gas. .......................................................................................... 20
Figure 11: Nozzle type ICD. ............................................................................................ 22
Figure 12: Channel type ICD ........................................................................................... 22
Figure 13: High permeability contrasts between natural fractures and the matrix can
significantly lead to uneven injection profiles ..................................................... 27
Figure 14: Gas from the overlying gas cap (red) in bled into the production tubing to
reduce the hydrostatic head of the oil (green) and increase flow rate .................. 29
Figure 15: Optimal reservoir management using intelligent well technology to
improve oil production in the event of early water or gas breakthrough ............. 30
Figure 16: Gas dump flood process showing oil displacement using gas re-injected
from a high pressure gas reservoir………………………………………………33

viii
Figure 17: Oil saturation profile on 05/28/2028 ............................................................... 52
Figure 18: Average permeability (PERM X) profile........................................................ 52
Figure 19: Average reservoir porosity profile .................................................................. 53
Figure 20: Graphic showing spiral ICD installation ........................................................ 58
Figure 21: Work flow process used to select smart well technology ............................... 67
Figure 22: Base case field production rates ..................................................................... 70
Figure 23: Base case cumulative field production rates ................................................... 71
Figure 24: Base case field water cut ................................................................................. 72
Figure 25: Field oil and water production rates - Baseline case versus conventional
water control ......................................................................................................... 74
Figure 26: Cumulative field production rates - Baseline case versus conventional
water control ......................................................................................................... 75
Figure 27: Field water cut comparison - Baseline case versus conventional water
control ................................................................................................................... 76
Figure 28: Field production rates - Baseline, conventional water control, and ON-OFF
intelligent control ................................................................................................. 78
Figure 29: Cumulative production rates - Baseline, conventional water control, and
ON-OFF intelligent control .................................................................................. 79
Figure 30: Field water cut comparison ............................................................................. 80
Figure 31: Field production rates - All cases ................................................................... 81
Figure 32: Cumulative field production - All cases ......................................................... 82
Figure 33: Field water cut comparison - All cases ........................................................... 83
Figure 34: Cumulative production rate analysis of well NA1A showing production
times each simulation case ................................................................................... 85
Figure 35: Well NA2 cumulative production showing benefits of intelligent control ..... 86

ix
Figure 36: Well NA3D cumulative production showing accelerated production
benefit of intelligent completions ......................................................................... 87
Figure 37: Well RJS19 cumulative production demonstrating optimized production ..... 88
Figure 38: Field water cut comparison for all simulation cases ....................................... 90
Figure 39: Cumulative oil production comparison for all simulation cases .................... 91
Figure 40: NPV analysis of all four simulation cases…………………………………...94
Figure 41: Field NPV comparison for all cases…………………………………………95
Figure 42: Sensitivity analysis of oil price………..…………………………………….96
Figure 43: Sensitivity analysis of discount rate…………………………………………97

x
LIST OF TABLES
Page
Table 1: UNISIM reservoir description............................................................................ 51
Table 2: Input data file sections in Eclipse simulator describing structure of input files
used in commercial simulators ............................................................................. 55
Table 3: Field economics ..................................................................................................66
Table 4: Summary of field data ........................................................................................90
Table 5: Summary of well data ......................................................................................... 92
Table 6: Summary section keywords...............................................................................104

1
CHAPTER I
INTRODUCTION
1.1 Statement of the Problem and Motivation
Over the last two decades, the oil industry has reveled in a high crude oil price
environment and had often mitigated the forecasts of imminent decline in oil production
by making new discoveries to replace the produced reserves. However in recent years,
there has been a sharp decline in the number of sizable discoveries and the global
competition for depleting resources has mounted significant pressure on the industry. As
seen in figure 1, conventional oil discovery peaked in the 1960’s and has steadily
declined while oil production has steadily increased.
Figure 1: Chart showing decline world conventional oil discovery versus increase
production (February 2006 ASPO newsletter)
2
The need for technology that will better improve reservoir control and management,
sweep efficiency, and increase recovery is more crucial than it has ever been. The recent
volatility and rapid decline in crude prices sent a shock wave of urgency throughout the
industry on the need for companies to adapt their technology to the low price
environment. This message was continuously echoed by top oil and gas executives from
around the world:
In the words of Rex Tillerson, chairman and chief executive officer of ExxonMobil, the
industry should expect “difficult price environment for the next couple of years”
(Rassenfoss, 2015).
“You have to prepare for USD 60 and less......we cut costs by a thirds. Some projects are
going away” – Stephen Chazen, President and CEO of Occidental Petroleum
(Rassenfoss, 2015).
This message was continuously echoed by other top executives at the 2015 HIS
CERAWeek1 conference in Houston Texas, stressing the need for maximizing
production efficiency. Some ways in which companies can reduce cost while improving
recovery efficiency include; improving sweep efficiency, reducing water production,
minimizing well intervention, accelerating production, properly managing mature fields
and reducing capital expenditure (simplifying architecture of well and gas lift
operations). Intelligent well technology offers unique capabilities which when properly
implemented on the right asset, enable the achievement of all of the aforementioned
benefits. This technology offers operators the ability to remotely measure, monitor and
control fluid production (or injection) in real time using downhole control devices,
without the need of any well intervention. With such control capability, gas can directly
1 CERAWeek is an annual energy conference organized by the information and insights Company (HIS)
that provides a platform for discussing a range of energy related topics including global economic outlook,
geopolitics, energy policy and regulation, and climate change.

3
be channeled from a gas producing layer to an oil producing layer below in a gas lift
operation, thus eliminating the need for a separate compressor facility on the surface for
the gas lift operation. Water cut can be remotely measure and problematic layers shut in
thus improving production and sweep efficiency. These are just a few of the many
applications of smart well technology which will be discussed in more detailed later in
this thesis.
The motivation behind this thesis topic is to explore the benefits of smart well
technology, and investigate how this technology can be best applied to help operators
improve recovery, cut operating/capital cost and remain profitable in this volatile price
environment. In this thesis report, the terms smart well technology, intelligent well
technology, and intelligent well completions will be used interchangeably.
1.2 Research Objectives
The main objective of this research study is to demonstrate the potential benefits of
adopting smart well technology in optimizing production. The ultimate goal was to
develop an optimized workflow which can be applied by operators to determine whether
or not the application of smart well technology is economically viable for a particular
petroleum asset under development. This study used simulator algorithms to find the
optimum ICV configuration to minimize water cut and maximize NPV in a field of
producing vertical wells. A simulation of the workflow process is performed using the
UNISIM-I-D benchmark reservoir. The UNISIM-I-D model was chosen over other
benchmark reservoir models like SPE 10, Brugge, Norne and PUNQ because the
reservoir geometry and properties best fit the intended study conditions.
The UNISIM-I-D model used in this study contained with 4 producers and 3 injectors,
and the analysis was performed using a commercial simulator (Eclipse 100). An
economic analysis is then performed to understand the profitability and marginal value
of the different options of intelligent well systems. The entire premise of this research
study is based on the crucial assumption of reliability of the smart well systems. This is

4
critical as the true value of intelligent well systems can only be realized if the system
functionality is maintained over the designed lifetime of the well. So far the current
industry players in this technology have been able to demonstrate sufficient reliability in
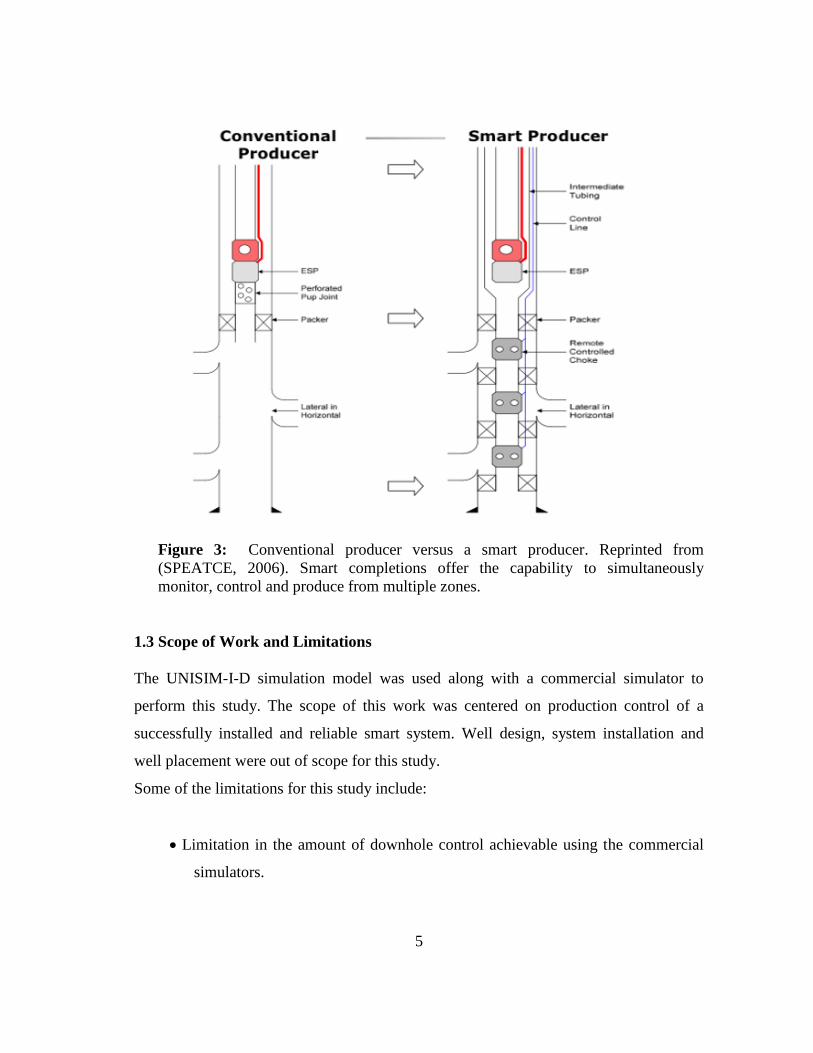
these systems as will be discussed later. Figure 2 shows the three main components of a
smart well system and figure 3 shows a comparison between the architecture of a
conventional producer and a smart producer:
Figure 2: Schematic showing the components of a smart multilateral well. Reprinted
from (Dumville, 2008)
5
Figure 3: Conventional producer versus a smart producer. Reprinted from
(SPEATCE, 2006). Smart completions offer the capability to simultaneously
monitor, control and produce from multiple zones.
1.3 Scope of Work and Limitations
The UNISIM-I-D simulation model was used along with a commercial simulator to
perform this study. The scope of this work was centered on production control of a
successfully installed and reliable smart system. Well design, system installation and
well placement were out of scope for this study.
Some of the limitations for this study include:
Limitation in the amount of downhole control achievable using the commercial
simulators.
6
Limitations to the extent to which operation costs and unforeseen costs can be
incorporated into the NPV analysis
Lack of real life field reliability data to quantify risk of failure of smart well
systems.
1.4 Report Outline
This thesis report is presented in five chapters:
Chapter One presents an overview of the industry challenges and briefly
introduces Intelligent (Smart) Well Completions. The motivation for this
project, expected outcomes, the scope and the limitations of the work are
defined.
Chapter Two provides an in-depth review into the historical development of
Intelligent Well Technology, the key industry players and the technology
design. The applications, benefits and past field experience are also
investigated.
Chapter Three introduces the reservoir system used for this study and outlines
the steps taken to simulate the various scenarios using the Eclipse 100
simulation package. The methodology implemented for the sensitivity analysis,
and economic analysis are also discussed.
Chapter Four presents and discusses the results obtained from the reservoir
simulation exercise.
Chapter Five concludes the research work and provides recommendations for
future work related to intelligent well completions.

7
CHAPTER II
LITERATURE REVIEW
2.1 Overview and Historical Development
Smart well technology also known as intelligent well technology (completions)
generally refers to any sort of downhole monitoring system that has the capability of
collecting, transmitting and analyzing production data, while providing the capability for
remote action control of the production process (PetroWiki, 2015).
Although advancement in computer assisted operations greatly improved reservoir
management and recovery, remote monitoring and control of wells was limited to
hydraulic and electro-hydraulic control of safety valves up until the late 1980’s
(PetroWiki, 2015). The only means of obtaining downhole production data (pressure,
temperature and flow) was through periodic well intervention-based techniques. This
method was certainly undesired as intervention-based logging techniques interrupt
production, are costly and stand the risk of logging equipment getting stuck down hole.
These issues coupled with the declining production from the first generation of subsea
wells in the early 1990’s motivated the drive to find better alternative methods of
obtaining downhole monitoring and control capabilities. However, it wasn’t until 1997
when the first remotely operated hybrid electro-hydraulic well system that had the
capability of real-time pressure and temperature measurement, using permanent
downhole gauges with flow control devices was installed. This installation was
performed on a well at the Saga’s Snorre Field in the North Sea (Greenberg, Jerry,
1999). Since this first installation, there have been significant advancement in the
development of the technology and it has been highly adopted by large companies like
Saudi Aramco and on multiple high stake offshore projects in the North Sea (Hamid,
Osman. “Completion optimization for an unconventional reservoir” Saudi Journal of
Technolgy, 05th August, 2015. Figure 4 shows a study showing a comparison between
smart wells versus conventional wells that were deployed in different developments
8
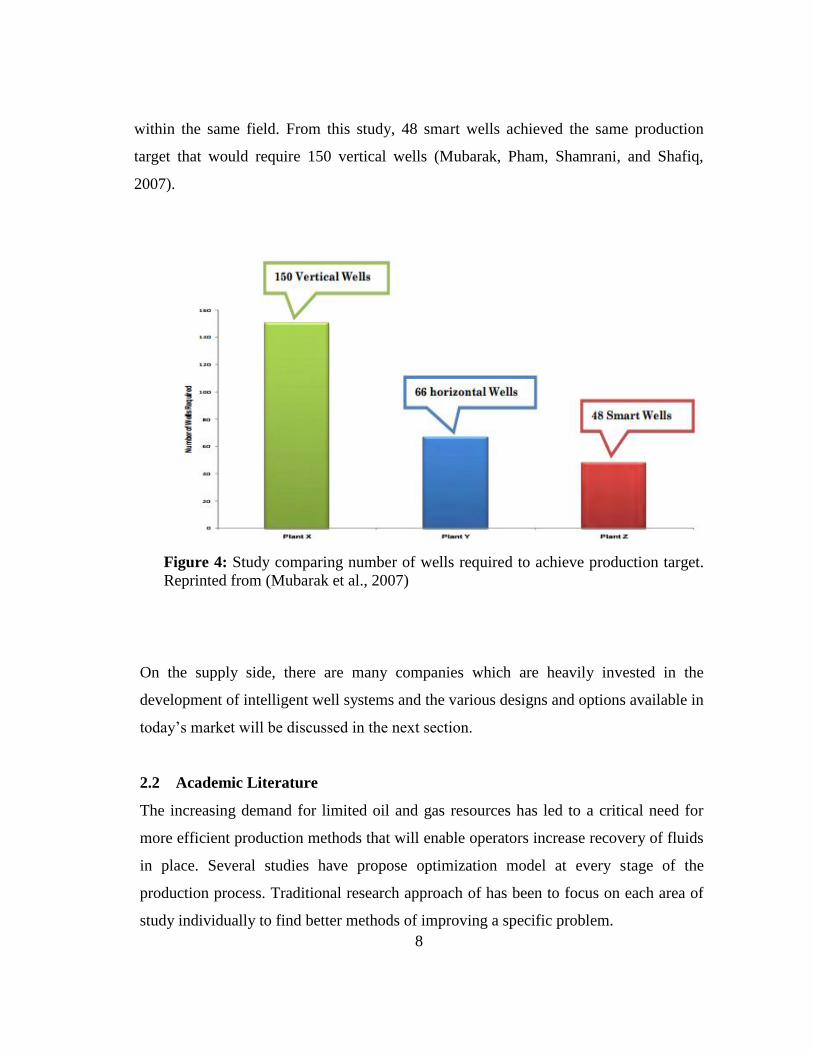
within the same field. From this study, 48 smart wells achieved the same production
target that would require 150 vertical wells (Mubarak, Pham, Shamrani, and Shafiq,
2007).
Figure 4: Study comparing number of wells required to achieve production target.
Reprinted from (Mubarak et al., 2007)
On the supply side, there are many companies which are heavily invested in the
development of intelligent well systems and the various designs and options available in
today’s market will be discussed in the next section.
2.2 Academic Literature
The increasing demand for limited oil and gas resources has led to a critical need for
more efficient production methods that will enable operators increase recovery of fluids
in place. Several studies have propose optimization model at every stage of the
production process. Traditional research approach of has been to focus on each area of
study individually to find better methods of improving a specific problem.

9
Most of the focus has been on conventional subjects such as well placement, pressure
transient analysis of bottom hole pressures and rate measurements, history matching
models and recently, fiber optic sensing methods.
Nasrabadi et al presented a literature survey of well placement optimization with focus
on topics such as optimization algorithms, reservoir response models, uncertainty and
well placement optimization in gas and gas condensate fields (Nasrabadi, Morales and
Zhu, 2012).
Similarly, Park et al. presented a multi-objective optimization approach to determine
pumping rates and well locations to prevent saltwater intrusion, while satisfying desired
extraction rates in coastal aquifers (Park, and Aral, 2004)
Mansoori et al presented a novel approach to the well test (pressure transient analysis)
problem by proposing a bilaterally coupled model that utilizes a two-stage method to
remove wellbore effects and treat noise on well-head flow measurements (Mansoori,
Van den Hof, Jansen and Rashchian, 2015).
Several works have developed optimization techniques for reservoir management.
Sampaio et al implemented proposed a hierarchical hybrid optimization framework that
performs local optimization by implementing proper orthogonal decomposition (POD)
with discrete empirical interpolation method (DEIM). The model employed gradient
based techniques and was tested using the UNISIM-I-D benchmark reservoir model
(Sampaio, Ghasemi, Sorek, Gildin, and Schiozer, 2015).
Similar work on computational models for reservoir optimization was performed by
Jansen (Jansen, 2013). In his work, a gradient-based closed loop reservoir management
algorithm is developed based on the optimal control theory.
Volcker et al. presented a numerical method for solution of large-scale constrained
optimal control problems using a single-shooting method that computes the gradients
using the adjoint method (Volcker, Jorgensen and Stenby, 2011). Volcker et al. also

10
proposed a predictive step size control applied to high order methods for temporal
discretization in reservoir simulation (Volcker, Carsten, Jorgensen, and Bagterp, 2010).
Finally, in his work on fiber optics, Zinati explored how distributed sensing systems can
be used to estimate inflow and reservoir properties (Zinati, 2014).
Unlike the problem specific approach, smart well technology adopts an exhaustive
closed loop approach of optimizing the entire production process rather than focusing on
distinct production issues. Optimization using smart wells has been applied and tested
for both injection and production operations.
Brouwer used the optimal control theory study the dynamic optimization of water flood
in a numerical reservoir using smart wells (Brouwer, 2004).
Experimental studies have also been performed to demonstrate how water alternating gas
(WAG) operations can be optimized in smart wells (Esmaiel, 2007).
A literature review of smart wells and their applications was presented by Gao et al
(Gao, Rajeswaran and Nakagawa, 2007).
The UNICAMP institution has proposed several studies on intelligent well control.
Barreto proposed an optimization methodology for assessing control valve wells in the
selection of oil production strategy (Barreto, 2007-2014).
Mazo performed a water management analysis through control injection wells in
heterogeneous and fractured reservoirs (Mazo, 2009-2013).
2.3 Key Industry Players
Over the past decade, smart well systems have advanced from merely being a prototype
technology to becoming a widely acceptable practice in certain field applications. Smart
well technology has been highly adopted by large companies like Saudi Aramco and has
been successfully implemented on multiple high stake offshore projects in the North Sea.
The main industry players involved in the development of smart well systems include
Halliburton (Well Dynamics and recently acquired Baker Hughes), Schlumberger and
11
collaborative venture by key industry players know as the Intelligent Well Reliability
Group (IWRG). Each manufacture provides unique systems with varying capabilities
and the subsequent sections will delve more into these options.
2.3.1 Halliburton
Traditionally, Halliburton’s well system research and operation was done under its child
company, Welldynamics. With the recent acquisition of Baker Hughes, Halliburton has
significantly increased its hold of market share in the smart well technology business
(Halliburton press release, July 1st, 2008). The following section will assess the
technology offered by Welldyanamics and Baker Hughes.
2.3.1.1 Well Dynamics
Welldynamics introduced the first industry smart well completion in 1997 (Swanger,
“WellDynamics Norge awarded North Sea Advanced Well steering Framework
agreement by hydro” Business wire, 17th May, 2007) and was fully acquired by
Halliburton on July 1st, 2008 (Halliburton press release, July 1st, 2008). According to
Welldynamics, a smart well system is defined as “completion consists of some
combination of zonal isolation devices, interval control devices, downhole control
systems, permanent monitoring systems, surface control and monitoring systems,
distributed temperature sensing systems, data acquisition and management software and
system accessories, that optimizes well production and reservoir management process by
enabling operators to monitor and actively control the reservoir in real time at the sand-
face level, all without any mechanical intervention.” Welldynamics offers a range of
options with varying capabilities for the following system components:
12
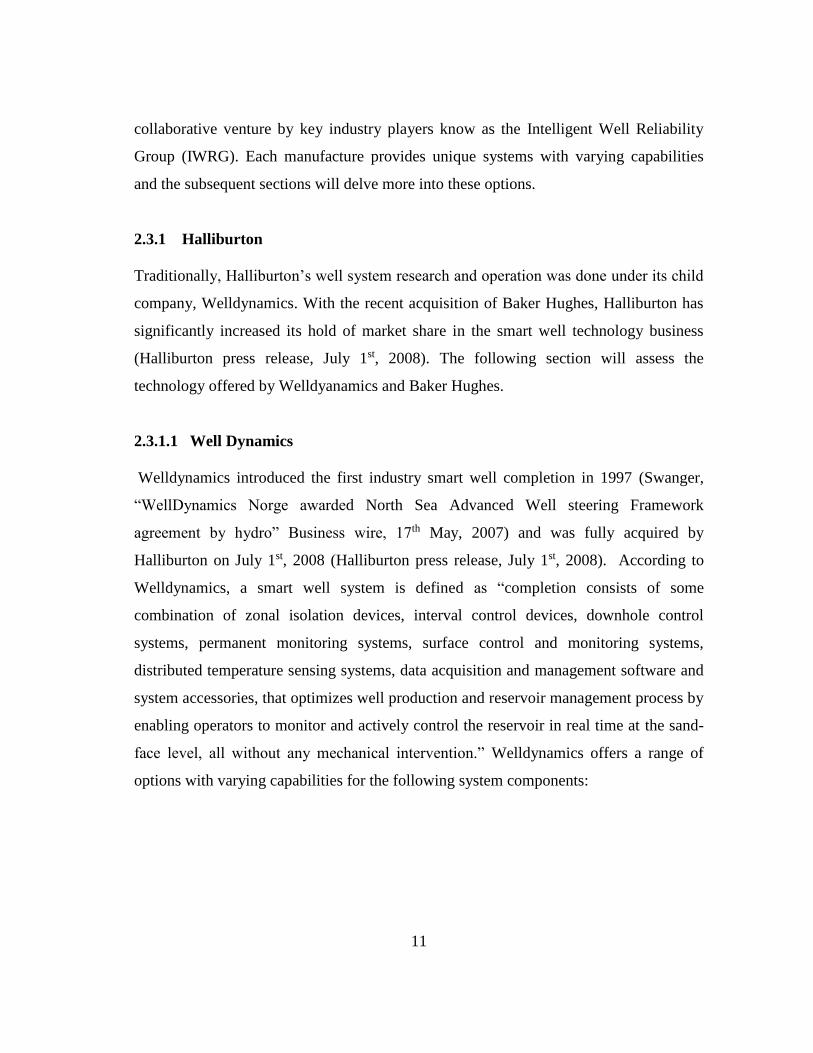
2.3.1.1.1 Interval Control
Interval Control Valves (ICV) provide the capability to control flow into or out of an
isolated reservoir layer. Welldynamics offers a wide range of interval control capabilities
for example the HS-ICV is designed for deep-water operations and can withstand
pressures as high as 15,000 psi and temperatures up to 325 F, while the MCC-ICV is
designed to provide incremental flow control over individual reservoir zones (“Interval
control valves” Halliburton product services, 2015).
Figure 5: WellDynamics interval control valve. Reprinted from (“Interval control
valves” Halliburton product services, 2015)
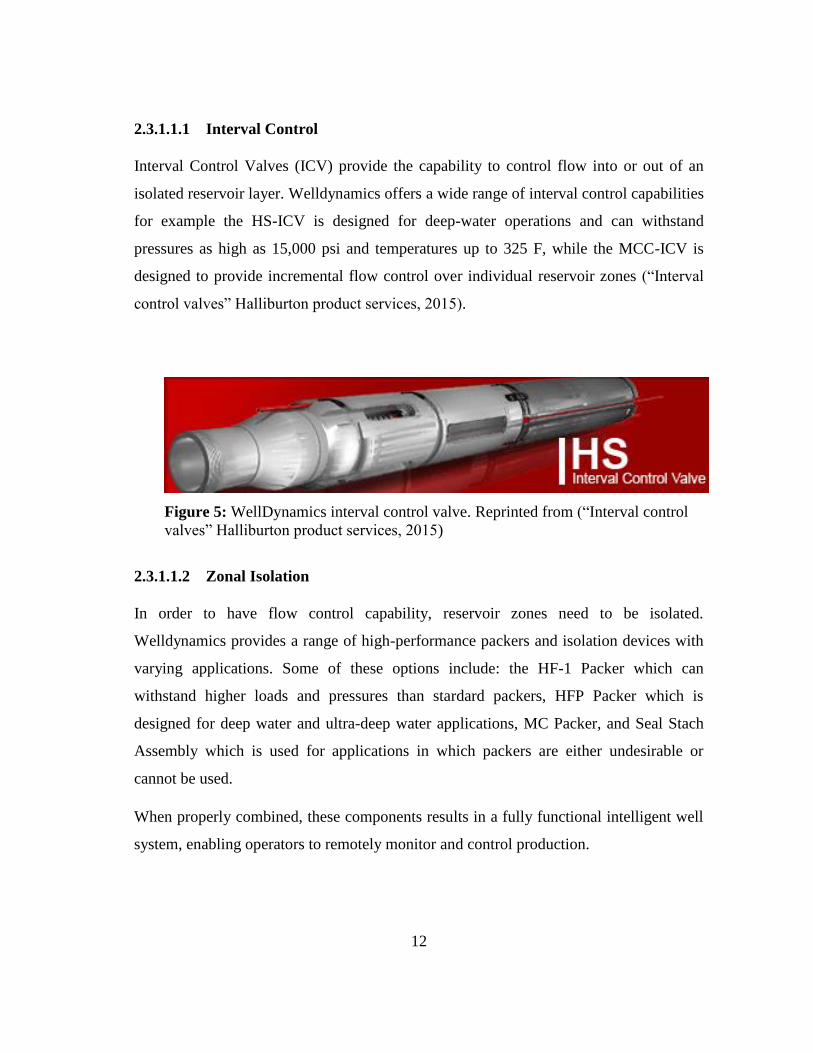
2.3.1.1.2 Zonal Isolation
In order to have flow control capability, reservoir zones need to be isolated.
Welldynamics provides a range of high-performance packers and isolation devices with
varying applications. Some of these options include: the HF-1 Packer which can
withstand higher loads and pressures than stardard packers, HFP Packer which is
designed for deep water and ultra-deep water applications, MC Packer, and Seal Stach
Assembly which is used for applications in which packers are either undesirable or
cannot be used.
When properly combined, these components results in a fully functional intelligent well
system, enabling operators to remotely monitor and control production.
13
Figure 6: WellDynamics HF-1 Packer (Reprinted from Well Dynamics website)
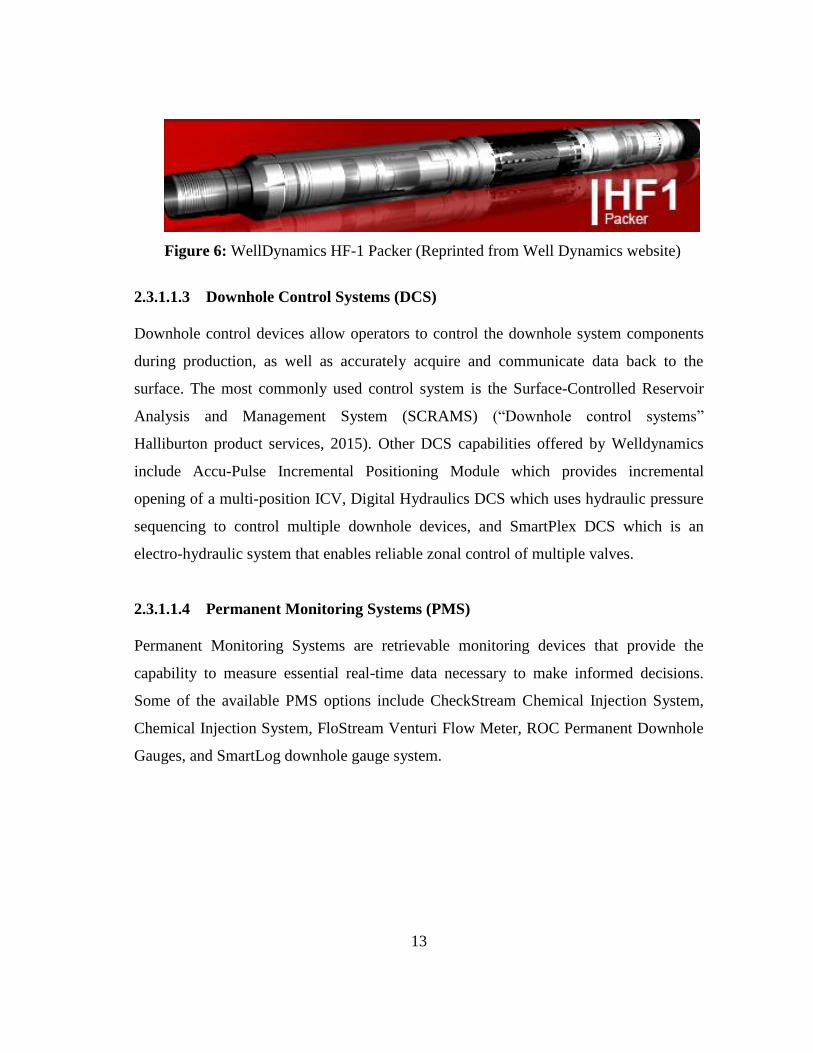
2.3.1.1.3 Downhole Control Systems (DCS)
Downhole control devices allow operators to control the downhole system components
during production, as well as accurately acquire and communicate data back to the
surface. The most commonly used control system is the Surface-Controlled Reservoir
Analysis and Management System (SCRAMS) (“Downhole control systems”
Halliburton product services, 2015). Other DCS capabilities offered by Welldynamics
include Accu-Pulse Incremental Positioning Module which provides incremental
opening of a multi-position ICV, Digital Hydraulics DCS which uses hydraulic pressure
sequencing to control multiple downhole devices, and SmartPlex DCS which is an
electro-hydraulic system that enables reliable zonal control of multiple valves.
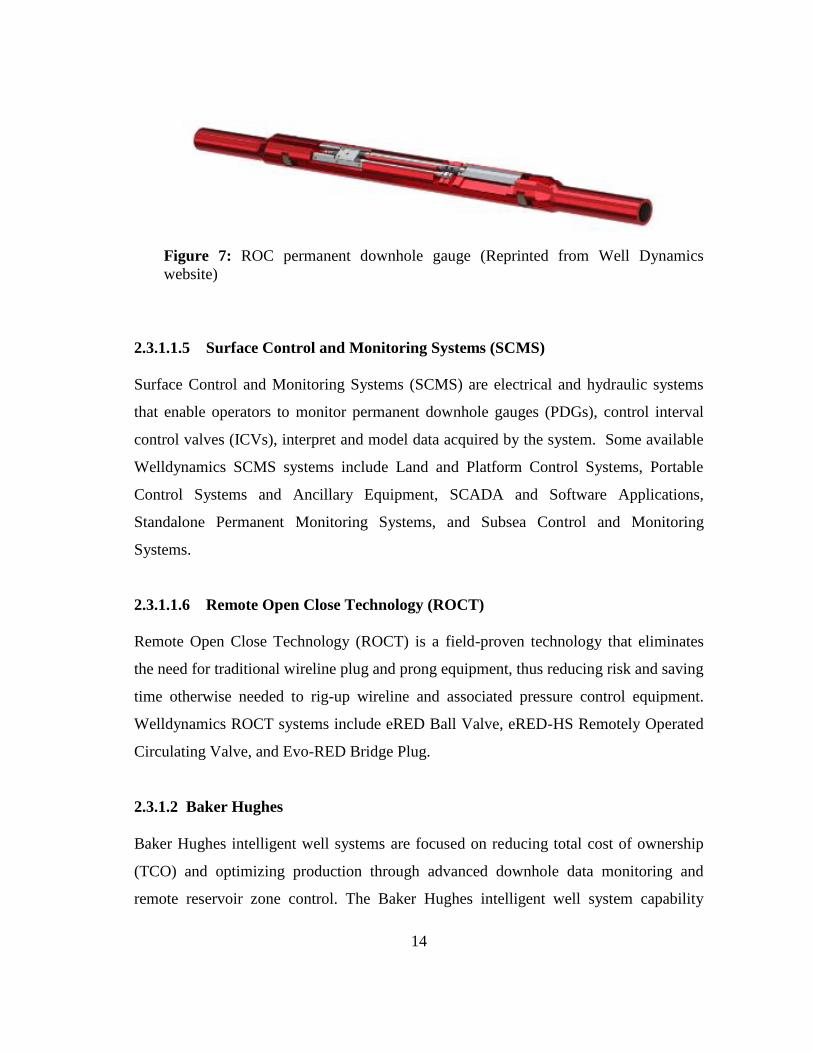
2.3.1.1.4 Permanent Monitoring Systems (PMS)
Permanent Monitoring Systems are retrievable monitoring devices that provide the
capability to measure essential real-time data necessary to make informed decisions.
Some of the available PMS options include CheckStream Chemical Injection System,
Chemical Injection System, FloStream Venturi Flow Meter, ROC Permanent Downhole
Gauges, and SmartLog downhole gauge system.
14
Figure 7: ROC permanent downhole gauge (Reprinted from Well Dynamics
website)
2.3.1.1.5 Surface Control and Monitoring Systems (SCMS)
Surface Control and Monitoring Systems (SCMS) are electrical and hydraulic systems
that enable operators to monitor permanent downhole gauges (PDGs), control interval
control valves (ICVs), interpret and model data acquired by the system. Some available
Welldynamics SCMS systems include Land and Platform Control Systems, Portable
Control Systems and Ancillary Equipment, SCADA and Software Applications,
Standalone Permanent Monitoring Systems, and Subsea Control and Monitoring
Systems.
2.3.1.1.6 Remote Open Close Technology (ROCT)
Remote Open Close Technology (ROCT) is a field-proven technology that eliminates
the need for traditional wireline plug and prong equipment, thus reducing risk and saving
time otherwise needed to rig-up wireline and associated pressure control equipment.
Welldynamics ROCT systems include eRED Ball Valve, eRED-HS Remotely Operated
Circulating Valve, and Evo-RED Bridge Plug.
2.3.1.2 Baker Hughes
Baker Hughes intelligent well systems are focused on reducing total cost of ownership
(TCO) and optimizing production through advanced downhole data monitoring and
remote reservoir zone control. The Baker Hughes intelligent well system capability
15
consists of three main components namely; well monitoring instrumentation, intelligent
completion technologies, and automated chemical application (“Intelligent Well
Systems”, Baker Hughes oilfield services, 2015).
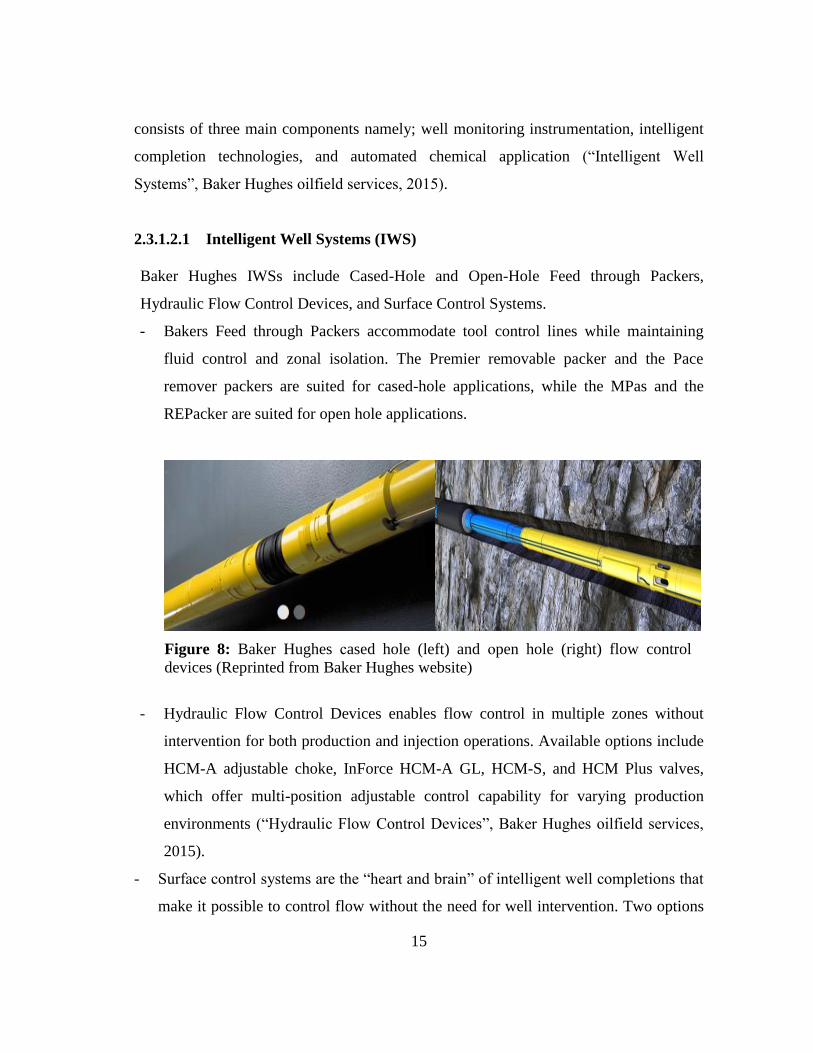
2.3.1.2.1 Intelligent Well Systems (IWS)
Baker Hughes IWSs include Cased-Hole and Open-Hole Feed through Packers,
Hydraulic Flow Control Devices, and Surface Control Systems.
- Bakers Feed through Packers accommodate tool control lines while maintaining
fluid control and zonal isolation. The Premier removable packer and the Pace
remover packers are suited for cased-hole applications, while the MPas and the
REPacker are suited for open hole applications.
Figure 8: Baker Hughes cased hole (left) and open hole (right) flow control
devices (Reprinted from Baker Hughes website)
- Hydraulic Flow Control Devices enables flow control in multiple zones without
intervention for both production and injection operations. Available options include
HCM-A adjustable choke, InForce HCM-A GL, HCM-S, and HCM Plus valves,
which offer multi-position adjustable control capability for varying production
environments (“Hydraulic Flow Control Devices”, Baker Hughes oilfield services,
2015).
- Surface control systems are the “heart and brain” of intelligent well completions that
make it possible to control flow without the need for well intervention. Two options
16
exist for the InForce surface control system (SCS); the standard SCS which is a
pneumatically driven and manually operated SCS designed for simple completions.
The other option is the fully-automated SCS which has a built in programmable logic
controller (PLC) and is used alongside the supervisory control and data acquisition
system (SCADA), in more complex completion configurations that require remote
operation (“Surface control systems”, Baker Hughes oilfield services, 2015).
2.3.1.2.2 Well Monitoring Instrumentation
Baker Hughes well monitoring portfolio includes electronic, fiber–optic and Electronic
Submersible Pump (ESP) monitoring systems. These systems offer operators the
capability to obtain real-time pressure, temperature, flow, fluid density, vibration,
acoustic and wellbore stress data that help minimize operational risk and overhead costs
(“Well Monitoring Solutions”, Baker Hughes oilfield services, 2015).
- The ESP monitoring system is marketed around improved performance, reliability,
reliable downhole data acquisition and extended run life. This is achieved by
providing optimum drawdown, thermal cycling and preventing pump-off. The
current available portfolio of ESP monitoring systems include WellLIFT N,
WellLIFT H, WellLIFT HP, WellLIFT E, SureVIEW, and SureSENS systems. The
SureVIEW and SureSENS systems are designed for high pressure and high
temperature applications.
- The Electonic Well Monitoring systems include SureSENS permanent gauge
systems, SureFLO flow measurements systems, and the StageWatch retrievable
gauge systems. Each of these systems have multiple options of variable capabilities,
depending on the application.
2.3.2 Schlumberger
The Schlumberger definition of intelligent completions is a system that “incorporates
permanent downhole sensors and surface controlled downhole flow control valves,
enabling operators to monitor, evaluate, and actively manage production (or injection) in
17
real time without any well interventions.” Schlumberger’s inventory for intelligent well
technology includes; Intellizone Compact Modular Multizonal Management System
(ICMMMS), Downhole Flow Control Valves (DFCV), Zonal Isolation, Permanent
Monitoring Systems (PMS) and Multitrip connectors (“Intelligent Completions”,
Schlumberger Services & Products).
- The ICMMMS integrates an advanced design and production modeling engine, a
completion module and a remote operating system in a single compact unit. The
system reduces the number of hydraulic lines required while maintaining the
capability to control the same number of valves. Valve position is controlled from a
surface control system programmed with control logic.
- Downhole flow control valves include on/off, multiposition, annular and inline flow
control valves that can either be operated manually, automatically or remotely.
Several design options of flow control valves (FCV) are available for a wide range of
applications. These include; TRFC-HD Multiposition FCV, TRFC-HN Single Line
Multiposition FCV, TRFC-HB Binary position FCV, and WRFC-H Wireline-
Retrievable FCV.
- Zonal isolation
Schlumberger multiport parkers are designed to prevent fluid loss, enhance safety
and protect against formation damage in multizone wells. The XMP Premium
MultiPort and MRP-MP MultiPort series are tubing-conveyed, hydraulically set
retrievable packers, and are designed for hydraulic control and electric conduit
applications. The Quantum Multiport packer is also hydraulically set and is designed
for bypass applications.
- Permanent monitoring systems integrate advanced permanent downhole
measurement systems with surface data acquisition systems to enable real time
remote well monitoring capability. The Schlumberger PMS catalog is divided into
Permanent downhole gauges and Distributed Measurement Systems
o Permanent Downhole Gauges provide for “highly accurate, stable, and reliable
point measurements of pressure, temperature, flow rate, and fluid density.” These
18
include Pressure and Temperature gauges, FlowWatcher Flow Rate, Fluid Density
and PT Monitoring System.
o The Distributed Measurement Systems include fiber-optic temperature sensing
systems, temperature and pressure gauges that provide information on the
location, time and reason for any changes in flow. These systems include the
WellWatcher Neon DTS & PT Gauge System, WellWatcher BriteBlue Multimode
DTS Fiber, and WellWatcher Flux Digital Temperature Array and PT Gauge
system.
- Schlumberger’s Hydraulic Line Wet Mate (HLWM) multitrip connector system
provides operators the ability to install intelligent completion assemblies in the lower
completions while maintaining communication with the upper completions
2.4 Technology Design and Mechanism
As a result of the need to increase productivity and maximize efficiency, extended-reach
and multilateral horizontal wells are increasingly being used as a means of achieving
increased reservoir contact. These complex wells provide several advantages such as
increasing the available drainage area, improving well productivity, optimizing sweep
efficiency, and delaying water or gas breakthrough. Augmented reservoir contact
enables operators to achieve similar production rates as conventional wells using less
drawdown pressure (Ellis et al, 2010).
However, in complex and highly heterogeneous reservoir systems, such complex wells
are accompanied by high risk and uncertainty if not designed and managed properly. In
some reservoirs with extended reach wells, the heel-toe effect is a common issue which
often leads to an early end of a well productive life, leaving back undisplaced reserves.
The heel-toe effect is a situation in which significantly higher drawdown pressures are
experienced at the heel that at the toe of a horizontal well, leading to unequal inflow
along the well path (Ellis et al, 2010). As a result of higher drawdown (and consequently
flow) in the heel, water or gas breakthrough is accelerated in this region leading to an
early end of well productive life. Carbonate reservoirs are especially vulnerable to this
19
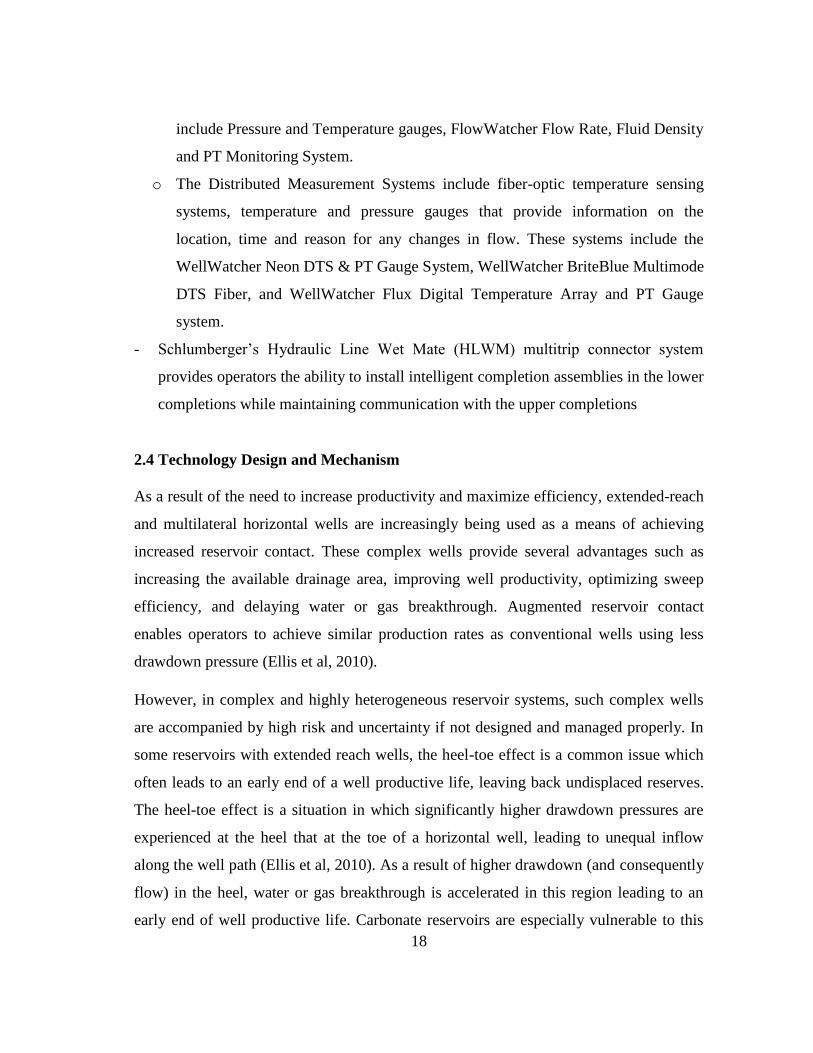
condition as they tend to have higher levels of heterogeneity (Ellis et al 2010). The
figures below presents a visual demonstration of heel-toe effect in a horizontal section,
and a possibly remedy by using ICDs.
Figure 9: Heel-toe effect - Drawdown is significantly higher at the heel than at the
toe in extended-reach horizontal wells due to pressure losses (frictional and velocity)
along the wellbore, leading to early breakthrough of water (blue) or gas (red). This
leads to an early end of the productive well life, leaving back undisplaced oil (oil).
Adapted from (Ellis et al 2010)
Early gas
breakthrough
Early water
breakthrough

20
Figure 10: Image showing how inflow control devices regulate flow from
problematic zones, leading to uniform flow of oil along the formation, while
delaying the flow of water and gas. Adapted from (Ellis et al, 2010)
It is therefore critical to thoroughly understand and have adequate control over each
producing zone in the reservoir. In this section, the three main methods through which
remote zonal control is achieved will be presented and discussed.
2.4.1 ICD
Inflow control devices (ICD) are passive components of a well completion which are
used to optimize production by creating a uniform inflow profile along the entire section
of a horizontal well. This is achieved by creating flow restrictions on high flow-rate
zones (and of highly mobile phases), while simultaneously stimulating flow low
producing zones (and of less mobile phases). This restriction controls the flow of the
different phases by varying the pressure drop as needed. Liquid flow in porous media is
usually in the laminar flow regime, resulting in a linear relationship between flow
velocity and pressure drop. However, the flow across ICDs lies in the turbulent regime
(high Reynolds number), therefore the flow velocity-pressure relationship is quadratic.
The ICD changes the flow regime from Darcy radial flow within the reservoir to a
21
restrictive pressure drop flow across the ICD (Ellis et al 2010). Several type of ICDs
exists, based on the method of achieving this pressure drop.
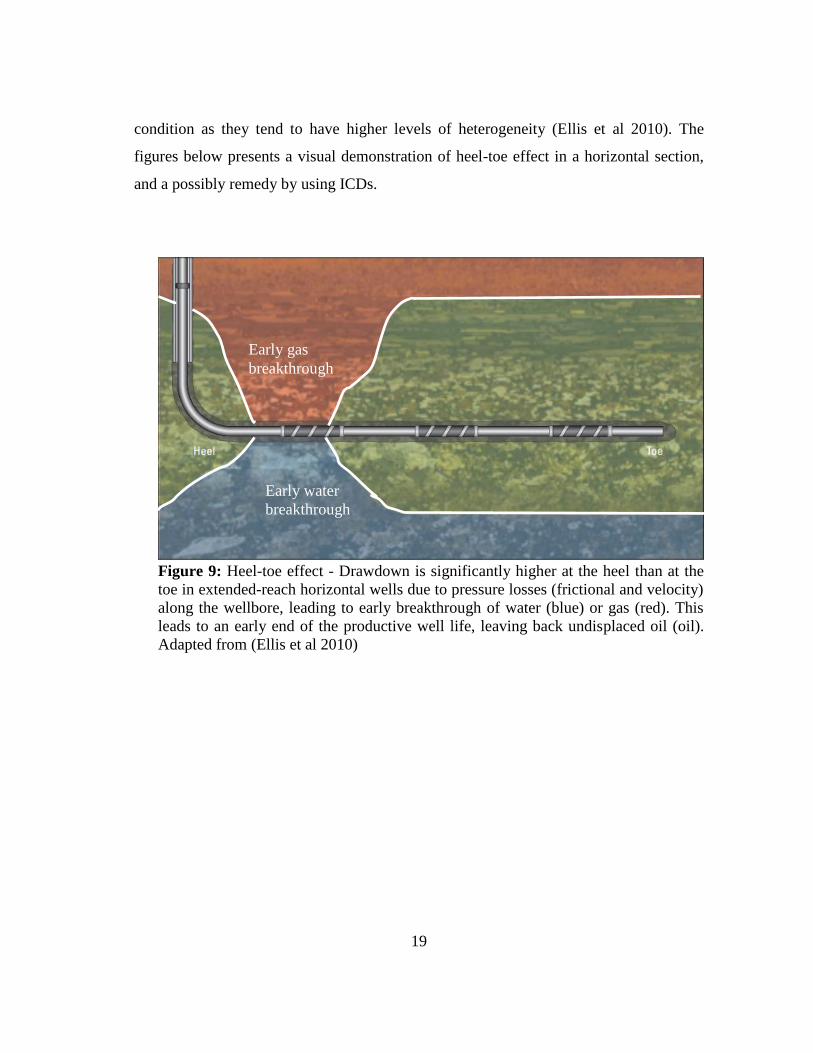
2.4.1.1 Nozzle (Orifice) Type ICD
Nozzle type ICDs contain orifices with preset diameters through which fluid flows to
provide a pressure drop. The pressure drop is a function of the flow rate and the fluid
properties and is determined by the friction against the channel surface as fluid is forced
to flow through (Ellis et Al, 2010). Nozzle type ICDs are self-regulating and operate
independently of the formation heterogeneity or the fluid composition (water, or gas). As
stated earlier, nozzle type ICD’s function based on fluid flow rates which are determined
by fluid properties (viscosity and density). In the event of an early breakthrough in a
highly permeable production zone, more mobile fluids like gas and water flow into the
wellbore at higher velocities than oil. This raises the friction on the surface of the
channels as the fluids force their way through, increasing the backpressure at that point.
As a result, the entry of formation fluid into the well bore in that high-permeability zone
is slowed down, preventing water and gas from being produced before valuable oil
reserves in less permeable zones. This ultimately increases the sweep efficiency, thus
improving oil recovery. The ICD’s resistance is to flow is determined by the dimensions
of the nozzles and this is set before installation and cannot be adjusted without
recompletion once installed downhole.
22
Figure 11: Nozzle type ICD. The red arrows represent fluid flowing from the
formation through screens and along the annulus between the screens and pipe.
It then enters the production tubing through a restriction.
(Reprinted from Oilfield Review, Winter 2010)
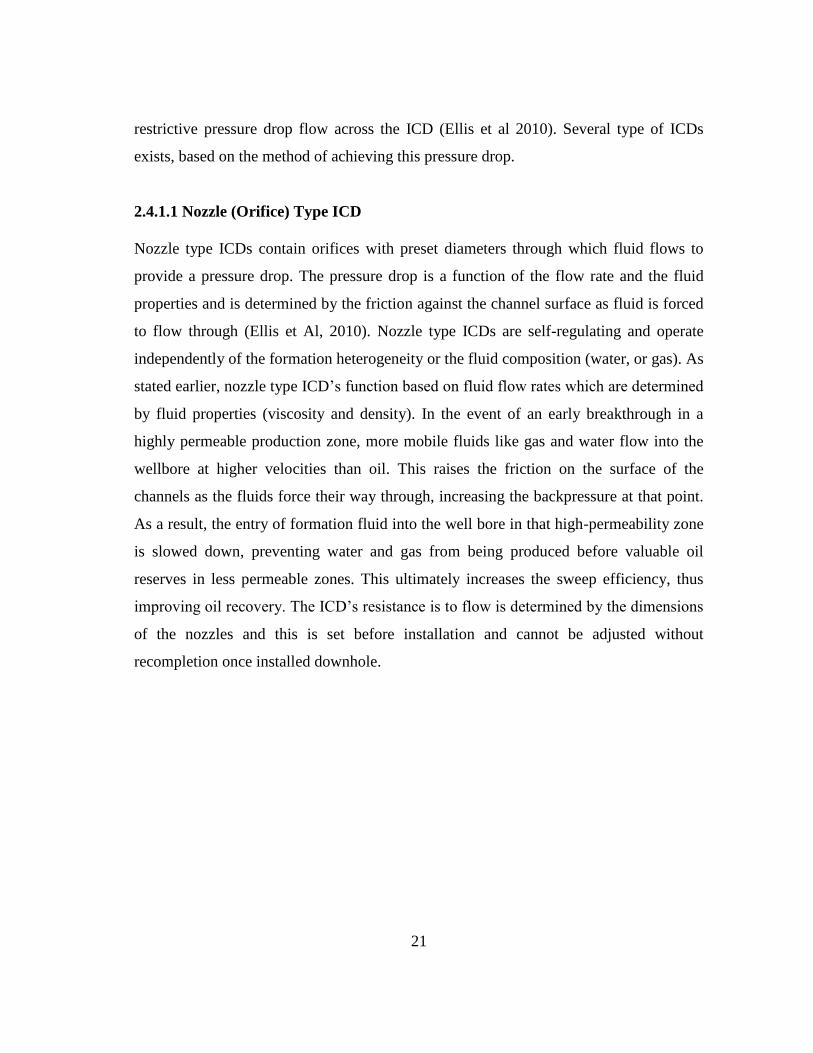
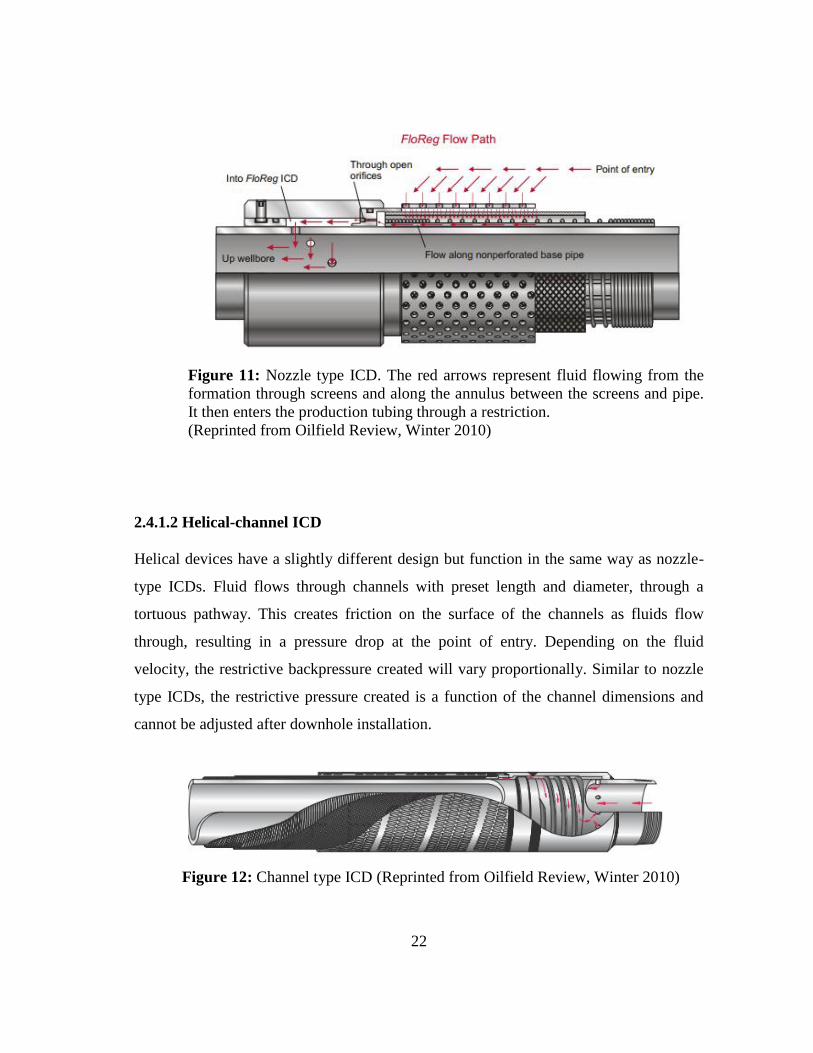
2.4.1.2 Helical-channel ICD
Helical devices have a slightly different design but function in the same way as nozzle-
type ICDs. Fluid flows through channels with preset length and diameter, through a
tortuous pathway. This creates friction on the surface of the channels as fluids flow
through, resulting in a pressure drop at the point of entry. Depending on the fluid
velocity, the restrictive backpressure created will vary proportionally. Similar to nozzle
type ICDs, the restrictive pressure created is a function of the channel dimensions and
cannot be adjusted after downhole installation.
Figure 12: Channel type ICD (Reprinted from Oilfield Review, Winter 2010)

23
2.4.2 ICV
As the name suggests, Inflow Control Valves (ICV) are downhole flow-control valves
which are remotely operated from the surface by hydraulic, electric or a hybrid (electro-
hydraulic) actuation system (Al-Khelaiwi et al. 2010). This is a key component of
intelligent well systems as ICVs have the ability to choke or completely shut off fluid
flow from the reservoir into the wellbore. The ICV system consists of five main
components; the control valve itself, gauges to monitor flow, surface control equipment,
control lines and connectors itself (Al-Khelaiwi et al. 2010). Detail of the different
modifications of ICVs readily available on market were presented in the “key industry
players” section. Generally there are two main configurations of ICVs, with several
variations in between;
2.4.2.1 Simple On/Off ICV
On/off ICVs are restricted to two modes of operation; the “on” positions where fluids are
allowed to flow freely without restriction into or out of the well bore. The “off” position
is the other end of the operation and when activated, fluids are completely restricted and
flow into or out of the wellbore is completely shutoff.
2.4.2.2 Variable Control ICV
Variable control valves are more advanced and operationally complex than the simple
on/off ICVs. Variable control ICVs provide operators the ability to remotely choke fluid
flow into or out of the wellbore. The valve position can be adjusted to several positions
to obtain the desired fluid flow rates. This is the main difference between ICVs and
ICDs as unlike with ICDs, the diameter of the downhole flow path for an ICV can be
adjusted without intervention. This capability is especially valuable for production
management from multiple producing zones of different permeability into the same
wellbore.

24
In order to fully realize the value of an ICV it must be designed to achieve four main
functions (Rahman et al. 2012):
The sealing technology must be robust enough to handle all loading and
unloading events for the entire operational life of the well
Maintain pressure balance during operation
Withstand and maintain tension and compression integrity of the completion
Provide capability for quantifying fluid flow characteristics
To improve efficiency, ICVs are often equipped with monitoring devices to proactively
detect water or gas breakthrough early enough to remotely initiate the choking of the
unwanted fluids. The zonal location on where the ICV is place in the reservoir system is
a critical parameter that requires close collaboration and input from geologists to be
thoroughly understood. ICVs should be places in zones where early water and gas
breakthrough are most probable.
2.4.3 Sliding Sleeves
Sliding sleeves have been the tradition method used to selectively shut off unwanted
fluid (water or gar) production (Erlandsen and Omdal 2008). Operational, sliding
sleeves are similar to on/off ICVs, strictly providing zero or full restriction of fluid flow
into or out of the wellbore. However, although proven to be robust sliding sleeves are
economically limited as well intervention is required to access and operate (open or
shut) the device. This limitation historically led to the continuous improvement of the
design and eventually the development of ICVs.
25
2.5 Passive versus Active Inflow Control Completion
Fluid flow control in smart wells can be either passive or proactive. The development of
smart completions and advancement of smart well technology components like ICVs
have enabled operators to go from traditional passive/reactive production to more
active/proactive control. Sliding sleeves and ICDs restrict influx of unwanted fluids like
water and gas upon breakthrough however, these devices are limited by the fact that they
only provide full flow or restriction capabilities and the flow paths cannot be adjusted
once deployed downhole. With more advanced technology like ICVs, proactive
production techniques such as imposing a pressure profile along the well bore based on
down-hole measurements are possible (Jansen, 2001). The imposed pressure profile and
reservoir models can be continuously updated during production to improve recovery
efficiency. Nevertheless, full realization of such potential requires the development of
robust computational tools to enable the continuous revision of conventional production
scenarios. Several studies have been proposed on closed loop reservoir management to
enable continuous optimization during production (Jansen, 2013), Bjarne et al. (2011)
and Sarma (2006).
Several works have developed optimization techniques for reservoir management.
Sampaio et al implemented proposed a hierarchical hybrid optimization framework that
performs local optimization by implementing proper orthogonal decomposition (POD)
with discrete empirical interpolation method (DEIM). The model employed gradient
based techniques and was tested using the UNISIM-I-D benchmark reservoir model
(Sampaio, Ghasemi, Sorek, Gildin, and Schiozer, 2015).
Similar work on computational models for reservoir optimization was performed by
Jansen (Jansen, 2013). In his work, a gradient-based closed loop reservoir management
algorithm is developed based on the optimal control theory.
Several studies on reservoir optimization using intelligent well control have been
presented by the UNICAMP institution. Barreto proposed an optimization methodology
for assessing control valve wells in the selection of oil production strategy (Barreto,

26
2007-2014). Mazo performed a water management analysis through control injection
wells in heterogeneous and fractured reservoirs (Mazo, 2009-2013).
Equipped with the right personnel and resources, the value of proactive production
methods can be fully realized and production efficiency significantly improved.
2.6 Application of Smart Well Technology
As discussed in the previous sections, smart well technology has the potential of
significantly improving reservoir control and management, sweep, and recovery
efficiency. However, the profitability of Smart Well Technology and extent to which it
enhances fluid production is highly dependent on the inherent reservoir properties. From
experience, highly heterogeneous reservoirs with variable fluid delivery from each zone
have proven to be suitable for the application of Smart Well technology. Research
studies have been performed to show that recovery can be significantly increased by
changing reservoir management from a ‘batch-type’ to a closed loop near-continuous
model-based control activity (Jansen, 2013).
In this section, the possible application of smart well completions will be discussed to
further demonstrate the value proposition. It is assumed that the field under investigation
has been properly assessed and confirmed to be suitable for the application of the
technology.
2.6.1 Intelligent Injection
Maintaining pressure support is critical to hydrocarbon recovery and achieving target
production rates. In the absence of natural pressure support such as aquifers or a gas cap,
many oil fields rely on injection to provide the required pressure for the drive
mechanism to occur. However, the injection flow profile is rarely uniform, especially in
naturally fractured carbonates (Schlumberger Middle East & Asia Reservoir review,
2007). In such reservoir systems, the high permeability contrast between the natural
fractures and the matrix cause most of the injected fluids to be captured by high

27
permeability streaks, significantly leading to uneven injection profiles and poor sweep
efficiency (Figure 13).
Figure 13: High permeability contrasts between natural fractures and the matrix can
significantly lead to uneven injection profiles. Reprinted from (Schlumberger Middle
East & Asia Reservoir review, 2007)
For such highly heterogeneous reservoirs, intelligent completion systems such as the
Shclumberger ResInject can regulate the injection rate along the well bore to create a
more even injection profile. The ResInject is a nozzle type ICD as described in earlier
sections. Fluids enter pass through the nozzles into the reservoir, creating a pressure drop
which is calculated by the nodal analysis software. The nozzles self-regulate to reduce
the injection of fluids into theft zones (high-permeability streaks), at the same time
increasing the injection into low permeability zones. This advanced operational control
allows operators to simultaneously manage multiple injection zones, achieve more
uniform injection profiles, delay water break through and ultimately increase oil
recovery.
28
2.6.2 Intelligent Gas Lift
Operators rely on gas lift to increase oil production rates in heavy oil production
operations or to enable “dead” wells to flow. Traditionally, gas compression facilities
pump gas from the surface down the annulus of the well which then changes the flow
properties of the oil downhole, reducing hydrostatic head and thus enabling higher flow
rates to be achieved. This process requires substantial capital investment equipment
(pumps, compressors etc.) for the surface facility.
In reservoir systems with a gas cap, intelligent completions can help eliminate the capital
investment required for the surface facility in a traditional gas cap operation. In an
intelligent gas lift operation, the gas-bearing zone can be completed and equipped with
an intelligent well system. This allows the lift gas to be produced and bled into the
production tubing at a controlled rate through the downhole flow valves (Schlumberger
Middle East & Asia Reservoir review, 2007). Intelligent gas lift is also commonly
referred to as auto, in situ or natural gas lift. If executed well, intelligent gas lift
generates additional value by completely eliminating the cost, risks and platform load
requirements associated with surface gas compression facilities, providing a means of
controlling gas coning, and eliminating the need for interventions to place traditional gas
lift equipment.

29
Figure 14: Gas from the overlying gas cap (red) in bled into the production tubing to
reduce the hydrostatic head of the oil (green) and increase flow rate. Reprinted from
(Schlumberger Middle East & Asia Reservoir review, 2007).
2.6.3 Optimal Reservoir Management (Water or Gas Shut-off)
The value of an oil well depends on how much oil can be recovered after all the related
cost inquired to produce the oil have been accounted for. A big part of the expense for
every producer is the cost to treat and dispose of the produced water. In highly
heterogeneous reservoir systems with high permeability contrast, horizontal barriers and
strong water drive, early breakthrough can significantly increase the amount of water
30
produced. High water production rates can lead to the early end of life of a well due to
the high cost of water treatment, leaving behind undisplaced hydrocarbons. Using smart
well technology, early water breakthrough can be detected using the temperature and
pressure sensors in the downhole ICVs. Excessive water production can be controlled by
completely shutting off or choking zones that breakthrough early. This can also be
applied to control early gas influx into the well in situations where a gas drive (gas cap)
is present and gas production is not desired (Schlumberger Middle East Reservoir
Review, 2007).
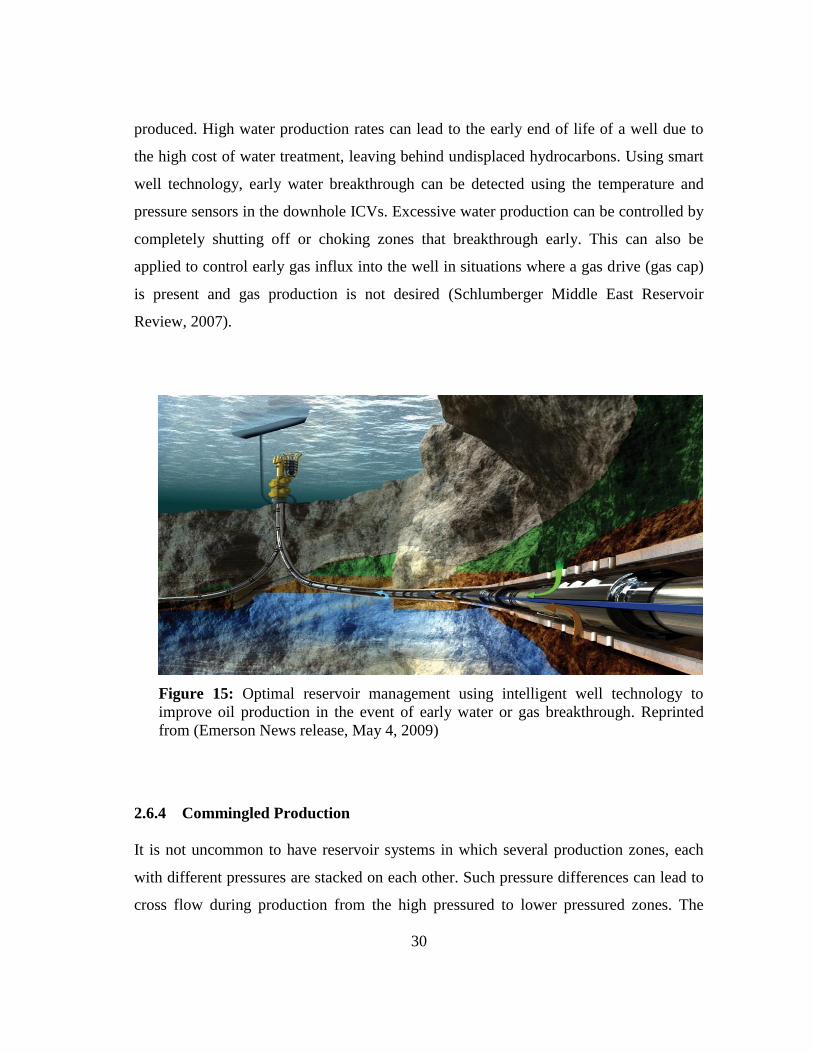
Figure 15: Optimal reservoir management using intelligent well technology to
improve oil production in the event of early water or gas breakthrough. Reprinted
from (Emerson News release, May 4, 2009)
2.6.4 Commingled Production
It is not uncommon to have reservoir systems in which several production zones, each
with different pressures are stacked on each other. Such pressure differences can lead to
cross flow during production from the high pressured to lower pressured zones. The
31
conventional way of working around this issue will be to produce sequentially. This
could be achieved by either shifting a sleeve on a wire line (or coiled tubing), or through
work over and reperforation (Jansen, 2001). Work overs can be significantly more
expensive especially in deep water operations where time saving is a critical factor.
Additionally, government regulations in some areas require that production from each
zone be independently accounted for, making it a challenge when there is uncontrolled
cross flow between layers.
Using smart well technology, commingled production can be achieved by choking the
flow from high pressured zones to avoid cross flow to low pressured zones (Jansen,
2001). This allows vertically stacked layers with different pressure profiles to be
simultaneously produced, while adhering to regulation. Additional benefits include
accelerated production and eliminating the need of work overs, both of which
significantly add production value especially in deep water operations.
2.6.5 Flow Profiling
Collecting and understanding flow profile data of a well is critical for developing
accurate reservoir models. Well testing is one of the most common methods used to
evaluate well conditions and reservoir characteristics (Paino et al., 2004). However, well
testing is expensive as it is time consuming and usually involves interrupting normal
production. Also, conventional methods are risky as trips need to be made to deploy
equipment downhole for data collection. This also interrupts production making the data
collection very expensive and sometimes inadequate due to limits on how long
production can be interrupted. Smart completions are equipped with permanent
downhole pressure sensors, thus the need for making trips or interrupting production is
eliminated. Live pressure data can be constantly collected during production.
Additionally, fiber optic technology which is integrated with smart well technology
enables the operators collect temperature data and thus have a better understanding of
the flow profile along the production tubing. Cui et al. proposed a diagnosis for multiple

32
fracture stimulation in Horizontal Wells by Downhole Temperature Measurements (Cui
and Zhu, 2014).
2.6.6 Dump Flooding
Dump flooding is a recovery enhancement technique that has been practiced in the
industry to reduce capital and overhead costs associated with traditional water flooding
by injection. The concept of dump flooding utilizes pressure from gas or water zones to
improve sweep efficiency and maintain the reservoir pressure. Submersible pumping
systems (ICDs) installed downhole in the wellbore are used to redirect water from an
acquifer or gas from a gas cap along an isolated pathway into the main reservoir system.
This method minimizes the costs associated with surface injection facilities, which are
needed in conventional flooding methods. Similarly, the use of ICVs provides the
operator with sufficient control to maximize the leverage of the external pressure source.
The example in figure 9 shows a gas flood operation where a smart well is used to
connect an oil reservoir with weak gas cap drive to an underlying gas reservoir with a
higher pressure (Jansen, 2001). Pressure sensors and variable control ICVs are used at
the injection interval to channel gas from the high pressure gas reservoir and displace oil
in. This process is referred to as “gas dump flooding”. A second well is used to drain the
displaced oil thereby maximizing the recovery from the under pressured oil reservoir.

33
Figure 16: Gas dump flood process showing oil displacement using gas re-injected
from a high pressure gas reservoir. Reprinted from (Jansen, 2001)
2.6.7 Reservoir Characterization
Proper reservoir characterization is critical for accurate reserves estimation and optimal
reservoir management. Improper reserve estimation is not only embarrassing to the
engineers but could be costly to a company’s reputation and financial position.
Additionally, without proper reservoir characterization, it becomes challenging for
engineers to properly manage the reservoir to obtain optimum production. Intelligent
well completions provide real time downhole data which can be used to update
production models and reduce reservoir uncertainty.
Naldrett et al investigated the case where temperature profiles measured by an
intelligent completion was used to determine the production interval and the production
rate from each layer. This was achieved by comparing the measured temperature profile
with the geothermal gradient (Naldrett et al, 2005).
Intelligent completions provide data which enables more accurate reservoir
modeling/characterization and optimizes future operations.

34
2.7 Benefits of Intelligent Wells
The previous section have presented evidence on the potential benefits of optimal
application of Smart well technology. Smart well technology becomes even more
valuable in deepwater and subsea operations which are more technically challenging and
expensive. Some benefits of Intelligent Well Technology include;
Accelerated production through well controlled comingled production
Reduction in amount of water produced.
Reduction in Capital Expense (CAPEX). Reduces the need for surface facilities,
extra wells and intervention procedures.
Reduced Operating Expense (OPEX)
Decreases reservoir uncertainty by improving reservoir characterization.
Maximizes sweep efficiency leading to higher Ultimate recovery
Extends well life while maintaining production peak
Reduction in rig downtime
Downhole ICVs enable automated flow regulation during production and provide
remote control capabilities
Improves reservoir model optimization by providing real time measurements
Minimizes need for personnel presence at well site and thus reduces risk of accidents
The design and modeling smart well technology is a dynamic process that requires
critical fit-for-purpose analysis before implementation. The simulation performed in this
thesis will demonstrate how smart well completions can be used to accelerate production
while significantly reducing the amount of water produced. Accelerated production
translates to lower operating costs and minimizes the need for personnel presences on
site. The less time spent by personnel on the rig, the lower the opportunity of work
related accidents.
35
Minimizing water cut reduces treatment and disposal costs, and highlights optimized
sweep efficiency. Lower fluid capacity needs translate to lower capital and operating
cost requirements.
Furthermore, the simulated cases will demonstrate the optimal case where water
production is minimized while oil production is maximized.
2.8 Real World Case Studies
Although a relatively new technology, smart well completion technology has been tested
and applied to several real world projects to mitigate a wide mix of production problems.
This section will discuss some of the documented cases in which intelligent well systems
were adopted to optimize production.
The application of smart well completions to the Agbami deepwater field
(offshore Nigeria) was adopted to provide real time monitoring and control
necessary to optimize field recovery and performance. Despite the complex
stratigraphy and high reservoir uncertainty, field production was increased by
approximately 10 million BOPD due to the adoption of smart well technology
(Collins and Neuber, 2012)
Saudi Aramaco has been one of the major industry adopters of smart well
technology. An intelligent SCADA (Supervisory Control And Data Acquisition)
system was adopted in the Ghawar Field (on the Haradh Increment-III) in Saudi
Arabia (Mubarak, Phan, Shamrani and Shafiq, 2007). The implementation of
smart completions to this field significantly reduced the amount of onsite
monitoring by engineers, maintained peak production, and significantly reduced
water cut.
Adoption of smart well technology was also responsible for the optimal asset
development of the Nakika field (deepwater Gulf of Mexico) with minimum
number of wells (Chacon, McCutcheon, Schott, and Arias, 2007). Due to the

36
faults and salt zones, data collection through imaging was expensive and
challenging. This challenge was mitigated by the capability of real time data
measurement and control. The results were a reduction in uncertainties, improved
production efficiency and a significant reduction in field development costs.
Another field application of smart well technology is in the operations of the
Nothern Business Unit (NBU) of Shell UK in the North Sea (Akram, Hicking,
Blythe, Kavanagh, Reijinen and Mathieson, 2001). Nine fields that produce 400
thousand barrels of oil equivalent per day were equipped with smart well
technology. For the mature assests, the key benefits derived were optimization of
oil production, zonal water management and more cost-effective gas capacity
management.
The first ever application of smart well technology in the Gullfaks field (offshore
Norway) was also analyzed and documented (Lie and Wallace, 2000).
Production was significantly accelerated due to comingled production which was
previously impossible, and the data from downhole sensors helped to optimize
reservoir characterization.

37
CHAPTER III
SIMULATION WORKFLOW AND METHODOLOGY
3.1 Introduction
As discussed in the previous chapters, the design and modeling of smart well technology
is a dynamic process that requires critical fit-for-purpose analysis before
implementation. The properties of the field under study must be thoroughly assessed to
ensure that it is suitable for the application of smart well technology. Reservoir pressure
profile, size, depths of fluid contacts and production zones, reservoir fluid types and
recoverable reserves, reservoir heterogeneity (porosity and permeability), operating
environment (onshore versus offshore), well type (production versus injection), well
geometry, target rates and recovery methods are some of the factors that must be
deliberated and analyzed to determine whether or not the reservoir is suitable for the
application of smart well technology. Jansen proposed a closed loop reservoir
management model that performs due diligence to analyze compatibility be a reservoir
model and automated control (Jansen, 2013). A similar closed loop reservoir study was
proposed by Gildin et al. in their work on developing Low-Order Controllers for High-
Order Reservoir Models and Smart Wells (Gildin, Klie, Rodriguez, Wheeler, and
Bishop, 2006)
Once the technical analysis is completed and applicability is established, an economic
analysis must be performed. Comparing the marginal increase in cost to the marginal
increase in revenue should provide a quick estimate on the economic feasibility of
implementing the technology. Increased cost are a result of increased capital and
operational expense while revenues increase due to improved recovery, savings in rig
time and reduced water production.
The following sections will describe the reservoir system and discuss the methodology
that was used in simulating the smart well operation.

38
3.2 Reservoir Simulation
3.2.1 Reservoir Simulation Overview
In this section, a brief overview of the fundamental equations and numerical methods
that are implemented in reservoir simulation will be presented. A simple single phase
black oil model will be employed to understand the fluid flow behavior in porous
reservoir media. This is for illustration only as we employ a more complicated
multiphase model in the case study simulation. The equations and methods presented
are based on the textbook by Ertekin et al.23.
The mass balance equation for single phase flow is given by the continuity equation:
Where is porosity, is the fluid’s density, is fluid’s velocity and is the
source/sink term as mass flow rate or volumetric flow rate per control volume (for
injector < 0 and for producer > 0).
The velocity term is define by Darcy’s Law as:
Where = permeability in darcy units
(01)
(02)
3.2.1.1 Deriving the General PDE’s that describe the Fluid Flow for a Reservoir
39
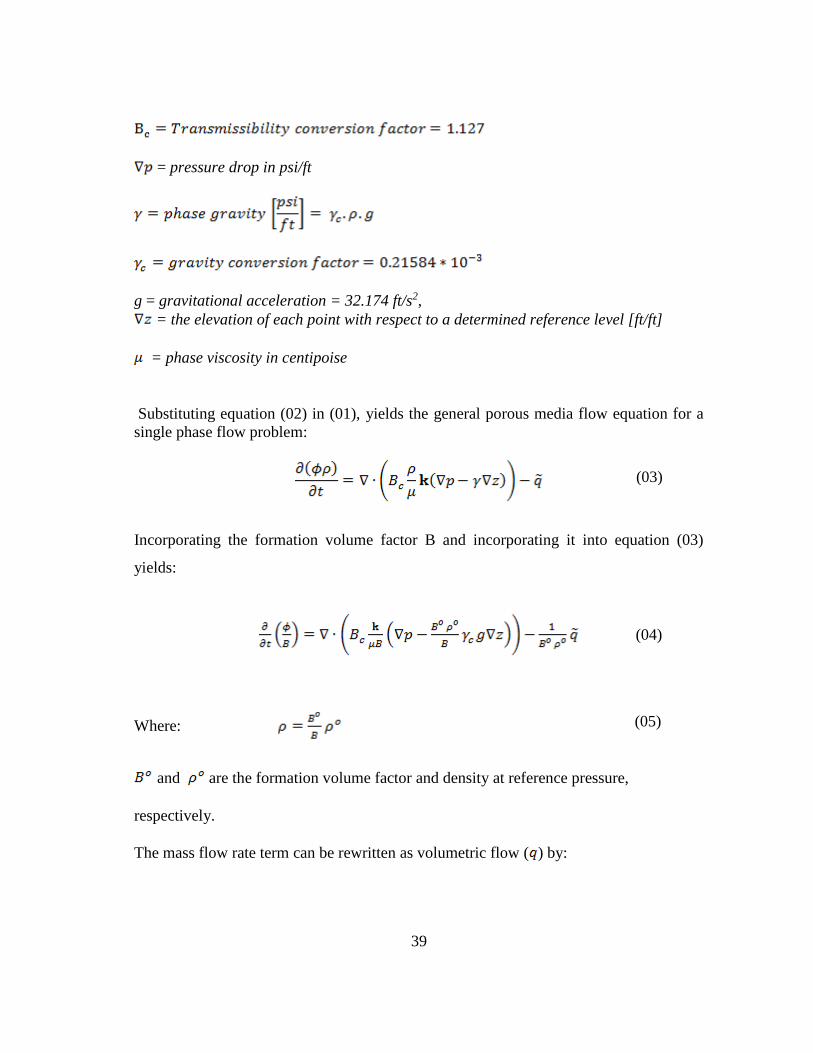
= pressure drop in psi/ft
g = gravitational acceleration = 32.174 ft/s2,
= the elevation of each point with respect to a determined reference level [ft/ft]
= phase viscosity in centipoise
Substituting equation (02) in (01), yields the general porous media flow equation for a
single phase flow problem:
Incorporating the formation volume factor B and incorporating it into equation (03)
yields:
Where:
and are the formation volume factor and density at reference pressure,
respectively.
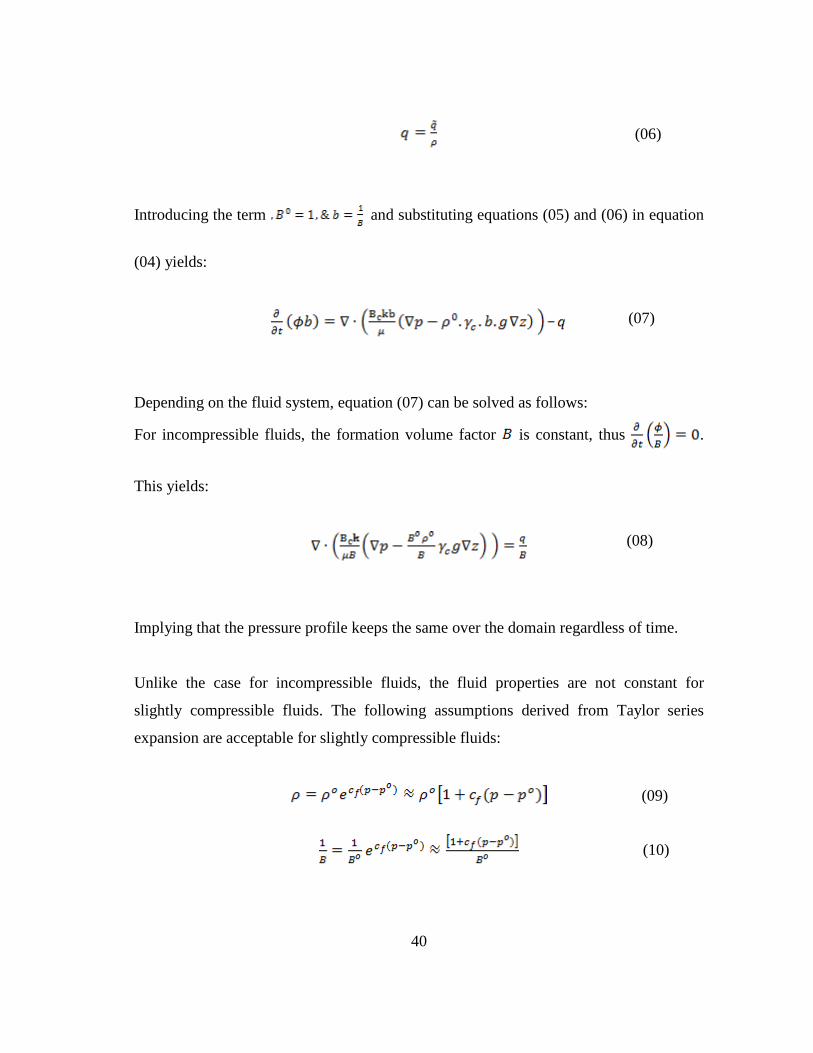
The mass flow rate term can be rewritten as volumetric flow ( ) by:
(03)
(04)
(05)
40
Introducing the term and substituting equations (05) and (06) in equation
(04) yields:
Depending on the fluid system, equation (07) can be solved as follows:
For incompressible fluids, the formation volume factor is constant, thus .
This yields:
Implying that the pressure profile keeps the same over the domain regardless of time.
Unlike the case for incompressible fluids, the fluid properties are not constant for
slightly compressible fluids. The following assumptions derived from Taylor series
expansion are acceptable for slightly compressible fluids:
(06)
(07)
(10)
(09)
(08)
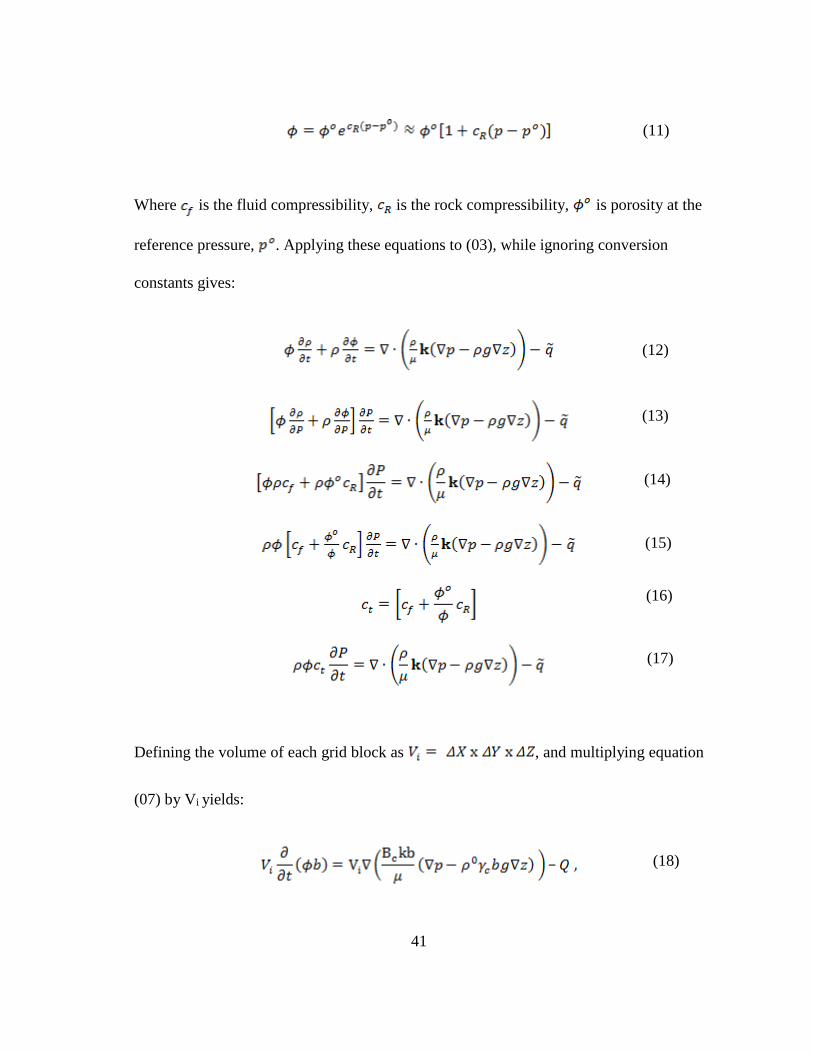
41
Where is the fluid compressibility, is the rock compressibility, is porosity at the
reference pressure, . Applying these equations to (03), while ignoring conversion
constants gives:
Defining the volume of each grid block as , and multiplying equation
(07) by Vi yields:
(11)
(12)
(13)
(14)
(15)
(16)
(17)
(18)
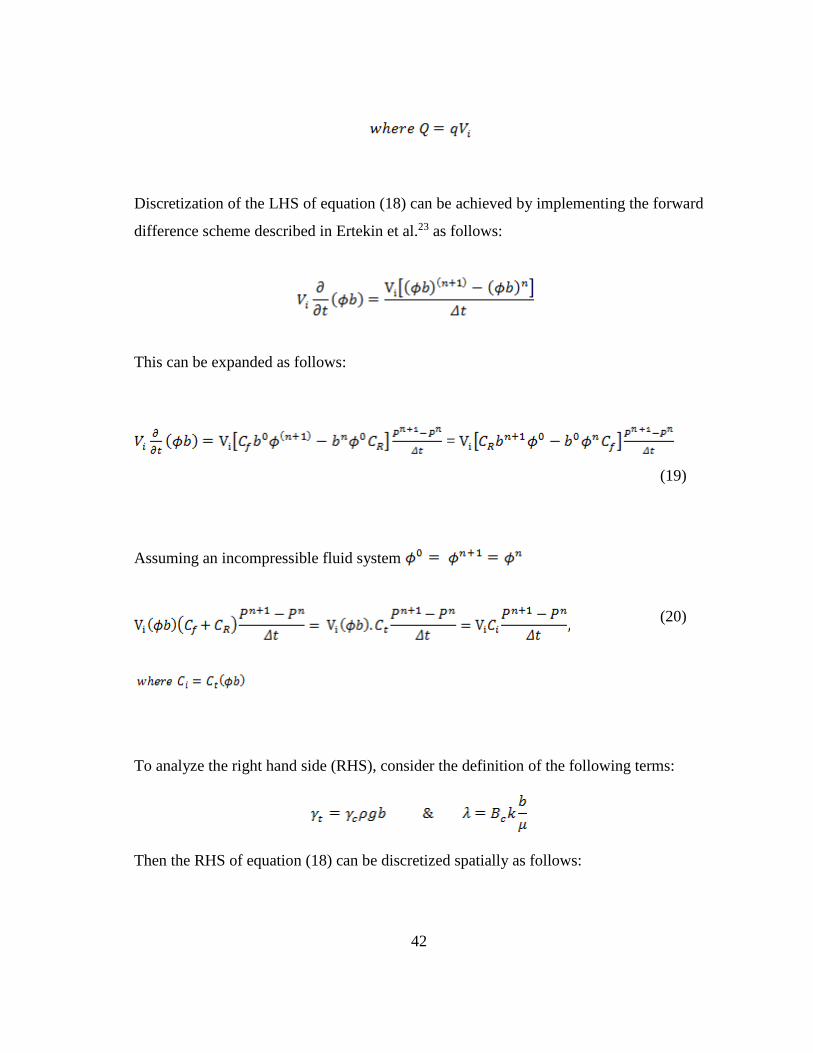
42
Discretization of the LHS of equation (18) can be achieved by implementing the forward
difference scheme described in Ertekin et al.23 as follows:
This can be expanded as follows:
=
Assuming an incompressible fluid system
To analyze the right hand side (RHS), consider the definition of the following terms:
Then the RHS of equation (18) can be discretized spatially as follows:
(19)
(20)

43
Expanding each term in equation (21) and applying block centered discretization, while
assuming average properties, (k, B and between grids yields:
Factorizing and substituting yields:
The same logic can be applied for the ‘j’ and ‘k’ directions to arrive at the full 3D
equation below;
(21)
(22)
(23)
(24)
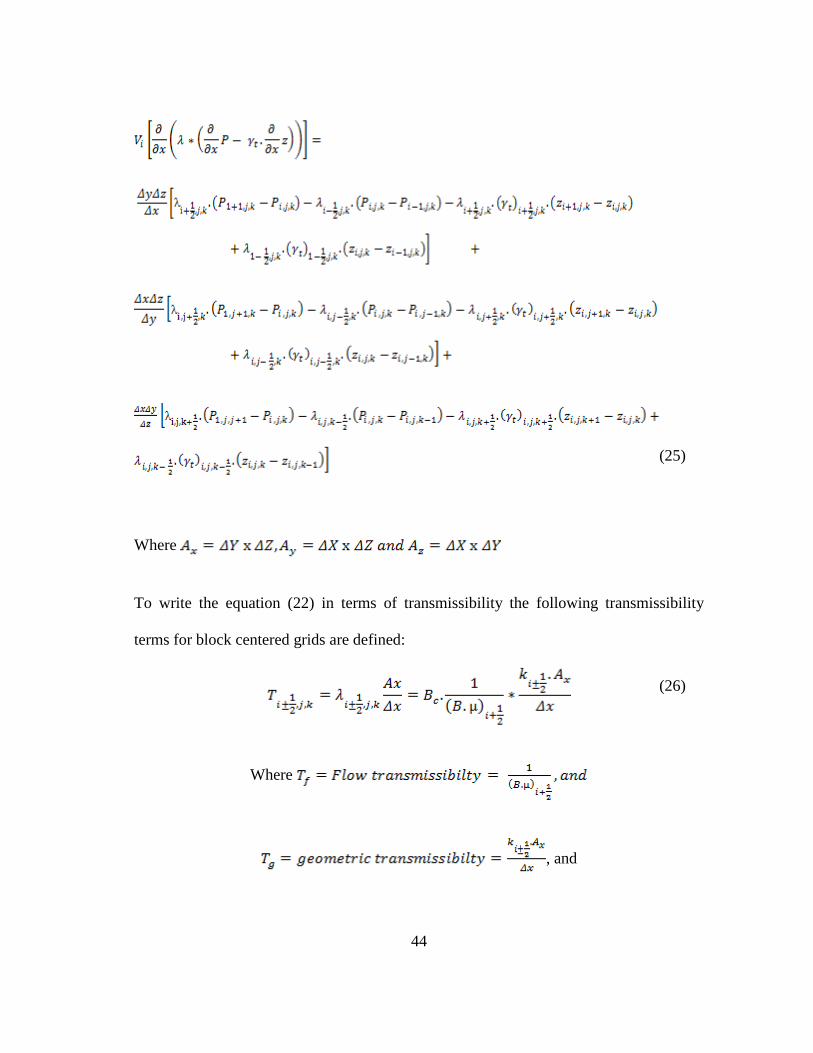
44
Where
To write the equation (22) in terms of transmissibility the following transmissibility
terms for block centered grids are defined:
Where
, and
(25)
(26)

45
is the permeability at the grid interphase defined by taking the harmonic average of
the adjacent grid block center permeabilities as follows;
The properties can be computed via one of two methods;
a. Taking average properties
b. Computing the properties at an average pressure
Define an average pressure ,
then
The transmissibility sum term is defined as:

46
Now the gravity terms for x, y, and z directions can be lumped together as follows:
Where
Restating equation (18):
Now substituting the discretized schemes into the above equation yields:
Rewriting in general terms yields the following linear system:
(28)
(31)
(27)
(29)
(30)
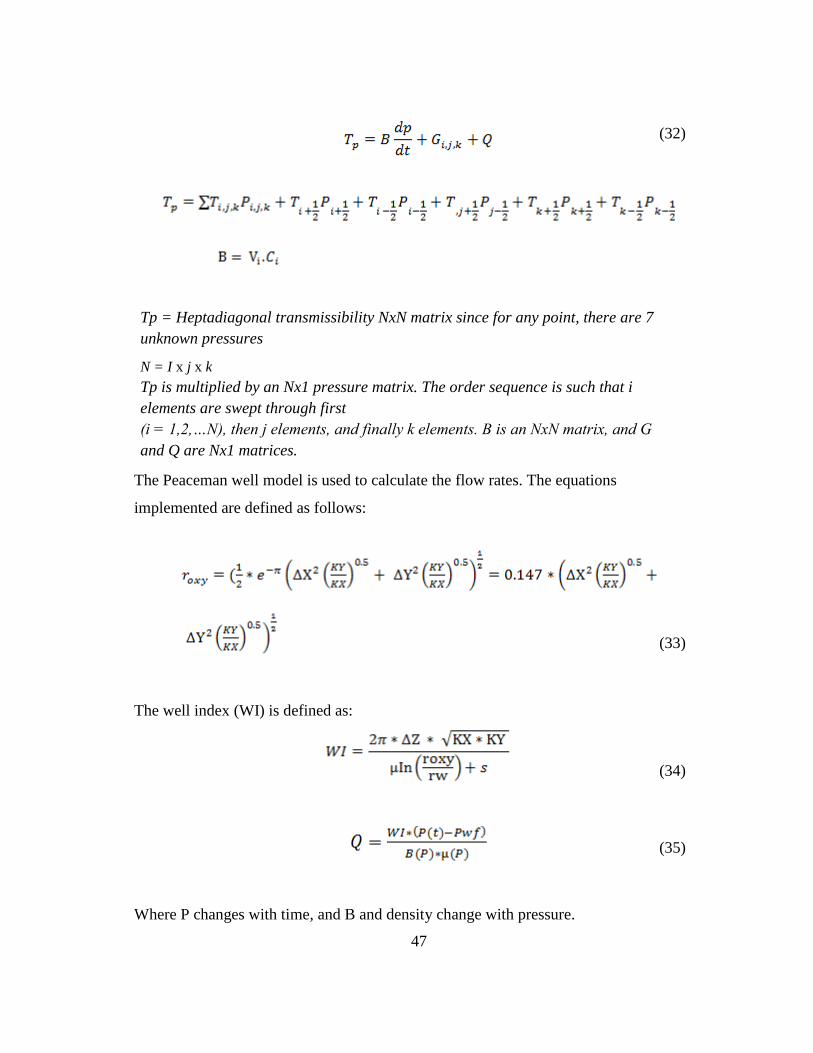
47
The Peaceman well model is used to calculate the flow rates. The equations
implemented are defined as follows:
The well index (WI) is defined as:
Where P changes with time, and B and density change with pressure.
Tp = Heptadiagonal transmissibility NxN matrix since for any point, there are 7
unknown pressures
N = I x j x k
Tp is multiplied by an Nx1 pressure matrix. The order sequence is such that i
elements are swept through first
(i = 1,2,…N), then j elements, and finally k elements. B is an NxN matrix, and G
and Q are Nx1 matrices.
(32)
(33)
(34)
(35)

48
The following numbering sequence is used to construct the sparse transmissibility matrix
In order to exhaust every gridblock the following sparsing index is used in the 3D matrix
Diagindx = [-i x j, -i, -1, 0, 1, i, i x j], where
i = number of gridblocks in x-direction
j = number of gridblocks in y-direction
k = number of gridblocks in z-direction
The matrix system of equations can be solved by applying either the implicit (backward
in time) scheme or the lagging coefficient scheme.
Implementing the Implicit (Backward in time) Scheme

49
Intelligent Well Technology provide the capability to control the flow rates (Q) and
downhole pressures (P).
3.2.2 Reservoir Simulation Benchmarks
The UNISIM-I-D benchmark reservoir model was used for the simulation case studies.
This reservoir model is created and managed by the UNISIM group (a collaboration
between UNICAMP and CEPETRO) (Gaspar, Maschio, Santos, Avansi, Filho and
Schiozer, 2013). The UNISIM-I-D model was chosen over other benchmark reservoir
models like SPE 10, Brugge, Norne and PUNQ because the reservoir geometry and
properties best fit the intended study conditions.
The simulation was modified using Petrel and ran using the Schlumberger Eclipse 100
simulator. The main benefits highlighted by the simulations runs performed are the water
breakthrough management and production optimization capabilities obtained by
adopting Smart Sell Technology. The value proposition of the technology is measured
using three key parameters; reduced water production, economic oil production rates
(favorable NPV) and rig time saving.
More details on the simulators and the reservoir description will be presented in the
sections below.
3.3 UNISIM-I-D Benchmark Model
The UNISIM-I-D model is a carbonate reservoir based on the Namorado field located
offshore in the presalt Campos Basin in Brazil. Discovered in 1975 by the 1-RJS-19
wildcat in 166m water. The heterogeneous properties of the model makes it an ideal
candidate for simulating intelligent well operations.
The UNISIM-I-D model is described on a regular Cartesian grid with a total of 93,960
grid cells. The reservoir model has global dimensions of 8061 x 5772 x 995 (meters) or
50
26447 x 18937 x 3264 (feet), and a fine scale grid cell size (NI x NJ x NZ) of 81 x 58 x
20. There are 20 producing zones (layers) with an average reservoir permeability in the
x, y, and z directions (Kx, Ky, and Kz) of 125.9 md, 125.9 md, and 48.96 md
respectively.
The reservoir is divided into two regions with a water oil contact (WOC) of 3100m in
region 1 and 3174m in region 2. The average reservoir pressure is 327.1 bars with and
initial water saturation of 0.44 and an initial oil saturation of 0.56.
There are 4 production wells namely; NA1A, NA2, NA3D and RJS19, and 3 injectors;
INJ003, INJ005 and INJ006. The producers are operated under a maximum liquid rate
constraints of 3000 m3/day while the injectors provide pressure support for oil
displacement and are operated under a 343.2 bar bottom hole pressure (BHP) constraint.
Production begins on June 1st 2013 and ends on May 28th 2028 (15 years). A detailed
reservoir description is provided in the table below.

51
Table 1: UNISIM reservoir description
Field property Value
Global Dimensions
Model length (DX)
Model width (DY)
Model height (DZ)
Grid cells (NI x NJ x NZ)
Total number of grid cells
8061 m
5772 m
995 m (-3861.39 m to -2866.56m)
81 x 58 x 20
93,960
Average Porosity 0.1295 (0 to 0.3)
Average Net To Gross NTG 0.7558
Average PERMX (md) 125.9 (1 to 1190)
Average PERMY (md) 125.9 (1 to 1190)
Average PERMZ (md) 48.96 (1 to 1190)
Average Initial Reservoir pressure (bars) 327.1 (250 to 349.9)
Initial Field Oil in Place (standard m3) 1.2999E08 (1.09E9 bbl)
Initial Field gas in Place (standard m3) 1.474778E10 (5.208E9MCF)
Average Initial Water Saturation (06/02/2013) 0.44
Average Initial Oil Saturation (06/02/2013) 0.56
Water oil contact – WOC (m) Region 1 = 3100, Region 2 = 3174
Gas oil contact – GOC (m) Region 1 = 1000, Region 2 = 1000
Figure 17 shows the oil saturation profile of the reservoir after 15 years of production.
The varied saturation profile clearly highlights the heterogeneity of the reservoir. The
saturation ranges from 0.0 (purple) to 0.9 ( yellow).
Figure 18 to 19 show the permeability (PERM X) and porosity profiles respectively.
These highlight the heterogeneity of the UNISIM-I-D reservoir.

52
Figure 17: Oil saturation profile on 05/28/2028
Figure 18: Average permeability (PERM X) profile. The permeability varies from 1
(blue) to 1190 (red).
--- 0.100
--- 0.900
--- 0.700 --- 0.800
--- 0.500 --- 0.400
--- 0.000
--- 0.600
--- 0.300 --- 0.200
0
1.0000
10.0000
100.0000
1000.0000
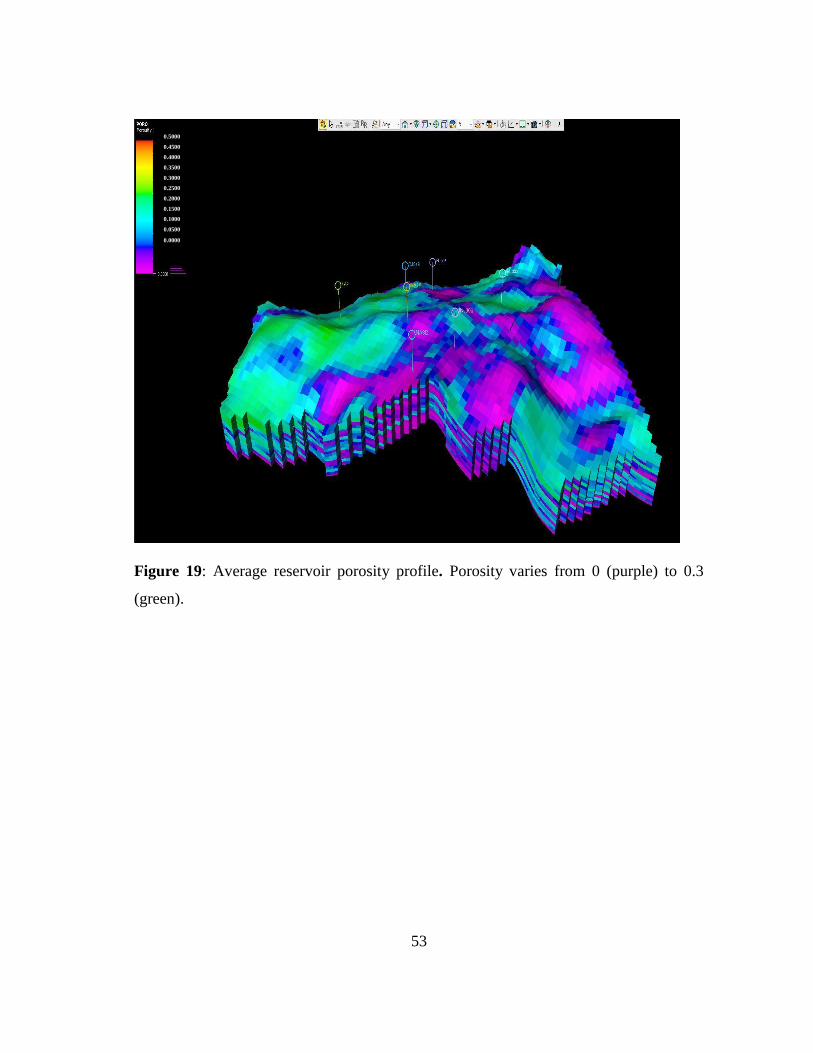
53
Figure 19: Average reservoir porosity profile. Porosity varies from 0 (purple) to 0.3
(green).
0.5000
0.4500
0.4000
0.3500
0.3000
0.2500
0.2000
0.1500
0.1000
0.0500
0.0000

54
3.3.1 Simulation with Commercial Reservoir Simulators
A commercial simulator (Eclipse 100) was used for all the simulation runs in this study.
As discussed in section 3.2.1, the multiphase Blackoil simulator applies finite difference
(fully implicit) techniques for numerical computation on the reservoir model. Unlike
compositional simulators (for example Eclipse 300, and CMG STARS/GEMS) that
incorporates changes in phase compositions, black oil simulators assume that oil and gas
phases can be represented as independent components whose properties can only change
with temperature and pressure. The composition does not change through time.
The simulation workflow is a batch process that requires an input data file. This is a text
file containing keywords that fully describe the model (reservoir description, fluid and
rock properties, initial conditions, wells, flow rates etc.). The data file is divided into
sections each containing keywords with a particular purpose. The keywords of reservoir
properties like permeability and porosity, as well as other simulator commands are
simulator specific and differ for different commercial simulators. The various sections
can be created in separate text files and compiled in the main input data file using the
INCLUDE keyword. Table 2 uses the Eclipse simulator to describe the different sections
in a commercial simulator input data file.

55
Table 2: Input data file sections in Eclipse simulator describing structure of input
files used in commercial simulators. Adapted from (Schlumberger Eclipse reference
manual, 2014)
56
3.4 Methodology/Test Cases
Four simulation cases were ran by modifying the data input file for each case. A baseline
case was first ran where all the production wells were operated for 15 years without any
water production control. The next case that was simulate highlighted traditional water
management methods with limited water control capability. Finally, two intelligent
modifications were simulated to demonstrate different strategies of water management.
Each case is described in more details later in this report.
The results of the simulated cases were analyzed against the decision drivers chosen for
this project namely; water production, economic oil production rates (favorable NPV)
and rig time saving. An NPV is then performed for each case and sensitivity analysis is
done to understand the effect of variables on the project NPV.
Finally, a work flow process is proposed which can be applied to any project with
different decision drivers.
3.4.1 Base Case Scenario
A base case simulation model run was performed at initial conditions before any
intelligent control was applied. This model provides a baseline against which to measure
the marginal improvements gained by adopting intelligent well control. The control
mode and constraints for all wells were set under the SCHEDULE section with the
producers operating under a maximum liquid production rate of 3000 m3 (25,159
barrels) and minimum BHP of 35.3 bars (512 psi). The injectors were set to inject water
at a maximum BHP of 343.2bars (4978 psi) and all the wells produced continuously for
15 years.
3.4.2 Conventional Water Management Operation
The next simulation run was performed to model conventional operation methods to
manage water breakthrough without intelligent technology. In this case, the wells were
57
operated under the same constraints as the base case model. However in addition, the
producers were set to a maximum water cut of 70%. Once this water cut threshold is
reached for a particular producer, the well is shut-in and assumed uneconomic. Similar
to the base line case, this mode of operation provides a reference against which to
measure the gains of adopting Smart Well Technology.
3.4.3 Intelligent Well Modifications
Two modes of intelligent control were simulated namely: ON-OFF control and Feedback
ON-OFF control. Unlike the baseline and conventional water management case, the
intelligent modifications employ downhole monitoring and control of each production
layer. The goal is to optimize production by accelerating and maximizing oil production,
while minimizing water production. Down hole control was simulated by installing the
Inflow Control Devices (ICD) discussed in chapter 2 around the tubing. The device
achieves flow control by imposing an additional pressure drop between the sandface and
the tubing. The device diverts fluid inflowing from the formation through a sand screen
and then into a spiral before it enters the tubing. Figure 20 shows a sample well
architecture with several perforation zones and downhole spiral ICDs installations in
each zone.
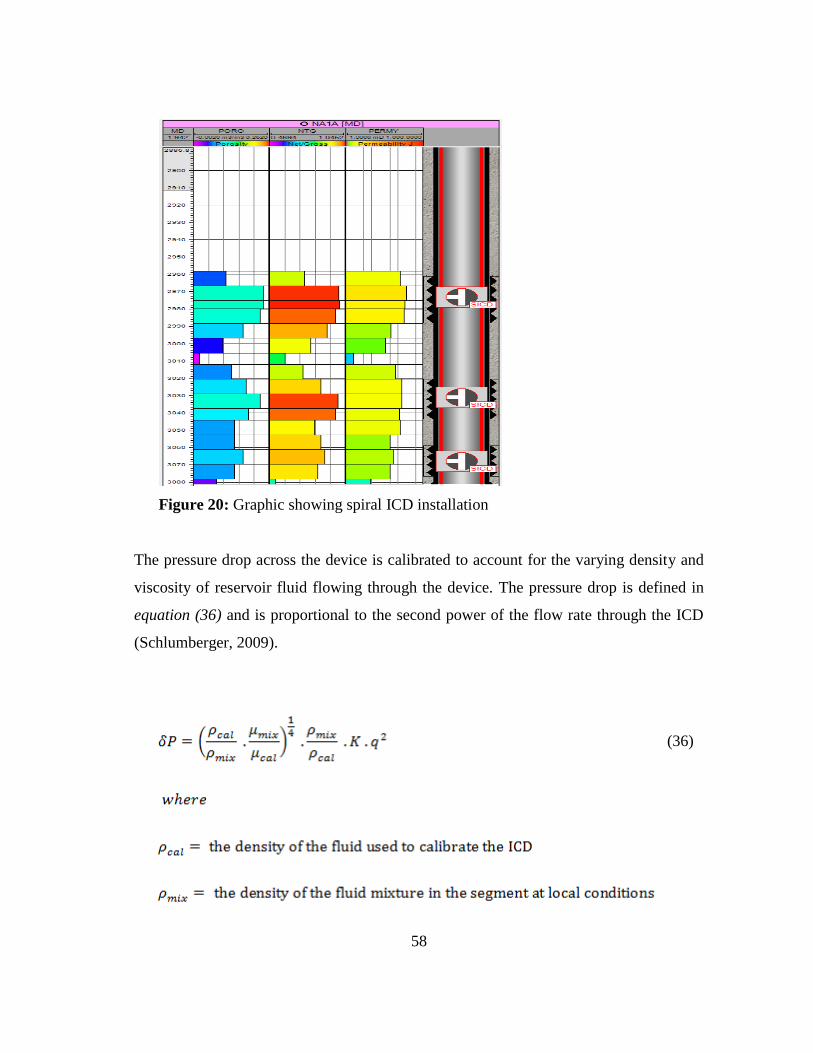
58
Figure 20: Graphic showing spiral ICD installation
The pressure drop across the device is calibrated to account for the varying density and
viscosity of reservoir fluid flowing through the device. The pressure drop is defined in
equation (36) and is proportional to the second power of the flow rate through the ICD
(Schlumberger, 2009).
(36)

59
The emulsion viscosity is a function of local phase volume fractions in the well
segments. The two functional forms are low water in liquid fractions, µwio (continuous
phase is oil) and high water in liquid fractions, µoiw (continuous phase is water)
(Schlumberger, 2009) and are defined by equation (37) and (38).

60
3.4.3.1 ON-OFF Control
The ON-OFF operation mode was simulated by constantly monitoring all the producing
layers against a set upper limit water cut threshold. The water cut threshold was set to
50% and production constraints imposed such that once the water cut of a producing
layer exceeds the threshold, that layer is completely shut. This two mode operation
simulates a simple On/off ICV discussed in chapter 2. The intelligent modification for
this operation mode was performed using the CECON keyword. The CECON keyword
monitors production at each grid block with a connection to the wellbore against the set
proxy model (watercut in this case) (Schlumberger reference manual, 2014). Once proxy
model condition is violated, the set action is applied. The possible actions include
(37)
(38)
61
completely shutting off the connection or setting it to auto mode, where the connection is
continuously checked every time step against the set threshold condition.
3.4.3.2 Feedback ON-OFF Control
The Feedback ON-OFF control mode is a slight modification to the ON-OFF control
mode described above. In this mode, the overall well water cut was continuously
monitored during production against a specified upper limit water cut threshold. The
water cut threshold was set to 50% and production constraints imposed such that once
the well water cut threshold is violated, the most offending producing layer in that well
is completely shut. Just like the ON-OFF control case, this operation mode simulates a
simple On/Off ICV with a slight modification to the control strategy. The intelligent
modification for this operation mode was performed using the WECON keyword.
Unlike the CECON keyword that monitors each downhole grid block connection, the
WECON keyword checks the entire well production against the set proxy model
condition (Schlumberger reference manual, 2014). Once proxy model condition is
violated on the well, the simulator checks each downhole producing layer connection
and the desired action is applied on the most problematic layer connection. Similar to the
CECON keyword, the possible actions include completely shutting off the connection or
setting it to auto mode, where the connection is continuously checked every time step
against the set threshold condition.
3.4.3.3 Variable Control
The variable control mode simulates a variable control ICV. This provides the operator
the capability of setting the ICV valve at multiple positions between the fully open (ON)
and fully closed extremes (OFF) in order to choke the flow from producing zones. This
is a more sophisticated mode of fluid control and for simplicity was not simulated in this
work. However, Eclipse offers various options for accommodating such strategies based
on user requirements.
62
The WCUTBACK and WSEGSICD keywords should be explored for more information
on this mode of control. The WCUTBACK keyword monitors each downhole producing
layer against a set watercut threshold. Once this threshold is violated, the user can choke
the flow from the problematic layer. The user has the option to choke the flow as a factor
of the total liquid production rate, the total water production rate or the total oil
production rate (Schlumberger reference manual, 2014).
The WSEGICD keyword allows the user to manually design a downhole ICD as
described in section 3.6. The user specifies the perforation zone across which the ICD is
installed, the ICD strength and the ICD length, which determines the pressure drop
imposed by the ICD across the perforations (Schlumberger reference manual, 2014).
3.5 Sensitivity Analysis
Sensitivity analysis on variable reservoir parameters is important in any reservoir
simulation to understand the best and worst case scenario. Understanding price
sensitivity before making the decision on whether or not to adopt intelligent technology
in a field is critically important in today’s environment of volatile oil prices.
Traditional approaches to sensitivity analysis can be implemented by simple perturbation
of the variable parameters one at a time, followed by running the new model and
observing the change in reservoir response with the change in the parameter. A tornado
plot can be generated for all the variable parameters to observe the most sensitive
parameters. Impact of parameters like labor, cost of equipment/raw materials, well
dimensions, crude price have a direct impact on the return of investment and should be
properly analyzed before implementing a project.
For this study, a simple sensitivity study was performed to understand the economic
feasibility of Smart well technology on the UNISIM-I reservoir model. The study was
simplified by narrowing down the sensitivity study around two parameters: Oil price and
water cut. The results of this study will be presented for each simulation case later in the
results section of this report.

63
3.6 Economic Evaluation
A modified NPV model was adopted to evaluate the economic value of adopting Smart
Well Technology to the UNISIM-I reservoir model. A fixed discount rate of 10% was
used in the conventional NPV formula below.
Where
(CAPEX)
The capital expense (Co) for the project include upfront drilling and completion cost. A
default drilling cost of $10 MM was assumed for each well. Completion cost was
assumed to be $2 MM per well and this value was scaled up by a factor of 1.3 for
intelligent completions.
Operating expenses (OPEX) are necessary for the daily field operations and can be either
fixed or variable. A default value of $20,000 per well was assumed for fixed OPEX in
the NPV analysis while variable OPEX like water treatment was calculated assuming
(39)
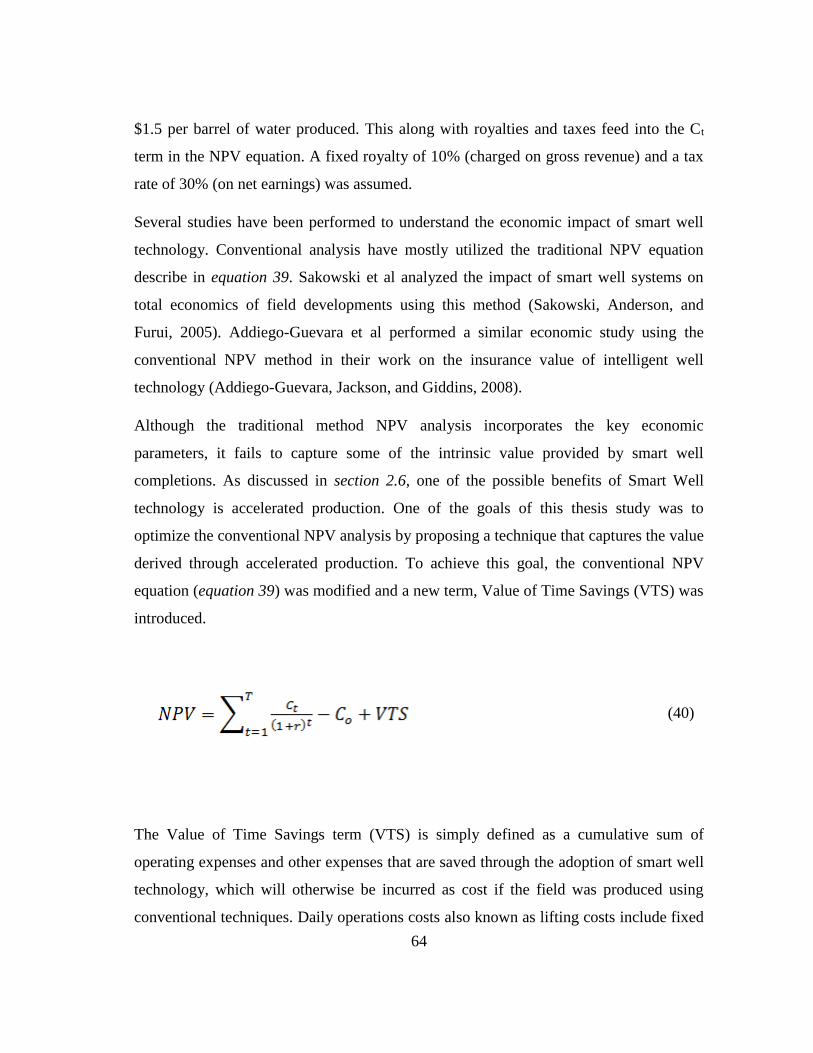
64
$1.5 per barrel of water produced. This along with royalties and taxes feed into the Ct
term in the NPV equation. A fixed royalty of 10% (charged on gross revenue) and a tax
rate of 30% (on net earnings) was assumed.
Several studies have been performed to understand the economic impact of smart well
technology. Conventional analysis have mostly utilized the traditional NPV equation
describe in equation 39. Sakowski et al analyzed the impact of smart well systems on
total economics of field developments using this method (Sakowski, Anderson, and
Furui, 2005). Addiego-Guevara et al performed a similar economic study using the
conventional NPV method in their work on the insurance value of intelligent well
technology (Addiego-Guevara, Jackson, and Giddins, 2008).
Although the traditional method NPV analysis incorporates the key economic
parameters, it fails to capture some of the intrinsic value provided by smart well
completions. As discussed in section 2.6, one of the possible benefits of Smart Well
technology is accelerated production. One of the goals of this thesis study was to
optimize the conventional NPV analysis by proposing a technique that captures the value
derived through accelerated production. To achieve this goal, the conventional NPV
equation (equation 39) was modified and a new term, Value of Time Savings (VTS) was
introduced.
The Value of Time Savings term (VTS) is simply defined as a cumulative sum of
operating expenses and other expenses that are saved through the adoption of smart well
technology, which will otherwise be incurred as cost if the field was produced using
conventional techniques. Daily operations costs also known as lifting costs include fixed
(40)

65
costs like labor and transportation costs, as well as variable costs like facilities costs,
separation costs, and other unforeseen costs. By accelerating production, rig time is
saved and daily operation costs are minimized or completely eliminated. This cost
savings is captured in the VTS term in the proposed NPV model.
For simplicity, only operating expenses were captured in the Value of Time Savings
term although more complex analysis could be performed to consider other factors,
depending on the desired level of detail. The method used in this study was a simplistic
method where by a constant added value of $20,000 was gained per day saved in
production time. However, a more realistic model will need to capture saved costs and
discount these values throughout the period of time saved. The risk associated by
implementing intelligent controls, the opportunity costs and the risks associated with
alternate investments should also be captured. Pedersen et al. proposed a risk model for
alternative investments (Pedersen, Page and He, 2014).
A summary of the field economic parameters showing the costing strategy is presented
in table 3.

66
Table 3: Field economics
PARAMETER UNIT PER WELL FIELD TOTAL*
DRILLING COST ($) 10 MM 40 MM
COMPLETION COST ($) 2 MM 8 MM
TOTAL FIXED CAPEX ($) 12 MM 48 MM
COST OF INTELLIGENT
COMPLETION ($)
0.3*Completion cost =
600,000
2.4 MM
COST OF DOWNHOLE
SENSORS
3 MM 12 MM
TOTAL COST OF SMART WELL
($)
15.6 MM 62.4 MM
FIXED OPEX ($) 20,000 80,000
OIL PRICE ($) 50
ROYALTY (%) 10
DISCOUNT RATE (%) 10
*Injector wells were not included in the field total calculations as they were strictly implemented for water drive.
However these cost can be easily added if required and will not impact the results as the injectors in this study are
not equipped with ICDs and will represent a constant fixed cost across all 4 simulated scenario
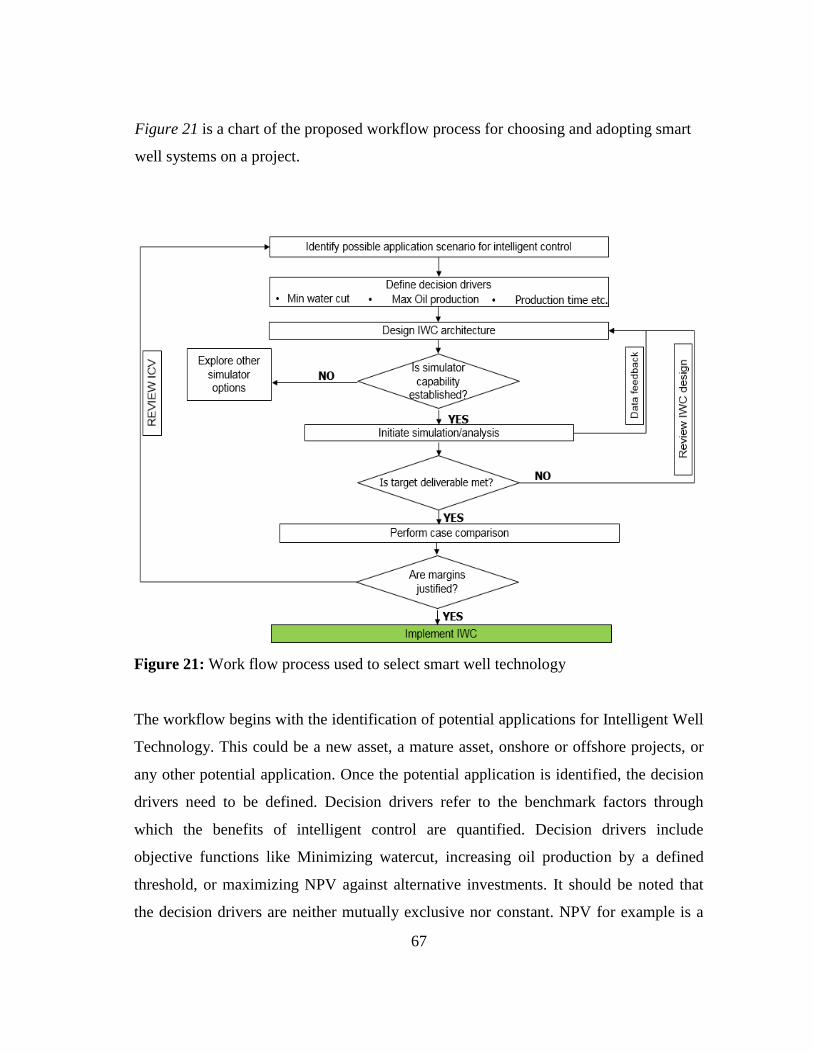
67
Figure 21 is a chart of the proposed workflow process for choosing and adopting smart
well systems on a project.
Figure 21: Work flow process used to select smart well technology
The workflow begins with the identification of potential applications for Intelligent Well
Technology. This could be a new asset, a mature asset, onshore or offshore projects, or
any other potential application. Once the potential application is identified, the decision
drivers need to be defined. Decision drivers refer to the benchmark factors through
which the benefits of intelligent control are quantified. Decision drivers include
objective functions like Minimizing watercut, increasing oil production by a defined
threshold, or maximizing NPV against alternative investments. It should be noted that
the decision drivers are neither mutually exclusive nor constant. NPV for example is a

68
function of water production as well as oil production. The decision drivers will also
change from project to project and will vary depending on the operator.
Once the decision drivers are established, the ICV architecture is designed. The design
of ICV is discussed in section 3.4.3.
The next step is to identify a simulator that is applicable to the simulation task and has
the capability to offer downhole monitoring and control. Several simulators should be
explored and a balance between cost and efficiency should be sought. The simulation
process is then initiated and the analysis of the results is performed. Each decision driver
is checked to see if the target deliverables are met. If the target deliverables are not met,
the ICV design should be reassessed. During the simulation process, data is continuously
fed back into the design process to improve the reservoir model and better characterize
the reservoir.
If the target deliverables are met, the must be justifiable to proceed. Justification for a
target deliverable will depends on the personnel performing the analysis as well as the
benchmarks of the operating enterprise. For example, an engineer onsite may consider
minimizing field watercut as a good justification while a project manager may use NPV
as a justification. The level of decision making will eventually determine the measure of
justification. If the project is not justifiable, the applicability of ICV to the project in
question needs to be reviewed. If the target is justified, then ICV technology should be
adopted.

69
CHAPTER IV
RESULTS AND DISCUSSIONS
4.1 Overview
The results obtained from the base case, traditional water management operation, and
intelligent modification simulation models will be presented in this chapter. As
previously stated, the interest in this simulation work is oil production, and therefore gas
production data is not included in the output plots. The three main metrics used to
quantify the marginal value of adopting smart well technology are oil production (NPV),
water production (watercut) and time savings (accelerated production). The focus of this
work was therefore to build a proxy model that will maximize oil production and,
simultaneously minimize water production.
4.2 Base Case Scenario
The base case simulation model run was performed at initial conditions before any
intelligent control was applied. This model provides a baseline against which to measure
the marginal improvements gained by adopting intelligent well control. The control
mode operated the producers under a maximum liquid production rate of 3000 m3
(25,159 barrels) and minimum BHP of 35.3 bars (512 psi). The injectors were set to
inject water at a maximum BHP of 343.2bars (4978 psi) and all the wells produced
continuously for 15 years.
The simulation results for the base case scenario are presented in figures 22 to 24.
Figure 22 shows the daily oil, gas and water production rates. It can be observed that
daily water production surpasses daily oil production rate starting from year 7. This
highlights the need for water management to optimize the production process. Figure 23
shows the cumulative oil, water and gas production. Beginning from year 4, the amount
of water produced increases exponentially while the amount of oil and gas decreases.
This increase in water production is again highlighted in figure 24 by the increase in
field watercut.
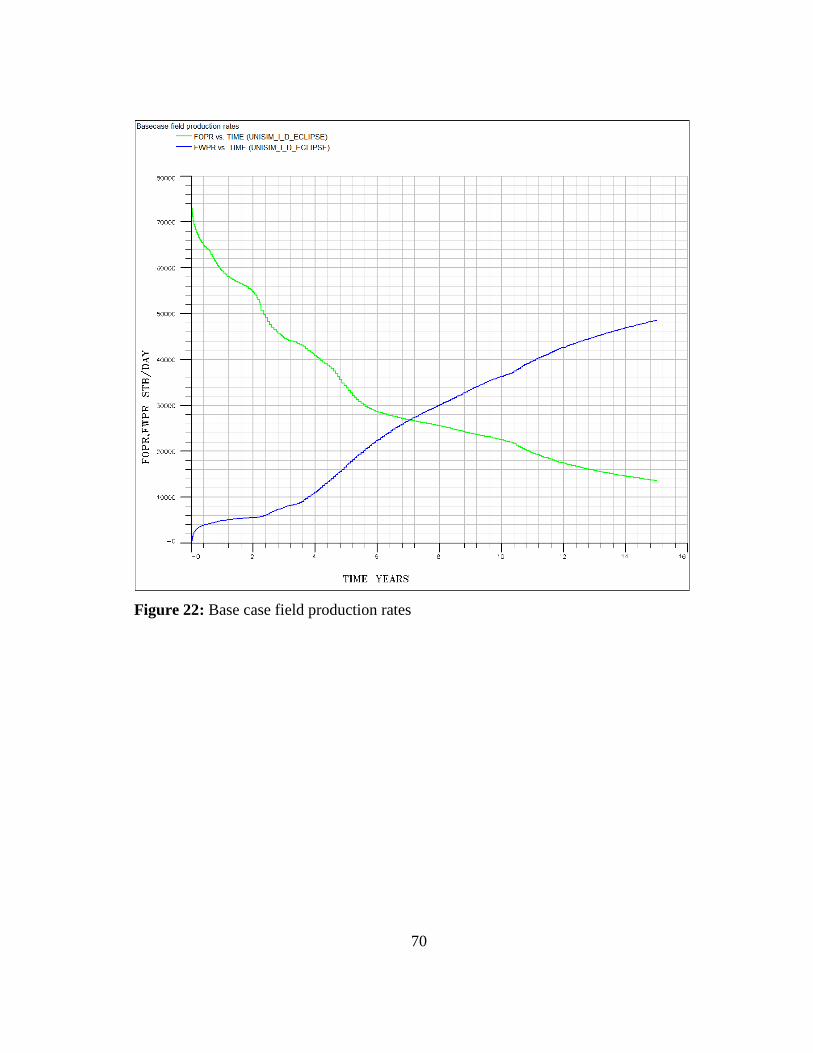
70
Figure 22: Base case field production rates
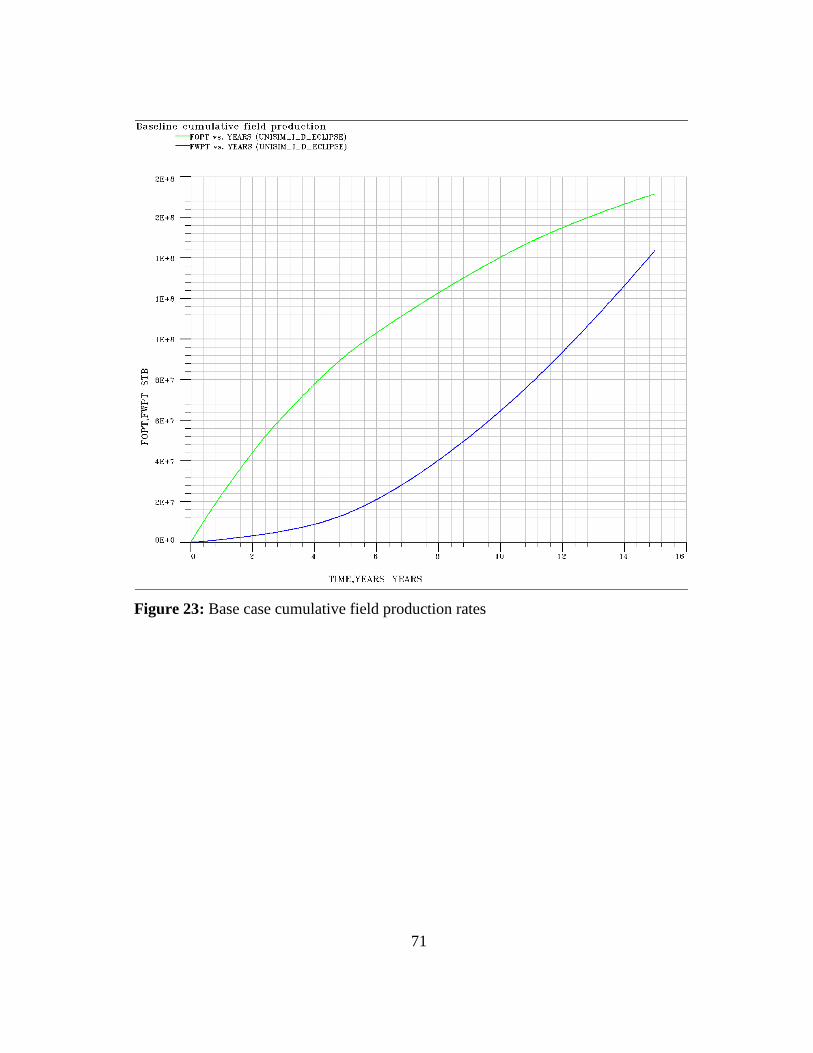
71
Figure 23: Base case cumulative field production rates

72
Figure 24: Base case field water cut
4.3 Conventional Water Management
This simulation run was performed to model conventional operation methods to manage
water breakthrough without intelligent technology. The wells were operated under the
same constraints as the base case model. However in addition, the producers were set to
a maximum water cut of 70%. Once this water cut threshold is reached for a particular
producer, the well is shut-in and assumed uneconomic. Similar to the base line case, this
mode of operation provides a reference against which to measure the gains of adopting
Smart Well Technology.

73
The simulation results showing a comparison between the base case scenario and the
conventional water management case are presented in figures 25 to 27. Figure 25 shows
the daily oil, and water production rates. It can be observed that the conventional water
management case results in slightly lower oil production rates starting in year six.
However, the rate of water production is significantly reduced compared to the baseline
case. This highlights the optimization of the production process when water management
is applied. Figure 26 shows the cumulative oil, and water production and highlights the
reduction in water production achieved by applying water management. Finally, figure
27 shows the reduction in field watercut from 78% in the baseline case to 52% in the
conventional water management case.
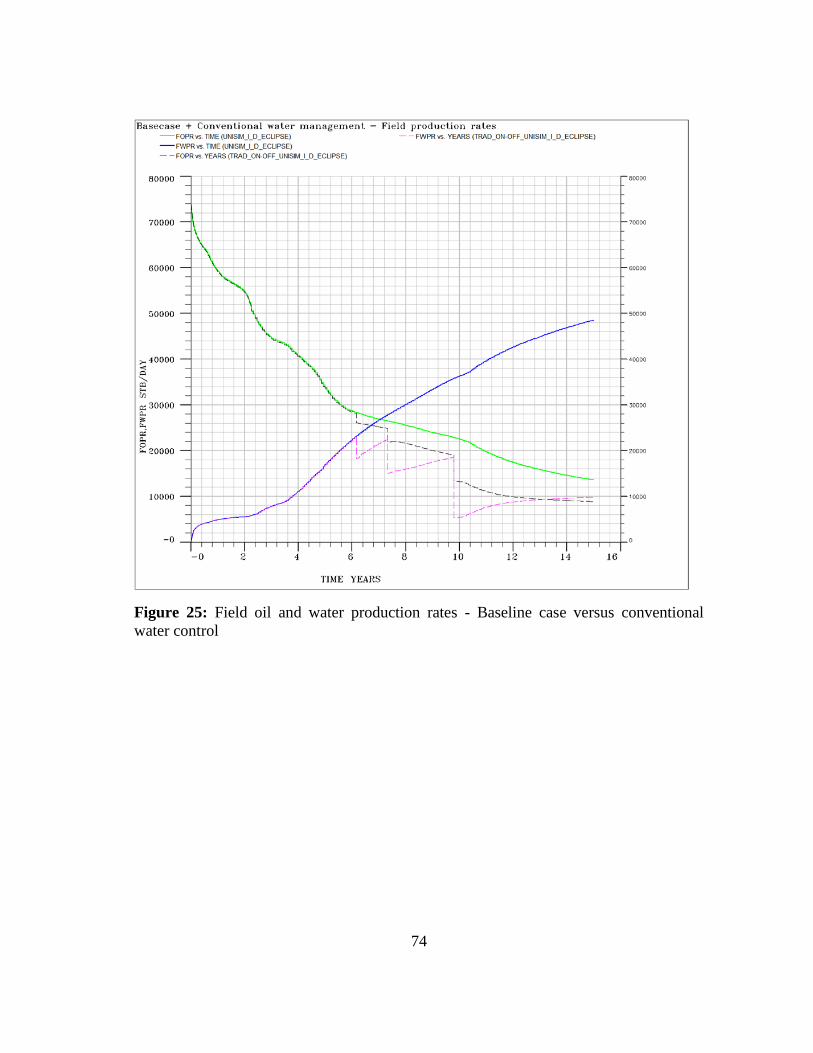
74
Figure 25: Field oil and water production rates - Baseline case versus conventional
water control

75
Figure 26: Cumulative field production rates - Baseline case versus conventional water
control
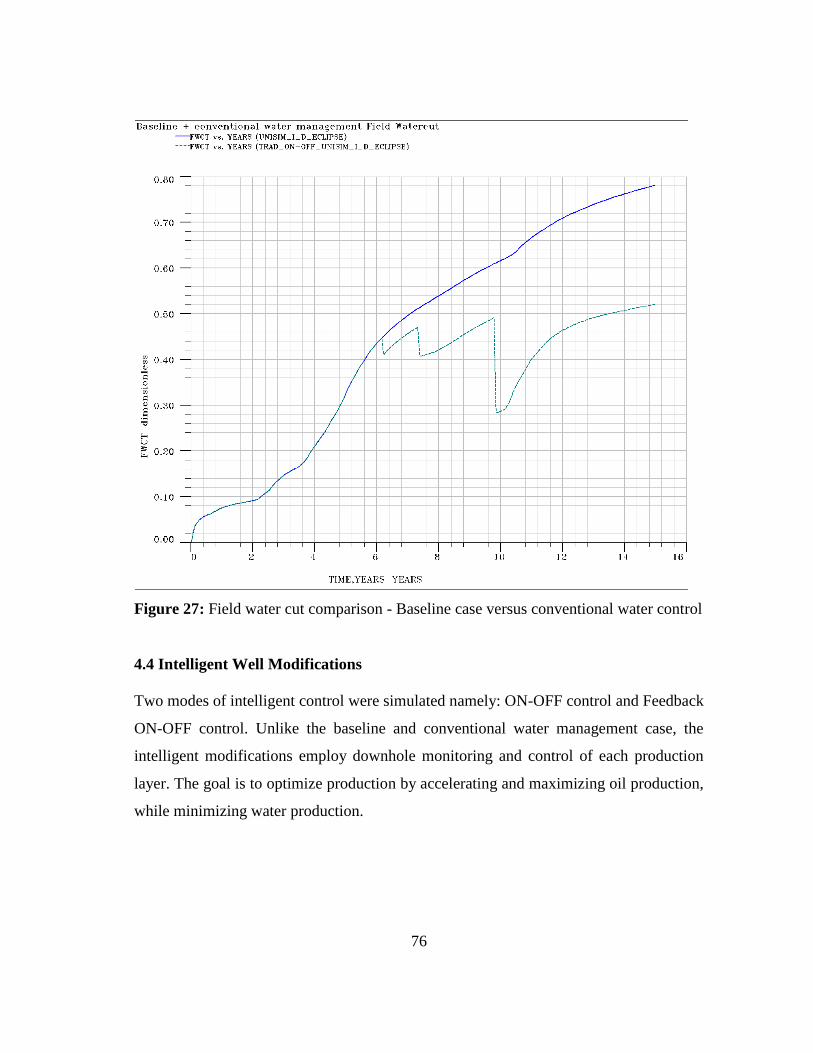
76
Figure 27: Field water cut comparison - Baseline case versus conventional water control
4.4 Intelligent Well Modifications
Two modes of intelligent control were simulated namely: ON-OFF control and Feedback
ON-OFF control. Unlike the baseline and conventional water management case, the
intelligent modifications employ downhole monitoring and control of each production
layer. The goal is to optimize production by accelerating and maximizing oil production,
while minimizing water production.

77
4.4.1 ON-OFF Control
The ON-OFF operation mode was simulated by constantly monitoring all the producing
layers against a set upper limit water cut threshold. The water cut threshold was set to
50% and production constraints imposed such that once the water cut of a producing
layer exceeds the threshold, that layer is completely shut.
The simulation results showing a comparison between the base case scenario, the
conventional water management case, and the ON-OFF layer control case are presented
in figures 28 to 30. Figure 28 shows the daily oil, and water production rates. It can be
observed that the ON-OFF layer control case results in slightly lower oil production rates
starting in year six. However, the rate of water production is significantly reduced
compared to the baseline and the conventional water management case. This highlights
the optimization of the production process when water management is applied using
smart well completions. Figure 29 shows the cumulative oil, and water production and
highlights the reduction in water production achieved by applying downhole layer
control. Finally, figure 30 shows the reduction in field watercut from 78% in the baseline
case to 31.9 % in the ON-OFF layer control case.

78
Figure 28: Field production rates - Baseline, conventional water control, and ON-OFF
intelligent control
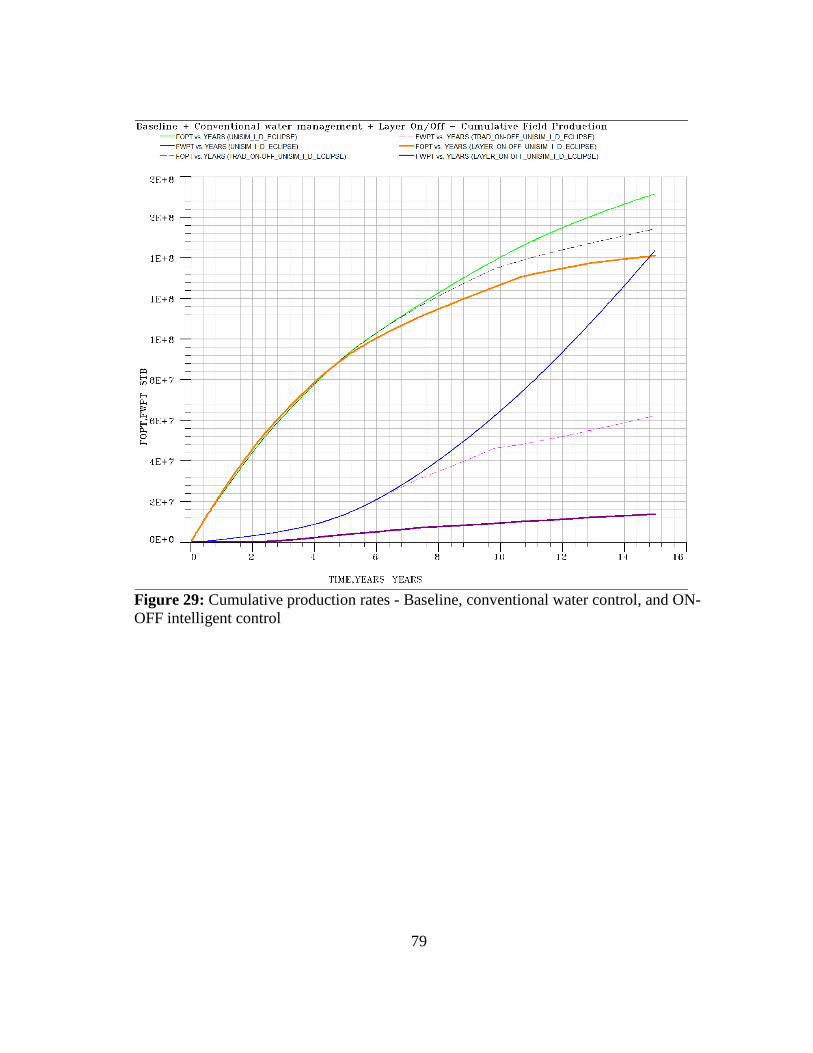
79
Figure 29: Cumulative production rates - Baseline, conventional water control, and ON-
OFF intelligent control

80
Figure 30: Field water cut comparison
4.4.2 Feedback ON-OFF Control
The Feedback ON-OFF control mode is a slight modification to the ON-OFF control
mode described above. In this mode, the overall well water cut was continuously
monitored during production against a specified upper limit water cut threshold. The
water cut threshold was set to 50% and production constraints imposed such that once
the well water cut threshold is violated, the most offending producing layer in that well
is completely shut. Just like the ON-OFF control case, this operation mode simulates a
simple On/off ICV with a slight modification to the control strategy.
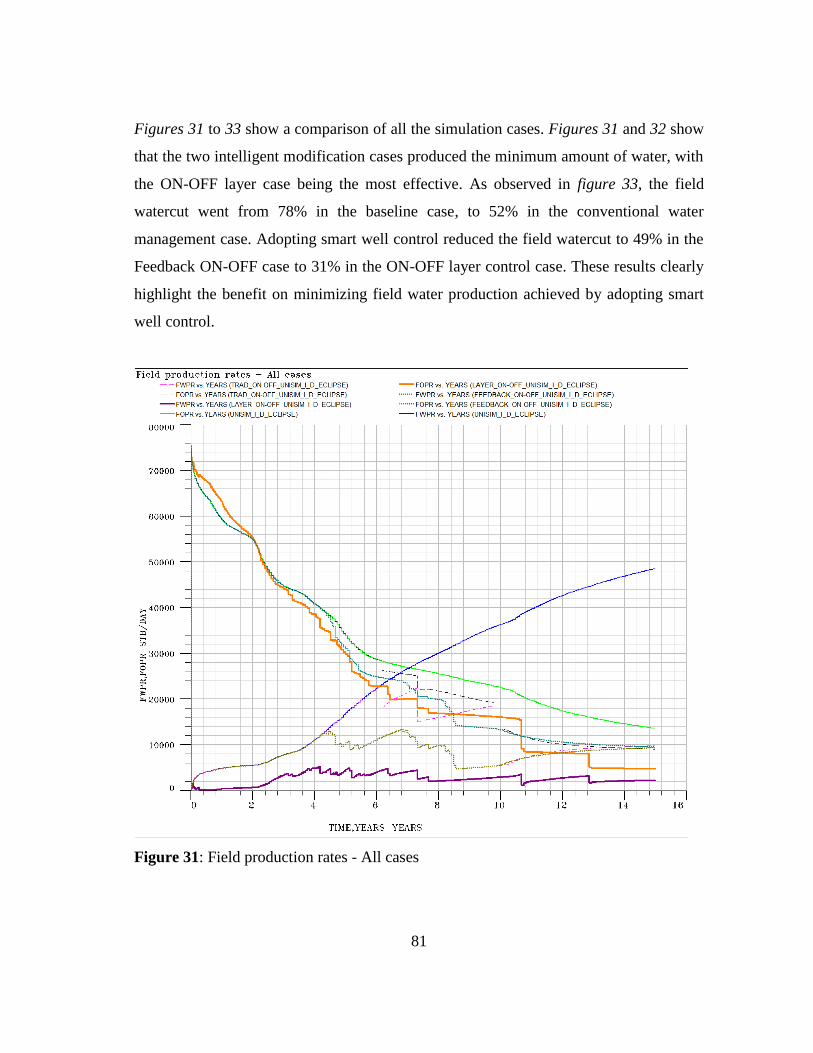
81
Figures 31 to 33 show a comparison of all the simulation cases. Figures 31 and 32 show
that the two intelligent modification cases produced the minimum amount of water, with
the ON-OFF layer case being the most effective. As observed in figure 33, the field
watercut went from 78% in the baseline case, to 52% in the conventional water
management case. Adopting smart well control reduced the field watercut to 49% in the
Feedback ON-OFF case to 31% in the ON-OFF layer control case. These results clearly
highlight the benefit on minimizing field water production achieved by adopting smart
well control.
Figure 31: Field production rates - All cases
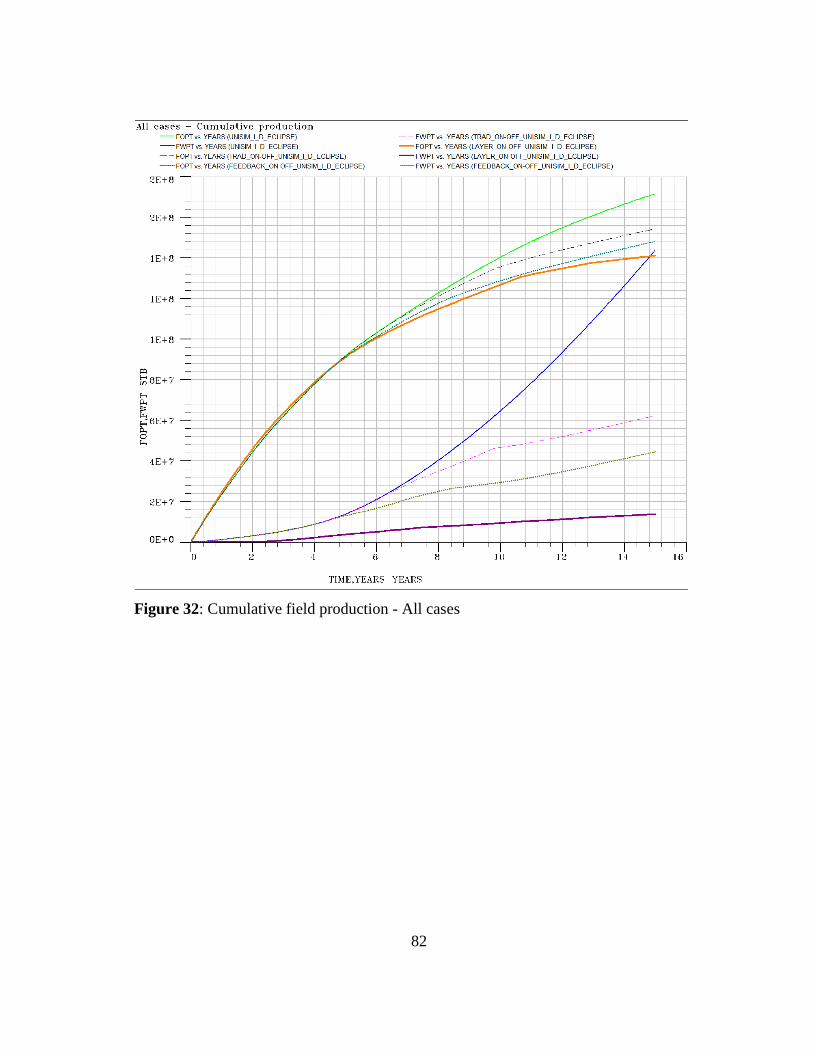
82
Figure 32: Cumulative field production - All cases

83
Figure 33: Field water cut comparison - All cases
84
4.5 Well Analysis
The optimization in production is evident from the field data analysis when considering
the decision driver of minimizing water production. To observe the production
acceleration benefit, it is necessary to analyze the individual well data.
Figures 34, 36, and 37 show the time required by each simulation case to achieve total
oil and water production in well NA1A, NA3D, and RJS19 respectively. In all three
wells, it can be observed that the two intelligent modification cases (Feedback ON-OFF
and Layer ON-OFF) produced for the least amount of time. Although production time
was significantly shorter in the cases with smart completions, economic levels of oil
production were achieved. Additionally, the amount of water was significantly reduced
by adopting smart well completions.
Figure 35 shows the production data for well NA2. This highlights an optimal case in
which the benefits of smart well completions are fully realized. Adopting ON-OFF layer
control results in the least amount of water produced, the fastest oil production rate and
the highest cumulative oil production.
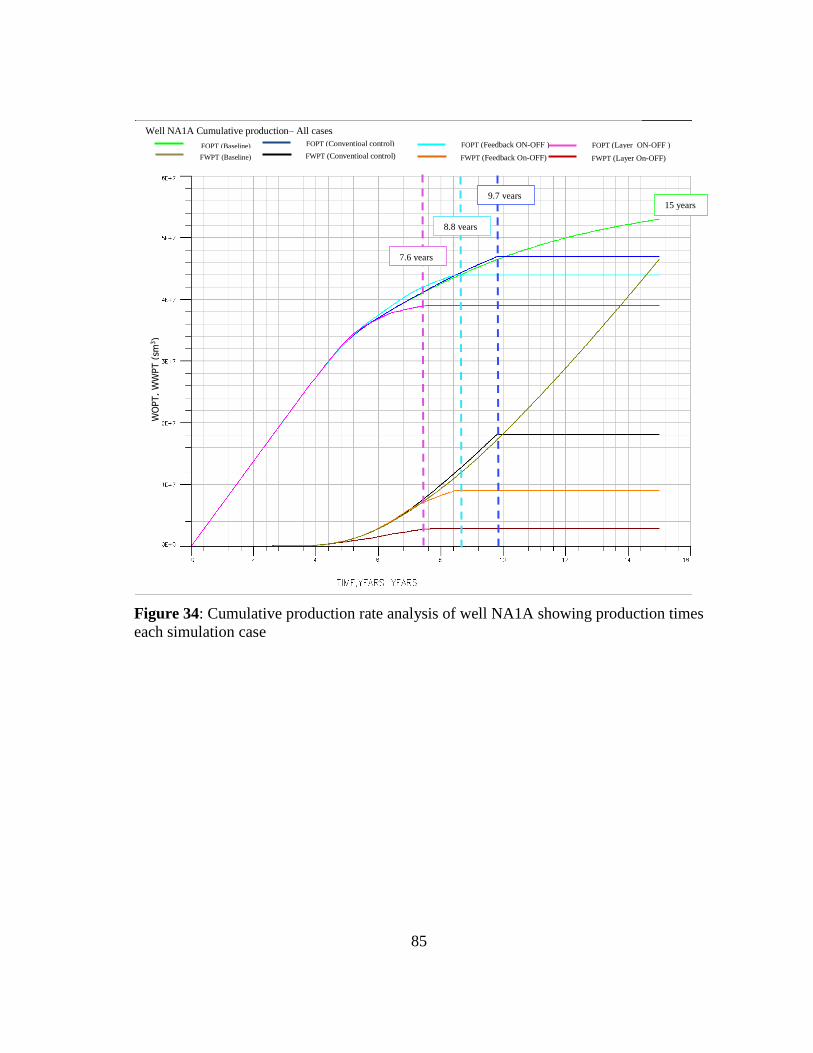
85
Figure 34: Cumulative production rate analysis of well NA1A showing production times
each simulation case
7.6 years
8.8 years
9.7 years 15 years
Well NA1A Cumulative production– All cases
FOPT (Baseline)
FWPT (Baseline)
FOPT (Conventioal control)
FWPT (Conventioal control)
FOPT (Feedback ON-OFF )
FWPT (Feedback On-OFF)
FOPT (Layer ON-OFF )
FWPT (Layer On-OFF) W
OPT,
WW
PT (
sm3)

86
Figure 35: Well NA2 cumulative production showing benefits of intelligent control
Reduced water
production (increased
flooding efficiency)
Accelerated
production
Well NA1A Cumulative production– All cases
FOPT (Baseline)
FWPT (Baseline) FOPT (Conventioal control) FWPT (Conventioal control)
FOPT (Feedback ON-OFF )
FWPT (Feedback On-OFF)
FOPT (Layer ON-OFF )
FWPT (Layer On-OFF)
FOPT (Conventioal control)
WO
PT,
WW
PT (
sm3)

87
Figure 36: Well NA3D cumulative production showing accelerated production benefit
of intelligent completions
5 years
6.1 years
5.7
years
15 years
Well NA3D Cumulative production– All cases
FOPT (Baseline)
FWPT (Baseline)
FOPT (Conventioal control)
FWPT (Conventioal control)
FOPT (Feedback ON-OFF )
FWPT (Feedback On-OFF)
FOPT (Layer ON-OFF )
FWPT (Layer On-OFF) W
OPT,
WW
PT (
sm3)

88
Figure 37: Well RJS19 cumulative production demonstrating optimized production
4.6 Summary
The field data clearly highlights the advantages of adopting intelligent well technology
when water production/disposal capacity is a critical parameter. A comparison of the
cumulative oil and water production for all four simulated cases is presented in figure 32
above. In the baseline case, all the wells operate for 15 years without any controls to
minimize water production. As expected this case resulted in the highest field water
production (78.1 % water cut) and the highest cumulative oil produced. Obviously,
coping with such high volumes of water require significant purification/disposal
4 years
7.4 years
4.7
years
15 years
Well NA3D Cumulative production– All cases
FOPT (Baseline)
FWPT (Baseline)
FOPT (Conventioal control)
FWPT (Conventioal control)
FOPT (Feedback ON-OFF )
FWPT (Feedback On-OFF)
FOPT (Layer ON-OFF )
FWPT (Layer On-OFF)
WO
PT,
WW
PT (
sm3)

89
capabilities which increase operation cost and risk. This high level of water production
also implies that the marginal amount of oil produced by operating all the wells for the
entire project life is significantly low. Operators must therefore consider all these factors
before deciding to operate using such a strategy.
The conventional water control case was simulated by shutting in any well once the well
water cut surpassed the threshold value of 70 %. Compared to the baseline case, field
water cut decreased by 33% from 78.1 % to 52%. In addition, cumulative oil production
reduced by 10%, although it should be noted that this control strategy operated on fewer
wells than the baseline case. Only 3 wells were operational in the 6th and 7th year of
production, while 2 wells were producing in the 8th and 9th year. Finally for the last 5
years of production, only 1 well was operational. This therefore a more efficient
production strategy, relative to the baseline case as the extra cost and risks associated
with operating all 4 producers are avoided. The operator must therefore consider such
savings when choosing on a production strategy, rather than rely on absolute values of
oil produced.
Two cases of intelligent modifications were simulated; the feedback ON-OFF control
and the layer ON-FF control. In the feedback ON-OFF case the well water cut was first
checked against a set threshold, after which the most offending layers were shut in when
the threshold violated. For the layer ON-OFF case, the water cut threshold was applied
directly to each producing layer and once violated, the offending layer was shut in.
Compared to the baseline case, the feedback ON-OFF control resulted in a 37% drop in
field water cut (from 78.1% to 49.6%) and a 13.6% reduction in cumulative oil
production. This case also operated fewer wells than the conventional oil control case (3
wells in 2018, 2 wells from 2018 to 2021, and 1 well from 2022 to 2028).
The layer ON-OFF control case operated the least number of wells through the
production life (see summary data below). Compared to the baseline case, the layer ON-
OFF case resulted in a 59% reduction in field water cut (from 78.1% to 31.9%) and a
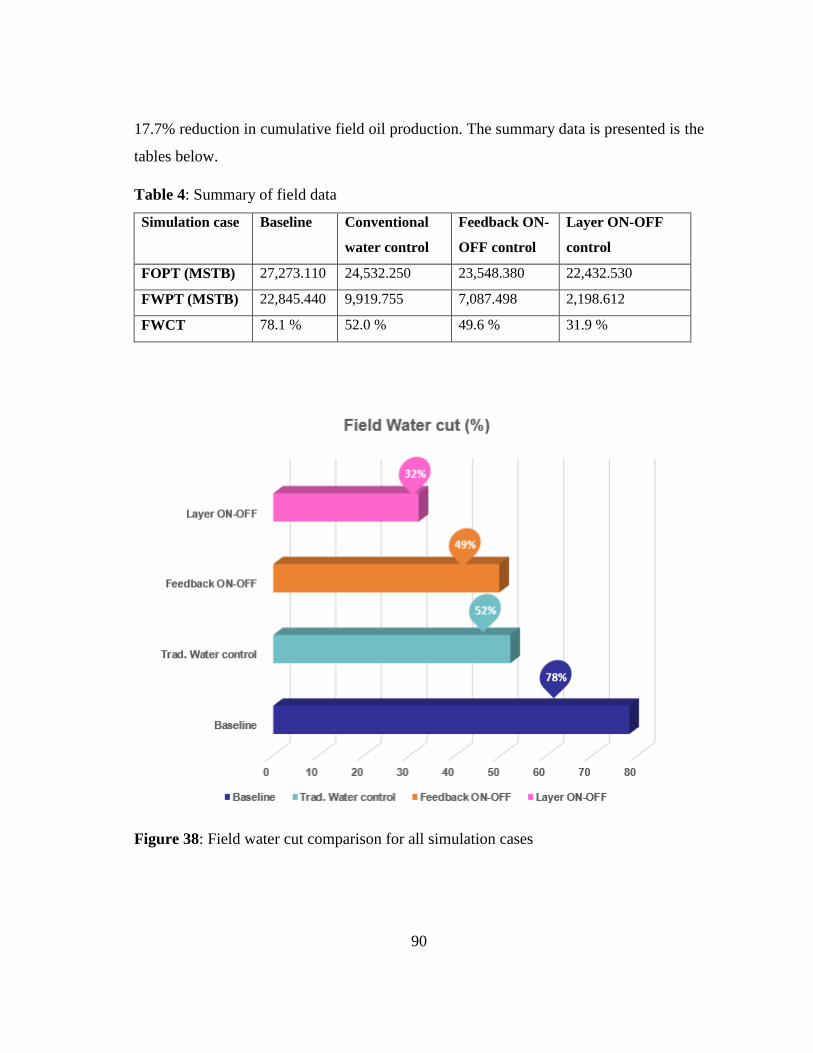
90
17.7% reduction in cumulative field oil production. The summary data is presented is the
tables below.
Table 4: Summary of field data
Simulation case Baseline Conventional
water control
Feedback ON-
OFF control
Layer ON-OFF
control
FOPT (MSTB) 27,273.110 24,532.250 23,548.380 22,432.530
FWPT (MSTB) 22,845.440 9,919.755 7,087.498 2,198.612
FWCT 78.1 % 52.0 % 49.6 % 31.9 %
Figure 38: Field water cut comparison for all simulation cases
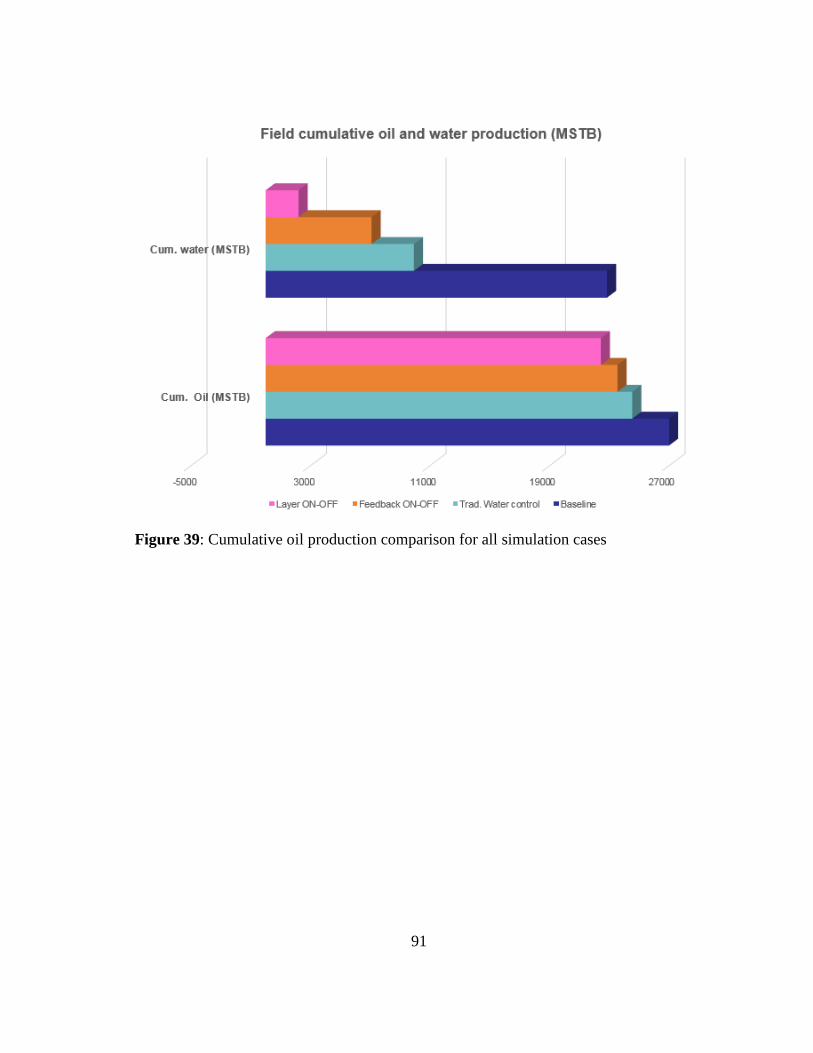
91
Figure 39: Cumulative oil production comparison for all simulation cases

92
Table 5: Summary of well data
Well Control Water
(sm3)
Oil
(sm3)
Water
(bbl)
Oil
(bbl)
Time to
produce (years)
NA1A
Feedback 1.43E+06 6.99E+06 1.20E+07 5.86E+07 8.8
Layer 4.46E+05 6.20E+06 3.74E+06 5.20E+07 7.6
Trad 2.88E+06 7.46E+06 2.42E+07 6.25E+07 9.7
Baseline 7.36E+06 8.43E+06 6.18E+07 7.07E+07 15.0
NA2
Feedback 5.00E+06 1.14E+07 4.19E+07 9.55E+07 15.0
Layer 1.45E+06 1.14E+07 1.22E+07 9.57E+07 15.0
Trad 5.11E+06 1.13E+07 4.29E+07 9.46E+07 15.0
Baseline 5.31E+06 1.11E+07 4.45E+07 9.30E+07 15.0
NA3D
Feedback 2.52E+05 2.19E+06 2.11E+06 1.84E+07 5.7
Layer 8.31E+04 2.05E+06 6.97E+05 1.72E+07 5.0
Trad 5.10E+05 2.29E+06 4.28E+06 1.92E+07 6.1
Baseline 4.98E+06 3.02E+06 4.18E+07 2.53E+07 15.0
RJS19
Feedback 3.84E+05 2.96E+06 3.22E+06 2.48E+07 4.7
Layer 2.11E+05 2.76E+06 1.77E+06 2.32E+07 4.0
Trad 1.39E+06 3.49E+06 1.17E+07 2.93E+07 7.4
Baseline 5.13E+06 4.72E+06 4.30E+07 3.96E+07 15.0
The direct benefits of adopting intelligent well technology (for example reduced water
production) are clearly visible from looking at the field data however, the individual well
data must also be analyzed to fully realize the added value of the technology. From
Table 5 above it can be observed that smart well technology significantly accelerates the
oil production rate, at the same time significantly decelerates water production. For
example analyzing the data for well NA3D indicates that in 5 years, the layer ON-OFF
case produces 68% of the cumulative oil produced by the baseline case in 15 years. This
implies that in the 10 additional year of production in the base case model, only an
additional 32% of cumulative oil was achieved. In addition, the layer ON-OFF case for
this same well produced 98.3% less water that the baseline case. This is a significant
optimization of production efficiency. Besides the gains in efficiency, the value of time
93
savings also include minimizing unforeseen risk associated with extended production,
labor cost, other unforeseen expenses, risk of down time and emergency incidents.
Additional benefits of adopting smart well technology can be observed by analyzing the
data for well NA2. This well produced for all 15 years in all the simulated cases.
However, the layer ON-OFF control case significantly optimized production resulting in
the highest amount of cumulative oil and the least amount of cumulative water produced.
This reflects an optimal scenario where smart well technology should be implemented.
Operators must perform such analysis when deciding production strategy. This workflow
enables engineers to identify which wells are most suitable (add the most value) for
adopting smart well technology.
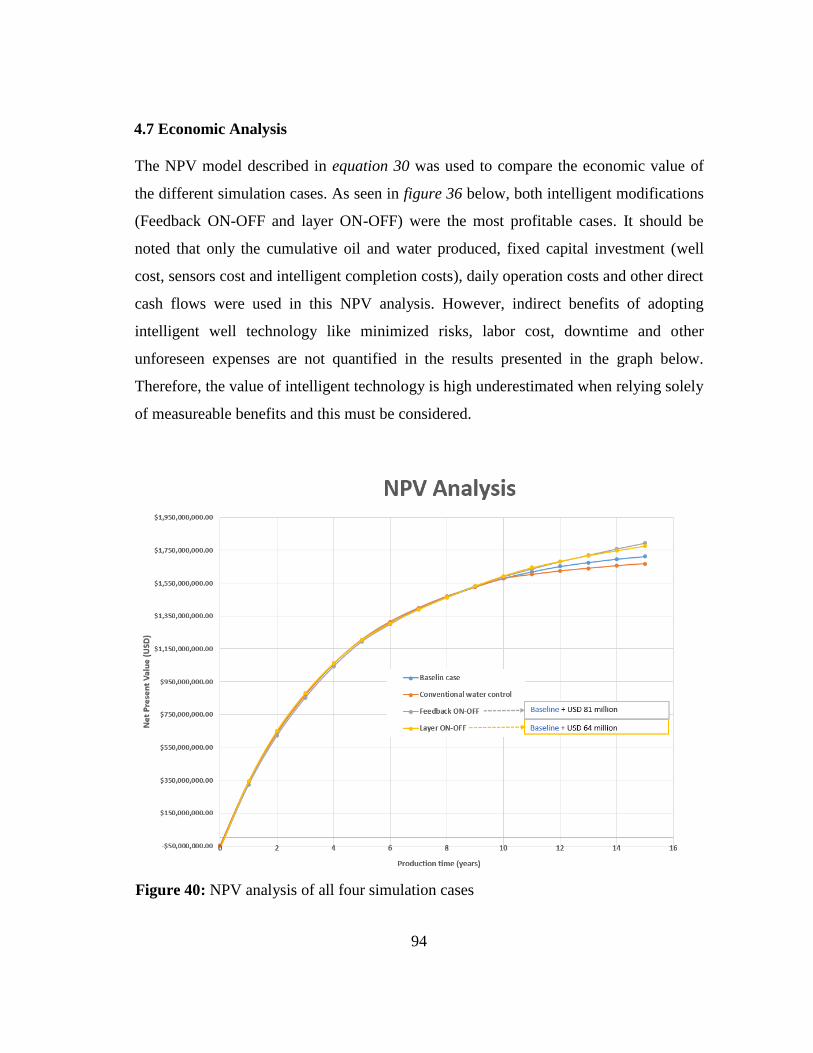
94
4.7 Economic Analysis
The NPV model described in equation 30 was used to compare the economic value of
the different simulation cases. As seen in figure 36 below, both intelligent modifications
(Feedback ON-OFF and layer ON-OFF) were the most profitable cases. It should be
noted that only the cumulative oil and water produced, fixed capital investment (well
cost, sensors cost and intelligent completion costs), daily operation costs and other direct
cash flows were used in this NPV analysis. However, indirect benefits of adopting
intelligent well technology like minimized risks, labor cost, downtime and other
unforeseen expenses are not quantified in the results presented in the graph below.
Therefore, the value of intelligent technology is high underestimated when relying solely
of measureable benefits and this must be considered.
Figure 40: NPV analysis of all four simulation cases
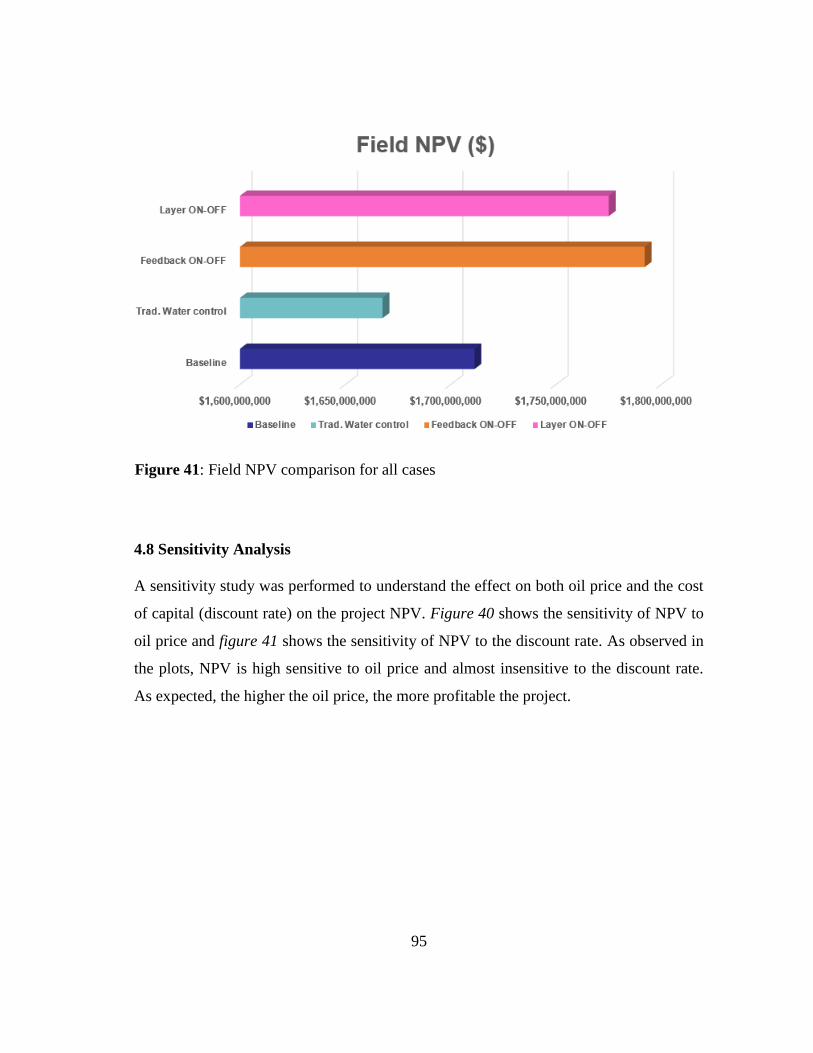
95
Figure 41: Field NPV comparison for all cases
4.8 Sensitivity Analysis
A sensitivity study was performed to understand the effect on both oil price and the cost
of capital (discount rate) on the project NPV. Figure 40 shows the sensitivity of NPV to
oil price and figure 41 shows the sensitivity of NPV to the discount rate. As observed in
the plots, NPV is high sensitive to oil price and almost insensitive to the discount rate.
As expected, the higher the oil price, the more profitable the project.

96
Figure 42: Sensitivity analysis of oil price
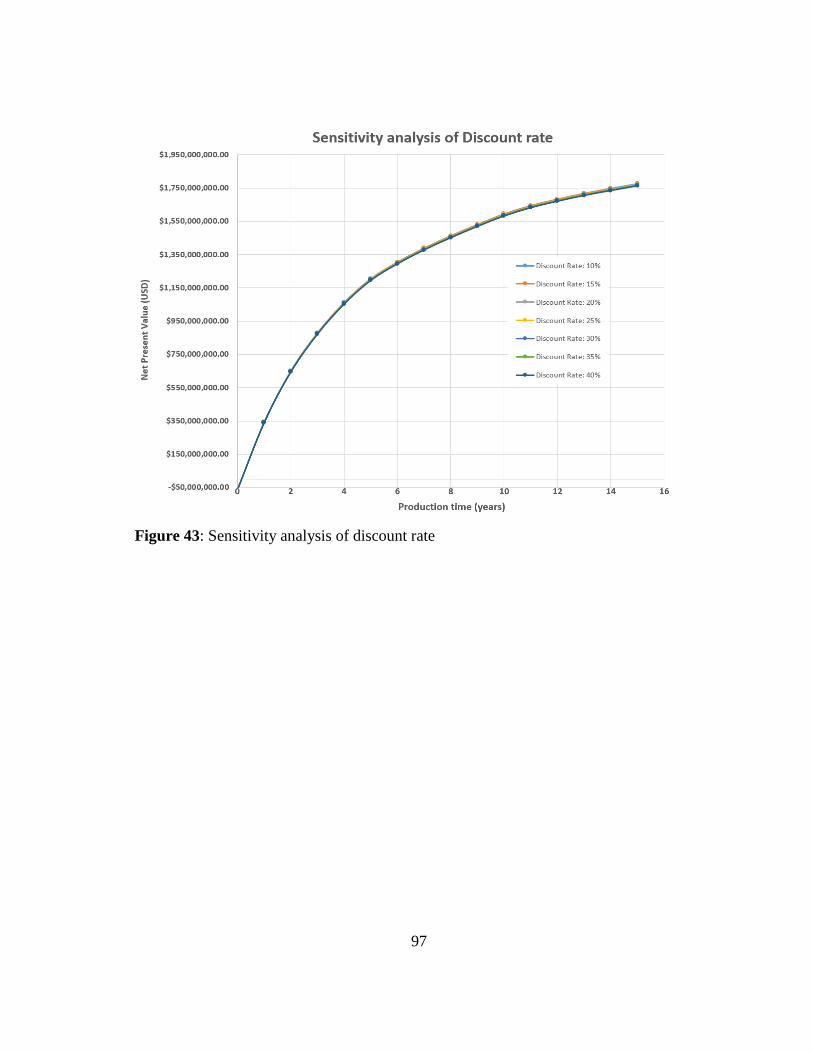
97
Figure 43: Sensitivity analysis of discount rate
98
CHAPTER V
CONCLUSIONS AND RECOMMENDATIONS
5.1 Conclusions
This thesis has successfully investigated and developed a hierarchical closed loop
workflow process for production optimization of field with multiple vertical wells.
Although, the process was studied using the UNISIM-I-D reservoir model, it can be
applied during the field development stage to any field to access the applicability of
intelligent well technology.
The results demonstrate strong value derived from the adoption of intelligent downhole
control in this project. Figures 38, 39 and 41 clearly show that the three decision drivers
for this project were met. Field water cut was significantly reduced from 78.1 % in the
baseline case to 31.9% in the Layer ON-OFF, and oil production was economic in the
cases where intelligent modifications were adopted leading to the highest NPV forecasts.
The NPV forecasts presented do not include some variable factors like savings in labor
costs and unforeseen risk associated with extended production and therefor the NPV
values for the intelligent modifications could be higher.
It is important to note that the decision drivers are not fixed and could be different for
different operators. The weighted value of each decision driver could also vary from
project to project therefore it is critical that the decision drivers should be properly
assessed and clearly defined at the start of the analysis.
The sensitivity analysis also demonstrated that oil price is a key variable that must be
thoroughly examined and forecasted before making the decision to adopt intelligent well
technology. As seen from the UNISIM-I-D model study, a significant benefit of
intelligent well technology is production timesaving due to accelerated production and
this could be of significant value especially in low oil price environments.

99
Lastly, it should be noted that the intrinsic value in intelligent well systems is highly
dependent on the reliability of the technology. This installed system must perform a
minimum throughout the productive life of a well without the need for well interventions
for system performance related issues. The major players (Schlumberger, and
Halliburton (Weahtherford and Baker Hughes) have demonstrated the capability to
deliver reliable systems that meet this critical requirement. The reliability and value of
the systems continue to be demonstrated as real time production data is collected. The
benefits of intelligent well systems are significant and continue to be proven in several
major fields. The widespread adoption of this technology is therefore encouraged and
inevitable, especially in the low crude oil price environment of recent years.
5.2 Recommendations
Based on this research study, the following recommendations are suggested:
Pre-development or re-development evaluations to assess the benefits of adopting
smart well technology are encouraged. Highly heterogeneous formations that are
susceptible to early breakthrough of unwanted fluids are prime targets for this
technology.
Further research and field data collection should be dedicated to improve
operator confidence in the reliability and benefits of intelligent well systems.
Intelligent well technology should be promoted in other non-producing
applications like smart injection, and dump flooding to improve efficiency and
minimize facilities costs.
More research effort should be dedicated to better incorporate simulation
capabilities of intelligent well systems to commercial software. Integrating
intelligent well simulation with other commercial simulator applications could
add more value to understanding the full impact on the entire project.

100
REFERENCES
Ajayi, A. and Konopczynski, M.: “Intelligent-Well Technology Reduced Water
Production in a Multilateral Oil Producer”, Presented in the 2006 SPE Annual
Technical Conference and Exhibition, San Antonio, September 24-27, 2006.
Akram N, Hicking S, Blythe P, Kavanagh P, Reijnen P, Mathieson D. Intelligent Well
Technology in Mature Assets. Offshore Europe; 4-7 September 2001; Aberdeen,
United Kingdom: Copyright 2001, Society of Petroleum Engineers Inc.; 2001.
Alhuthali, A. H., Datta-Gupta, A., Bevan, Y., Fontanilla, J. P., (2009). Field Applications of
Waterflood Optimization via Optimal Rate Control With Smart Wells, paper SPE 118948
presented at the SPE Reservoir Simulation Symposium in Woodland, Texas, U.S.A., 2-4 February
Andrei S.P. Optimizing the Selection of Lateral-Re-Entry Wells Through Data-Driven
Analytics, paper SPE 170702, presented at the 2014 SPE Annual Technical Conference
and Exhibition, Amsterdam, 27–29 October
Barreto, C.A., "Optimization Methodology for Use Assessment Control Valves Wells in
the Selection of Oil Production Strategy" Support FAPESP, 2007-2014
Bjarne, A.F., Jensen, J.P, (2011) Performance Analysis for Closed Loop Reservoir
Management. SPE Journal 16(1).
Briz-Quintero, X., Sofyan, M., Pouget, P., Le-Roch J., Authier J., Deffous Y. , Gurses
S.F., Gulamov E., Mukashev N., Jaafar M.R., Abul-Hamd I., and Al-Naimi
A.R., (2014). Successful Application of Intelligent Completions in Al Khalij Field,
presented at the 2014 Abu Dhabi International Petroleum Exhibition and Conference,
Abu Dhabi, 10–13 November
Brouwer, D. R. and Jansen, J.D. (2002). Dynamic Optimization of Water Flooding with
Smart Wells Using Optimal Control Theory, paper SPE 78278 presented at the SPE
European Petroleum Conference, Aberdenn, UNITED KINGDOM, 29-31 October.
Chacon A, McCutcheon J.B, Schott D.W, Arias B.J, Wedgwood J.M. Na Kika Field
Experiences in the Use of Intelligent Well Technology to Improve Reservoir
Management. International Petroleum Technology Conference; 4-6 December 2007;
Dubai, U.A.E.: International Petroleum Technology Conference; 2007.
Collins J.R, Neuber E.B. The Agbami Intelligent Well: Examples Of Active Reservoir
Management. SPE International Production and Operations Conference & Exhibition;
14-16 May 2012; Doha, Qatar: Society of Petroleum Engineers; 2012.
Conti, J.J., Holtberg, P.D., Beamon, J.A. “Annual Energy Outlook 2006 with
Projections to 2030 Overview,” DOE/EIA, Office of Integrated Analysis and
Forecasting, EIA, Washington DC (2006).
101
Cunningham, R., Davis, N. “Sparse matrix numbering sequence”,
https://courses.engr.illinois.edu/cs101/mps/mp1/mp1.htm. Spring 2016.
Dumville, J. “Smart Well Graph.” E-mail to Zeid Ghareeb. 5 April 2008.
Dyer, S., Reyes, Y. E. A., Huber, M., Raw, I., Reed, D. “Intelligent Completions – A
Hands-Off Management Style”,
https://www.slb.com/~/media/Files/resources/oilfield_review/ors07/win07/intelligent.
pdf, Winter 2007.
Ertekin, T., Abou-Kassem, J.H., King, G.R., Basic Applied Reservoir Simulation (1993),
Richardson, Texas: Textbook Series, SPE
Esmaiel, T.E.H., (2007). Optimization of WAG in smart wells: An experimental design approach. Department of Geosciences & Engineering, Delft University of Technology.
Gai, H.: “A Method to Asses the Value of Intelligent Wells”, Presented in the 2002
SPE Asia Pacific Oil and Gas Conference and Exhibition, Melbourne, October 8-10,
2002.
Gao, C. H., Rajeswaran, R. T., & Nakagawa, E. Y. (2007, January 1). A Literature
Review on Smart Well Technology. Society of Petroleum Engineers. Paper SPE 106011,
presented at Production and Operations Symposium, March 31 – April 3, 2007 in
Oklahoma, U.S.A.
Gildin, E., Klie, H., Rodriguez, A.A., Wheeler, M.F, and Bishop, R.H., 2006,
Development of Low-Order Controllers for High-Order Reservoir Models and Smart
Wells. Paper SPE 1022214, presented at SPE Annual Technical Conference and
Exhibition, September 24-27, 2006, in San Antonio, Texas, U.S.A.
Glandt C.A. “Reservoir Management Employing Smart Wells: A Review”, SPE
Drilling & Completion Journal, December 2005. 20(4): p. 281-288.
Greenberg, Jerry. “Intelligent completions migrating to shallow water, lower cost
wells” Offshore. PennWell, 2nd February 1999
Hadley, M.R, Brown, G.A, Naldrett, G.J., 2005, Evaluating Permanently Installed Fiber-
Optic Distributed Temperature Measurements Using Temperature-Step Resolution.
Presented in SPE International Improved Oil Recovery Conference in Asia Pacific,
Kuala Lumpur, Malaysia.
Jalali, Y., Bussear, T., and Sharma, S. (1998). Intelligent Completions Systems – The
Reservoir Rationale, paper SPE 50587 presented at the SPE European Petroleum Conference, The Hague, Netherlands, 20-22 October.
Jerry G.: “Intelligent completions migrating to shallow water, lower cost wells”,
Offshore magazine. http://www.offshore-mag.com/articles/print/volume-59/issue-
2/news/production/intelligent-completions-migrating-to-shallow-water-lower-cost-
wells.html. February, 1999.

102
Konopczynski M, Ajayi A, Russell L.A. Intelligent Well Completion: Status and
Opportunities for Developing Marginal Reserves. Nigeria Annual International
Conference and Exhibition; 4-6 August 2003; Abuja, Nigeria: Society of Petroleum
Engineers; 2003.
Konopczynski, M. and Ajayi, A.: “Design of Intelligent Well Downhole Valves for
Adjustable Flow Control”, Presented in the 2004 SPE Annual Technical Conference
and Exhibition, Houston, September 26-29, 2004.
Mansoori, M., Van den Hof, P., Jansen, J.-D., & Rashtchian, D. (2015, October 1).
Pressure-Transient Analysis of Bottomhole Pressure and Rate Measurements by Use of
System-Identification Techniques. SPE Journal 20(5): 1,005-1,027.
Márcio S.A.P, Barreto, C.E.A.G., Chiozer, D.J. (2015) "Assisted Optimization Method
for Comparison between Conventional and Intelligent Producers Considering
Uncertainties". Journal of Petroleum Science and Engineering 133(2015): 268-279.
Mazerov, K. “Intelligent Wells: It’s all or nothing”, Well Dynamics,
http://www.welldynamics.com/technology/applications/applications.htm, February
2007.
Mian, M. A, Project Economics and Decision Analysis (Volume 1: Deterministic
Models), PennWell Corporation, Tulsa (2002).
Montaron, B., Vasper, A. “Intelligent Completions”, Schlumberger,
https://www.slb.com/~/media/Files/resources/mearr/num8/5_21.pdf, 2007.
Mubarak S, Dawood N. Lessons Learned from 100 Intelligent Wells Equipped with
Multiple Downhole Valves. SPE Saudi Arabia Section Technical Symposium; 9-11 May
2009; AlKhobar, Saudi Arabia: Society of Petroleum Engineers; 2009.
Mubarak, S. M., Pham, T. R., Shamrani, S. S., and Shafiq, M. (2007). Using Down-Hole
Control Valves to Sustain Oil Production From the First Maximum Reservoir Contact,
Multilateral and Smart Well in Ghawar Field: Case Study, paper IPTC 11630 presented at the International Petroleum Technology Conference in Dubai, U.A.E., 4-6 December.
Nasrabadi, H., Morales, A., Zhu, D. (2011). Well placement optimization: A survey with
special focus on application for gas/gas-condensate reservoirs. Journal of Natural Gas
Science and Engineering 5(2012): 6-16.
Paino W, Tengah N. Using Intelligent Well Technology to Define Reservoir
Characterization and Reduce Uncertainty. SPE Asia Pacific Oil and Gas Conference and
Exhibition; 18-20 October 2004; Perth, Australia: Society of Petroleum Engineers; 2004.
Park, C. H., Aral, M. M., (2004). Multi-objective optimization of pumping rates and well
placement in coastal aquifers. Journal of Hydrology 290(1): 80-99
Parshall J.: “OTC Highlights Technical Challenges, Effects of Oil Price Volatility”,
JPT Online (July 2015).

103
Pinto, M.A.S, Ghasemi, M., Sorek, N., Gildin, E. (2015). Hybrid Optimization for
closed-loop reservoir management, SPE-173278
Rassenfoss, Stephen. "Journal of Petroleum Technology May 2015 Issue." Journal of
Petroleum Technology. Web. 16 Feb. 2016.
Recovery from Complex Reservoirs,” paper SPE-84855 presented at the 2003
International Improved Oil Recovery Conference, Malaysia October 20-21, 2003.
Sakowski, S. A, et.al.: “Impact of Intelligent Well System on Total Ecnomics of Field
Development”, Presented in the 2005 SPE Hydrocarbon Economics and Evaluation
Symposium, Society of Petroleum Engineers: Dallas, April 3-5, 2005.
Saleri, N.G.: “Haradh III A Milestone for Smart Fields”, JPT Online (November
2006).
Sarma, P. (2006) Efficient Closed-Loop Optimal Control of Petroleum Reservoirs under
Uncertainty. Stanford University, Phd. Dissertation.
Snaith, N. et.al (2003) “Experience with Operation of Smart Wells to Maximize Oil
Recovery from Complex Reservoirs”. Paper SPE 84855, presented at the SPE
International Improved Oil Recover Conference in Asia Pacific, October 20-21, 2003,
in Kuala Lumpur, Malaysia.
Volcker, C., Jorgensen, J.B, (2010) Adaptive Step Size Control in Implicit Runge-Kutta
Methods for Reservoir Simulation. Presented at the 9th International Symposium on
Dynamics and Control of Process Systems on July 5-7, 2010, in Leuven, Belgium.
Volcker, C., Jorgensen, J.B., Stendy, E.H., (2011) Oil reservoir production optimization
using optimal control.
Zhu D, Furui K. Optimizing Oil and Gas Production by Intelligent Technology. Paper
SPE 102104, presented at the SPE Annual Technical Conference and Exhibition; 24-27
September 2006; San Antonio, Texas, USA: Society of Petroleum Engineers; 2006.
Zinati, F., (2014). Using Distributed Fiber-Optic Sensing Systems to Estimate Inflow
and Reservoir Properties. Phd Dissertation, Department of Civil Engineering and
Geosciences.
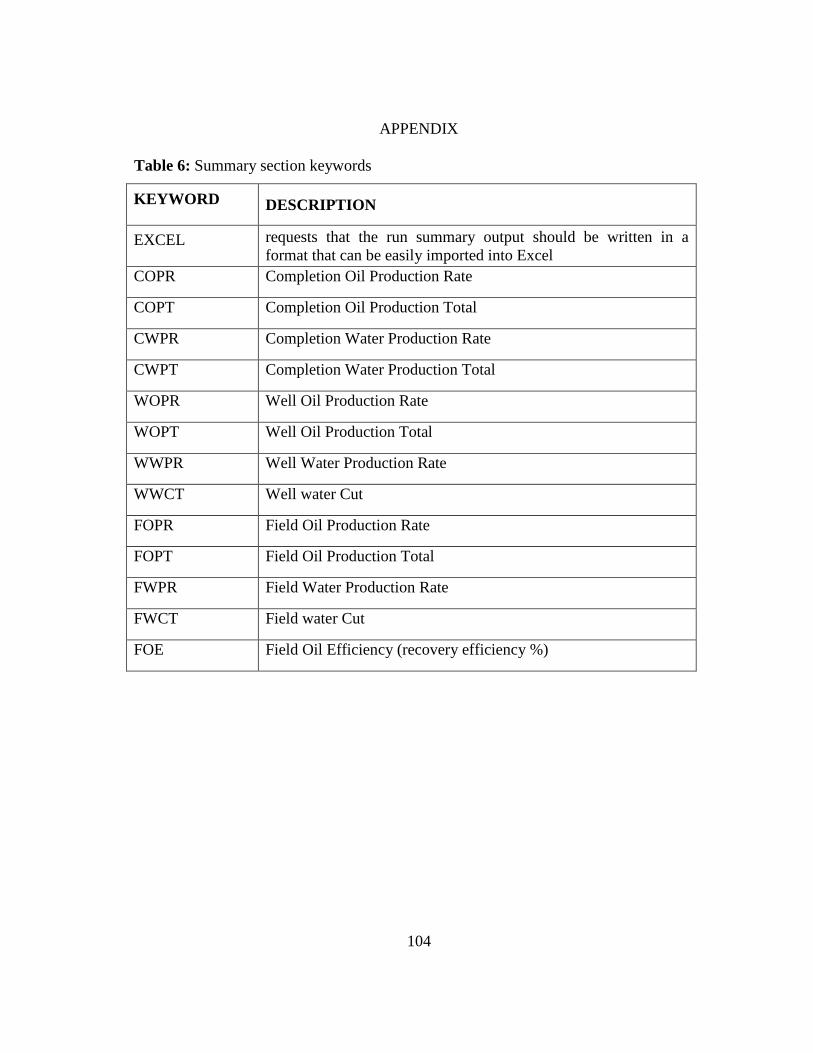
104
APPENDIX
Table 6: Summary section keywords
KEYWORD DESCRIPTION
EXCEL requests that the run summary output should be written in a
format that can be easily imported into Excel
COPR Completion Oil Production Rate
COPT Completion Oil Production Total
CWPR Completion Water Production Rate
CWPT Completion Water Production Total
WOPR Well Oil Production Rate
WOPT Well Oil Production Total
WWPR Well Water Production Rate
WWCT Well water Cut
FOPR Field Oil Production Rate
FOPT Field Oil Production Total
FWPR Field Water Production Rate
FWCT Field water Cut
FOE Field Oil Efficiency (recovery efficiency %)