a technological study of the ocean quahog...
TRANSCRIPT

June 1947 Washington 25, D.C. Vol. 9, NO.6
A TECHNOLOGICAL STUDY OF THE OCEAN QUAHOG FISHERY
By w. Arcisz~~ and L. A. Sandholzer .~.
ABSTRACT
'lhe ocean quahog (Arctica islandica) offers an excellent source of food and the industry developed around this mollusk during the recent war appears to be sufficiently stabilized to make it an integral part of the Atlantic Coast fisheries. The technological aspects of the ocean quahog are discussed in this report. This includes methods of catching, processil'.g and marketing, along with certain economic considerations.
The sanitation problems of the industry have been carefully investigated. 'lhe bacteriological data are presented in detail in order to indicate the major sources of difficul ty. I t was found that methods -of storage, lack of adequate refrigeration and. certain plant practices were responsible for most of the losses in sanitary quality which have been reported. Methods for eliminating these difficul ties are indicated at the end of the report.
The presence of the ocean quahog, Arctica islandica, in the waters of Rhode Island and adjacent areas has been known for same time . It was not until May 1943, however, that this shellfish was exploited as a food resource. At that time, under the impetus of the war food program, commercial utilization of this clam was initiated. Although a newcomer in the shellfish field, it has already established itself commercially and it may continue to be found in the market for years to come. Because of its abundance, large size, and fine flavor, it has found a ready acceptance among processors of chowders and related shellfish products. On the other hand, its texture limits its possibilities to this restricted field.
In order that the industry which was developing around this shellfish might produce a safe, wholesome product, the U. S. Fish and Wildlife Service in cooperation with the State of Rhode Island, from October 1943 to November 1944, undertook an investigation which included technological and bacteriological stUdies. From the results, it has been possible to indicate the sources of potential difficulties and to permit the industry to produce a first-class product.
The technical findings of the ocean quahog investigation are presented in this report. A previous publication by the Rhode Island Division of Fish and Game, (1945) presents, in a more popular form, a survey of the industry based on the findings of the same investigation. • Bacteriologists, Fishery Technologic&l Laboratory, Division of Commercial Fisheries, College
Park, Maryland.

2 COMMERC IiU.. FISHERIES REVIEW Vol. 9, No.6
PART I
The ocean quahog!! belongs to the family Pleurophoridae (Pratt, 1935) which includes all bivalves with the mantlelobesuuited posteriorly by a curtain pierced
FIGURE I
with two siphonal orifices. All of' the species in this group have a foot which is thick and tongueshaped. There are two large unequal gills on each side which are uni ted behind, forming a complete partition (fryon, 1873) .
The distinguishing -anatomical features of ~rctica islandica have been described by Adams andAdams (1858) and Tryon
(1873). The shellfish has a large, thick, ponderous shell with incurved, contiguous, prominent beaks. Tryon gives the average dimensions of the shell as 3.3 inches in length and 2.8 inches in width. The shell is covered with a coarse, wrinkled epidermis which iS,black but shades into an olive brown towards the margin (Fig. land lA). The um~o occupies a central position, and the hinge contains three
ANUS
ElOJI\I\M ~\PHOl"1 --I-H
IN\:URl\fNT S'P)401i __ -+'<~
F I GUR E I A
diverging cardinal teeth. There is also one posterior tooth in each valve. The mantle is open in front and beneath, but is united behind by a curtain. The siphons are short and compressed with ciliated orifices. The anal orifice is narrow and conical with short cilia crowning the apex. The gills are large and quadrangular,unequal in size and are united posteriorly. The foot is thick and linguiform.
Although originally believed to be a strictly European species (Adaos and Adams, 1858) it is now known that the ocean quahog is widely distributed in the lfCommon name accepted by the U. S. Food and Drug Administration, 1944. Letter to the Olief
of the Division of Commercial Fisheries authorizing the use of the name "ocean quahog."
June 1947 cO:. :ERClAL
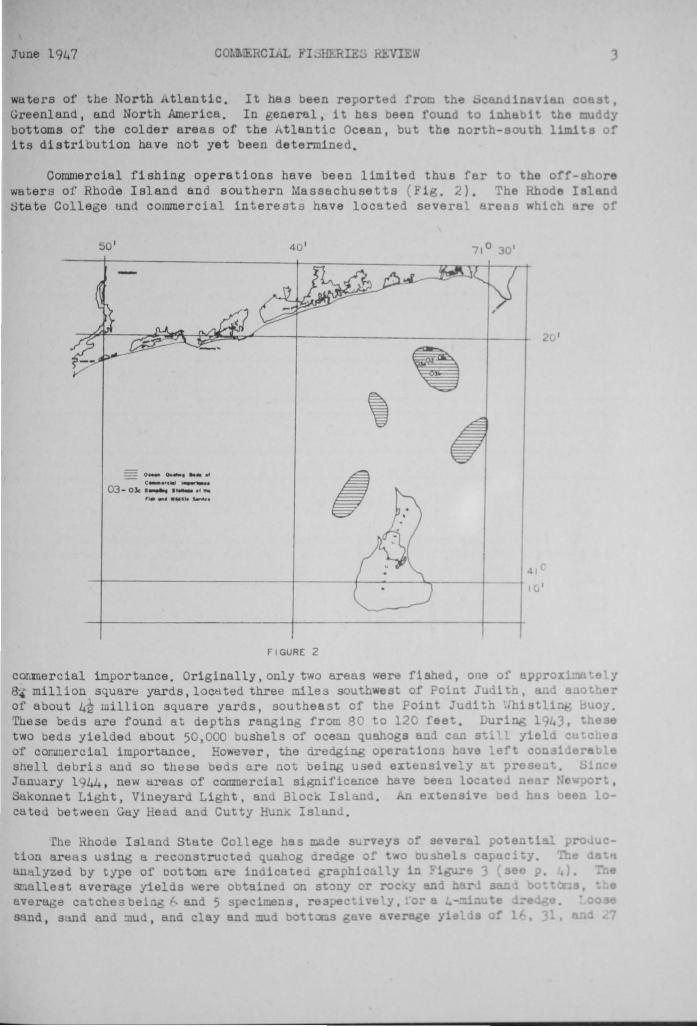
wuters of the North Atlantic. It h&s been repor t d r t Greenland, and North Ambrica. In general, it bss been ound bottoms of the colder areas of the ktlantic Ocean, but tbe nor th - south its distribution have not yet been determined.
Commercial fishing operations have been limited thus fa r w&ters of Rhode Island and southern Massachuse t ts ( i g . 2) . t;t&te College und commercial interest s have located se veral areas
50' 40 ' 71° 30'
, - 0 __ 0. ....... ..
c_.tc.. .. ' ..... -.... 03-0le ............... ,"-
,'- ..,4 ...... ........,.
2 •
(, '
FI GURE 2
corimercial 1l!lportance. Originally, only t wo areas Vie re fishe • one of a 8'-4 million s uare yards, loclited three miles southwe st of Poin J i 0, of about 4~ million square yards, southea st of the Point udlth., 1 These beds are found a t de p t h s ra agi n f r om 0 to 120 fee . two beds yielded about 50 ,000 bushels of ocean quaho s a can st of cQC~ercial importance. Eo~ever. t he drodgi ope rations h ve snell de bris and so these be - re not bei u e ext naively at Jfilluary 1944. ne Ii.eas of commer ci al s ignificance have bloc t Sakonnat Light, Vineyard L 1~h t . an Bloc Isl cated bet\~eell Guy Head and Cutty H IlK Isluod .
rhe Rho e Islan tion
' e cat c nd, Sill

4 COMMERCIAL FISHERIES REVIEW VOl. 9, No.6
quahogs for the same length of time. The highest average yield was obtained on "sticky" mud bottoms where 41 specimens were caught on a 4-minute drag.
ROCKY OR STONY
HARD SAND
LOOSE SAND x
~ I----------------...II gl----------------------.... ... o
"' Q.
CLAY MUD
~ 1------------------------------------------------'
SAND AND MUD
ST I CKY MUD
FIGURE 3 - AVERAGE NUMBER OF QUAHOGS CA UGHT IN 4 MINUTES OF DREOG I NG
In Figure 4. the same data are indicated in relation to the water depth. Very few specimens were oaught in waters less than 80 feet in depth, the average hauls
'" "' I-« ~
... o :t: IQ.
"' o
B 70-79 I
80-89 I -
90-99 I 100-109 J
110-119 1 J I I I I I I I I I I I
o 10 20 30 40 50 60
f I CURE 4 - AVERAGE NUMBER Of QUAHOGS f" '\Ur.I"T IN 4 MINUTES OF DREf'G I NG
being 3 per 50-60 feet of water and 5 per 70-80 feet. Between depths of 80 and 90 feet, an average of 13 specimens was taken and an average of 22 was obtained
I

Jw,t; 1947 COMI.lERCIAL FISHErtIE.s REVn.W
in ()O-lOO feet. The largest haul was made between 100-110 feet, the avera e number o~ specimens being 65. Beyond this depth, the averaee dropped to 10 quahogs (110-lLU feet) per 4-minute drag of the dredge.
Dredging for ocean quahogs is similar to the power dredging of the b~y uahog ~~ practiced in the inshore waters of Rhode Island and Massachu setts. Th on ~ difference is that the ocean quahog is taken in80-120 feet of water instead of 18-30 feet. rhe boats used are regular fishing vessels of the dragger type (Fig. 5), being 40-50 leet long. ~ few 60-f5-foot oyster boats also have been converted for ocean quahog operti tions. The boa ts are powered wi th gasoline or Die sel engines of 40 or more horsepOVier. The strain put on the vessel by iredging is severe and the masts have to be sound and well stayed. The smaller boats are usually manned by a captain and a crew of two men. The larger boats usually have 1:1 crE:!W of three in addi tion to the captain. FIGURE 5 - HPI CAL OCEAN QUAHOG ORr"
'rhe dredges used are of the Nantucket· type and are known as or "queer" dredges. In operation, they act as a multi-toothed through the bottom and scoops the animals
"rockL1.O;-chni r" ploVJ which digs
intoen attached chain bag. These are custom-buil t and cost from$lOO for a 12-toothed dredge to $130 for a 20-toothed instrument, complete with chain bag. The teeth are 7 inches long and are spaced li-2 inches apart. The bottom of the dredge has two channels which are weighted with about 100 pounds of lead. The bag, made of steel
SCA LE I N FEET
FIGURE 5A -PATENTED DREDGE FOR
OCEAN QUAHOG
FRONT VIEW
!l=----o. - -- ~-~ REAR BOTTOM BA R
S DE V I EW
rings, 2 inches in diameter, is attached to th~ dredge and is purse-string arrangement (Fig . 5A) .
The dredge is operated from e power winch driven by the boat e~ine. winch has a single cable drum equipped with either a hand or foot br e.
e

6 COMMERCIAL FISHERIES REVIEW VOl. 9, No. 6
drum houses 50 fathoms of 7/16-inch cable which is used for raising and l ower ing the dredge. The cable is fed from the drum through a block secured to the mast.
It then runs through another block on the boom and thence to the towing arm of the dredge. The dredge is towed by a rope attached to the towing arm and fast ened to the Sampson post of the boat.
In operation, the dredge is lowered over the side and dropped to the bottom. It is then towed for 15 minutes. At the end of this time, it i8 raised and the mud removed by rinsing the loaded dredge in the water several times, The dredge is then lowered on the deck and the catch is dumped by re~easing the purse string, The dredging is repeated while the catch is being culled and bagged (Fig, 5B),
FIGURE 58 - LOWERING THE DREDGE
Since these quahogs are found outside of the 3-mile limit, the State statutes regarding inshore dredging do not apply and so the length of the season and size of catch are not legally restricted, Because of poor weather, however, the actual dredging time i8 11mi ted to an average of about 17 days per month. The annual average catch per boat is about 71 bushels per day. The monthly and daily records of the dredging operations are shown in Tables 1 and 2.
The culled catch is placed in bags containing one bushel each (90 lbs.) and these are stored on the deck of the boat without any protection from the weather
Table 1 - Production of Ocean ~ogs by Months During 1943
Month Distribution Month Distribution
Mili ta.ry Civilian Mili ta.ry Civilian Gallona GaJ.lons Gellons Gellans
~ ..................... 1,238 248 September •••••••••••••• 60 9,329 June •••••••••••••••••••• 80 ~' 798 October •••••••••••••••• 1,745 4,534 July •••••••.•••••••.•••• - ,tl November ............... 4,204 l:m August ••.•••••••.••••••• .Dlli. 3 10 December ••••••••••••••• ZIO~2 1 8
Itj m 13.042 i"j,o-g Grand total ••• ........ 14.3bO"' 35.32Z-·
-Frozen in 1 gallon IDe tal. con tainer s con tai ni tj pounds, ng ··Frozen in 5-pound. pa.per r.artons - 5,625 gallons; fresh in 1 gaJ.lon Jaetal. containers -
29,697 gallons. and without refrigeration. The bags are stacked on top of one another so that there is little opportunity for air to circulate between them. Upon arrival at the dock the bagged catch is transferred to a closed truck. No refrigeration is employe~ and in warm weather this operation is equivalent to placing the quahogs in an incubator. The period of truck transportation varies with the distance to the plant. Occasionally, the catch is kept in the truck for as long as 2 or 3 lfSince this paper was wri tten, one of the leading producers ha. star~d using refrigera.ted
trucks for ba.uling.

June 1947 C01.!ERCL:.L ISHERIES REVIE
days. The quahogs are without refrigeration throughout this tUn an no tion is provided. Because of this. nany spe imens he e to 0 discard d bags are finally opened .
Table ? - Data on Dail Ooerations
Month
1 'umber June ..................... -4-July ..................... 'j August ..... . ............ 6 Se-ptember ................ I) 70 October .................. 3 75 November ................. 4 ~~ December ................. 4
l241 rp3 189 January .................. 20 4 Feb ............... 1 1 10'
7
H .0
1 . 1)9 I) 3
Storage at the processing plants may not be much better than that on t e vessel or truck. The bags are frequently piled on the floor of the warm or he ted shucking house and are kept without ventilation or refrigeration until shucked.
The shucking operations are very similar to those employed with other shel l fish. The shuckers supply themselves with shell stock by carrying a bag over to the bench. The quahogs are dumped out and are washed free of mud and detritus with running water. The meats are shucked into gallon containers. In same plants, the shell liquor is saved, but thi s is not common practice . (A 90-pound bushe of ocean quahogs yields abou t lt gallons of drained meats, or about 12 pound.)
The shucked meats are delivered to a packing room where they are dumped cnto a perforated metal platform and washed with fresh water before being pack After packaging, they ere refrigerated.
Very few ocean quahogs are sold as shellstock (1,043 bushels in 19 3). The majority of the catch is sold as either fresh or frozen mats. The fresh quaho are usually sold in l-gallon, single-service, or returnable metal container. Gallon packages usually contain 8 pounds of meats. The frozen stock is c e in either l-gallon metal cans or in 5-pcuud paper packages. The sales for 19 3 of the different types were:
'resh - I-gallon containers - 15.687 gallons Frozen - I-gallon container" - 36.360 gallons 'rozen - 5-pound paper cartons - 5,625 gallons or 45. P d
The economics of the ocean quahog industry, a.t the time this r port ten, are summarized in Table 3. The c&tch of the smaller boats (40- 50 ~ erages betwben 100 and 150 bushels pe: day of actual dr dgin ; that of th boats averages between 200 and 250 bushels. The price er 90-poun bu 1 between $1.00 and 1.40 wi th an average, in 19 3. of 1.25 • .t1. bu stoc~ yields It gallons of meats and the cost of shucking is 35 c nts ~ average shucAer can produce an average of 3 g 110n the fina.l product, whether fresh or frozen, has varied from 3.00 to a price of $1.7 - 1.85 to l arge qonsumers and 2.50 p r sumers. The number of processors has varie boy t 0 h taining high production . Ocean qua.hog pro uct10n is seaso a1
8 COMMERCIAL FISHERIES REVIEW Vol. 9, No . 6
Generally speaking, the best we~ther for dredging occurs during the summer mont hs and secondly, at this time the oyster shuckers are available to the ocean quahog industry.
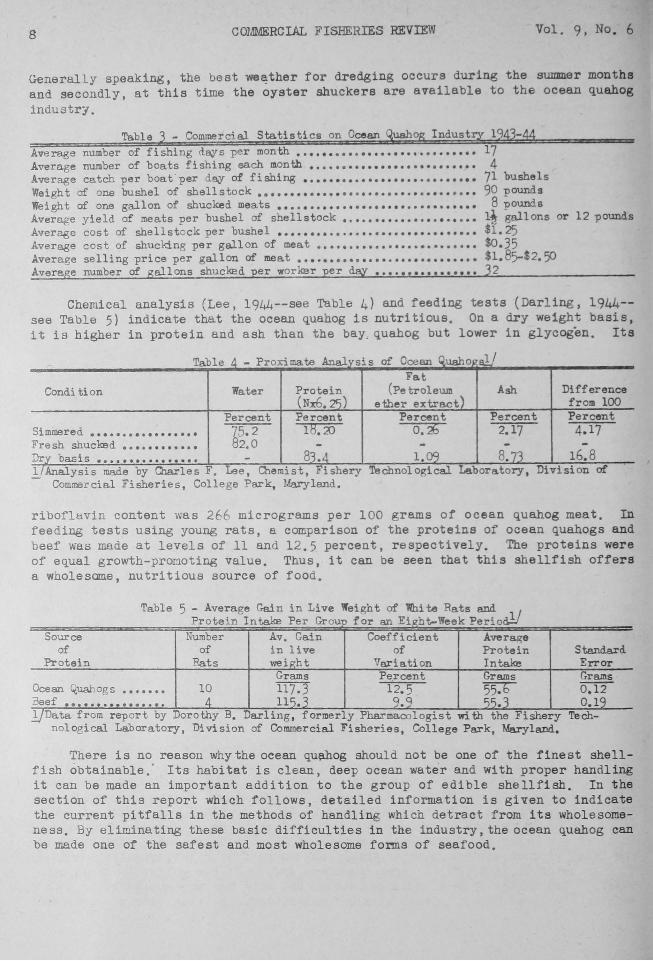
Table 3 - Commercial Statistics on Ocean gog Industry 1943-44 Average number of fishing days per month ••••••••• • •••••••••••••••••• 17 Average number of boats fishing each month ••••• • •••••••••••••••••••• 4 Average catch per boat'per day of fishing •••••• • •••••••••••••••••••• 71 bushels Weight of one bushel of shell stock •••••••••••••••••••••••••••••••••• 90 pounds Weight of one gallon of shucked meats •••••••••••••••••••• •••• ••••••• 8 pounds Average yield of meats per bushel of shellstock ••••••••••••••••••••• I! gallons or 12 pounds Average cost of she11stock per bushel •••••••• ••••• •••••••••••••••••• $1.25 Average cost of shucking per gallon of meat •••••••••••• ••••••••• •• •• $0.35 Average selling price per gallon of meat •• •••• •••• •••••••••••••••••• $1.85-$2.50 Average number of gallons shucked per worker per day •••••••••••••••• 32
Chemical analysis (Lee, 1944--see Table 4) and feeding tests (Darling, 1944-see Table 5) indicate that the ocean quahog is nutri tious. On a dry weight basis, it is higher in protein and ash than the bay. quahog but lower in glycogen. It s
Table 4 - Proximate Analysis of Ocean Qu.aho~:af.J Fat
Condition Water Protein (Petroleum Ash Difference (Nx6.25) ether extre.ct) from 100
Percent Percent Percent Percent Percent Simmered •••••••••••• ••••• 7.5.2 18.:20 O. j) 2.17 4. 17 Fresh shucked •••• •••••••• 82.0 - -Dry basis ••.•••• .•••.•••• - 83.4 1.09 8. 71 16.8 l{Analysis made by Cnarles F. Lee, Chemist, Fishery 'Ie chno1 ogi cal Laboratory, Division of
Com~rcial Fisheries, College Park, Maryland.
riboflavin content was 266 micrograms per 100 grams of ocean quahog meat. In feeding tests using young rats, a comparison of the proteins of ocean quahogs and beef was made at levels of 11 and 12.5 percent, respectively. The proteins were of equal growth-promoting value. Thus, it can be seen that this shellfish offers a wholesome, nutritious source of food.
ro e~n n er rou) or an .,I1;J ee _ eri o Table 5 - Average Gain in Live Weight of 'Rhi te Rats and
Pt· I take P G f Ei ht-W k'P iY Source Number Av. Gain Coefficient Average
of of in live of Protein Standard Protein Rats weight Variation Intake Error
Grams Pe.rcent Grams Grams Ocean ~ogs ••••••• 10 117.3 12.5 55.b 0. 12 Beef ••••.•• •• ••••.•• 4 111).3 9.Q 55.3 0. 19 yData from report by Dorothy B. Darling, formerly Pharmacologist with the Fishery
nol ogical Laboratory, Division of Commercial Fisheries, College Park, Maryland. Tech-
There is no reason why the ocean qu~og should not be one of the f ine st shellfish obtainable.' Its habitat is clean, deep ocean water and with proper handl ing it can be made an important addition to the group of edible shellfish. I n the section of this report which follows, detailed information is giYen to indicate the current pitfalls in the methods of handling which detract from its wholesomeness. By eliminating these basic difficulties in the industry, the ocean quahog can be made one of the safest and most wholesome forms of seafood.
J'une 1947 COMMERCIAL IiI SlIEHlli.:> REVIU
PART 11
The major difficulty in the ocean quahog industry, as now practiced, is th production of a commodity which can meet the bacteriological standards est bil ed for shellfish by the U. S. Public Health Service (1946) . The resence of coli 0
baoteria in commercial packs of ocean quahogs had been reported by t e Rho e Island State Health De~rtment and excessively high bacteri al counts had been obtuin d . When consideration was given to the environment of the shellfish, it se e unreasonable to believe that any coliform bacteria found in the wuters or mud r which the ocean quahogs were being taken could have any sanitary significanc . It was equally doubtful if any such organismti present in the animal a the time of removal from the sea could be construed a8 evidence of dOffiestic sewage ollution. For these reasons, a bacteriological investigation was initi ted to determine the sou~ces and types of coliform bacteria and to locate the place in handling and processing where large numbers of bacteria were introduced.
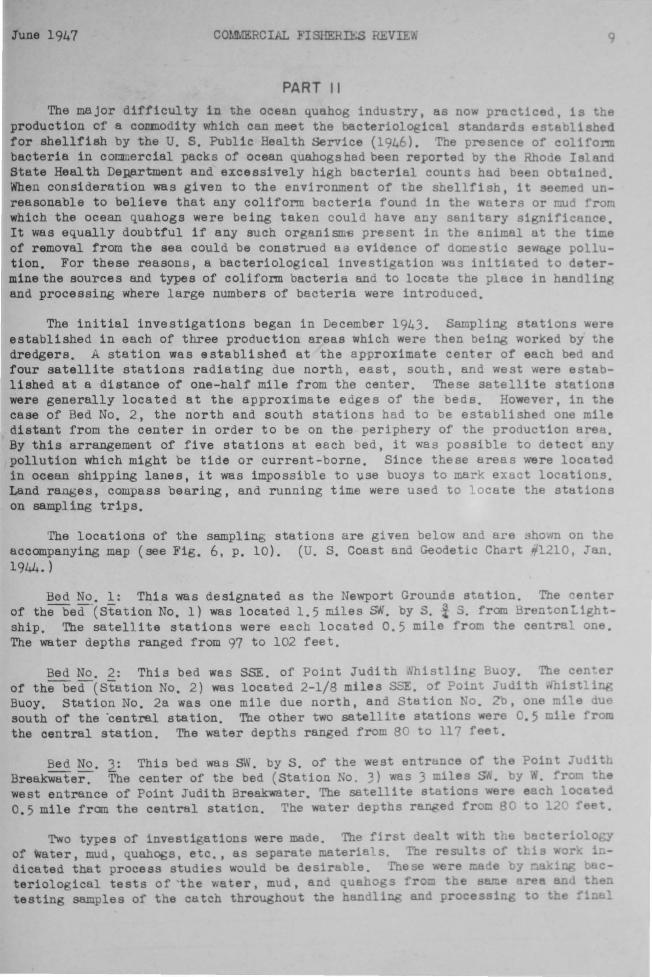
The initial investigations began in December 1943. Sampling stations ~ere established in each of three production areas which were then being worked by the dredgers. A station was established at the approximate center of each bed and four satellite stations radiating due north, east, south, and west were established at a distance of one-half mile from the center. These satellite sta ions were generally located at the approximate edges of the beds. However, in the case of Bed No.2, the north and south stations had to be established one mile distant from the center in order to be on the periphery of the production area. By this arrangement of five stations at each bed, it was possible to detect any pollution which might be tide or current-borne. Since these areas were located in ocean shipping lanes, it was impossible to ~se buoys to mark exact locations. Land ranges, compass bearing, and running time were used to locate the stHtions on sampling trips.
The locations of the sampling stations are given below and are sho.-Tn on t accompanying map (see Fig. 6, P. 10). (U. S. Coast and Geodetic Chart #1210, . an, 1944. )
Bod No.1: This was designated as the Newport Grounds station, The center of the be~(Station No.1) was located 1.5 miles SN, by S, i S, from BrentonL1gh -ship, The satellite stations were each located 0.5 mile from the centre one , The water depths ranged from 97 to 102 feet,
Bed No, 2: This bed was SSE. of Point Judi th :.histlin Buoy, The c n er of the be~(Station No, 2) was located 2-1/8 miles SS~, of Point ~udith, istll ) Buoy. Station No. 2a was one mile due north, and St~tion 0 , 2b, one m1 e u south of the ·centrel station. The other two sa.tellite stations were 0 ,5 mil rom the oentral station, The water depths ranged from 80 to 117 feet,
Bed No.3: This bed was S\. by S. of the west entrHnce of the Breakwater. The center of tbe bed (Station TO. 3) 'as 3 miles S" by . , fro west entrance of Point Judi th Breakwater, Tbe satellite stations ere each loc 0.5 mile from the central stat ion, The water depths range fro~ 80 0 12 fe
Two types of investigations were made. of ~ater, mud, quahogs, etc" as separate materia s. dicated that process studies would be desirable, teriolo ieal tests of ' the ,ater, mud, ana quahogs testing samples of the c~tch throughout the handling an

June 1947 cm/MERCIAL FISHERIES REVIEW II
consumer product. In all of the work, pertinent, supplementary field data were obtained, such as air and water temperatures, state of tides, etc.
Surface and bottom water samples were collected with a suitable sampling device. Mud samples were obtained from the dredges. Except in the case of the process samples, where separate lots of quahogs were earmarked, quahogs were taken at random from the catch as it was dumped on the deck of the vessel.
Throughout the study, methods given in Standard Methods for the Bacteriological Examination of Shellfish (1944) were employed. Presumptive tests for coLiform bacteria were made with lactose broth and these were confirmed with brilliant green lactose bile broth and eosin-methylene blue agar. The plate counts were made with tryptone-glucose agar. Isolates were made from the eosin-methylene blue agar and sent . to the Fish and Wildlife Service Laboratoryat College Park, Md., for taxonomic studies.
If the presence of coliform bacteria in ocean quahogs represents pollution at the source of the shellfish catch, then the waters of the area should also contain these micro-organisms. This should be particularly true in the case of the bottom water in which the quahog feeds. High total bacterial counts in the ocean quahog might also have their origin in the surrounding waters. One might also expect that the bacterial content of the waters might alter appreciably with the
70
~. 0
G 60 ~ ;, c; ~
., 50 ~ G l-~
!! 40 0
~
o Bacterial Plate Count per ml.
• M.P.N. of Coliforms per 100mi.
0
0
• 0
0
0
0260
o
Tern erature
0
0
0269
o 0
o o
0
0
0
0
0
• 0 0
0 0
80 e o Q
70 Gi Q.
III
E .... 60~
o u '0
50 Z a.: ~
40 ~ E .... Q) Q.
30 'E ;, o u
20 ~ o
Cl: o ;:
10 Q)
'0 o lD
• 0 • 8 30L------L--~--~--~~--~--~----~~----~~~~~==~~O FEBRUARY MARCH APRIL MAY JUNE JULY AUGUST SEPTEMBER
MONTHS
-FIGURE 7 - DISTRIBUTION OF STANDARD PLATE COUNTS AND MOST PROBABL~ i U~BER OF COLIFORM BACTER IA
OF BOTTOM WATER SAMPLES

12 COMMERCIAL FISHERIES REVIEW Vol. 9, NO.6
temperature of the water, higher counts and coliform scores being obtained during the warmer weather. It was necessary, therefore, to make quantitative bacteriological studies of the waters at each station in order to determine the role of the natural environment in regard to the findings with the ocean quahog per se.
In all, 53 samples of bottom water from all three stations were examined during the period of sampling (February through September). The water temperature varied from 35.90 to 63 0 F. The distribution of the standard plate counts and the coliform scores in relation to the water temperature are shown in Fig. 7, (see P. 11). The average bacterial count per ml. for each respective month was as follows:
February - 2 April - 6.72 Mq - 10 June - 6.29 August - 55.6 September - 28.4
The average bacterial count per ml. for each station was:
No.1 - 7.0 No. 2 - 28.0 No. 3 - SO.O
The average Most Probable Number of coliform bacteria per 100 ml. for each month was:
February - 4.7 April - 0 }By - 0
70
u... 0
Q) 60 .... :::J .-0 .... Q)
Q. 50 E Q)
~
~ 40 10
~
o Bacterial Plate Count per m I.
• M.P.N. of Coliforms per 100 ml.
o
0
0
0 0
8
0
0
0
o
0
0
8
June - 7.0 August - 0
0203
o
0 0
,0
36600237
0136
o
o
o
o
o 0 0
0 0 0 0
~~o
September - 0
0335
1460 0200 023
E 0 086 80 g 115
~
op Q.
70 I/)
E 0 ~
0 --608 -0 0 0
Z 50 a;
:E ~
0
" 40
E
" .... • op
0 30~ c: :::J 0
0 •• 0
20! 0 0 ~
Cl.
0 0 10 . ~ ..
0 u 8 0
0 m '30
fEBRUARY 8
SEPTEMBER 0
FIGURE 8 - DISTRIBUTION OF STANDARD PLATE COUNTS AND MOST PROBABLE NUMBER OF COLIFORM BACTERIA OF SURFACE WATER SAMPLES

June 1947 COMMERCIAL FISHERIES flliVIEW 13
The percent of samples positive for coliform bacteria for each station was:
No. 1 - 38 No. 2 - 5 lio. 3 - 6
In the case of Station No.1, the coliforms were found throughout the sa.mpling period; at the other two stations they occurred only during July.
The bacterial counts on 53 samples of surface waters showed wider variations than those of bottom waters (Fig. 8, see P. 12). The average bacterial plate count per ml. for each respective month was as follows:
February - 28 April - Z7 June - 61 August - LV Se-p tember - 78
In general, these averages are consistently higher than those for bottom water samples. The average bacterial count per ml. for each station was:
No.1 - 45.8 No. 2 - 64.8 No. 3 - 28.3
In the case of the first two stations, these average counts are considerably higher than in the case of bottom water counts from the sa.me areas.
The average Most Probable Number of coliform bacteria per 100 ml. by month was:
February - 0 April - 2.1 ~- 0 June - 2.5 .August - 0.2 September - 0.3
This distribution does not parallel the findings with bottom water. The percent of samples from each station which were positive for coliform bacteria was:
No. 1 - 39 No. 2 - 17 Woo 3 - 12.5
Most of the positive tests at Station No.1 occurred during April; the other two stations showed this group of organisms sporadically during June, August, and September.
The difference in results between bottom and surface waters can probably be accounted for by the location of the production areas. All three were situated in main shipping lanes and in addition to the normal ship traffic, these areas were being traversed continually by mine sweepers. The discharge of refuse and sewage from boats and the continual churning of the water probably maintained a relatively high bacterial flora which was diminished by dispersal and dilution before it reached the depths at which the quahogs were taken. Possibly, the high values obtained which made for the wide fluctuations shown in the result were due to samples taken in zones where refuse recently had been dumped overboard.
Mud was tested only for the presence of coliform bacteria, no quantitative bacteriological determinations being made. Fourteen samples were examined over the period of field operations. Of these, only one gave evidence of coliform bacteria being present and in this instance, the presumptive test could not be confirmed. This particular sample was obtained from ~tation No.3.
Thirty-two samples of ocean quahogs were collected during the course of the field stUdies. The average bacterial plate count of the meats was 322 per ml. This is about 12 times as high as the average for the bottom water which was 28 per ml. The plate count average by months was as foll,ows:
February - 165 April - 35 May - 1,214 June - 45 August - 506 Sap tember - 371
14 CO 1l'.rEKCIAL 1< Ib.HI~. IE REVIE.": Vol. 9. Io. 6
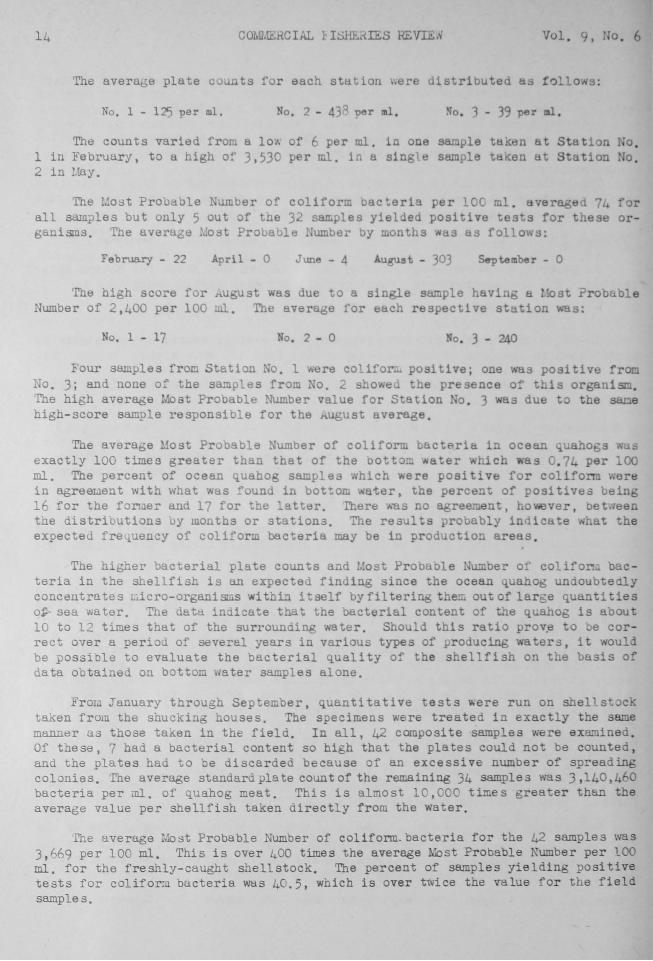
The average plate counts for each station •. ere distributee. tI. falloNs:
No. 1 - 125 'Per ml. No. 2 - 43 per mI. . o. 3 - 39 er ml.
The counts varied from a 10',\ of . per ml , 1n one saraple ttl. en at Ste tion 100 . 1 in February. to a high of ),5)0 per ml. in a single sample ttl.ken ut Station 10. 2 in !.lay.
The Uost PrObable umber of coliform Dac teria per 100 ml . tlve age 7 for all samples but ouly 5 out of the 32 san.ples yielded positive tes s for t ese organisms. The average • .1ost Probable umber by months II s as follo VS:
February - 22 April - 0 June - 4 August - 303 Se-p tember - 0
The high score for AUgust was due to a single sam le havi b a l:ost Prob b e Number of 2,400 per 100 ml. The average for euch respective station ;as:
No. 1 - 17 No. 2 - 0 o . 3 - 240
Four samples froI!! Station No.1 ere colifor.", positive; one ~es positivt'l fro!:! No .3; and none of the samples from .'0. 2 sho",e the presence 0: t is orbanism. The high average Most PrObable lumber value for Station o. 3 ·H8.S due 0 the S8!:le high-score sample responsib le for the J-I. list average .
The average Most Probable Number of coliform bacteria in ocean ahobs N ;:,
exactly 1 0 times greater than that of the DOtto~ Hater", ich we 0 . 7 per 100 ml. The percent of ocean uehog samples ~vhi h Viere positive for coli!orm :ere in agreeuent with what was found in bot<;om water. the percent of positives beinb 16 for the fOrIiler and 17 for the latter, There "'"'8.S no agreement. ho ver, oet./een the distributions by months or stations, The results rotably iniicate " at the expected fre~uency of coliform bacteria may be in prod ction areas.
The higher bacterial plate counts and l.10st Probl:ible u.:nbe::.- 0:' coli1'o::,:,u bac teria in the shellfish is an expected finding ince the ocean ahog ndoubtealy concentrates cicro-organiSUlS within itself by fil terin the:... out of large Quanti ties o~~ sea water. The data in'i:ate that the bacterial content of the q ahob is about 10 to 12 times that of the surrounding water, Sho Id this ratio prov.e to e correct over a period of several years in variou types of producing wa ters, it would be possible to evaluate the bacterial quality of the shellfish n t e basis o~ data obtained on bottom mter samples alone.
Frou January through September, quantitative tests ~ere run on shel st~ck taken from the shucking houses, The specimens were treated in exactly the same manner as those taken in the field. In all, 42 campositesamples were examined. Of these, 7 had a bacterial content so high that the plates could not be counted, and the plates had to be discarded because of an excessive number of spreadWg colonies. The average standard plate count of the remaining 34 samples was 3,140,460 bacteria per ml. of quahog meat. This is almost 10,000 times greater than the average value per shellfish taken directly from the water,
The average Most Probable Number of coliform. bacteria for the 42 samples \ffiS
3,669 per 100 ml. This is over 400 times the average Most PrObable Number per 100 ml, for the freshly-caught sbellstock. The percent of samples yielding positive tests for coliform bacteria was 40.5, wbicb is over ~vice the value for the field samples,
June 1947 C01J:lIERClAL FISHERIES REVIEN 15
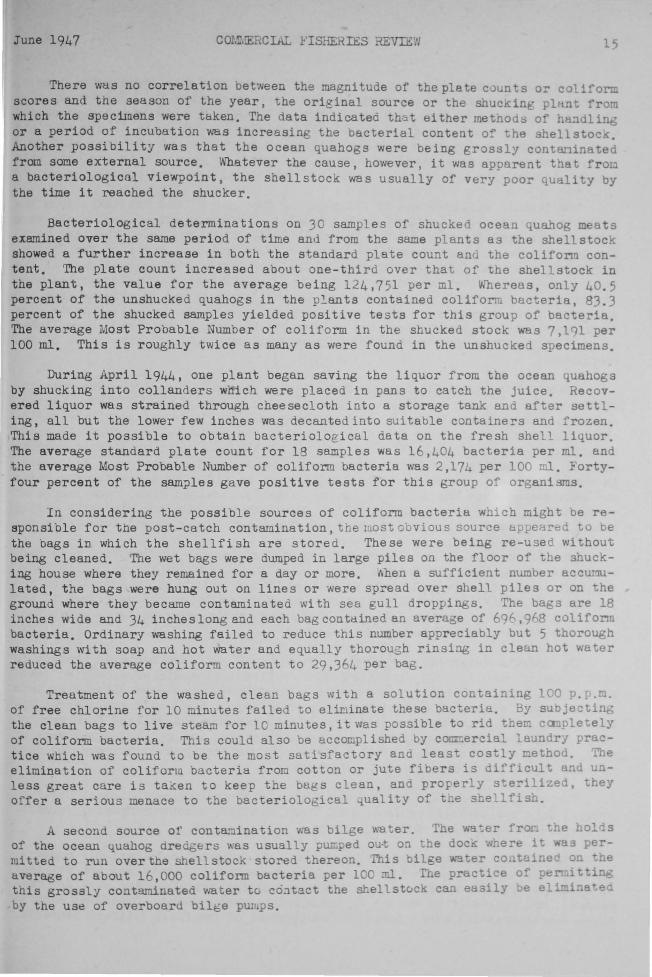
There was no correlation be tween the magnitude of the plate c.)unts 0:- cOliform scores and the season of t he year , the original source or the shucking plKnt from which the specimens were taken . The data i ndicat ed that either methods of ha~dling or a period of incubati on wa s i ncreasing the bacterial content o~ the shellstoch Another possibi l ity was that t he o ce an quahogs were being grossly contaninated from some external source . Whatever the cause, however, it was apparent that frou a bacteriological viewpoint , t he s he ll stock was usually of very poor quality by the time it reached the shucke r .
Bacteriological determinat ion s on 30 samples of shucked ocean quahog meats examined over the same period of t ime and from the same plants as the shell stock showed a further increase in both t he standard plate count and the coliform content. The plate count increased ab ou t one- third over that of the shellstock in the plant, the value for the average being 124,751 per mi. Whereas, only 40.5 percent of the unshucke d quahogs in the p~ants contained coliform bacteria, 83.3 percent of the shucked samples yielded posi tive tests for this group of bacteria. The average Most Probable Number of coliform in the shucked stock was 7,191 per 100 ml. This is roughly twice a s many as were found in the unshucked specimens.
During April 1944, one plant began saving the liquor from the ocean quahogs by shucking into collanders whi ch were placed in pans to catch the juice. Recovered liquor was strained through cheese cloth into a storage tank and after settling, all but the lower few inche s was decanted into suitable containers and frozen. This made it possible to obtai n ba cte r iological data on the fresh shell liquor. The average standard plate count f or 18 samples was 16,404 bacteria per ml. and the average Most Probable Number of coliform bacteria was 2,174 per 100 • Fortyfour percent of the samples gave positive t e sts for this group of organisms.
In considering the possibl e sour ce s of coliform bacteria which might be responsible for t he post-ca tch contami nation, the lflOst obvious source appeal'ed to be the bags in which the shel l fi sh a re stored. These were being re-use d without being cleaned . The wet bags were dumped in large piles on the floor of the shucking house where they remained f or a day or more. 'l'Iben a sufficient number aCCUI!IUlated, the bags were hung out on lines or were spread over shell piles or on the ground where they became contamina t ed with sea gull droppings. The bags are 18 inches wide and 34 inches l ong and each bag contained an average of 69 h ,968 coliform bacteria. Ordinary washing f ai l ed to reduce this number appreciably but 5 thorough washings with soap and hot water and equally thorough rinsing in clean hot water reduced the average co i i f orm content to 29,364 per bag.
Treatment of t he wa she d , cl ean bags with a solution containing 100 p.p.m. of free chlorine f or 10 minutes fa i led to eliminate these bacteria. By subjecting the clean bag s t o live steam for 10 minutes, it was possible to rid them completely of coliform bacteria. This could also be accomplished by co~ercial laundry practice which wa s found to be the most satisfactory and least costly ~ethod. The elimination of colifo r ta bacteria from cotton or jute fibers is difficult and unless great care i s taken to keep the bags clean, and properly s:e:-ilized, they of fer a ser i ous menace to the bacteriological quality of the shellfish.
A se cond s our ce of con taroi na tion was bilge water. The wa "":.er f'ro he hol.ds of the ocean quahog dredgbrs was usually p~ped ou~ o~ the doc~ where it was permitted to run over the shellstocK stored thereon. This oilge ~~ter contained on the average of a bout 16 , 000 coliform bacteria per iCe ml. The practice of pe ~itting t h is grossly contaminated wate r to co~tact the ~,ellst0ck C~~ easily be el _ina~ed by t he use of over board bile;e pumps.

16 COMMERCIAL FISHERIES REVIEW Vol. 9, No.6
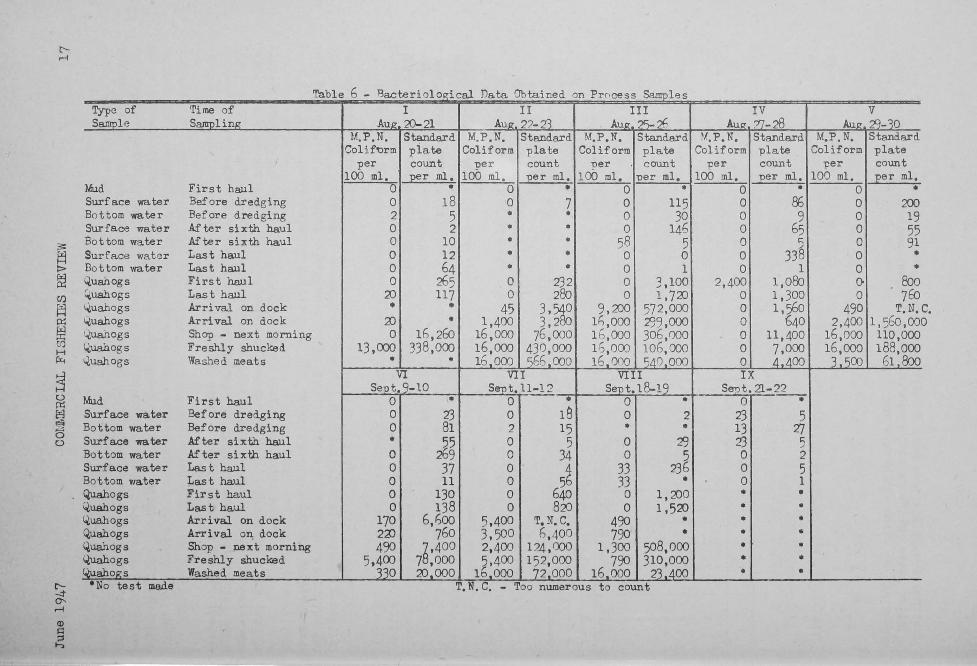
During and immadiately following a spell of extremely hot weather in August, a series of "process" samples were examined bacteriologically. The temperature of the bottom water at this time varied from 510 to 630 F. This period represented a time when one would expect maximum coliform scores and plate counts in field samples. Since the samples were homologous; i.e., taken at the same time from the same source in each sampling series, it was also possible to evaluate bacteriologically, the influence of handling, transportation, and processing.
The technic employed was as follows. A specimen of mud was t&ken from the dredge at the time of the first haul. Samples of surface and bottom waters were taken before dredging began, after the sixth di'edge haul, and after the last haul.~ Samples of ocean quahogs were taken from the first and last hauls of the dredge, upon arrival at the dock, upon arrival at the shop, after overnight storage at the shop, immediately after shucking, and at the time of packing. Field samples were adequately refrigerated until examined in the laboratory. Specimens from the shop were taken directly to the laboratory and the bacteriological tests were begun immediately. Every effort was made to get the laboratory tests accomplished as soon as possible in order to obtain data which would be representative of the specimens.
The bacteriological findings are sumnarizedinTable6 (see P. 17). The data indicate that even under conditions of ~xpected high bacterial counts, themud, water, andocean quahogs initiallyare of good sanitary quality. It is not until the shellstock has been out of water for some time that the bacterial count of the ocean quahog increases. From the time of arrival at the dock until the final product is ready for packing, the bacteri~l content, including the coliforms, increases. In same instances, there was a slight decrease in plate counts after the meats had been washed, but the coliform content usually remained high. One sample of ocean quahogs failed to give any indication of coliform bacteria throughout the entire transportation-processing period, although the plate counts showed some increase.
From these data, it is evident that the bacteriological difficulties originate at the time the ocean quahogs are first stored on the deck of the vessel in bags. From this point on, the problem is aggravated by the methods of transportation and processing. MOdifications in the present handling technics are necessary if the excellent quality of the shell stock as it cames fram the water is to be maintained until the final product reaches the consumer.
In order to determine the predominant types of coliform bacteria present in each phase of sampling, 223 isolates from confirmatory media were studied taxonomically. Detailed taxonomy was not done but the cultures were classified into 5 types with the idea of designating the probability of their ultimate source, the assumption being made that typical Escherichia members and related form were of fecal origin and that the typical Aerobacter members and related types were of soil, plant, or water origin. Such designations are purely arbitrary and may have no real significance in this particular case.
The coliform group and each of its 5 types were defined as follows: Coliform Group: This includedonlyasporogenuous, Gram negative, aerobic rods which fermented lactose aerogenically within 48 hours.
Type I: All organisms of this type were characteristic Escherichia members. ~cetylmethylcarbinol was not produced from dextrose. Citrate was not utilized as a sale source of carbon and cellobiose and alphamethylglucoside were not ferr:::ented. Hydrogen sulfide was not formed. Indole was produced. Organisms showing tnese characteristics were considered tobe typical of the fecal coliform bacteria.
t'-M
~
~ ~ CI)
~ p::
~ H !Xi
~ ~ ~ <5 o
t'---.:t 0"M
Q) s:: .;
Type of Sample
Mud Surf ace water Bottom water Surface water Bottom water Surface water Bottom water Quahogs ~uahogs tiuahogs Quahogs I./.ua,hogs tiuahogs tiuahogs
Mud Surf ace water Bottom water Surf ace water Bottom water Surface water Bo t tom VIa ter Quahogs Quahogs tiuahogs ~ogs Q.uahogs ~ogs (,luahop;s
-No test made
Time of Samplinp;
First haul Before dredging Before dredging After sixth haul After sixth haul Last haul Last haul First haul Last haul Arri val on dock Arri val on dock Shop - next morning Freshly shucked Washed meats
First haul Before dredging Before dredging After sixth haul After sixth haul Last haul Last haul First haul Last haul Arrival on dock Arrival o~ dock Shop - next morning Fre shly shucked Washed meats
- - - -- - - ~ - - - - -- - --- - --- ---- --- - - ---- --- ---
1 11 111 AU2,20-2l Aug. 27-21 Aug. 25-26
M.P.N. Standard M.PoN. Standard MoP.N. Standard Colif~rm piate Coliform plate Coliform plate
per count -pe r count -per count 100 ml. ~r ml. 100 ml. Eer ml. 100 mI. -per mI.
0 - 0 - 0 • 0 IS 0 7 0 ll5 2 5 - • 0 30 0 2 - • 0 146 0 10 - • 58 5 0 12 • - 0 0 0 64 • - 0 1 0 265 0 232 0 3,100
LU 117 0 280 0 1,7LU • • 45 3,~ 9,200 572,000
LU • 1,400 3,2 Ih,ooo 299,000 0 16,2tD 16,000 76,000 16,000 306,000
13,000 338,000 16,000 430,000 16 ,000 106,000 • - 16 000 ')66 000 16 000 5AO,OOO
VI VII VI 11 Sept. 9-10 Sept. 11-12 Sept.lB-19
0 • 0 - 0 • 0 23 0 lA 0 2 0 81 2 15 • • • 55 0 5 0 29 0 269 0 34 0 5 0 37 0 5~ 33 236 0 II 0 33 • 0 130 0 640 0 1,LUO 0 138 0 820 0 1,5LU
170 6,600 5,400 T. N. c. 490 • 2LD 760 3,500 6.400 790 -490 ~.400 2,400 124.000 1,300 508,000
5.400 7 ,000 5,400 152,000 790 310,000 330 LD 000 16 000 72 000 16 000 23.400
T.N.C. - Too numerous to count
IV Aug, 11-28
MoP.N. Standard Coliform plate
per count 100 ml. Eer ml.
0 • 0 86 0 9 0 65 0 t:;
0 338 0 1
2,400 1,080 0 1,300 0 1,560 0 640 0 ll,400 0 7,000 0 4.400 IX
S61Jt.21-22 0 -
23 5 13 27 23 5 0 2 0 5 0 1 • • • • • • • • - • • • • •
V Au}L ;8-30
M.P.N. Standard Coliform plate
per count 100 ml. Eer mI.
0 -0 200 0 19 0 55 0 91 0 • 0 • 0 80c 0 7tfJ
490 T.N. 2,400 1,560,oc
16,000 110,OOC 16,000 lSB,ooc
3.')00 61 800
C. o

18 COMMERCIAL FISHERIES REVIEW Vol. 9, No .6
TYIle II: Cultures of thi s tYIle belonged in the ,group of Escherichia-Aerobacter intermediates. They had the same general characteristics of Type I but were irregular regarding either citrate utilization or the fermentation of cellobiose and alphamethylglucoside or else they produced hydrogen sulfide. All cultures of this type produced indole. They were considered as being probably of fecal origin.
TYIJe III: The cultures of this group were characteristically Aerobacter cloacae tYIles. They produced acetylmethylcarbinol from dextrose, fermented cellobiose and alphamethylglucoslde, and utilized citrate. They were non-encapsulated and produced flat, gray colonies on eosin-methylene blue agar. The possi bility that such cultures might be of fecal origin was considered.
TYIJe JV: These organisms possessed the same characteristics as Type I but were atypical in colonial appearance on eosin-methylene blue agar and failed to produce indole. These were classified as atypical Escherichia members, probably not of fecal origin.
Type V: This group was composed of typical Aerobacter members. They all produced acetylmethylcarbinol from dextrose, were active fermenters of cellobiose and alphamethylglucoside and utilized citrate as a sole source of carbon. They were hydrogen sulfide negative. The organisms were all encapsulated and produced raised, mucoid colonies on eosin-methylene blue agar. They were indole negative. Most of them were Aerobacter oxytocum except for this last characteristic. All cultures of this type were considered to be non-fecal in origin.
The distribution of the various coliform types is indicated in Table 7. Characteristic fecal Escherichia cultures (Type I) occurred the least frequently, only
Table 7 - 'lYpes of Coliform Bacteria I solated 'From Various Sources
Type of
S le
Mtld ••••••••••••••••.••••••••••••••• •••••••••••••• Bottom Water •••••••••••••••••••• •••••••.••••••••• Surf ace '/fa ter •.••••••••• t ••••.•••.•.•••.•.••••• •• Ocean Quahogs ~from water) ••••••••••••••••••••••• Ocean Quahogs at sh?p) ••••••••••••••••.•••.••••• Ocean Quahogs meats) ••••••••••••••••••••• •.•.••• Ocean Quahog Liquor •••••••••••••••.•••.•• •••••••• Bags ••••••••••••••••••••••••••.•••.•• •••••••••••• Bilge Water •.••••••••••••••••••••••••••••.•••••• •
Total Cultures •.•••••••••••••••••••••••••••• Percent of Total •.••••.•••••.•.•••••..••••
1 Coliform bacteria were classified as follows: Type I: Typical E scheri chia Type II: Escherichia - Aerobacter Intermediates
TYPE OF COLIFORM BACTERI 1 tures I sola t ed
II IV V Number - 2-
~ 3 o 6 o 1 1
12.
Number - 0-
5 5
10 15 LO 1 3 0'
'59 26.0
Number -0-
2 2 5
14 19 6
Type III: Aerobacter cloacae Type V: Typical Aer obacter
Number o 4 4 5
13 8 3 4 o
42
12.5 percent being of this type. The other four types were about equally divided, the respective percent of each being as follows:
Type II - 26 Type III - 21 Type IV - 21.5 Type V - 19
Since there was practically no opportunity for either the water or the ocean quahogs to be initially contaminated from any sewage source except the water traffic in the production areas, it may be that the only coliform bacteria of any sanitary

June 1947 COMMERCIAL FISHERIES REVIEW 19
significance were those of Type I. The largest single source of the typical Escherichia mambers was the water (surface and bottom), 15 of the 28 cultures having come from this source. The other four types were predominantly from ocean quahogs. In the case of Type II cultures, 45 out of 59 were from ocean quahogs, with 30 of the 45 coming from the stored shell stock and shucked meats. Of the Type II cultures, 27 out of 46 were from the shell stock but the largest single source (13 cultures) was the stored shellstock. The same general picture also characterizes the other two types, 38 out of 48 Type IV cultures coming from the ocean quahogs and 26 out of 42 Type V cultures having the same origin. The outstanding single source of Type IV cultures was shucked meats and of Type V, the stored shellstock. The low incidence of Type I organisms in the ocean quahog would seem to indicate that most of the coliform bacteria found may not have been of fecal origin at all but represented strains of bacteria which are indigenous to the shellfish and which had had an opportunity to multiply. While admitting the undesirability of coliform bacteria in the final product, there is a reasonable doubt regarding the sanitary significance of their presence in the materials examined in this investigation. True fecal pollution during storage and shucking would probably yield a much higher percentage of typical Escherichia coli.
Recommended Practices The bacteriological data presented in this study leaves little doubt con
cerning the necessity of modifying current trade practices if the initial high quality of the Ocean quahog is to be maintained until the final product reaches the consumer. It should be ne ~ther too costly nor too troublesome to produce a seafood of excellence from this Shellfish. With the aim of accomplishing this, the follov/ing practices are reconnnended:
l.~: The bags used for storing the shellstock should not be re-used without having been laundered. '!hey shoul,i be stored in such a manner as to ~revent exp osure to external contamination.
2. Aboard the Vessel: The bagged catch should be -protected from direct exposure t o the sun and heat. Preferably, the shell stock should be thoroughly iced as soon as possible after removal from the water.
The ocean quahogs should be stored in a manner which will protect them from exposure to bilge water or other sources of contamination.
Upon return to -port, the ocean quahogs should be re-iced, if necessary, or transferred t o a refrigerator. If further hauline is necessary, they should be transferred immediately to a pre-cooled truck or other vehicle. Shellstock should no t be permitted to stand un~rotected fov any length of time on the dock or on the de ck of the vessel.
3. Transportation: The trucks used f or transporting shellstock should be designed to prevent contamination of the ocean quahogs from dust and dirt. The trUOAS should be pre-cooled before loading and the load should be thoroughly iced. Upon arrival at the plant the load should be re-iced, if necessary, if it is not removed immediately.
4. Storage: Throughout the period of storage, the ocean quahog s should be kept at a temperR.ture n o t higher than 40 0 F. It i.s recommended that the shellstock be heIr!. no longer thR.n 24 hours before shucking a!ld that 48 hours should be the maxi~ period of storage for the s~ellstock.
5. Shuc~ng Room: Shucking room c1eanliness is essential f or the production of high quality food. At the end of each day, the benches should be cleared of all materials and utensils and thoroughly cleaned. The floors should

20 COMMERCIAL FISHERIES REVIEW Vol. 9, No.6
be swept and scrubbed daily. Platforms upon ~ich the shucy..ers staPd should never be placed on the shucking benches. '!hey should b~ stood on end on th., floor, thoroughly washed and left in this position until used again.
Shellstock should not be washed free of mutt on the benches while shucking is in progress. It would be desirable to have a 9suarate bench f0r this purpose and to have only clean quahogs on the ebucking benches .
6. Utensils: All shucking knives, buckets, and other utensils should be thoroughly cleaned at the end of each da,y's operations and should be sterilized in accordance .,.n th the recommendati.ons of the State hp-al th author! ties. 0n.ly utensils which are in good repair and which are free of rust or other corrosion should be employed.
7. Packin& Rooms: '!he pa~king rOOm should be immaculately clean I\t IUl times. '!he equipment should be sterilized by the use of sui table antiseptic agents. The receptacles into which the ocean quahogs are packed must be kept free of dirt and stored in a manner ...bich will keep contamination at a minilll\lJll. In the case of metal containers, a rinse wi th chlorine solution orior to packing will effectively eliminate contrunination from dust and handling. '!he lids should be similarly treated. Under no circUlllstances should the tlack8r's h8Ild. come in direct contact with the inside of the containers .
8. Storage of Packaged Meatsl .As soon as the ocean quahogs are packaged they should be refrigerated. '!he lag between the packaging and refri~eration should not exceed 30 minutes at any time. When friction- top metal cans are used, care should be taken to prevent over-filling so that the lids will not be forced off during refrigerati on. A:n:y lids which do come off d ring storage should be replaced wi th new, clean 0nes and the originals returned to the packing ro om f or cleaning and sterilization before they are re-used.
9. Shipmentl Ocean quahogs must be kept at a temperature not exoeedil18 40 0 F. at all times until used. Shipments must be kept properly refrigerated through-out the period of transi t. 'Ihi s applies to shell stock as ~ll as shucked meats.
10. Personnel: All workers should remove their sprons, rubber gloves, etc., before entering the toilet and should wash their hands thoroughly wi th soap and, _ter before resuming work,
Shuckers should not enter the packing room at any time.
Lunches, overcoats , and other personal property should be stored -elsewhere than in the shucking or packing room. If winter outer-clothing is necessary for persons working in the freezers , this should be special clothing and used only for this purpose and it should be kept clean a:nd. in gocxl. re-pair.
The above suggestions are supplementary to any re~uirements of the U. S. Public Health SerVice, the U. S. Food and Drug Administration, the State regulatory authority, or local food agency. These recommendations are based upon observations of the ocean ~uahog operations and indicate methods of eliminating some of the chief obstacles in the way of maintaining high ~uality production. The ocean ~uahog offers a food source of very high quality; it is ridiculous tosacriflce the ~uality through failure to follow these relatively simple and inexpensive practices.
Acknowledgments _
The authors wish to express their appreciation f~r the excellent cooperation they received from the Rhode Island,Division of Fish and Game, the Rhode Island State Health Department and the Narragansett Bay Packing Co. Without the assistance of these organizations and the ~uahog fishermen ~d processors, this report would not have been possible.
June 1947 COMMERCIAL FISHERIES REVn;W 21
The authors also acknowledge with gratitude the technical services of Dr. Robert Rucker and Mr. iVal ter Rust, both of whom were connected with the Fisherie 8
Technological Laboratory at College Park, Maryland, at the time that this work was in progress. The authors are also indebted to Dr. Victor Loosanoff and Mr. William Neville, both of the Fish and Wildlife Service, to the biologists of the Rhode Island State College, and many others whose jOint contributions have added considerably to the success of this study.
The illustrations appearing in this report are taken for the most part from the previous joint publication (1945) of the Fish and Wildlife Service and the Rhode Island Division of Fish and Game. Mr. George Glen, formerly of the Fish and Wildlife Service, Division of Fishery Biology, made the drawings of the shell in Figure 1 i Mr. Walter Rust prepared the drawing of the dredge i and the maps were drawn by Mr. Charles Lee. Mr. Rust was formerly on tbe staff of the Fisheries Technological Laboratory at College Park, MarylandiMr. Lee is still a staff member of the Laboratory.
LITERATURE CITED
ADAMS, HENRY and ADAMS, .ARmUR
1858. '!he genera of recent mollusca. Vol. 2, 443 pp., 3 vols. John Van Voorst. London.
AME:RICAN PUBLIC HEJ.L'm ASSOCIATION
1944. Standard methods for the bacteriological examination of shellfish.
PRATT, HENRY S.
1935. A ma.nual of the common invertebrate anilllBl:s exclusive of i nsects. 665 pp. p. Blakiston's Son & Co., Inc. Philadelphia.
RHODE ISLAND DEPARNENT OF AGRICULTURE AND (l)NSERVATION, DIVISION OF FISH AND GAME
1945. '!he ocean quahog fishery of Rhode Island.
TRYON, GEOIGE W •• JR.
1873. American marine conchology. 162 pp. Publhhed by the BUthor. Philadelphia.
U. S. PUBLIC HEALm SERVICE
1946. Manual of recommended practice for sanitary control of the shellfish industry. Public Heal th Bulletin No. 295.