a techno-economic framework for broadband …pages.cs.wisc.edu/~pb/gaia16_final.pdfa techno-economic...
TRANSCRIPT
A Techno-Economic Framework for BroadbandDeployment in Underserved Areas
Ramakrishnan DurairajanUniversity of Wisconsin-Madison
Paul BarfordUniversity of Wisconsin-Madison & comScore, Inc.
ABSTRACTA large body of economic research has shown the strongcorrelation between broadband connectivity and economicproductivity (e.g., [1–3]). These findings motivate govern-ment agencies such as the FCC in the US to provide incen-tives to services providers to deploy broadband infrastruc-ture in unserved or underserved areas. In this paper, wedescribe a framework for identifying target areas for net-work infrastructure deployment. Our approach considers (i)infrastructure availability, (ii) user demographics, and (iii)deployment costs. We use multi-objective optimization toidentify geographic areas that have the highest concentrationsof un/underserved users and that can be upgraded at the low-est cost. To demonstrate the efficacy of our framework, weconsider physical infrastructure and demographic data fromthe US and two different deployment cost models. Our resultsidentify a list of counties that would be attractive targets forbroadband deployment from both cost and impact perspec-tives. We conclude with discussion on the implications andbroader applications of our framework.
CCS Concepts•Networks→ Network management;
Keywords: Broadband deployment targets; Multi-criteriaoptimization; Underserved areas
1. INTRODUCTIONThe importance of broadband connectivity in the US is high-lighted by the following quote from the FCC’s NationalBroadband Plan, “Like electricity a century ago, broadbandis a foundation for economic growth, job creation, globalcompetitiveness and a better way of life" [4]. Despite thecompelling case for broadband access and significant effortsby the FCC over the past six years, 6% of the Americans still
Permission to make digital or hard copies of all or part of this work for personalor classroom use is granted without fee provided that copies are not made ordistributed for profit or commercial advantage and that copies bear this noticeand the full citation on the first page. Copyrights for components of this workowned by others than ACM must be honored. Abstracting with credit is per-mitted. To copy otherwise, or republish, to post on servers or to redistribute tolists, requires prior specific permission and/or a fee. Request permissions [email protected].
GAIA, August 22–26, 2016, Florianopolis, Brazil© 2016 ACM. ISBN 978-1-4503-4423-4/16/08. . . $15.00
DOI: http://dx.doi.org/10.1145/2940157.2940159
lack access to broadband service (threshold defined to be 25Mbps download/3 Mbps upload for fixed services) and thepercentages are much higher in rural and tribal areas [5].
Expansion of broadband access in the US, as it is in otherstates, is a complex matter. First, the FCC does not build,own or operate Internet infrastructure. Instead it works withmunicipalities, private service providers and other sponsorsby providing guidance and economic incentives to deploybroadband infrastructure in un/underserved areas (e.g., via theConnect America Fund [6]). Second, there are legal and pol-icy concerns such as laws that limit or prohibit non-telecomcompanies from deploying communication infrastructure [7].Third, defining and identifying underserved areas that are thebest targets for new or upgraded infrastructure deploymentrequires consideration of a variety of geographic, economicand demographic factors—the main focus of this work.
In this paper, we describe a techno-economic frameworkand system for identifying targets for future broadband expan-sion. The objective of our work is to provide flexible decisionsupport on opportunities for broadband deployment that en-ables economic and technical issues to be considered simulta-neously. Specifically, our framework considers (i) infrastruc-ture proximity, (ii) demographics, and (iii) deployment costs.We employ geographically-based, multi-objective optimiza-tion to identify the highest concentrations of un/underservedusers and that can be upgraded to the broadband threshold atthe lowest cost. Our work takes advantage of new maps oflong-haul infrastructure in the US [8, 9] that are critical foraccurate cost modeling.
We demonstrate the efficacy of our approach by consid-ering US demographic data and two different deploymentmodels: upgrading existing infrastructure and deploying newinfrastructure. Our results highlight the tradeoffs of the differ-ent deployment models and identify a list of US counties thatwould be attractive targets for broadband deployment fromboth cost and impact perspectives and that correspond closelywith areas identified by Connect America map [10]. Whileour analysis focuses on the US, our method is generic andcan be applied in other regions where similar data is available.
2. CONNECTIVITY ANALYSISIn this section, we assess connectivity and need in US coun-ties (and county equivalents) using provider data [11] frombroadbandmap.gov, census data [12] from census.gov and

infrastructure data from Internet Atlas [8, 9]. Our analysisconsiders the presence of Internet Service Providers (ISP)and the characteristics of user populations in counties. Wespatially integrate the infrastructure datasets from InternetAtlas and census.gov to highlight the presence of “digitallydivided" regions across US.2.1 Service Provider PrevalenceSimilar to [4], our analysis of connectivity begins by count-ing the number of providers with presence in US counties.First, we extract population information and FIPS codes of3,142 US counties using census data. Next, we look upFIPS code in provider data and count the unique number ofservice providers present in each county in the form of abroadband/fiber provider or a reseller.
0 2 4 6 8 10 12 14 16Number of providers
0.0
0.2
0.4
0.6
0.8
1.0
1.2
CDF
Figure 1. CDF of number of providers with presence in 3,142 US coun-ties (and county equivalents).
Figure 1 shows the distribution of service providers in UScounties. For 50% of the counties, the number of serviceproviders present is less than or equal to 3. Surprisingly, 170counties do not have any provider presence. These countiesare spread across 30 states leaving 38,464,508 users—or12% of the US population1—disconnected from the Internet,which is consistent with observation from others [14]. Finallywe observe that less than 1% of the counties (across 17 states)have provider presence greater than 10. Manual comparisonwith physical infrastructure repository and fiber assets [8, 9]showed that the increased presence of providers in theselocations corresponds with the presence of either (1) a co-location facility, an Internet Exchange Point (IXP) and/ora submarine cable landing station, or (2) high availabilityof fiber resources to meet large user demand (e.g., a majormetropolitan area).2.2 Infrastructure vs. PopulationWe compare the availability of infrastructure versus popu-lation to assess the prevalence of underserved communities.Similar to [4], we use the unique number of service providerswith a presence in a county as a proxy for the infrastructureavailability. Our intuition for this analysis is that the trendin population should be proportional to number of uniqueproviders to completely connect all communities in a region.
Figure 2 depicts the normalized population versus the nor-malized infrastructure availability in US counties. The ex-pected and the actual deployments are also shown. The plothighlights the fact that there are a sizable number of popula-tion centers in the US that have infrastructure provided by asmall number of ISPs.1Based on projected US population of 320,090,857 on Jan. 01, 2015 [13].
A natural question is can a region with only one serviceprovider effectively serve and provide broadband access toevery community in that region? Even though such a sce-nario is possible, we argue that the geographical diversity ofinfrastructure deployments will suffer as a consequence ofone-provider-services-all model since business imperativesmay lead to delays in broadband deployments to all commu-nities. It may also lead to choke points and single points offailure in the Internet [9] that may otherwise be obviated inmore competitive areas.
�0.005 0.000 0.005 0.010 0.015 0.020 0.025 0.030 0.035Population
�0.005
0.000
0.005
0.010
0.015
0.020
Infra
stru
ctur
e av
aila
bilit
y
Expe
cted d
eploy
ment.
Digital divide!
Actual deployment.
Figure 2. Availability of infrastructure vs. population.
2.3 Availability of InfrastructureFinally, we consider the issue of level of service in an areaby using a Geographic Information System (GIS) to spatiallyintegrate areas of counties from census.gov and physical in-frastructure assets from (1) the Internet Atlas project [8] and(2) the long-haul infrastructure information from the Inter-Tubes project [9]. Our objective is to analyze the proximityof population centers to infrastructure for network connectiv-ity. To facilitate this analysis, we use the spatial query andoverlap capabilities in ESRI ArcGIS [15].
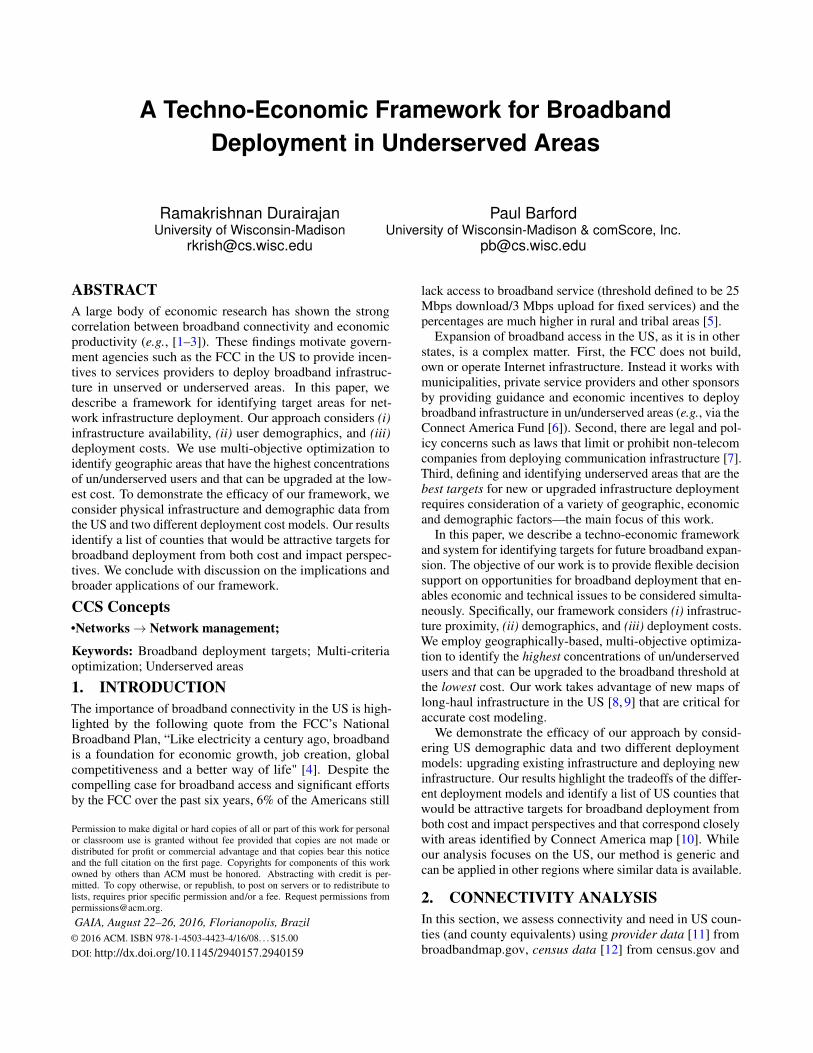
We start by layering the infrastructure shape files from In-ternet Atlas and InterTubes atop the counties. We invoke spa-tial overlap and select by location queries on these spatiallyintegrated datasets. Figures 3-(left) and -(right) distinguishthe digitally disconnected regions (in red) from those thatare well connected (in green) to physical long-haul fiber datafrom InterTubes (dataset D1) and 100 US-based networksfrom Internet Atlas repository (dataset D2) respectively. Wecall these the infrastructure availability map. These mapsform the basis of our targeting assessments described below.
3. DEPLOYMENT OBJECTIVESIn this section, we state the broad objectives for an ISP’soperational success, which are important in understand-ing how to create incentives for broadband deployment inun/underserved areas.
Maximize value. The primary objective of any companyis to maximize shareholder value. The question is how ISPsgo about doing this? While large ISPs have complex businessmodels that are beyond the scope of this paper, several keyfactors including revenue growth, cost management, customersatisfaction, and maintaining technological and operationalcapabilities.
Growing the user base. Revenue growth can be directlytied to expansion of an ISPs user base. This can be donein a variety of ways including expanding infrastructure intopreviously unserved or underserved areas or by upgradingcapabilities that allow for higher service charges. Expanding
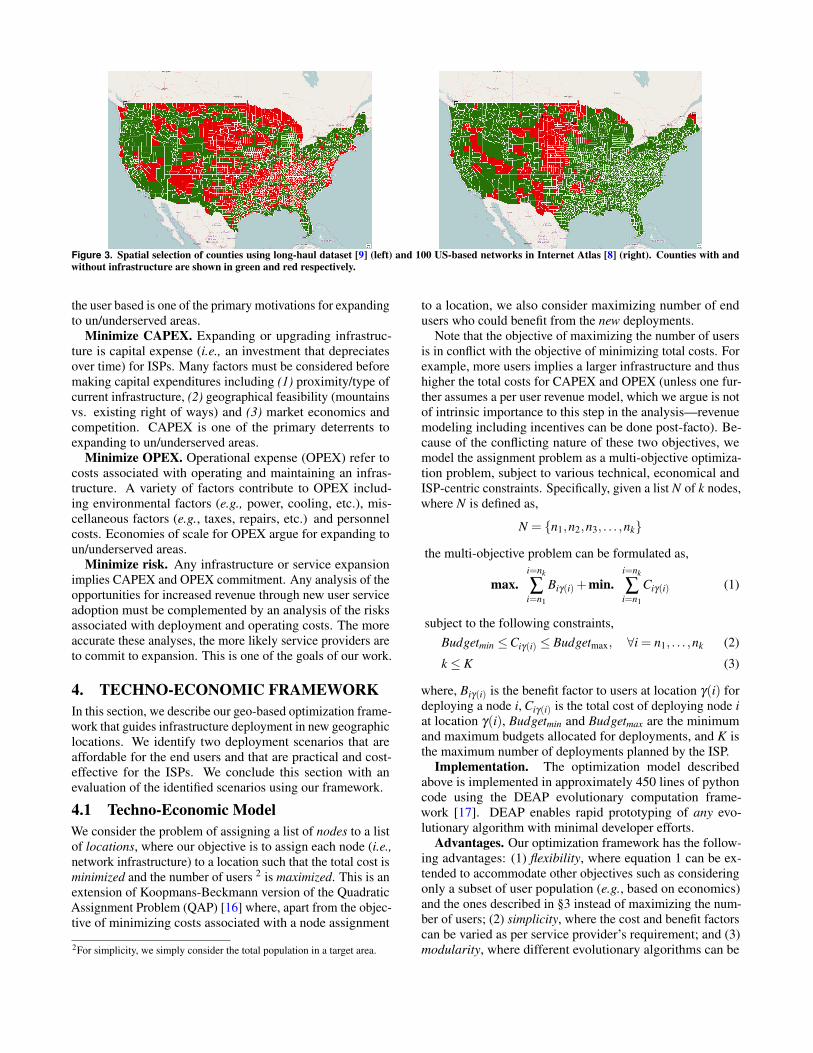
Figure 3. Spatial selection of counties using long-haul dataset [9] (left) and 100 US-based networks in Internet Atlas [8] (right). Counties with andwithout infrastructure are shown in green and red respectively.
the user based is one of the primary motivations for expandingto un/underserved areas.
Minimize CAPEX. Expanding or upgrading infrastruc-ture is capital expense (i.e., an investment that depreciatesover time) for ISPs. Many factors must be considered beforemaking capital expenditures including (1) proximity/type ofcurrent infrastructure, (2) geographical feasibility (mountainsvs. existing right of ways) and (3) market economics andcompetition. CAPEX is one of the primary deterrents toexpanding to un/underserved areas.
Minimize OPEX. Operational expense (OPEX) refer tocosts associated with operating and maintaining an infras-tructure. A variety of factors contribute to OPEX includ-ing environmental factors (e.g., power, cooling, etc.), mis-cellaneous factors (e.g., taxes, repairs, etc.) and personnelcosts. Economies of scale for OPEX argue for expanding toun/underserved areas.
Minimize risk. Any infrastructure or service expansionimplies CAPEX and OPEX commitment. Any analysis of theopportunities for increased revenue through new user serviceadoption must be complemented by an analysis of the risksassociated with deployment and operating costs. The moreaccurate these analyses, the more likely service providers areto commit to expansion. This is one of the goals of our work.
4. TECHNO-ECONOMIC FRAMEWORKIn this section, we describe our geo-based optimization frame-work that guides infrastructure deployment in new geographiclocations. We identify two deployment scenarios that areaffordable for the end users and that are practical and cost-effective for the ISPs. We conclude this section with anevaluation of the identified scenarios using our framework.
4.1 Techno-Economic ModelWe consider the problem of assigning a list of nodes to a listof locations, where our objective is to assign each node (i.e.,network infrastructure) to a location such that the total cost isminimized and the number of users 2 is maximized. This is anextension of Koopmans-Beckmann version of the QuadraticAssignment Problem (QAP) [16] where, apart from the objec-tive of minimizing costs associated with a node assignment
2For simplicity, we simply consider the total population in a target area.
to a location, we also consider maximizing number of endusers who could benefit from the new deployments.
Note that the objective of maximizing the number of usersis in conflict with the objective of minimizing total costs. Forexample, more users implies a larger infrastructure and thushigher the total costs for CAPEX and OPEX (unless one fur-ther assumes a per user revenue model, which we argue is notof intrinsic importance to this step in the analysis—revenuemodeling including incentives can be done post-facto). Be-cause of the conflicting nature of these two objectives, wemodel the assignment problem as a multi-objective optimiza-tion problem, subject to various technical, economical andISP-centric constraints. Specifically, given a list N of k nodes,where N is defined as,
N = {n1,n2,n3, . . . ,nk}
the multi-objective problem can be formulated as,
max.i=nk
∑i=n1
Biγ(i)+min.i=nk
∑i=n1
Ciγ(i) (1)
subject to the following constraints,Budgetmin ≤Ciγ(i) ≤ Budgetmax, ∀i = n1, . . . ,nk (2)
k ≤ K (3)
where, Biγ(i) is the benefit factor to users at location γ(i) fordeploying a node i, Ciγ(i) is the total cost of deploying node iat location γ(i), Budgetmin and Budgetmax are the minimumand maximum budgets allocated for deployments, and K isthe maximum number of deployments planned by the ISP.
Implementation. The optimization model describedabove is implemented in approximately 450 lines of pythoncode using the DEAP evolutionary computation frame-work [17]. DEAP enables rapid prototyping of any evo-lutionary algorithm with minimal developer efforts.
Advantages. Our optimization framework has the follow-ing advantages: (1) flexibility, where equation 1 can be ex-tended to accommodate other objectives such as consideringonly a subset of user population (e.g., based on economics)and the ones described in §3 instead of maximizing the num-ber of users; (2) simplicity, where the cost and benefit factorscan be varied as per service provider’s requirement; and (3)modularity, where different evolutionary algorithms can be
seamlessly plugged in to perform a wide spectrum of analy-ses.3
4.2 The SolutionsTo facilitate our deployment analysis, we studied solutionsproposed by researchers and consider both the practicalityand cost-effectiveness of each. First, we study solutions in-cluding (a) WiMax [19]; (b) radio wave mesh-based network-ing [20]; (c) li-fi technology [21]; and (d) satellite-, balloon-and aircraft-based networking [22,23]. Our conclusion is thatthese technologies are quite costly for deployments that coverbroad geographic areas, which are common in underservedareas. For example, a typical satellite deployment costs about$500M and includes high equipment costs ($150-200M), highmaintenance and operational costs ($120M for launch, $20Mfor launch insurance, $20M for in-orbit insurance, $15Mfor operations, and special manpower at about $10M a yearper specialist) [24]. It is somewhat surprising that industrialprojects [22, 23] continue to push at these solutions despitethe challenges and practicality issues.
Next, we investigated a set of technologies that are morecost-effective and practical. To that end, we consider thefollowing two options: (1) connect existing transmission in-frastructure (e.g., public switched telephone network (PSTN)or cable television network) to IP infrastructure using Multi-service Access Node (MSAN) at strategic locations and usecable or DSL modems at the user end; or (2) leverage powerline infrastructure to enable connectivity. Even at locationswhere PSTN is not installed, there are almost always powerlines installed, which enables broadband over power line(BPL) or distribution line carrier (DLC). Since the latter isproven successful and is already the goal of many compa-nies [25], in our evaluation we only explore the former (sce-nario 1 below). Finally, to add perspective, we also considerthe scenario where a service provider is willing to invest onbuilding new fiber infrastructure to connect a region.
4.3 EvaluationScenario1: Upgrading existing infrastructure. We firstexamine the possibility of leveraging existing infrastructure(e.g., PSTN and cable network) to connect un/underservedcounties. We augment the GIS-based approach described in§2.3 with other analysis capabilities in ArcGIS and QGISto identify new deployment locations. Specifically, for thisscenario, we leverage the hub distance tool in MMQGIS [26]to identify a number of locations that do not have any con-nectivity and that could be cost-effectively connected to otherareas with connectivity in Figures 3. By using the infrastruc-ture availability map as input to the hub distance tool, wecreate hubs in green polygons which serve as the deploymentlocation for MSANs. These MSAN locations are connectedto the nearest red polygon, which indicates the absence ofconnectivity.
Since all the identified hub-locations cannot be connected,as it is impractical in terms of cost, we apply our techno-economic framework to maximize connectivity with mini-
3In our evaluation, we use NGSA-II evolutionary algorithm [18].
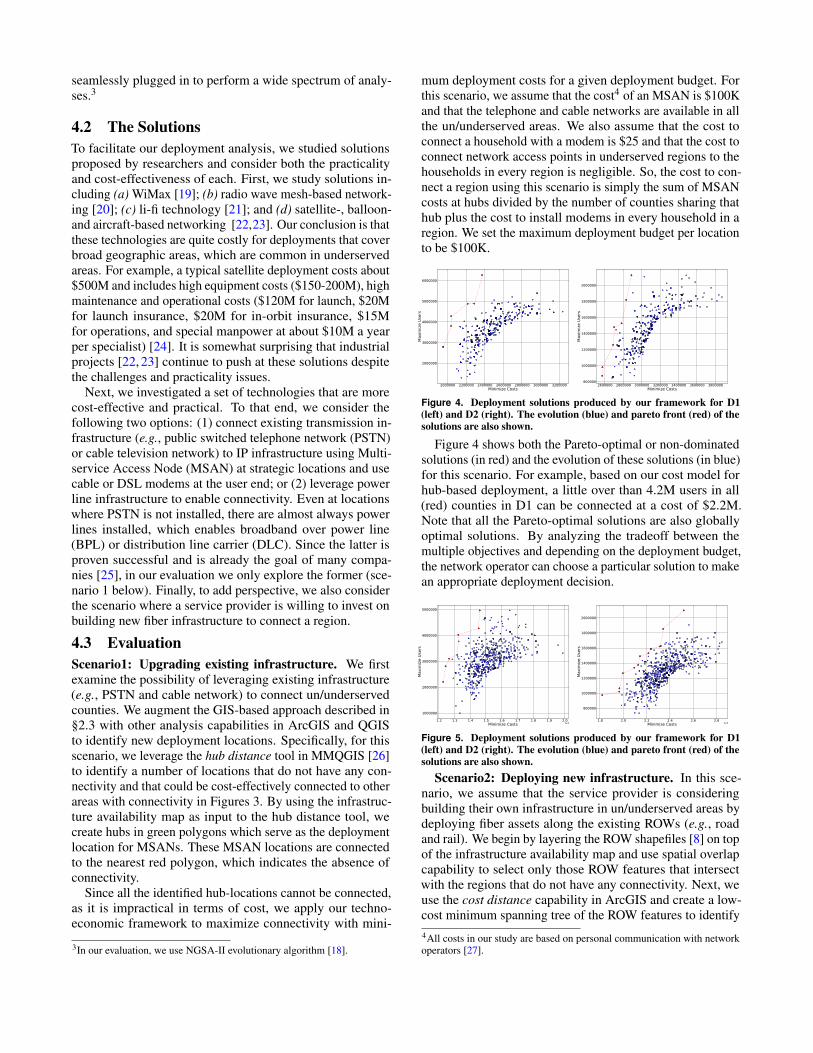
mum deployment costs for a given deployment budget. Forthis scenario, we assume that the cost4 of an MSAN is $100Kand that the telephone and cable networks are available in allthe un/underserved areas. We also assume that the cost toconnect a household with a modem is $25 and that the cost toconnect network access points in underserved regions to thehouseholds in every region is negligible. So, the cost to con-nect a region using this scenario is simply the sum of MSANcosts at hubs divided by the number of counties sharing thathub plus the cost to install modems in every household in aregion. We set the maximum deployment budget per locationto be $100K.
2000000 2200000 2400000 2600000 2800000 3000000 3200000Minimize Costs
2000000
3000000
4000000
5000000
6000000
Max
imiz
e Us
ers
2600000 2800000 3000000 3200000 3400000 3600000 3800000Minimize Costs
800000
1000000
1200000
1400000
1600000
1800000
2000000
Max
imiz
e Us
ers
Figure 4. Deployment solutions produced by our framework for D1(left) and D2 (right). The evolution (blue) and pareto front (red) of thesolutions are also shown.
Figure 4 shows both the Pareto-optimal or non-dominatedsolutions (in red) and the evolution of these solutions (in blue)for this scenario. For example, based on our cost model forhub-based deployment, a little over than 4.2M users in all(red) counties in D1 can be connected at a cost of $2.2M.Note that all the Pareto-optimal solutions are also globallyoptimal solutions. By analyzing the tradeoff between themultiple objectives and depending on the deployment budget,the network operator can choose a particular solution to makean appropriate deployment decision.
1.2 1.3 1.4 1.5 1.6 1.7 1.8 1.9 2.0Minimize Costs 1e7
1000000
2000000
3000000
4000000
5000000
Max
imiz
e Us
ers
1.8 2.0 2.2 2.4 2.6 2.8Minimize Costs 1e7
800000
1000000
1200000
1400000
1600000
1800000
2000000
Max
imiz
e Us
ers
Figure 5. Deployment solutions produced by our framework for D1(left) and D2 (right). The evolution (blue) and pareto front (red) of thesolutions are also shown.
Scenario2: Deploying new infrastructure. In this sce-nario, we assume that the service provider is consideringbuilding their own infrastructure in un/underserved areas bydeploying fiber assets along the existing ROWs (e.g., roadand rail). We begin by layering the ROW shapefiles [8] on topof the infrastructure availability map and use spatial overlapcapability to select only those ROW features that intersectwith the regions that do not have any connectivity. Next, weuse the cost distance capability in ArcGIS and create a low-cost minimum spanning tree of the ROW features to identify4All costs in our study are based on personal communication with networkoperators [27].
the new fiber ROW deployments. Figures 6-(left) and -(right)shows the ROW-based fiber deployments for datasets D1 andD2 respectively. As one might expect based on results in [8],the resulting infrastructure bears a striking resemblance tocurrent fiber deployments.
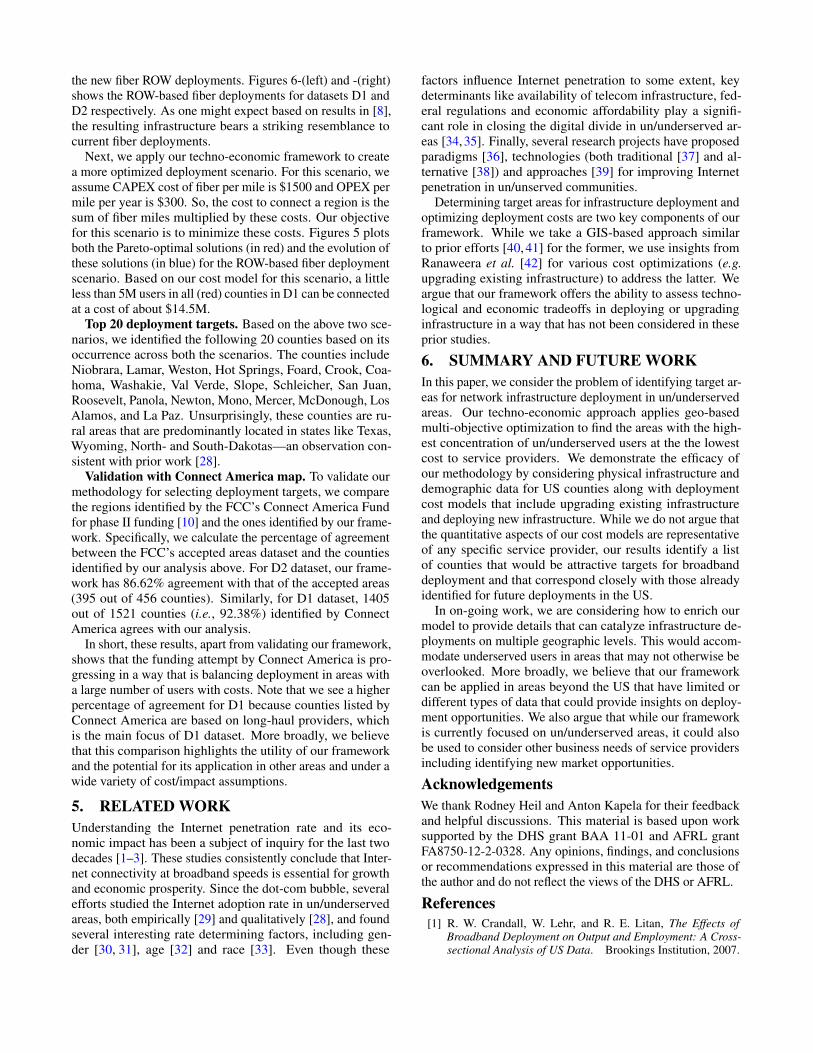
Next, we apply our techno-economic framework to createa more optimized deployment scenario. For this scenario, weassume CAPEX cost of fiber per mile is $1500 and OPEX permile per year is $300. So, the cost to connect a region is thesum of fiber miles multiplied by these costs. Our objectivefor this scenario is to minimize these costs. Figures 5 plotsboth the Pareto-optimal solutions (in red) and the evolution ofthese solutions (in blue) for the ROW-based fiber deploymentscenario. Based on our cost model for this scenario, a littleless than 5M users in all (red) counties in D1 can be connectedat a cost of about $14.5M.
Top 20 deployment targets. Based on the above two sce-narios, we identified the following 20 counties based on itsoccurrence across both the scenarios. The counties includeNiobrara, Lamar, Weston, Hot Springs, Foard, Crook, Coa-homa, Washakie, Val Verde, Slope, Schleicher, San Juan,Roosevelt, Panola, Newton, Mono, Mercer, McDonough, LosAlamos, and La Paz. Unsurprisingly, these counties are ru-ral areas that are predominantly located in states like Texas,Wyoming, North- and South-Dakotas—an observation con-sistent with prior work [28].
Validation with Connect America map. To validate ourmethodology for selecting deployment targets, we comparethe regions identified by the FCC’s Connect America Fundfor phase II funding [10] and the ones identified by our frame-work. Specifically, we calculate the percentage of agreementbetween the FCC’s accepted areas dataset and the countiesidentified by our analysis above. For D2 dataset, our frame-work has 86.62% agreement with that of the accepted areas(395 out of 456 counties). Similarly, for D1 dataset, 1405out of 1521 counties (i.e., 92.38%) identified by ConnectAmerica agrees with our analysis.
In short, these results, apart from validating our framework,shows that the funding attempt by Connect America is pro-gressing in a way that is balancing deployment in areas witha large number of users with costs. Note that we see a higherpercentage of agreement for D1 because counties listed byConnect America are based on long-haul providers, whichis the main focus of D1 dataset. More broadly, we believethat this comparison highlights the utility of our frameworkand the potential for its application in other areas and under awide variety of cost/impact assumptions.
5. RELATED WORKUnderstanding the Internet penetration rate and its eco-nomic impact has been a subject of inquiry for the last twodecades [1–3]. These studies consistently conclude that Inter-net connectivity at broadband speeds is essential for growthand economic prosperity. Since the dot-com bubble, severalefforts studied the Internet adoption rate in un/underservedareas, both empirically [29] and qualitatively [28], and foundseveral interesting rate determining factors, including gen-der [30, 31], age [32] and race [33]. Even though these
factors influence Internet penetration to some extent, keydeterminants like availability of telecom infrastructure, fed-eral regulations and economic affordability play a signifi-cant role in closing the digital divide in un/underserved ar-eas [34, 35]. Finally, several research projects have proposedparadigms [36], technologies (both traditional [37] and al-ternative [38]) and approaches [39] for improving Internetpenetration in un/unserved communities.
Determining target areas for infrastructure deployment andoptimizing deployment costs are two key components of ourframework. While we take a GIS-based approach similarto prior efforts [40, 41] for the former, we use insights fromRanaweera et al. [42] for various cost optimizations (e.g.upgrading existing infrastructure) to address the latter. Weargue that our framework offers the ability to assess techno-logical and economic tradeoffs in deploying or upgradinginfrastructure in a way that has not been considered in theseprior studies.
6. SUMMARY AND FUTURE WORKIn this paper, we consider the problem of identifying target ar-eas for network infrastructure deployment in un/underservedareas. Our techno-economic approach applies geo-basedmulti-objective optimization to find the areas with the high-est concentration of un/underserved users at the the lowestcost to service providers. We demonstrate the efficacy ofour methodology by considering physical infrastructure anddemographic data for US counties along with deploymentcost models that include upgrading existing infrastructureand deploying new infrastructure. While we do not argue thatthe quantitative aspects of our cost models are representativeof any specific service provider, our results identify a listof counties that would be attractive targets for broadbanddeployment and that correspond closely with those alreadyidentified for future deployments in the US.
In on-going work, we are considering how to enrich ourmodel to provide details that can catalyze infrastructure de-ployments on multiple geographic levels. This would accom-modate underserved users in areas that may not otherwise beoverlooked. More broadly, we believe that our frameworkcan be applied in areas beyond the US that have limited ordifferent types of data that could provide insights on deploy-ment opportunities. We also argue that while our frameworkis currently focused on un/underserved areas, it could alsobe used to consider other business needs of service providersincluding identifying new market opportunities.
AcknowledgementsWe thank Rodney Heil and Anton Kapela for their feedbackand helpful discussions. This material is based upon worksupported by the DHS grant BAA 11-01 and AFRL grantFA8750-12-2-0328. Any opinions, findings, and conclusionsor recommendations expressed in this material are those ofthe author and do not reflect the views of the DHS or AFRL.
References[1] R. W. Crandall, W. Lehr, and R. E. Litan, The Effects of
Broadband Deployment on Output and Employment: A Cross-sectional Analysis of US Data. Brookings Institution, 2007.
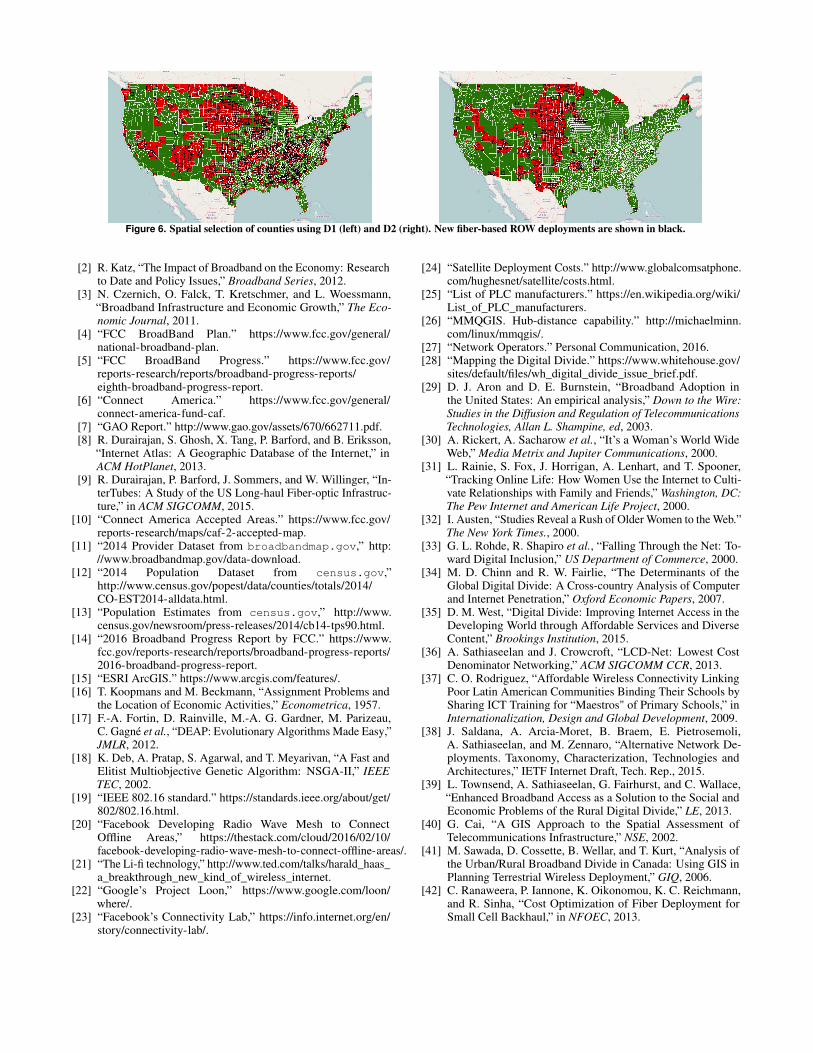
Figure 6. Spatial selection of counties using D1 (left) and D2 (right). New fiber-based ROW deployments are shown in black.
[2] R. Katz, “The Impact of Broadband on the Economy: Researchto Date and Policy Issues,” Broadband Series, 2012.
[3] N. Czernich, O. Falck, T. Kretschmer, and L. Woessmann,“Broadband Infrastructure and Economic Growth,” The Eco-nomic Journal, 2011.
[4] “FCC BroadBand Plan.” https://www.fcc.gov/general/national-broadband-plan.
[5] “FCC BroadBand Progress.” https://www.fcc.gov/reports-research/reports/broadband-progress-reports/eighth-broadband-progress-report.
[6] “Connect America.” https://www.fcc.gov/general/connect-america-fund-caf.
[7] “GAO Report.” http://www.gao.gov/assets/670/662711.pdf.[8] R. Durairajan, S. Ghosh, X. Tang, P. Barford, and B. Eriksson,
“Internet Atlas: A Geographic Database of the Internet,” inACM HotPlanet, 2013.
[9] R. Durairajan, P. Barford, J. Sommers, and W. Willinger, “In-terTubes: A Study of the US Long-haul Fiber-optic Infrastruc-ture,” in ACM SIGCOMM, 2015.
[10] “Connect America Accepted Areas.” https://www.fcc.gov/reports-research/maps/caf-2-accepted-map.
[11] “2014 Provider Dataset from broadbandmap.gov,” http://www.broadbandmap.gov/data-download.
[12] “2014 Population Dataset from census.gov,”http://www.census.gov/popest/data/counties/totals/2014/CO-EST2014-alldata.html.
[13] “Population Estimates from census.gov,” http://www.census.gov/newsroom/press-releases/2014/cb14-tps90.html.
[14] “2016 Broadband Progress Report by FCC.” https://www.fcc.gov/reports-research/reports/broadband-progress-reports/2016-broadband-progress-report.
[15] “ESRI ArcGIS.” https://www.arcgis.com/features/.[16] T. Koopmans and M. Beckmann, “Assignment Problems and
the Location of Economic Activities,” Econometrica, 1957.[17] F.-A. Fortin, D. Rainville, M.-A. G. Gardner, M. Parizeau,
C. Gagné et al., “DEAP: Evolutionary Algorithms Made Easy,”JMLR, 2012.
[18] K. Deb, A. Pratap, S. Agarwal, and T. Meyarivan, “A Fast andElitist Multiobjective Genetic Algorithm: NSGA-II,” IEEETEC, 2002.
[19] “IEEE 802.16 standard.” https://standards.ieee.org/about/get/802/802.16.html.
[20] “Facebook Developing Radio Wave Mesh to ConnectOffline Areas,” https://thestack.com/cloud/2016/02/10/facebook-developing-radio-wave-mesh-to-connect-offline-areas/.
[21] “The Li-fi technology,” http://www.ted.com/talks/harald_haas_a_breakthrough_new_kind_of_wireless_internet.
[22] “Google’s Project Loon,” https://www.google.com/loon/where/.
[23] “Facebook’s Connectivity Lab,” https://info.internet.org/en/story/connectivity-lab/.
[24] “Satellite Deployment Costs.” http://www.globalcomsatphone.com/hughesnet/satellite/costs.html.
[25] “List of PLC manufacturers.” https://en.wikipedia.org/wiki/List_of_PLC_manufacturers.
[26] “MMQGIS. Hub-distance capability.” http://michaelminn.com/linux/mmqgis/.
[27] “Network Operators.” Personal Communication, 2016.[28] “Mapping the Digital Divide.” https://www.whitehouse.gov/
sites/default/files/wh_digital_divide_issue_brief.pdf.[29] D. J. Aron and D. E. Burnstein, “Broadband Adoption in
the United States: An empirical analysis,” Down to the Wire:Studies in the Diffusion and Regulation of TelecommunicationsTechnologies, Allan L. Shampine, ed, 2003.
[30] A. Rickert, A. Sacharow et al., “It’s a Woman’s World WideWeb,” Media Metrix and Jupiter Communications, 2000.
[31] L. Rainie, S. Fox, J. Horrigan, A. Lenhart, and T. Spooner,“Tracking Online Life: How Women Use the Internet to Culti-vate Relationships with Family and Friends,” Washington, DC:The Pew Internet and American Life Project, 2000.
[32] I. Austen, “Studies Reveal a Rush of Older Women to the Web.”The New York Times., 2000.
[33] G. L. Rohde, R. Shapiro et al., “Falling Through the Net: To-ward Digital Inclusion,” US Department of Commerce, 2000.
[34] M. D. Chinn and R. W. Fairlie, “The Determinants of theGlobal Digital Divide: A Cross-country Analysis of Computerand Internet Penetration,” Oxford Economic Papers, 2007.
[35] D. M. West, “Digital Divide: Improving Internet Access in theDeveloping World through Affordable Services and DiverseContent,” Brookings Institution, 2015.
[36] A. Sathiaseelan and J. Crowcroft, “LCD-Net: Lowest CostDenominator Networking,” ACM SIGCOMM CCR, 2013.
[37] C. O. Rodriguez, “Affordable Wireless Connectivity LinkingPoor Latin American Communities Binding Their Schools bySharing ICT Training for “Maestros" of Primary Schools,” inInternationalization, Design and Global Development, 2009.
[38] J. Saldana, A. Arcia-Moret, B. Braem, E. Pietrosemoli,A. Sathiaseelan, and M. Zennaro, “Alternative Network De-ployments. Taxonomy, Characterization, Technologies andArchitectures,” IETF Internet Draft, Tech. Rep., 2015.
[39] L. Townsend, A. Sathiaseelan, G. Fairhurst, and C. Wallace,“Enhanced Broadband Access as a Solution to the Social andEconomic Problems of the Rural Digital Divide,” LE, 2013.
[40] G. Cai, “A GIS Approach to the Spatial Assessment ofTelecommunications Infrastructure,” NSE, 2002.
[41] M. Sawada, D. Cossette, B. Wellar, and T. Kurt, “Analysis ofthe Urban/Rural Broadband Divide in Canada: Using GIS inPlanning Terrestrial Wireless Deployment,” GIQ, 2006.
[42] C. Ranaweera, P. Iannone, K. Oikonomou, K. C. Reichmann,and R. Sinha, “Cost Optimization of Fiber Deployment forSmall Cell Backhaul,” in NFOEC, 2013.