a technical guide to jail data analysis
TRANSCRIPT

October 2021
A Technical Guide to Jail Data Analysis
Stephen Roberts, with contributions from Jennifer Peirce, Sandhya Kajeepeta, and Madeline Bailey
Vera Institute of Justice 2
Table of Contents
Introduction 3
The Dynamics of Jail Populations 3
Obtaining Jail Data for Analysis 5
Organizing and Cleaning Data Before Analysis 8
Three Views into Jail Dynamics 10
Historical trends using aggregate data 10
Daily population using recent individual-level data from the jail 12
Bookings using recent individual-level data from the jail 12
Measures and Key Terms in Jail Data Analysis 13
Sample Analyses 15
Overview: Jail Population and Length of Stay 15
Legal Status 18
Race 19
Gender 20
Charges and charge severity 21
Bail and pretrial release 24
Appendix 1: Sample Jail Data Request 26
Datasets 26
Data fields 26
Appendix 2: Sample Freedom of Information Request 28
Appendix 3: County Jail Data Reports for Certain States 31
Appendix 4: Glossary of Terms in this Guide and the “Toolkit for Jail Decarceration in Your Community” 32

Vera Institute of Justice 3
Introduction
This guide provides an overview of the key steps of analyzing jail data to inform policy and practice change. It aims to cover key technical details in language that is accessible to people without statistics or database training.
Analysis of jail data provides communities with insights into who is in their jail, the reasons why, and the extent to which contact with the jail affects the community. Jail data analysis can deliver objective, quantitative information across many key areas. Examining this information carefully can lead to more direct, fact-based discussions about the jail in your community. And by reconciling your own local findings with existing research on the financial and human costs of jail, you can see how reducing your local jail population may lead to better outcomes in your community.
The Dynamics of Jail Populations
The number of people who are in jail on any given day is determined by the dynamics that cause the population of a jail to grow, shrink, and “turn over.” The number of people in the jail is determined by how many are admitted and how long they stay. The number of people in jail is referred to as the census, the daily population, or, if calculated as an average over time, the average daily population (ADP). Jail admissions are usually called bookings, and how long people stay in jail—the number of days between booking and release—is the length of stay (LOS).1 (It’s important to remember that number of bookings is not the same as the number of individual people who had a jail stay, as some people have more than one booking in a given time frame.)
A change in either the number of admissions or the average LOS will lead to a change in the ADP. For example, if the jail reduces admissions over a period of time but the LOS does not change, the ADP will decline. Likewise, if the average LOS decreases but admissions do not change, the ADP will similarly decline. A complete strategy for reducing the size of your jail, therefore, should consider ways to reduce both the number of people admitted and how long they stay once they arrive. To this end, analyzing jail data should begin with 1) looking at the average daily population and then 2) looking at details of admissions, releases, and LOS to understand the factors that determine the average daily population.
Another important measure of jail usage is bed-days. One bed-day is defined as one person spending one day in jail. So, one person spending 10 days in jail equals 10 bed-days. Five people each spending two days in jail also represents a total of 10 bed-days (5 people each day * 2 days = 10 bed-days). If a jail has an ADP of 100 over the course of one year, then 36,500 bed-days were used in that year (100 * 365 days = 36,500 bed-days).
It’s also important to track jail stays of less than one bed-day. Many discussions of jail populations focus on people staying at least one night in jail, rather than those who are booked in and released within a few hours, because longer stays use more resources. But it’s important

Vera Institute of Justice 4
to remember that even short bookings can have harmful impacts on people’s lives through the formal record of contact with the criminal justice system, interruption of work and childcare responsibilities, financial costs, and potentially negative interactions with jail staff or other officials. Therefore, although most jail data analyses rightly focus on bed-days, it may also be useful to calculate the numbers, proportions, and characteristics of people whose stays in jail are less than 24 hours to ensure you have the most complete picture of your jail and its impact on the lives of people in your community.
It may be helpful to think of the daily jail population following the “80/20 rule” (the principle that 80 percent of the effect comes from 20 percent of the cause). In Vera’s experience, it is common for roughly 80 percent of the bed-days to be occupied by only 20 percent of the admissions. This is because the daily jail population is also influenced by the length of time people spend in jail. In fact, in some jails recently analyzed by Vera, only 13 to 18 percent of admissions accounted for 80 percent of bed-days. (It is also usually the case that a small number of people with multiple admissions accounts for a high proportion of admissions in a given period and that these people also usually occupy more bed-days.)
This means that when you examine the number of people in jail on any given day, you should expect to find results that are skewed toward people with longer lengths of stay (when compared to the overall number of people booked into the jail)—usually people who have been sentenced, people who are returned to jail on a probation violation, or people being detained pretrial on felony cases, which typically take longer to resolve. Conversely, when you look at admissions, you should expect to find these numbers dominated by people spending a couple of days in jail.
Both of these numbers—admissions and ADP—are important pillars of any jail analysis if you’re looking to reduce the harmful impact of jail on your community. The high number of admissions for very short stays reveals the deep reach that contact with jail has into the community. Research has shown that even brief jail stays can lead to lasting and negative outcomes for individuals.2 And the very fact that stays are so short may be a good indicator that these admissions serve little public safety objective and could be handled without a jail admission at all.
However, even if a jail were to eliminate, say, the 40 percent of admissions with the shortest stays, it might result in only a small reduction in the ADP because short jail stays consume fewer resources than a long stay (for example, a jail stay of 100 days consumes 50 times more resources than a jail stay of 2 days). This means that most attempts to substantially reduce the jail population will have to reduce the lengths of stay for the jail population consuming most of the bed-days—people serving local sentences, detained for lengthy pretrial periods, and facing significant delays in the court system or for specialized processes such as mental health assessments. The key to reducing length of stay is to make releases easier and quicker—without resorting to tactics that undermine due process, such as prohibiting the granting of continuances in arbitrary ways.3

Vera Institute of Justice 5
Obtaining Jail Data for Analysis
Although jails are public institutions with obligations to provide accessible, transparent data to local residents, it is not always easy to track down this information. Consider the following approaches: Look at historical trends on jail incarceration in your county. Vera’s Incarceration Trends Project collates annual government statistics on local county jail populations for every county across the country. You can look at data trends directly on the website or download the data in a spreadsheet to do your own analysis. See the section below, “Historical trends using aggregate data,” for more details. Download publicly available data. Your local jail may publicly post its roster of who is currently incarcerated or other data on its website, which you can download and use. Jail population reports are also sometimes available on state government websites (see Appendix 3) or other nongovernmental organization websites. These public rosters and reports sometimes include analytically useful data such as charge, bail, and demographic characteristics.
Please note that if the jail posts data in a way that can be collected by automated web-scraping software, it is likely already included in national data projects that are constantly consolidating jail data from across the country. Check the data at Vera’s Jail Population Project. NYU’s Public Safety Lab has published reports on changes during COVID based on data collected this way. These projects use computer programs to automatically collect jail roster data on a regular basis, sometimes every night. You can look up a specific county jail, and the data can tell you
jail population numbers over time; rate of jail incarceration per capita, based on local county population (this can be
broken down by legal status, gender, and sometimes by age and race/ethnicity); comparisons to other counties and to state and national averages.
If the jail posts data each day or week in a downloadable format, download the files as often as possible (daily, weekly, monthly). Because these data are typically stored as webpages (HTML) or PDF documents, you’ll need to extract the necessary data and create a dataset that can be read by software such as Excel, R, or Stata.
Data analysts commonly use software such as Python and R to parse HTML and PDF data. There are also options, such as Tabula, to parse PDF documents that do not require writing code. The following table lists some of the tools Vera often uses.
Vera Institute of Justice 6
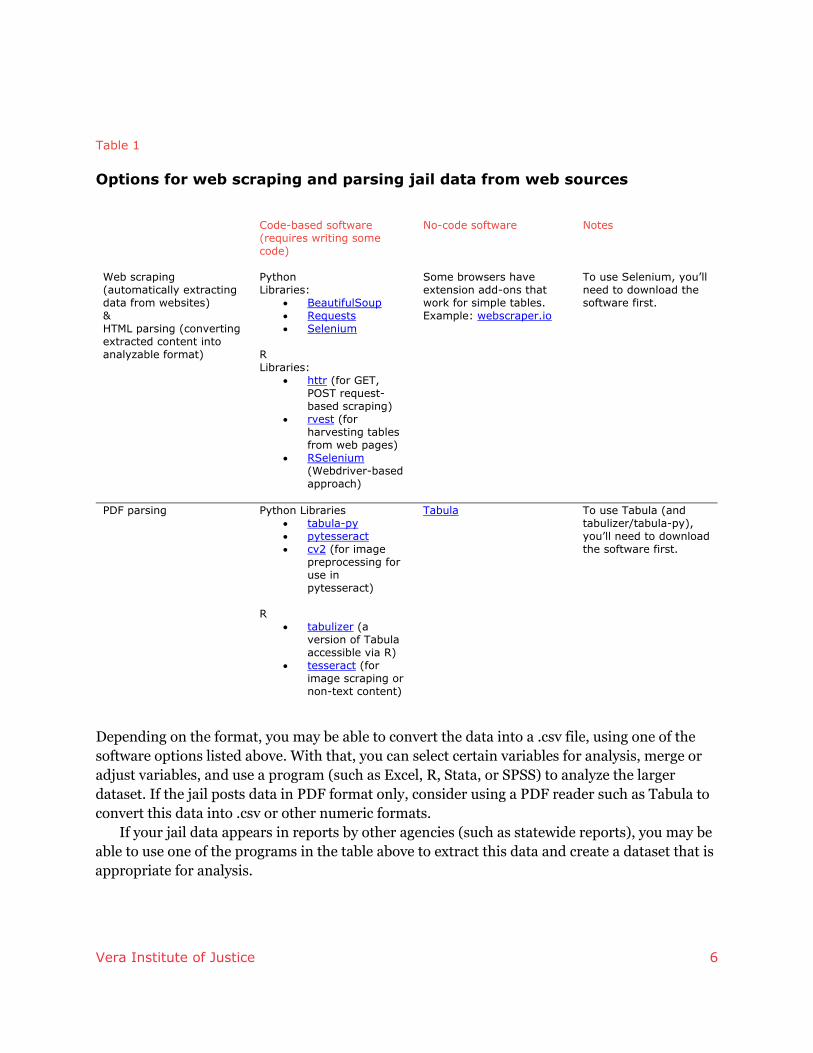
Table 1
Options for web scraping and parsing jail data from web sources
Code-based software (requires writing some code)
No-code software
Notes
Web scraping (automatically extracting data from websites) & HTML parsing (converting extracted content into analyzable format)
Python Libraries:
• BeautifulSoup • Requests • Selenium
R Libraries:
• httr (for GET, POST request-based scraping)
• rvest (for harvesting tables from web pages)
• RSelenium (Webdriver-based approach)
Some browsers have extension add-ons that work for simple tables. Example: webscraper.io
To use Selenium, you’ll need to download the software first.
PDF parsing Python Libraries • tabula-py • pytesseract • cv2 (for image
preprocessing for use in pytesseract)
R
• tabulizer (a version of Tabula accessible via R)
• tesseract (for image scraping or non-text content)
Tabula To use Tabula (and tabulizer/tabula-py), you’ll need to download the software first.
Depending on the format, you may be able to convert the data into a .csv file, using one of the software options listed above. With that, you can select certain variables for analysis, merge or adjust variables, and use a program (such as Excel, R, Stata, or SPSS) to analyze the larger dataset. If the jail posts data in PDF format only, consider using a PDF reader such as Tabula to convert this data into .csv or other numeric formats.
If your jail data appears in reports by other agencies (such as statewide reports), you may be able to use one of the programs in the table above to extract this data and create a dataset that is appropriate for analysis.
Vera Institute of Justice 7
Submit a formal data request to the local jail. If your jail does not publish its data, you can submit a direct request. If you are a government agency or a community-based group, it is usually more constructive to open a conversation with the jail leaders about your interest and plans before submitting a formal request. Ideally, this can develop into a partnership that increases transparency and collaboration. But even if that kind of relationship is not feasible, most jail leaders will respond to a direct request for data. It can be helpful to cite any mandate that the jail agency or the county government may have about data transparency. For example, Racine County, Wisconsin, has such a mandate. Some counties, such as Hays County, Texas, have developed data dashboards as a way to increase accountability and oversight of local justice systems. The COVID-19 in Corrections Data Transparency Act proposes some measures for data transparency related to the pandemic inside prisons and jails.
A data request usually refers to two formats: all admissions and releases during a given time frame, or a census or snapshot of the jail population on a single day. One or the other may be more suitable for your project, or it may be useful to request both formats.
A data request should clarify which format it seeks and should include:
The dates or time period that the data should cover. The data fields/variables required. Request for codes and abbreviations used in the data and explanations or
definitions for them. Data format considerations. For example, an Excel spreadsheet is preferable to a
PDF to allow more flexibility. Confidentiality commitments, such as noting that individuals’ names and
addresses be removed. Typically, a unique “booking ID” number is generated. Ideally, a unique “individual ID” also exists to indicate when one person has multiple bookings, in lieu of names or date of birth.
The time frame in which you would like the agency to submit the data. If there are multiple files—for example, a separate file for admissions and for
releases—there should be a unique ID to connect each case or individual person across files.
See Appendix 1 for a sample data request letter. Offer opportunity for data analysis collaboration. Some facilities do not have the capacity, skills, or technology to transfer database files in the ways described above. Sometimes jail staff are not familiar with how to export data in the requested formats, rather than as daily reports. If the jail is willing, there may be an opportunity to draw on the expertise of local community members familiar with databases or to reach out for guidance to the company that runs the database. In the rare case of a jail keeping only paper records, consider suggesting a collaboration to digitize these documents, within agreed parameters for confidentiality.
Vera Institute of Justice 8
Submit a Freedom of Information Act request. There may be situations in which a direct data request is not successful. A Freedom of Information Act (FOIA) request is an alternative that can also generate data. The main disadvantages are that this tends to be a one-time data release and that this process can be perceived as adversarial by the local authorities. The advantages are that once the data is released, there are fewer restrictions on making it public. See Appendix 2 for a sample FOIA request.
Organizing and Cleaning Data Before Analysis
Even after you obtain data, it is likely that you will need to adjust its format before beginning analysis.4 Most jails—like all public institutions—keep records and data in a way that is useful for daily operations, such as planning transfers to and from court or doing daily head counts. The typical formats of jail records systems are not necessarily set up in a way that allows for analysis of trends over time or looking at overall categories of admissions, charges, etc. Therefore, a big part of jail data analysis is simply organizing and cleaning the data into a format that works for the planned analysis. This will vary by location and project, but there are some common pitfalls and tips.
Some common tasks during data cleaning include:
Assessing which data fields are included and which ones are missing based on the standard lists below.
Creating a codebook—or adding to an existing one—that explains the meaning of each variable and that spells out the acronyms used in the database. Often, the county will have a list of codes, but these may require more explanation for outside readers.
Where possible, trying to standardize the format of text sections to consolidate individual names, charge descriptions, and other text entries that may contain slight variations in wording, spelling, or initials.
Checking for common issues: Is all the key data included for each booking, or is some data in separate files? Are there substantial missing values for a given variable? Are statute codes included with charge descriptions? Is the top charge per booking flagged? Are bond amounts specified for specific charges or listed across all charges for a person on a given booking? It is fairly common for these issues not to be clearly defined in the data provided, and so it is important to ask the jail for these answers.
The steps you take to organize and clean your data will depend on the structure of the data you receive from the jail. Below are some common characteristics and some options on the steps you can take to organize the data for analyzing trends.
Vera Institute of Justice 9
Typical types of data files:
Separate admissions and releases data files: You may receive two separate files, one reflecting all admissions over a given time frame and the other reflecting all releases. Ensure that there is a unique booking ID so that you can link or merge the two files. Once linked, you can determine length of stay and average daily population.
Complete booking data file: You may receive one file of jail booking data with admission and release information already linked together by unique booking ID.
Single-day snapshot data file: You may receive a snapshot file reflecting all people held in the jail on a given day or over multiple days. This data format will provide insight into characteristics of the jail population. Keep in mind that jail population figures tend to vary by day of week and season, so a snapshot on a given day may not be consistent with longer term trends.
Typical data structures:
Charge level: Charge-level data is the most detailed data, in which each row represents a specific charge on a booking for an individual person. There are often multiple charges on a single booking. Ensure that there is a unique booking ID so that you can identify all the charges related to the same booking. To make the data easier to manage, you may choose to convert data from long to wide format using the booking ID so that each row represents a single booking with all charges listed in separate columns in each row. Ideally, the data will include an indication of the “top charge” (most serious charge) on the booking. If not, you may consider looking online for a hierarchy of charges/statutes for a given state or creating a hierarchy based on your own knowledge of the severity of charges. For more details on how to classify charges by severity or by thematic type, and on how to determine the top charge if it is not identified, see the “Charges and charge severity” section below, as well as “Top Charge” in the Glossary.
Booking level: With booking-level data, each row represents a single booking, including the demographics for the individual, the date of admission and date of release, and charge information for either all charges associated with the booking or the top charges associated with the booking. Each row should include a unique booking ID. Additionally, an individual ID will allow you to identify people who were booked into the jail multiple times over the period of interest.
Individual level: The only difference between booking-level data and individual-level data is how the data is provided for people who have multiple bookings. If information for multiple bookings is included on a single row of data, you may choose to convert this data so that each row represents a single booking (in other words, from wide to long format); multiple bookings for the same person should

Vera Institute of Justice 10
still be identifiable using the unique individual ID. This is less preferable for the main analysis, but it can be useful for understanding patterns of repeat bookings.
Typical data variables:
Individual identifier, booking identifier, demographic information, date of
admission, reason for admission, charge description and classification (felony, misdemeanor, other), bond type, bond amount, court type (for example, district, municipal), holding agency, date of release, flags for mental health or medical issues.
Another consideration at this stage is to assess confidentiality issues. Many public rosters and some other datasets that facilities share include the names, birth dates, addresses, and other personal details of incarcerated people. For privacy and ethical reasons, it is generally advisable to remove these details in a research initiative. However, it may be helpful to retain personal information during data cleaning in order to connect individuals’ files across multiple datasets or agency datasets.
Some examples:
A jail might keep admissions and release information in two separate files, with a person’s name appearing in each. These files can be merged by matching names (and/or other identifying information) across both files. Then create a name ID per unique name. With this, you can delete the names and other personal details.
If you have data from other agencies, such as courts or probation, it may be necessary to merge files. Before deleting names, check whether there are court case numbers in the jail files, or other identifiers that would allow you to link individuals’ files. If not, link names, then create a unique ID, and then delete the names (but note that matching based on name, or even name plus date of birth, may generate imperfect matches).
If the jail does not track Latinx/Hispanic as a race/ethnicity category, it’s important to explicitly acknowledge this limitation in the data analysis and any related public discussions of the data. Without this category, Latinx/Hispanic people are often categorized as white, and sometimes as Black; this can skew the numbers and rates.5
Three Views into Jail Dynamics
Historical trends using aggregate data The two sections that follow describe how you can learn about your jail population by looking at recent data. But first, it’s important to gain an understanding of how the current level of

Vera Institute of Justice 11
incarceration compares with historical trends. Since the 1970s, the number of people in jail in the United States has risen fivefold; the number of women in jail has increased 14-fold. Similar growth has been seen throughout all 3,000 U.S. counties. As you analyze the jail incarceration trends in your county, you can add context to your data analysis by asking concrete questions you know are of interest in your county.
Some examples:
Are jail incarceration rates in your county similar to those nationwide or in other similar counties? (Higher than average rates often flag a problem. However, rates in all parts of the United States are already high, so being at or below the average of neighboring areas does not mean that there isn’t a problem.)
How do jail incarceration rates compare to how they were in the past? What changes occurred shortly after past jail capacity expansions? If, in fact, there has been a steep increase in the jail population, how have jail populations changed for specific groups over time? Has women’s incarceration increased at a faster rate than men’s incarceration? Have racial disparities worsened over time?
Are the trends what you expected? In general, the growth in jail populations is driven by local and state decisions about law enforcement, bail, and court calendaring. Historical trends reveal the cumulative impact of those decisions.
You can examine the trends in your county and compare them with trends from other counties using Vera’s Incarceration Trends Project data tool, which stores the data that has been collected by the U.S. Bureau of Justice Statistics as well as other publicly available jail and prison roster data. Here you can see overall jail and prison trends (i.e., people sent to prison from your county courts), and demographic trends broken down by race and gender. You can see maps of counties with colors indicating different incarceration rates across the United States, and you can generate simple graphs of key data points for counties you choose. You can also download the full dataset as a spreadsheet.
This resource includes the option to look at raw numbers or at rates that take into account the total population size of the county.6 It also allows you to distinguish the people who are in jail on pretrial detention only among the overall jail population. For most counties, the numbers go back to the 1970s and up to quite recently.
Vera has also published fact sheets for each state that include graphs showing jail and prison populations over time, by race and gender, and jail population trends in comparison to neighboring counties and states.
Some other sources of historical jail data:
Some states keep records of county jail data over time; for example, the Georgia Department of Community Affairs. See Appendix 3 for more examples. These may be in PDF reports, and you may need to convert these into .csv files to analyze the numbers.

Vera Institute of Justice 12
Bureau of Justice Statistics’ Annual Survey of Jails, Census of Jails, and Mortality in Correctional Institutions report. These are available to download from the website, and there are summary reports that provide plain-language explanations and graphs. Note that many of the variables in these sources are included in Vera’s Incarceration Trends dataset.
The Inter-University Consortium for Political and Social Research (a data repository hosted by the University of Michigan) holds datasets created by governments and by researchers that are clean and ready for public use.7 You can download these in various formats (after registering with the site and agreeing to its protocols).
Daily population using recent individual-level data from the jail The daily population describes the people being held in the jail on any given day: imagine visiting the jail and describing that population. A simple count of the daily population is called the census.
The daily population is made up of both people who are sentenced and people who are not sentenced but are detained for a variety of reasons. The most common reason is being held pretrial on pending charges. Other reasons for detention include violation of probation or parole (with or without new charges) and warrants or “holds” from other jurisdictions (including federal agencies such as the U.S. Marshals and Immigration and Customs Enforcement). County jails sometimes rent out jail beds to other counties, state corrections agencies, and federal agencies.
The daily population for a single day—sometimes referred to as a “snapshot”—may be more of a reflection of the particular day or time of year from which it is pulled than it is of the average population over the course of a year. If possible, you should report on the ADP for a full year to eliminate daily or seasonal biases.
The daily population typically can be broken out by demographics such as race, gender, and age range, or by the charges, severity of charges (e.g., felonies, misdemeanors, federal charges, or municipal charges or violations), or other reasons for which people are detained or sentenced.
Bookings using recent individual-level data from the jail An analysis of admissions looks at all jail bookings over a particular span of time, usually one year—for example, all bookings between January 1 and December 31. Analysis of bookings examines the flow of people into and out of the jail. This is called an admission cohort. Be aware that not all people booked in one year are released in the same year, and if you choose a recent admission cohort (such as people admitted in the past year), many of the people may not have been released at all. This limits your ability to get complete information because it is unknown when people currently in the jail will be released in the future.
We recommend working around this limitation by choosing to analyze a release cohort instead—for example, select all bookings where the release date is between January 1 and

Vera Institute of Justice 13
December 31 of a particular year. (Through this approach, you examine only records where both the admission and release dates are known.) Similar to how an admission cohort may have bookings that are released sometime in the future, a release cohort might include bookings from an earlier year. Both, however, are good representations of the admissions into the jail over the course of a year. The advantage of a release cohort is that, by definition, all bookings have been completed, so you can see complete information on overall LOS and release reasons.
Measures and Key Terms in Jail Data Analysis
Jail analyses include both continuous and categorical measures and present data in terms of either rates or counts. Continuous measures: Data that can be expressed as a number—by counting or summing, or by looking at means and medians, or rates or proportions. In a jail analysis, some typical categories of data that use continuous measures are average ADP, bookings, LOS, and bail amounts. Some examples of these measures include
people in the daily population, or bookings over the course of a year (counts); fines or fees collected from the community (sums); bail amount set for a particular charge (averages); percentage of people in the daily population being held pretrial (proportions).
Categorical measures: Usually “categorical” means that the value of the data must be one of a known set of categories—such as race, gender, charge, legal status, release reason, or distributions. You can match categorical measures with continuous measures to create more detailed analyses, and then combine categorical measures—such as race and gender, or charge and release reason—to build even more granular analyses. Rates and counts: Incarceration rates per 100,000 residents are used to account for differences in jurisdiction size or for changes over time. However, if a population has grown (or declined) substantially, you should also look at the total count. For example, the jail population in Texas increased 6 percent from 2000–2015, but the number of state residents increased 32 percent. Based on these numbers, the jail incarceration rate has decreased, but the total number of people in jail is still growing. Try to look at both rates and counts to get a complete picture of what is happening in your county. Note on calculating and interpreting racial disparities. Racial disparities are quantified by comparing rates (see below). They can be calculated for bookings or for the average daily population. The calculation is a two-step process and requires the racial population breakdown in the community, which is available from the U.S. Census.

Vera Institute of Justice 14
1. First, calculate the admission rate per capita (usually expressed per 100,000 or 1,000 people) of each race category you are examining. A common way of expressing a rate in the justice system is to compare the number of people booked or incarcerated to the community population. To do this, you will need to learn the population of each race category you are looking at for your community. (It’s important to define your community: If it is the county served by the jail, then you will want to learn the county population of each race category. If your jail covers multiple counties, you will want to combine the county population numbers for the relevant counties.). We typically limit the community population to only people between the ages of 18 and 64 because people older or younger are rarely involved in the justice system.8 With this information, then, the formula for the rate of admissions for Black people, for example, would be
Black admission rate = (# of Black admissions for one year / Black community population ages 18 to 64) * 100,000
2. Calculate the disparity between the race categories you are comparing using the
admission rates. For example, the Black-white disparity would be Black-white disparity = (Black admission rate) / (white admission rate)
Many jail systems have limited or nonexistent data specifying who is Latinx or Hispanic. This means that Latinx people might be classified as white, Black, or other, which inflates the numbers (and disparity calculations) for one or more of those groups. If the community has a Latinx population and this category does not show up in jail data, it’s important to note this and to push for better documentation and analysis of Latinx people’s experiences.9 Finally, the concept of racial disparities is important but limited. Documenting disparities in the way we describe above demonstrates which groups, in a given community, are more severely affected by the harms of jail compared to others and how these disparities change over time. But be aware that if the proportion of people in jail per demographic group matches the proportion in the general community—i.e., that these numbers appear to show that there are reduced or no disparities—this does not mean that certain demographic groups are not overrepresented in the jail or that improvements have been made. For example, in some counties heavily affected by the opioid crisis, the jail incarceration rate of white people increased. This led to reduced disparities because white people had previously been underrepresented in jail. But the overall consequence was more people in jail, facing harsher lengths of stay—this is not progress.
Jail is still harmful and mostly ineffective, even when racial (or gender) disparities are reduced. Calculating racial disparities should be a tool to push conversations about and solutions for ways that individuals and systems/institutions discriminate, historically and

Vera Institute of Justice 15
currently. Disparity rates can be useful benchmarks for certain change efforts, but real change requires going beyond disparities and reducing the use of jail for everyone, especially the groups most harmed.
Sample Analyses
Overview: Jail Population and Length of Stay As a start to your analysis, you want to establish some “top-line” numbers, not yet broken out into subsets of the population (e.g., race, gender, age, charge). Recall that the population of the jail is determined by how many people are booked and how long they stay. The top-line numbers you should start with are the average daily population, the total number of admissions over the course of one year, and some measures of LOS. LOS can be measured simply by calculating the average or median for all admissions, but because there is so much variation in LOS, it is better to get a sense of the number of people staying for different ranges of days (e.g., 0–3, 4–7, 8–30, 30–60, etc.). This will give you the distribution of LOS over all admissions, often shown in a histogram (example below).
Using these top-line numbers and other measures, you can start to answer some of the questions listed below, which will help you get an overall understanding of your jail.
Trends
How have the jail population and jail incarceration rates—overall and for people held pretrial—changed over time? Have the growth rates been different for women or for people of color? See Vera’s Incarceration Trends tool.

Vera Institute of Justice 16
Example: Jail Growth Trends in X County, 1970–2010
Source: Vera Institute, Report to Whatcom County Stakeholders on Jail Reduction Strategies, November 2017, page 6 (Figure 1).
Bookings, based on a release cohort
What is the overall distribution of LOS for all admissions? This usually reveals that most admissions are for shorter stays.
Example: Length of Stay in X County
Source: Vera Institute, Report to Whatcom County Stakeholders on Jail Reduction Strategies, November 2017, page 22 (Figure 16).

Vera Institute of Justice 17
Example: Length of Stay for Admissions Cohort
Source: Vera Institute, Greater Oklahoma City Chamber Task Force Report and Recommendations, December 2016, page 21 (Figure 9)
ADP or single-day snapshot
How long have people been detained as of the snapshot date (the daily population for a single day)? How does this vary by severity or charge? In the snapshot population, you only see the amount of time people have been detained so far because they haven’t yet reached the end of their detention. You should expect to see the distribution more skewed toward longer LOS than you would see if you were looking at all admissions for the year.

Vera Institute of Justice 18
Example: Length of Stay for the Average Jail Population
Source: Vera Institute, Report to Tulsa County Stakeholders on Jail Reduction Strategies, August 2017, page 17 (Figure 9).
Legal Status ADP or single-day snapshot
What proportions of the population are sentenced people, people held pretrial, or
other categories such as holds (such as for federal agencies), warrants, and probation and parole violations?
Example: Average Daily Population, by Legal Status
Source: Vera Institute, Wayne County Jail: Report and Recommendations, May 2020, page 13 (Figure 1).

Vera Institute of Justice 19
Race Trends
How do incarceration rates for Black, Latinx, or Native American people compare
to those for white people in a given time period? Do, for example, Black people have higher incarceration rates than white people? Have incarceration rates for Black people increased faster than for white people? See example below and also Vera’s Incarceration Trends tool.
Example: Rate of Incarceration, by Race
Source: Vera Institute, Divided Justice: Trends in Black and White Jail Incarceration, 1990–2013, 2018, page 22 (Figure 7).
Bookings, based on a release cohort
Are the demographic breakdowns of jail bookings proportional to the population sizes in your community?10
Who is most affected by jail admissions? What are the racial disparities in admissions compared to the racial makeup of the community covered by the jail?11
ADP or single-day snapshot
What is the racial breakdown of the jail population, and how does that compare to the community?12
Vera Institute of Justice 20
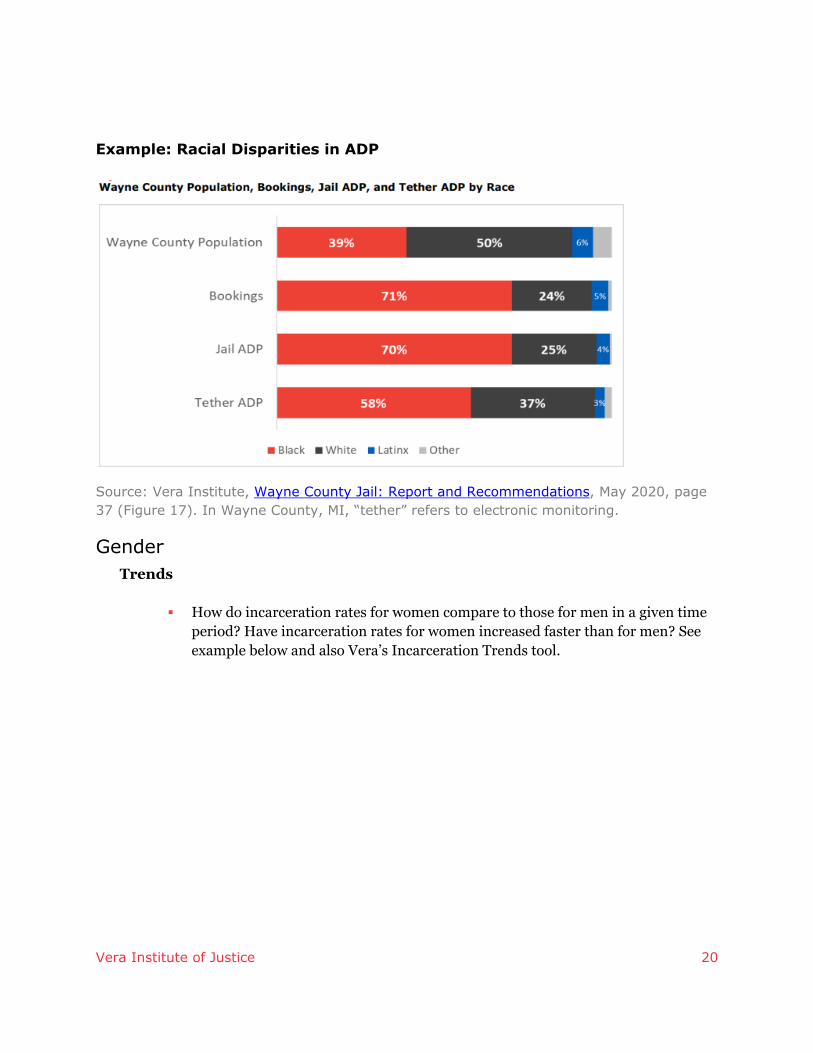
Example: Racial Disparities in ADP
Source: Vera Institute, Wayne County Jail: Report and Recommendations, May 2020, page 37 (Figure 17). In Wayne County, MI, “tether” refers to electronic monitoring.
Gender Trends
How do incarceration rates for women compare to those for men in a given time
period? Have incarceration rates for women increased faster than for men? See example below and also Vera’s Incarceration Trends tool.

Vera Institute of Justice 21
Example: Jail Population by Gender
Source: Vera Institute analysis of Buncombe County jail population, based on Incarceration Trends data.
Bookings, based on a release cohort
How many women have contact with the jail (total number of bookings in the cohort)? (This is an indication of the reach of the jail into the community.)
What charges are bringing women into jail, and how do they differ from charges for men?
Are there differences in charges bringing women into contact with the jail based on race or ethnicity?
ADP or single-day snapshot
What proportions of the jail population are made up of men and women, in both
the pretrial and sentenced populations? How do these compare with national and peer county figures? See Vera’s Incarceration Trends tool.
Charges and charge severity Charges are often represented in the data by the statutes that define them. If the statutes aren’t available, you may have to work with text descriptions of the charges. Text descriptions are fine if they are standardized at the point of data entry, but if not, you may be faced with the challenge of working with text descriptions with different spellings, abbreviations, typos, etc., that make it

Vera Institute of Justice 22
difficult to group similar charges. Further, jail records often do not update charge information to reflect dropped or adjusted charges as the case unfolds.
It is worth asking people working on criminal justice reform in your state—including Vera—about existing lists or databases already developed to standardize some of the terms and statute codes for your state. Some states, such as Georgia and California, have generated official lists that match charge descriptions to the relevant statute and provide some ranking by severity. For New York State, charge description tables are public; Vera has also developed a coding schema to rank charges by severity, specific to the New York statutes.13 The Criminal Justice Administrative Records System at the University of Michigan also publishes guidance on standardizing charge descriptions and rankings.
Charges can also be categorized by their “severity” (e.g., felonies, misdemeanors, federal charges, or municipal charges or violations; see “Top Charge” in the Glossary). Your data might provide further breakdowns by severity and class, e.g., A or B felonies, or by arresting charge (such as probation violation) versus original charge. We encourage you to continue your analysis beyond summary categories, such as severity, and look at specific charges so they can be grouped into categories such as “drug,” “property crime,” “failure to appear,” and “parole/probation violation,” which often span both felony and misdemeanor charges and various felony classes (see example below). There may be other specific charges that have political resonance in your area that you want to highlight and analyze. It can be valuable to see, for example, that lower level charges such as failure to appear and trespassing are highly represented in admissions, and higher level charges such as robbery and assault are common in the daily population. This level of detail will resonate with system actors such as prosecutors, public defenders, and judges.
Example: Average Daily Pretrial Population, by Charge Severity Category
Source: Vera Institute, Report to Whatcom County Stakeholders on Jail Reduction Strategies, November 2017, page 18 (Figure 10).

Vera Institute of Justice 23
Charges and charge severity can be matched with measures such as admissions, ADP, and average bail or LOS (see example below). They can be paired with many other categorical measures such as race, gender, and release reasons for more refined analyses. Broadly, the questions to answer here relate to the common types of charges and LOS by type of charge. You can also push the analysis to question whether there is potential to avoid booking people into jail at all for those with less serious types of charges or levels of severity of charge. In other words, if minor charges show up as a category of admissions, this can be a place to start pushing for alternative responses.
Example: Most Frequent Misdemeanor Charges at Admission
Source: Vera Institute, Report to Whatcom County Stakeholders on Jail Reduction Strategies, November 2017, page 19 (Figure 12).

Vera Institute of Justice 24
Example: Admissions vs. ADP
Source: Vera Institute, Report to Whatcom County Stakeholders on Jail Reduction Strategies, November 2017, page 21 (Figure 15).
Bail and pretrial release We have encountered many variations in the bail data that are available in different jail management systems. Some include bail assessed, and others include bail paid. Some have bail amounts for each charge associated with a booking, some for each case associated with a booking, and some only the overall sum for a booking. These different levels of tracking and reporting determine how much detail you can get from a bail analysis (see example below).

Vera Institute of Justice 25
Example: Bail Amounts and Release Outcomes
Source: Vera Institute, Report to Whatcom County Stakeholders on Jail Reduction Strategies, November 2017, page 24 (Figure 20).
To better understand pretrial release and how bail is used in your community, use your data analysis to start to answer some of the questions below.
Bookings
Is bail cumulative when there are multiple charges, or is it based on the top
charge? If the former, how do bookings with multiple charges compare to those with single charges in terms of bail amounts and in bond releases?
If the data allow, can you determine who was able to pay bail and who was held in jail because of unpaid bail? Can you tell if bail amounts have been changed after a court hearing?
ADP or single-day snapshot
What are the bail amounts among people in jail on a given day by charge severity and by charge? The goal is to understand the degree to which release depends on a detained person’s financial capacity.
What are the bail amounts for people held pretrial (particularly those with no other holds)?

Vera Institute of Justice 26
Appendix 1: Sample Jail Data Request
The analyst requires individual-level data extracted from the facility’s Jail Management System (JMS). Individual-level data is critical because it allows the analyst to compute statistics for any field, or combination of fields, captured by the JMS (e.g., length of stay for all detained people, length of stay for people held pretrial, length of stay for women held pretrial).
Datasets The analyst requires two datasets to be extracted from the Jail Management System:
1. Census: Daily census data for the key dates [e.g., 09/30/2016, 09/30/2017,
09/30/2018], with one row of data per individual in jail on each census date. 2. Bookings: Jail admissions data for the date range [10/01/2016 to 09/30/2018],
with one row of data per jail admission.
Data fields The analyst will require the following data fields, for each record, to the extent available, for both datasets:
1. De-identified Individual ID number 2. Race 3. Ethnicity (if Hispanic/Latinx is tracked separately from race) 4. Sex 5. Date of Birth 6. Mental Health Flag 7. Admission Date 8. Arresting Agency 9. Status (e.g., pretrial, sentenced) 10. Sentence Date 11. Release or Discharge Date (n/a if still in custody) 12. Release Reason (bail paid, charges dismissed, sentence complete, etc.) 13. Holds for Other Jurisdictions (including federal) 14. Booking ID 15. Statute (i.e., penal code) 16. Charge Description (e.g., drug, burglary, assault, traffic) 17. Charge Category (e.g., felony, misdemeanor) 18. Court (court of jurisdiction) 19. Disposition of Charge 20. Disposition Date 21. Bond Amount Assessed

Vera Institute of Justice 27
22. Bond Amount Paid 23. Warrant, if applicable 24. Flag for Top Charge

Vera Institute of Justice 28
Appendix 2: Sample Freedom of Information Request
NOTE: This sample refers to Freedom of Information Law details in New York State. Freedom of information laws vary by state and for federal agencies. Make sure to look for the information request processes that apply to your state or area. Here is one resource for finding more information across different jurisdictions. This sample includes four parts: Online Request, Mail/Email Request, Sample Follow-up, Sample Appeals Letter.
1. Sample Online Form FOIL Request: This is a request under Article 6 of the New York Freedom of Information Law for documents or data sufficient to show the following information related to all bookings to and releases from the [COUNTY] County jail system from 1/1/2015 to 12/31/2020: each individual’s ID number, Booking ID, Date of admission, Date of release, Admission status (e.g., sentenced, unsentenced, parole, probation, etc.), Discharge status (e.g., bail paid, end of sentence, time served, transferred to DOCCS, etc.), Individual information (DOB or age, gender, race, ethnicity, city/town of residence at time of booking, including if homeless or unknown), Charge codes, Charge description (all charges), Warrant or hold information (bench warrant, probation, parole, and if held for another local or federal agency), Remand (if person was remanded without bail), Bail information (type/amount), Bail posting (type/amount), Arresting agency, Arraignment court, Sentence (if applicable), and Case disposition.
If you determine that any portion of the requested records are not available, please inform me of which materials are not available, and furnish only those portions of the records that you determine to be available. If you determine that any portion of the requested records are exempt from disclosure pursuant to FOIL, please delete only the material claimed as exempt, indicate the basis for the exemption claim, and furnish only those portions of the records that you determine not to be exempt.
Please send me the records as an electronic Excel spreadsheet, or if that is not possible, in the electronic format in which you keep the records. If the records are only in paper format, please scan them into PDFs (text-searchable if possible). Please email me the records, or if that is not possible, mail them to me on a disk drive. If you are unable to send the records in one of the formats I requested, please contact me to discuss alternatives.
If for any reason any portion of my request is denied, please inform me of the reasons for the denial in writing and provide the name and address of the person or body to whom an appeal should be directed.

Vera Institute of Justice 29
2. Sample Email/Mail FOIL Request: [Date] Dear FOIL Officer, This is a request under Article 6 of the New York Freedom of Information Law for documents or data sufficient to show the following information related to all bookings and releases from your county's jail system from 1/1/2015 to 12/31/2020:
1. Individual ID number 2. Booking ID number 3. Date of admission 4. Date of release 5. Admission status (e.g., sentenced, unsentenced, parole, probation, etc.) 6. Discharge status (e.g., bail paid, end of sentence, time served, transferred to DOCCS, etc.) 7. Individual information
a. DOB and/or age b. Gender c. Race d. Ethnicity e. City/town of residence at time of booking, including if homeless or unknown
8. Charge codes (e.g., PL 120.00) and charge description (e.g., assault in the third degree) for all charges on which an individual was admitted
9. Warrant or hold information (bench warrant, probation, parole, and if held for another local or federal agency)
10. Remand flag (if person was remanded without bail) 11. Bail set type (e.g., cash, insurance bond, credit, partially secured, unsecured) and amount 12. Bail posted type and amount 13. Arresting agency 14. Arraignment court 15. Sentence (if applicable) 16. Case disposition (e.g., case dismissed, pled guilty, acquitted, diverted)
If you determine that any portion of the requested records are not available, please inform me of which materials are not available, and furnish only those portions of the records that you determine to be available. If you determine that any portion of the requested records are exempt from disclosure pursuant to FOIL, please delete only the material claimed as exempt, indicate the basis for the exemption claim, and furnish only those portions of the records that you determine not to be exempt.
Please send me the records as an electronic Excel spreadsheet, or if that is not possible, in the electronic format in which you keep the records. If the records are only in paper format, please scan them into PDFs (text-searchable if possible). Please email me the records, or if that is not possible, mail them to me on a disk drive. If you are unable to send the records in one of the formats I requested, please contact me to discuss alternatives.
If for any reason any portion of my request is denied, please inform me of the reasons for the denial in writing and provide the name and address of the person or body to whom an appeal should be directed. Sincerely,

Vera Institute of Justice 30
[signature] 3. Sample Follow-up:
Dear FOIL Officer, Hope you are doing well during this challenging time.
I am reaching out to provide a little more information about our recent FOIL request. We are in the process of submitting FOIL requests to almost all the sheriff’s offices in New York State. We are currently working on a research project focusing on understanding the change in the New York State jail population over time. As you may know, there is no publicly available individual-level data that allows us to explore historic trends in admissions and releases for different demographic groups, charge types, and custody statuses. We are looking forward to analyzing the data that we receive from your office for research purposes. If you would like to know more about our study, please feel to reach out and we will provide you with additional information. We are also happy to share our research findings with you after the completion of our study if that is of your interest. Thank you so much, [signature]
4. Sample Appeal Letter:
[DATE] Dear FOIL Officer, I hereby appeal [ISSUE related to prior request, such as non-response or denial] for my recent FOIL request, which was received by the County Executive’s office on [DATE].
Forty-nine other counties in New York have fulfilled our request at no cost, including counties with comparable or larger jail populations than [XX] County, e.g., counties [A, B, C, and D]. Furthermore, [XX] County did not provide any updates on the status of my request until September 28, 52 business days after it was submitted. This far exceeds the 20-day window in which agencies are required to respond.
As stipulated by the Freedom of Information Law, the head or governing body of an agency, or whomever is designated to determine appeals, is required to respond within 10 business days of the receipt of an appeal. If the records are denied on appeal, please explain the reasons for the denial fully in writing as required by law.
In addition, please be advised that the Freedom of Information Law directs agencies to send all appeals and the determinations that follow to the Committee on Open Government, Department of State, One Commerce Plaza, 99 Washington Ave., Albany, New York 12231. Sincerely, [signature] [Name/organization] [city, state, zip

Vera Institute of Justice 31
Appendix 3: County Jail Data Reports for Certain States
The following states publish regular county jail population reports.
California https://public.tableau.com/app/profile/kstevens/viz/ACJROctober2013/About
Colorado https://cdpsdocs.state.co.us/ors/Data/Data_Instruments/HB1297/Dashboard/HB19-1297v3.html
Florida
http://www.dc.state.fl.us/pub/jails/index.html
Georgia https://www.dca.ga.gov/local-government-assistance/research-surveys/monthly-jail-reports
Kentucky https://corrections.ky.gov/About/researchandstats/Pages/WeeklyJail.aspx
Massachusetts
https://www.mass.gov/report/research-reports (Weekly Inmate Count)
New York https://www.criminaljustice.ny.gov/crimnet/ojsa/stats.htm (Tab for Jail Population)
Pennsylvania https://www.cor.pa.gov/Facilities/CountyPrisons/Pages/Inspection-Schedule,-Statistics-And-General-Info.aspx
Tennessee https://www.tn.gov/correction/statistics-and-information/jail-summary-reports.html
Texas https://www.tcjs.state.tx.us/wp-content/uploads/2021/09/AbbreRptCurrent.pdf
West Virginia https://dhhr.wv.gov/COVID-19/Pages/Correctional-Facilities.aspx (COVID-19 page; jail populations listed under vaccination reports)

Vera Institute of Justice 32
Appendix 4: Glossary of Terms in this Guide and the “Toolkit for Jail Decarceration in Your Community”
Admission Cohort The people admitted into a jail during a specified time
period (such as one month or one year). See Measures section on page 13 for use in analysis.
Average Daily Population A common measure of jail population, calculated as the average of the daily population count over a given period (such as one year).
Bail Technically, the term “bail” refers to a process of pretrial release that may include conditions—both financial and nonfinancial—designed to address perceived risks of either pretrial failure to appear or to public safety. Historically, “granting bail” led to a person’s pretrial release, while “no bail” resulted in pretrial detention. It is only in recent decades that colloquially the term “bail” has become synonymous with the deposit of cash or money as a condition of release. The term “money bail” refers to a sum of money that must be paid up front to secure a person’s release from jail while awaiting trial.14
Bench Warrant A written order issued by a judge authorizing the arrest of a
person charged with contempt of court or a criminal offense.
Bond Describes an agreement between a person
and the court, or between the person, a surety (commercial or noncommercial), and the court that sets out what the person must do to secure their release.15
Booking Formal admission to jail, documented in jail records. Citation An order issued by the police to appear in court at a future
date to respond to an accusation (also sometimes called an appearance ticket).
Cleaning Data Refers to the process of understanding and handling any
anomalies or gaps in the dataset in order to prepare it for coding and analysis.
Continuance The suspension or postponement of a trial or court
proceeding.16

Vera Institute of Justice 33
Decarceration Refers to the policies and movements associated with reducing rates of incarceration and changing norms around safety and justice.17
Declination to Prosecute A prosecutor’s discretion to decline to prosecute a single
case or broader category of cases at any time, for any reason.
Disparities In the jail population context, the composition of the jail
compared to the community. Usually, disparities refer to differences in the proportion of a certain race/ethnicity or gender group in the jail compared to in the community.
Diversion Programs that offer a wide range of alternatives to
traditional prosecution and incarceration. They can be run by the courts, law enforcement, community-based organizations, or the prosecutor’s office. When someone who is accused of a crime is referred to diversion, this typically means that they agree to participate in programming focused on substance use, restorative justice, mental health, or other social services in lieu of prosecution.
Graduated Sanctions Refers to incremental consequences for not complying with
probation conditions—such as increased frequency of visits or programs—that are applied prior to invoking the consequence of returning a person to detention.
Hold Refers to a person detained in a local county jail under the
jurisdiction of another agency, such as another county, state corrections, or a federal agency.
Jail Bed-Days Number of days in jail multiplied by the number of people
per day. Jail Bed Rental In jail bed rental agreements, a county makes an
agreement with another government agency—another county, state corrections agencies, or federal agencies such as Immigration and Customs Enforcement or the U.S. Marshals—to provide a jail bed in exchange for a per diem payment to the county.
Length of Stay The number of days a person is detained in jail, from
admission to release. Usually measured in days but can be hours.
Vera Institute of Justice 34
Mass Incarceration Refers to the broad reach of correctional control, including through court supervision, probation, electronic monitoring, jails, prisons, and parole.
Parole Violation Violation of or noncompliance with the conditions of
release on parole. Parole is a form of community supervision that is typically ordered at the discretion of the state department of corrections and is served at the end of or following a state prison sentence.
Probation Violation Violation of or non-compliance with the conditions of
probation. Probation is a form of community supervision ordered by the courts and is typically served in lieu of part of a sentence of incarceration.
Release Cohort The people released from a jail during a specified time
(such as one month or one year). See Measures section on page 13 for use in analysis.
Top Charge The most serious charge listed in a single booking that
contains multiple charges. For example, a felony charge is more serious than a misdemeanor charge. Within felony charges, there are levels of severity.
Endnotes
1 By convention, we count the last day in jail, but not the first, i.e., the LOS counts the
number of overnights in jail. So, if a person is admitted and released on the same day, then
they spent 0 days in jail (although we still count them in bookings), and if they are released
the day after they’re booked, they spent one day in jail, etc. This allows for the fact that
both the first and last days are usually partial days. By the same convention, we do not
include people in the daily population on the day they arrive. In practice, many jails take
their own census at a standard time of day, e.g., 5 a.m.
2 See studies cited in Léon Digard and Elizabeth Swavola, “Justice Denied: The Harmful and
Lasting Effects of Pretrial Detention,” Vera Evidence Brief, Vera Institute of Justice 2019,
https://www.vera.org/downloads/publications/Justice-Denied-Evidence-Brief.pdf.
3 Continuance refers to a postponement in court proceedings, at the judge’s discretion.
While reducing or capping continuances may sometimes be a way to reduce length of stay
in jail through forcing speedier trials, reducing continuances without good cause can
undermine due process. For example, defense attorneys sometimes need more time to

Vera Institute of Justice 35
prepare their case, and imposing time limits can also add pressure on people to accept plea
deals. Given this, policies on continuances should be thoughtful about the rationale.
4 You can organize and clean your data using software that best fits your needs and skillset.
Common programs used for this purpose include Excel, Python, R, Stata, or SPSS.
5 For a more detailed discussion, see Sarah Eppler-Epstein, Annie Gurvis, and Ryan King,
“The Alarming Lack of Data on Latinos in the Criminal Justice System,” Urban Institute,
December 2016, http://urbn.is/cjdata.
6 See the section on “Measures and Key Terms” for definitions of rates versus counts.
7 Be aware that common datasets here, such as the UCR report on crime data, rely on
individual police department data, which reflect arrests, not actual crime, and contain some
inaccuracies.
8 Vera’s Incarceration Trends uses the population between 15 and 64 years of age. In many
jurisdictions, 15- to 17-year-olds are eligible to be processed in adult systems.
9 For more discussion on this, see Eppler-Epstein et al., “The Alarming Lack of Data on
Latinos,” 2016, http://urbn.is/cjdata.
10 Disproportionalities between the jail and community populations provide evidence that
some groups are overrepresented in the jail, but you should use caution in interpreting
them. For example, if the community is 60% white, 30% Black, and 10% Latinx, and the
jail is 30% white, 60% Black, and 10% Latinx, one might conclude that the proportion of
Latinx people in the jail is “just right” when in fact they are jailed at twice the rate of white
people. See the note on racial disparities.
11 See page 13 for note on calculating and interpreting racial disparities.
12 See page 13 for note on calculating and interpreting racial disparities.
13 For more information on Vera’s approach to coding charges by severity in New York,
please contact Jaeok Kim, [email protected].
14 Timothy Schnacke, Money as a Criminal Justice Stakeholder (Washington, DC: U.S.
Department of Justice, National Institute of Corrections, 2014).

Vera Institute of Justice 36
15 Timothy Schnacke, Fundamentals of Bail: A Resource Guide for Pretrial Practitioners and
a Framework for American Pretrial Reform (Washington, DC: U.S. Department of Justice,
National Institute of Corrections, 2014).
16 Legal Information Institute, Cornell Law School,
https://www.law.cornell.edu/wex/continuance.
17 Judah Schept, “Decarceration,” in The Routledge Companion to Criminological Theory
and Concepts, edited by Avi Brisman, Eamonn Carrabine, and Nigel South (New York:
Taylor & Francis, 2017), 439-442.
Credits
© Vera Institute of Justice 2021. All rights reserved.
An electronic version of this report is posted on Vera’s website at
vera.org/publications/a-technical-guide-to-jail-data-analysis.
The Vera Institute of Justice is powered by hundreds of advocates, researchers, and
activists working to transform the criminal legal and immigration systems until they’re fair
for all. Founded in 1961 to advocate for alternatives to money bail in New York City, Vera is
now a national organization that partners with impacted communities and government
leaders for change. We develop just, antiracist solutions so that money doesn’t determine
freedom; fewer people are in jails, prisons, and immigration detention; and everyone is
treated with dignity. Vera’s headquarters is in Brooklyn, New York, with offices in
Washington, DC, New Orleans, and Los Angeles. For more information about Vera, visit
vera.org.
For more information about this report, contact Jennifer Peirce, research associate, at