a teacher’s pack - royal society of chemistrymedia.rsc.org/nonrsc/greenchemistryteacherspack.pdfa...
TRANSCRIPT

A TeacherA Teacher’’s Pack providing s Pack providing
background knowledge for background knowledge for
teachers, lesson plans and teachers, lesson plans and
resources for use in classresources for use in class
Lisette
Voûte

L. H. Voûte GCE Green Chemistry Teacher’s Pack
Introduction
The purpose of this Teachers Pack is to provide teachers with a full resource on Green
Chemistry, covering all the specifications’ requirements for A-Level chemistry. Green
Chemistry is a new and/or enlarged topic in all the new specifications for teaching in
September 2008, following the new QCA GCE Chemistry Criteria. I reasoned that
many teachers themselves may not have had the opportunity to study environmental
chemistry as it is a relatively modern and current topic; and even if it was studied at
university, there may be some gaps in their knowledge, such as recycling and how it is
done; or they may not be up to date on the chemistry and issues as they stand today.
This resource would therefore allow them to fully understand the subject so they can
be very comfortable teaching it by knowing the background material, beyond what it
expressly required from the specifications. This would allow them, for example, to be
able to explain or answer pupils’ Green Chemistry-based questions on issues beyond
the syllabus. Furthermore, this pack would provide teachers with lesson plans and
resources, which would be useful when teaching a new and relatively unfamiliar
topic.
This resource therefore comes in two main sections: Firstly, a text-book allowing
teachers to become up-to-date on Green Chemistry today. This is based on the
required knowledge in all the A-Level Chemistry specifications (i.e. AQA, Edexcel
and OCR A and B), for both AS and A2, however in much more detail than the pupils
are required to know, in order to provide teachers with the confidence and background
knowledge required to teach these new topics well. The second main section is a
collection of lesson plans and resources on Green Chemistry-based topics. These
lesson plans can be used as just that, a plan for an entire lesson; or ideas and activities
can be used from them and attached to your other lessons where the chemistry might
link together with Green Chemistry. The plans also suggest resources to use, such as
animations, video clips, worksheets, links and PowerPoint presentations; all of which
I have attached to this resource.
The topics I have covered are, Atmospheric Chemistry, including the Ozone Hole; Air
Pollution, including smog, catalytic converters and acid rain; Global Warming,
including the notions of carbon neutral, carbon footprint, biofuels and examples of
- I -
L. H. Voûte GCE Green Chemistry Teacher’s Pack
them; and Recycling, including recycling, amongst other methods of disposal of
aluminium, iron, steel and polymers and issues associated with their disposal.
I hope you find this pack useful and practical; and that your pupils’ enjoyment and
understanding of Green Chemistry is increased.
February 2008
- II -
L. H. Voûte GCE Green Chemistry Teacher’s Pack
What is Green Chemistry?
Green Chemistry is based on and ties together a variety of strings of chemistry:
Organic, Inorganic, Physical, Environmental, Biochemistry and Analytical Chemistry.
Green Chemistry and Environmental Chemistry, while often confused are two
separate fields. Green Chemistry encourages environmentally conscious behaviour,
such as reducing and preventing pollution and the destruction of the planet. On the
other hand, Environmental Chemistry is simply the study of chemistry occurring in
the environment.i
The following page lists the Twelve Principles of Green Chemistry, reproduced from
the Royal Society of Chemistry.
i Green Chemistry, Wikipedia, site accessed March 2008 http://en.wikipedia.org/wiki/Green_chemistry
- III -

The twelve principles of green chemistry • It is better to prevent waste than to treat or clean up waste after it is formed.
• Synthetic methods should be designed to maximize the incorporation of all materials used in the process into the final product.
• Wherever practicable, synthetic methodologies should be designed to use and generate substances that possess little or no toxicity to human health and the environment.
• Chemical products should be designed to preserve efficacy of function while reducing toxicity.
• The use of auxiliary substances (solvents, separation agents, etc.) should be made unnecessary whenever possible and innocuous when used.
• Energy requirements should be recognized for their environmental and economic impacts and should be minimized. Synthetic methods should be conducted at ambient temperature and pressure.
• A raw material or feedstock should be renewable rather than depleting whenever technically and economically practicable.
• Unnecessary derivatization (blocking group, protection / deprotection, temporary modification of physical / chemical processes) should be avoided whenever possible.
• Catalytic reagents (as selective as possible) are superior to stoichiometric reagents.
• Chemical products should be designed so that at the end of their function they do not persist in the environment, and break down into innocuous degradation products.
• Analytical methodologies need to be further developed to allow for real-time, in-process monitoring and control prior to the formation of hazardous substances.
• Substances and the form of a substance used in a chemical process should be chosen so as to minimize the potential for chemical accidents, including releases, explosions, and fires.
These principles have been reprinted with permission from Paul T. Anstas and John C. Warner Green Chemistry: Theory and Practice, New York: Oxford University Press, 1998

L. H. Voûte GCE Green Chemistry Teacher’s Pack
Table of Contents
1. Atmospheric Chemistry 1
1.1 Planetary Atmospheres 1
1.2 The Earth’s Atmosphere 2
1.3 Explanation for the Temperature Structure of the Atmosphere 3
1.4 Natural Catalytic Cycles: Problem with the Chapman mechanism 6
1.5 The Ozone Hole 8
1.5.1 Ozone Depletion 8
1.5.2 Why the Depletion is Dangerous 10
1.5.3 Explanation for the depletion 11
1.5.3.1 Polar Stratospheric Clouds 11
1.5.3.2 CFCs converting to Active Forms of Chlorine and Bromine 13
1.5.3.3 The Return of Sunlight: Ozone Destruction 13
1.5.3.4 Summary of Ozone Destruction 14
1.5.4 Current and Future Ozone Levels 15
1.5.5 CFC Substitutes 15
2. Air Pollution 19
2.1 Emitted Pollutants 20
2.2 Removal Processes of Compounds 21
2.3 Smog Formation 22
2.4 UK Emissions Today 25
2.5 Catalytic Converters 26
2.6 Acid Rain 27
3. Global Warming 30
3.1 Greenhouse Effect 30
3.2 Climate Change 30
3.3 Global Warming 31
3.3.1 Greenhouse Gases and How They Work 31
3.3.2 Evidence for Global Warming 31
3.3.3 Global Warming Potential 35
3.3.4 Carbon Neutral, Biofuels and Carbon Footprint 35
3.3.5 Controlling Global Warming and the Kyoto Protocol 37
- IV -
L. H. Voûte GCE Green Chemistry Teacher’s Pack
- V -
4. Recycling 40
4.1 Why Recycle 40
4.1.1 Household Waste 42
4.1.2 Aluminium and Steel 43
4.1.3 Plastics and Polymers 48
5. Lesson Plans and Resources 55
Lesson Plan: AS Module 1 – Combustion of Alkanes: Air Pollution 56
Lesson Plan: AS Module 2 – Extraction of Metals, Acid Rain and Recycling 58
Lesson Plan: AS Module 2 – Ozone Destruction 59
Lesson Plan: AS Module 2 – Global Warming 60
Lesson Plan: A2 Module 4 – Disposal and Recycling of Polymers 61
Additional Green Chemistry Resources 62
References 63

L. H. Voûte GCE Green Chemistry Teacher’s Pack
1. Atmospheric Chemistry

L. H. Voûte GCE Green Chemistry Teacher’s Pack
1. Atmospheric Chemistry
1.1. Planetary Atmospheres
The Earth’s atmosphere is the only planet within the solar system which contains such
a large percentage of oxygen; it is an oxidising atmosphere; as can be seen in the table
below.
Table 1: Major atmospheric constituents of the Sun and the Planets within the Solar System and their Surface Temperature1
Planet/Star Most Abundant Gas
2nd Most Abundant Gas
3rd Most Abundant Gas
Surface Temperature (K)
Sun H2 89% He 11% H2O 0.1% -- Venus CO2 96.5% N2 3.5% SO2 0.015% 732 Earth N2 78.1% O2 20.9% Ar 0.93% 288 Mars CO2 95.3% N2 2.7% Ar 1.6% 223 Jupiter H2 90% He 10% CH4 0.24% 170 Saturn H2 96% He 4% CH4 0.2% 130 Uranus H2 82% He 15% CH4 2.3% 59.4 Neptune H2 85% He 15% CH4 1-2% 59.3 Titan N2 82% Ar 12% CH4 3% 95
Table 2: Mass of the Sun and the planets within the Solar System2 Planet /Star
Sun Mercury Venus Earth Mars Jupiter Saturn Uranus Neptune
Mass (kg)
1.99 x1030
3.30x10²³ 4.87x1024
5.97x1024
6.42 x10²³
1.90 x1027
5.68 x1026
8.68 x1025
1.02 x1026
• Mercury has a relatively low mass (see Table 2 above) hence a smaller
gravitational force, and therefore has almost no atmosphere. Its thin
atmosphere is comprised of 98% He and 2% H2.1
• Venus has largely CO2, which causes a “runaway greenhouse effect” and
hence it’s high surface temperature.1
• Mars’ atmosphere also consists chiefly of CO2 but as it is of a lower mass than
Venus, its atmosphere is thinner as it has a weaker gravitational force. Thus,
there is not a very strong greenhouse effect.1
• The Outer Planets (Jupiter, Saturn, Uranus and Neptune) have a much lower
surface temperature due to their distance from the Sun. Their atmospheres are
predominately c. 90% H2 and c. 10% He, and are reducing in nature as they do
not contain oxygen. There are low levels of a range of hydrocarbons in the
atmospheres, most likely to be caused by the photochemistry of CH4.1
• Titan is a satellite of Saturn and the only satellite to posses a massive
atmosphere; which here is of N2 and some CH4. Titan’s atmosphere contains
- 1 -
L. H. Voûte GCE Green Chemistry Teacher’s Pack
photochemical smog: most likely to be due to the oxidation of hydrocarbons.
These aerosols cause the smog to appear as coloured clouds.1
1.2. The Earth’s Atmosphere
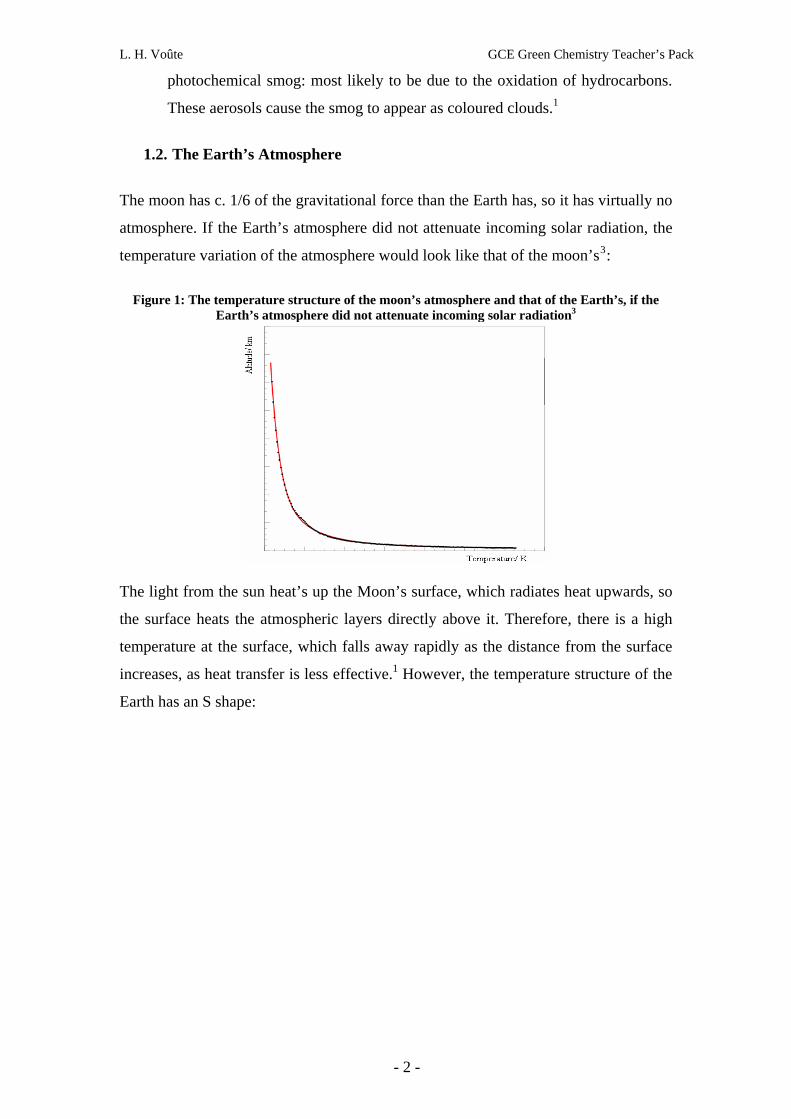
The moon has c. 1/6 of the gravitational force than the Earth has, so it has virtually no
atmosphere. If the Earth’s atmosphere did not attenuate incoming solar radiation, the
temperature variation of the atmosphere would look like that of the moon’s3:
Figure 1: The temperature structure of the moon’s atmosphere and that of the Earth’s, if the Earth’s atmosphere did not attenuate incoming solar radiation3
The light from the sun heat’s up the Moon’s surface, which radiates heat upwards, so
the surface heats the atmospheric layers directly above it. Therefore, there is a high
temperature at the surface, which falls away rapidly as the distance from the surface
increases, as heat transfer is less effective.1 However, the temperature structure of the
Earth has an S shape:
- 2 -

L. H. Voûte GCE Green Chemistry Teacher’s Pack
Figure 2: Temperature variation with altitude of Earth's atmosphere4
1.3. Explanation of the Temperature Structure of the Atmosphere
Troposphere – decrease in temperature
From the surface to the Tropopause, the temperature decreases, this is due to the same
reason for the temperature structure of the moon (the Sun heat’s the Earth’s surface,
which re-radiates heat back up, heating the layers above it, with decreasing intensity
as the altitude increases).
Stratosphere – increase in temperature
At 10-15 km the temperature begins to increase throughout the stratosphere.1 This can
be explained by the absorption of solar radiation:
- 3 -

L. H. Voûte GCE Green Chemistry Teacher’s Pack
Figure 3: The solar flux at various altitudes in the Earth's atmosphere5
As can be seen from Figure 3, the dangerous high energy radiation (wavelengths less
than 200 nm, i.e. the lower UVC region) is removed at the top of the atmosphere. This
is done through photochemistry with O2, O2+, N+, N2
+, O, O+, and NO+.1 The (also
harmful – and it is vital for life that it is removed) UVB region, between ~200-300
nm, begins to be absorbed at about 50km, and is removed by the time the solar
radiation impinges on the Earth’s surface1. This is due to O2 and especially O3
(ozone) being the species that absorb UVB radiation1, acting as a ‘UV filter’.
Therefore it is clear that ozone is vital to protect humans and the ecosystem from
harmful UVB radiation.
Ozone is generated via the Chapman Mechanism (discovered in the 1930s by Sidney
Chapman)3:
23
23
32
2
2OOO
ΔH- OOhνO
MOM OO
O OhνO
→+
+→+
+→++
+→+
•
•
•
••
Where M is a non-reactive body which can absorb excess energy
The most interesting step is the 3rd one. It is extremely exothermic (90 kJ mol-1)1 so
ozone is liberating a lot of heat in photolysis, causing the temperature to increase in
- 4 -

L. H. Voûte GCE Green Chemistry Teacher’s Pack
the stratosphere. Ozone’s generation reaches a maximum in the Stratosphere because
it is a balance between number of photons and the concentration of O2 molecules1:
• At higher altitudes: There is a high number of photons (fewer have been absorbed
by the atmosphere), but the atmosphere is thinner, so the pressure low, therefore
there is a low concentration of O2 molecules – too low to create high enough
levels of O3.
• At lower altitudes: Despite the fact there is a higher pressure, hence higher
concentration of O2, the number of photons is too low as the layers of atmosphere
above it have attenuated the incoming radiation – this slows the rate of the first
step in the Chapman mechanism.
In the stratosphere, there is warm air sitting on top of cold air, so it is hard for the cold
air to move through it: the air remains stuck in these distinct layers, which is termed
zonally symmetric1.
Mesosphere – decrease in temperature
Again, the air begins to cool here as the altitude increases, as the pressure decreases
and hence the concentration of M and O2 molecules decrease, so there is very little to
kick-start1 the Chapman cycle, and generation of ozone is extremely low.
Thermosphere – increase in temperature
This begins at about 90 km, at this point the atmosphere is so thin and collisions
between particles are extremely infrequent. This means that most of the particles don’t
get the chance to equilibrate once they have absorbed the high energy incoming solar
radiation, and therefore their translational temperatures become very high1.
- 5 -

L. H. Voûte GCE Green Chemistry Teacher’s Pack
1.4. Natural Catalytic Cycles: Problem with the Chapman mechanism
The Chapman mechanism predicted the right ozone generation mechanism but over-
predicted the production of O3 by a factor of about 5.1 This is because the last step in
the cycle:
is slow and there exist catalysts, X, which are species in parts of the atmosphere
which participate in the following cycle to speed up the destruction of ozone. This is
called natural catalytic cycles1:
23 O2OO →+ •
Species of X are: 3 223
2
23
OOOO:OXOXOOXOOX
+→++→++→+
Net
NO 30-40km e.g. NO
223
22
223
OOOO:ONOONOONOO
+→++→++→+
NetCl and Br maximum at 45km
HO above 45 km
H above 60 km
Sources of catalysts:
The catalysts are formed via the reactions outlined below. They involve a natural
source gas1 reacting with another molecule or undergoing photolysis (i.e. the
compound is broken down by sunlight – photons).
Despite the fact that these species catalyse the destruction of ozone, these reactions
don’t go on indefinitely, which would destroy the ozone layer. Fortunately,
termination reactions occur and this produces stable (inactive) reservoir
compounds1 from the active radicals. These reservoir compounds are often the source
gases themselves1.
• Source of NOX:
Firstly, ozone undergoes photolysis to form oxygen and an excited oxygen
radical1:
- 6 -

L. H. Voûte GCE Green Chemistry Teacher’s Pack
)Δ(OD)O(hνO g1
21
3 +→+
The source gas, N2O is produced by soil, which goes on to react with the oxygen
radical to form NO1:
MHNOMHONO
2NOOND)O(
32
21
+→++
→+n Step:Terminatio
• Source of Cl: 1
34
33
CHHClCHCl
ClCHhνClCH
+→+
+→+n Step:Terminatio
Fortunately, the amount of CH3Cl emitted into the atmosphere is very low.
However if this amount increases, it would present a problem as this is a very
efficient process (see Table 3).
• Source of HOX: 1
22222
222
341
21
OOHHOHOOOHHOHO
CHOHCHD)O(OHOHOHD)O(
+→++→+
+→+
+→+
n Step:Terminatio
Table 3: Rates of catalytic cycles X K220 / cm3 molecule-1 s-1 kb/ka
H 1.7 x10⁻¹¹ 25000
HO 2.2 x10⁻¹⁴ 32
NO 3.5 x10⁻¹⁵ 5
Cl 8.7 x10⁻¹² 12794
O 6.8 x10⁻¹⁶ 1
NB: kb/ka
b23
a223
OXOOX OOOO
kk
+→++→+
Rate loss of ozone: d[O3]/dt=- ka[O][O3]-kb[X][O3] The rates are equal when: ka[O][O3]/kb[X][O3]=1
ab kk /][ =∴ O]/[X Natural Chapman cycle
- 7 -

L. H. Voûte GCE Green Chemistry Teacher’s Pack
It can be seen from the above table that one only needs to add c.1 millionth of the
amount of H into the system compared to O for it to have the same effect as the
natural Chapman cycle.
1.5. The Ozone Hole
1.5.1. Ozone Depletion
In the 1970s, the British Antarctic Survey recorded an enormous decrease in ozone in
the Stratosphere over the Antarctic6. At first they believed their equipment to be
faulty as they were astonished by this finding7.This continued to decrease year on
year8, as shown by Figure 4.
Figure 4: Average Ozone Depletion for October over the Antarctic6
Figure 5: Average Area of the Ozone Hole
1980-20068
- 8 -
L. H. Voûte GCE Green Chemistry Teacher’s Pack
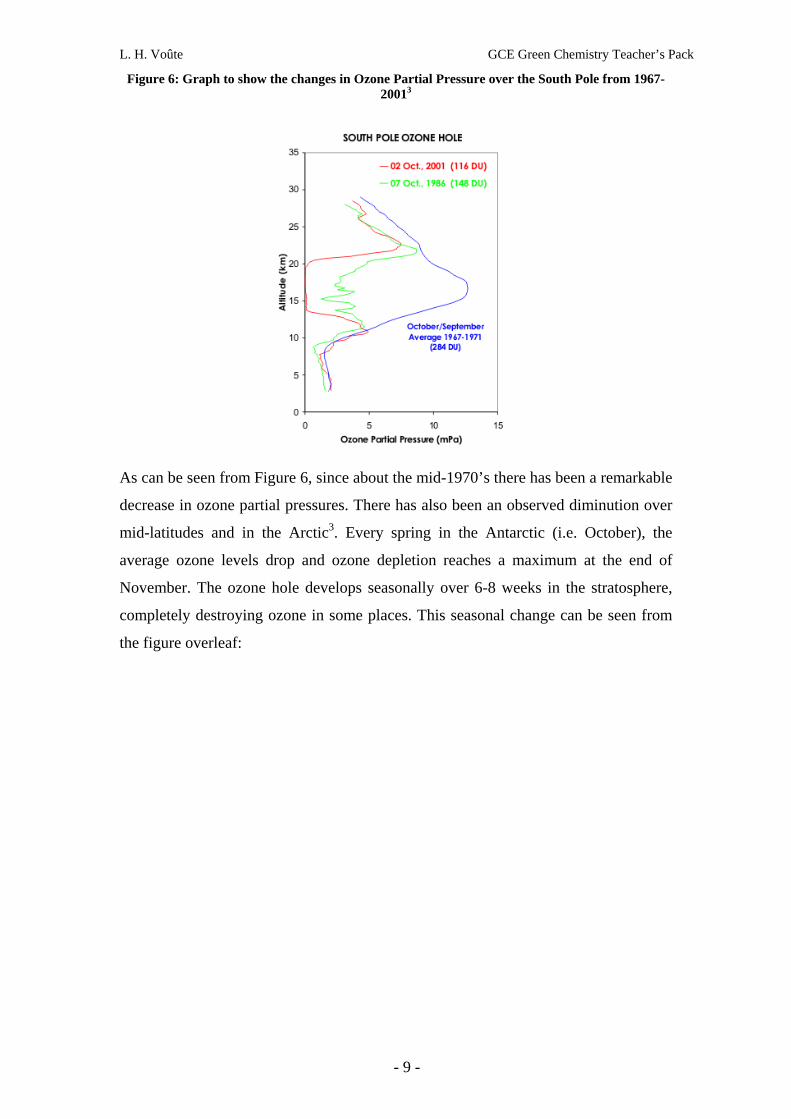
Figure 6: Graph to show the changes in Ozone Partial Pressure over the South Pole from 1967-20013
As can be seen from Figure 6, since about the mid-1970’s there has been a remarkable
decrease in ozone partial pressures. There has also been an observed diminution over
mid-latitudes and in the Arctic3. Every spring in the Antarctic (i.e. October), the
average ozone levels drop and ozone depletion reaches a maximum at the end of
November. The ozone hole develops seasonally over 6-8 weeks in the stratosphere,
completely destroying ozone in some places. This seasonal change can be seen from
the figure overleaf:
- 9 -

L. H. Voûte GCE Green Chemistry Teacher’s Pack
Figure 7: Graph showing the variation in Ozone Partial Pressure at various altitudes in the summer (October) and winter (July) of 2001 over the Antarctic9
As can be seen from the July bulge around 15km, this is where the ozone is usually at
its maximum in the stratosphere. In the winter, the ozone level is almost 0 at this
altitude, showing severe depletion.
1.5.2. Why the depletion is dangerous
Low levels or lack of ozone in the stratosphere causes detrimental impacts of humans,
the ecosystem, and the economy at large. This is primarily due to the fact that reduced
levels of ozone means that less of the dangerous, high energy UV-B radiation will be
absorbed (see Figure 3), and so more will impinge upon the earth’s surface.
Approximately, a 1% decrease of ozone leads to a 2% increase of UV radiation
reaching the earth’s surface3.
• Humans: Increased levels of dangerous high-energy UVB radiation17 impinging
upon the earth’s surface can cause “melanoma and non-melanoma skin cancer”17,
eye disorders and cataracts and suppression of the immune system in people of all
races – possibly leading to an increase in diseases and infections. According to
Tolba et al:
“The percentage increases [of skin cancer] will not be one-to-one: a sustained
ten per cent reduction in ozone would result in a 26 per cent increase in non-
- 10 -
L. H. Voûte GCE Green Chemistry Teacher’s Pack
melanoma skin cancer. All other things remaining constant, this would mean
an increase in excess of 300,000 cases a year, world-wide.”17
• Plants: Roughly half of the world’s plants are sensitive to UV-B light, and their
leaves shrink and the plant grows less when there is an increase in UV-B light
impinging on the earth’s surface. Economically, this is also problematic as it can
cause reduce food yields and plants also can change their chemical composition
with increased UV-B exposure, which can affect their quality and nutrient levels.17
• Aquatic ecosystems: Phytoplankton experience a similar detrimental impact of
excess UV-B radiation that terrestrial plants do. This could affect species further
up the food chain and have a detrimental impact on the productivity of fisheries17,
amongst others. In addition, there could be nitrogen deficiency in rice paddies as:
“Increased exposure to UV-B radiation could lead to decreased nitrogen
assimilation by prokaryotic micro-organisms” 17
• Air quality: Increased levels of surface UV radiation can change the levels of
reactive compounds in the troposphere, such as acids, hydrogen peroxide and
ozone where levels of NOx are high.17
• Materials damage: Photo-oxidation3 can occur to many materials (wood, plastics
and rubber17), which is when the materials become oxidized through the action of
UV light. Thus, increased UV light can cause increased damage to these materials.
1.5.3. Explanation for the depletion
1.5.3.1. Polar Stratospheric Clouds
In the Polar Regions in the winter, the temperatures drop so low that a polar vortex
forms. This is when sunlight does not shine upon the region, and it is so dark and cold
that air descends and creates a strong downwards vortex motion1, or circumpolar
winds in the mid to low stratosphere6. This isolates the air within the vortex from the
rest of the globe, and no material can get out and material can only enter at 40 km:
- 11 -

L. H. Voûte GCE Green Chemistry Teacher’s Pack
Figure 8: Depiction of the Polar Vortex during the winter over the South Pole10
In these conditions: no sunlight, and very cold temperatures – below -800C – polar
stratospheric clouds (PSC) can form, these clouds remain there as the vortex isolates
the air so it remains cold. These contain high levels of nitric acid (HNO3) and ice-
water.11
Figure 9: Depiction of how CFCs enter the atmosphere6
- 12 -

L. H. Voûte GCE Green Chemistry Teacher’s Pack
1.5.3.2. CFCs converting to Active Forms of Chlorine and Bromine
CFCs were first created in 1928 as a non-toxic, non-flammable refrigerant, and then
many other uses for them were discovered7, due to their low reactivity and volatility.
As can be seen from the figure above, CFCs are emitted into the atmosphere by
factories and homes (such as through the use of CFCs in aerosols, refrigerants, in air-
conditioning and as solvents). The UV light in the upper atmosphere can easily break
the C-Cl bonds in CFCs and converts the compounds into the main reservoir species
of chlorine HCl and ClONO2, as they have a long lifetime, and move down into the
polar vortex. The PSCs provide a surface on which heterogeneous reactions can occur
to convert these two species, and their bromine equivalents, into active forms of
chlorine11:
3252
352
22
322
232
HNO2OH ONClONO HNOHCl ON
Cl OHHOClHClHOCl HNOOH ClONO
Cl HNOClONOHCl
→++→+
+→++→+
+→+
These heterogeneous reactions allow for the reservoir compounds of catalysts for
ozone destruction to rapidly convert chlorine and bromine to their active forms.
1.5.3.3. The Return of Sunlight: Ozone Destruction
Remembering this occurs in the winter, as the cold temperatures that occur allow the
formation of the PSCs; when the sunlight returns in the spring (October for the South
Pole), the molecular chlorine readily undergoes photolysis:
ClClCl2 +→+ νh
This could now go on to catalyse the destruction of ozone through the cycle:
20km) (c. altitude at this slow tooisit - OClOClO:cycle in the step final thedo vortex toin the atoms Oenough not are ereHowever th
OClOOCl
2
23
+→+
+→+
- 13 -
L. H. Voûte GCE Green Chemistry Teacher’s Pack
Instead, the cold temperatures encourage the formation of dimers of ClO, which
drives the following cycle:
nDestructio Ozone - 2O2O:Net)O2(ClO)O2(ClOClClhνClOOCl
MClOOClMClOClO
23
23
2
→+→+
++→++→++
This cycle is thought to be the predominant cycle for ozone destruction, accounting
for 70% of destruction in the South Pole.
1.5.3.4. Summary of Ozone Destruction
The greater the amount of CFCs released into the atmosphere, the greater the amount
of chlorine available as CFCs break with a high energy source:
i.e. light at 200 nm: CFCl3 + hv CFCl2. + Cl.
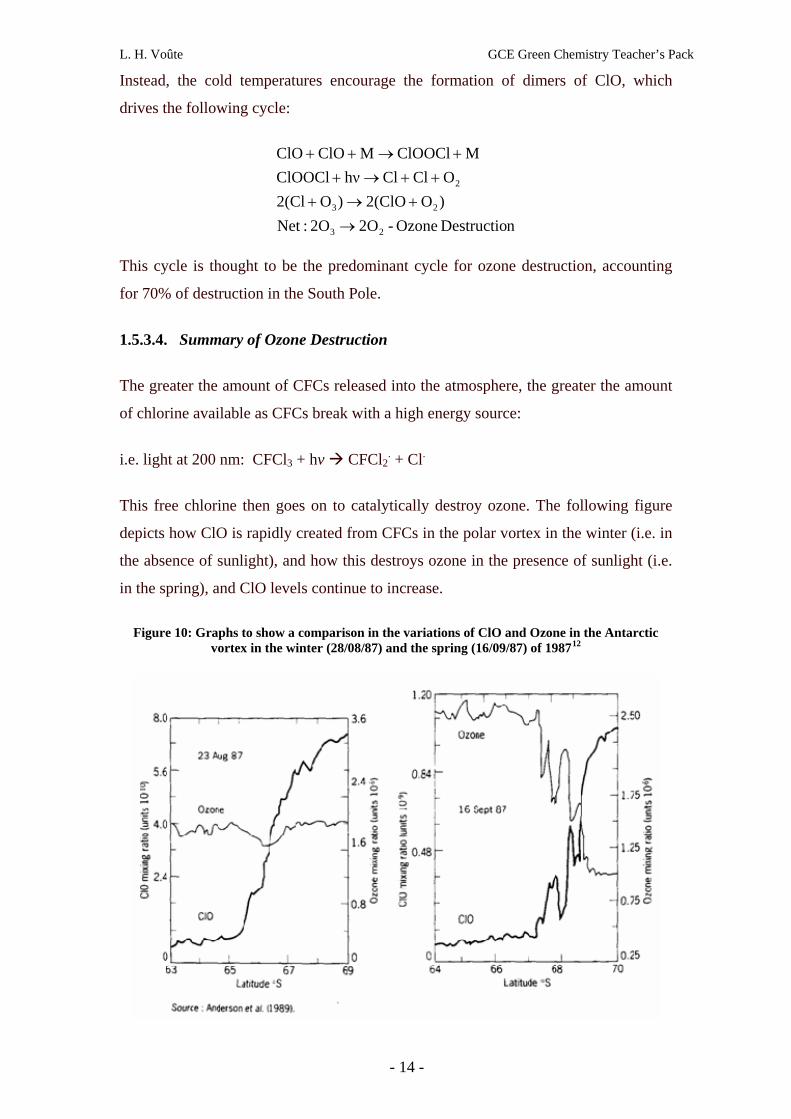
This free chlorine then goes on to catalytically destroy ozone. The following figure
depicts how ClO is rapidly created from CFCs in the polar vortex in the winter (i.e. in
the absence of sunlight), and how this destroys ozone in the presence of sunlight (i.e.
in the spring), and ClO levels continue to increase.
Figure 10: Graphs to show a comparison in the variations of ClO and Ozone in the Antarctic vortex in the winter (28/08/87) and the spring (16/09/87) of 198712
- 14 -

L. H. Voûte GCE Green Chemistry Teacher’s Pack
These same factors also cause destruction over the arctic, although because of warmer
temperatures, the loss isn’t as great. In addition, the PSCs don’t occur as strongly in
the northern hemisphere because the land-ocean distribution is different (the mountain
ranges “stir the atmosphere up”11) and more favourable for their formation in the
southern hemisphere, and in the Arctic the polar vortex disperses earlier in the
spring11.
1.5.4. Current and Future Ozone Levels
Currently, the ozone hole is one and a half times the size of the United Sates (see
Figure 11), and is still getting larger. However, levels of CFCs are decreasing. This is
due to legislations controlling the use of CFCs: the Vienna Convention17 – which did
not prevent the use of bromofluoroalkanes13, and therefore – the Montreal Protocol14
that were implemented in 198517 and 198914 respectively. These legislations were
supported by chemists. The Montreal Protocol aimed to reduce stratospheric halon
levels to the levels they were at before the ozone hole by 206011.
The Montreal Protocol was written so that schedules for the phasing out of
halofluorocarbons could be revised depending on the current scientific and
technological advances15. Thus, most recently, in September 2007 a Montreal Summit
was held whereby c.200 countries (including the US and China which had previously
been opposed to the protocol) signed a treaty to accelerate the complete ban of the use
of hydrocarbons by 2020, and developing countries were given until 2030. China
currently has CFC levels equivalent to those that were present in the 60s and 70s in
the UK3.
With the use of halofluorocarbons being phased out, all CFCs are currently banned
except for medicinal use only13. In the US, the use of CFC, HCFC or HFC gases
requires the technician to pass licensing examinations set by the Environment
Protection Agency.13
1.5.5. CFC Substitutes
Scientists have developed and are currently developing alternatives to CFCs, to meet
the legislation’s requirement. CFCs have a variety of uses, primarily as cleaning
agents, fire extinguishing agents, foam, and refrigerants15.
- 15 -

L. H. Voûte GCE Green Chemistry Teacher’s Pack
The CFC substitutes developed include:
• HFC-134a, a chlorine free compound used as a refrigerant with an Ozone
Depletion Potential (ODP – see overleaf) of zero16.
• PhostrEx, the fire suppression agent used in light jets, was developed to be
free of CFCs and is now being sold to other airplane manufacturers13.
• HCFC: the H atom increases the reactivity of the compound, so less is
required for its use. In addition, 95% of the compound is destroyed the
troposphere and never reaches the stratosphere11, for example CF3CH2F.
• Other chlorine-free compounds have been developed as well, and their use
is in rapid growth, especially fluorinated and partially fluorinated
hydrocarbons15, such as CF2C12. This requires replacing the chlorine with
fluorine. These compounds do not destroy the ozone layer (doesn’t react
with O3) but unfortunately have a high Global Warming Potential (GWP)
and so contribute to climate change.
Therefore, compounds that are developed today not only have to be chlorine-free but
also have to abide by the Kyoto protocol by having a low GWP15.
Using models, we are able to estimate this future decrease of atmospheric chlorine
level (see Figure 12) and a complete drop by about 20701. The ozone hole itself is
hoped to level off by 2019 and eventually start to decrease by 20503.
Figure 11: The ozone hole with the area of the United States superimposed3
- 16 -

L. H. Voûte GCE Green Chemistry Teacher’s Pack
Figure 12: Past and predicted levels of atmospheric chlorine3
Although this legislation appears to be taking effect, the lifetime of CFCs is very long
and particularly CF3Br is very potent at destroying ozone (see Table 4: bromine has
10 times the ODP of chlorine). In addition, unlike Cl, Br won’t react with methane1:
reaction no CHBrCHHClCHCl
4
34
→++→+
Therefore it is unable to form a reservoir compound and difficult to get rid of bromine
once it has entered the atmosphere1. Therefore it could take quite some time before
the anthropogenic sources (i.e. derived from human activity) of Cl and Br are
removed from the atmosphere.
Table 4: Halocarbon abundances, lifetimes and Ozone Depletion Potentials Halocarbon Abundance17
(pptv) Lifetime1 (years)
Ozone Depletion Potential1 (=Ozone destroyed by unit mass halocarbon/Ozone destroyed by unit mass of CFCl3)
CFCl3 280 55 1.0 CF2Cl2 484 100 0.8 CF3Br 2 65 10.0 CH3CCl3 158 50 0.1
- 17 -

L. H. Voûte GCE Green Chemistry Teacher’s Pack
Finally, it can be seen that global warming did not cause the ozone hole; however
there are links between the two processes11:
• CFCs are greenhouse gases
• The stratosphere is actually cooling due to global warming, so more PSCs
can be formed, increasing the amount of reactions for ozone depletion.
- 18 -

L. H. Voûte GCE Green Chemistry Teacher’s Pack
2. Air Pollution
L. H. Voûte GCE Green Chemistry Teacher’s Pack
2. Air Pollution
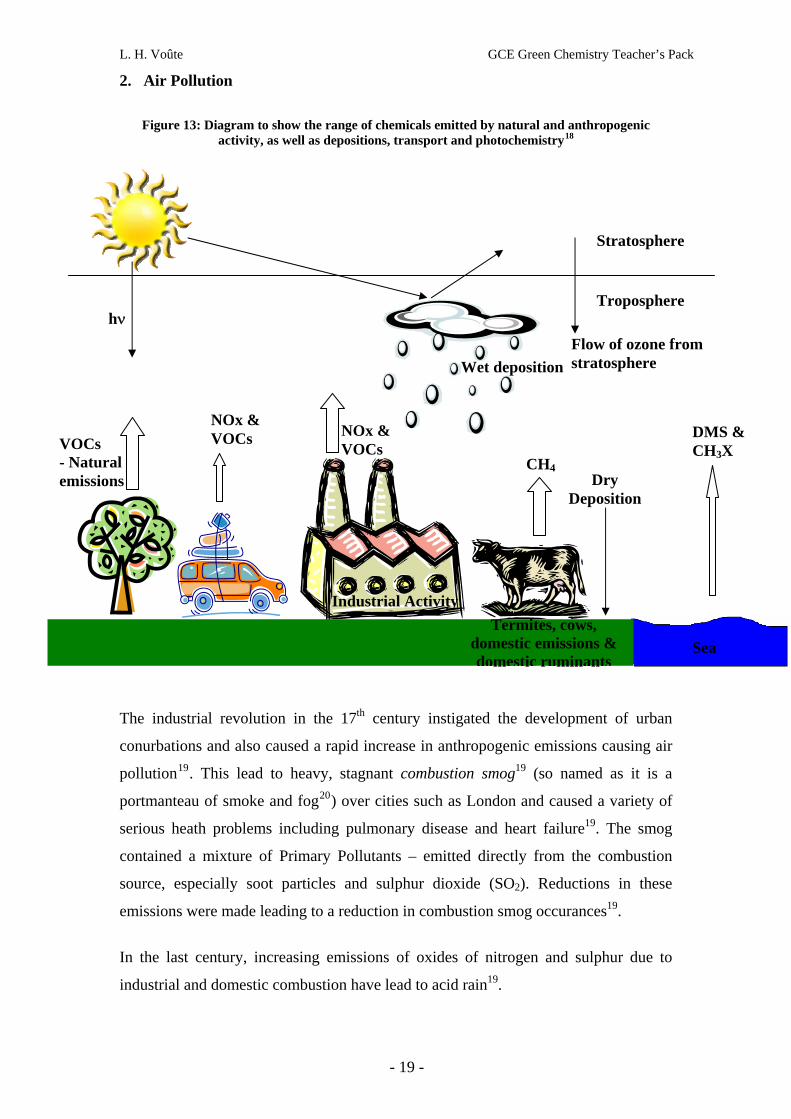
Figure 13: Diagram to show the range of chemicals emitted by natural and anthropogenic activity, as well as depositions, transport and photochemistry18
The industrial revolution in the 17th century instigated the development of urban
conurbations and also caused a rapid increase in anthropogenic emissions causing air
pollution19. This lead to heavy, stagnant combustion smog19 (so named as it is a
portmanteau of smoke and fog20) over cities such as London and caused a variety of
serious heath problems including pulmonary disease and heart failure19. The smog
contained a mixture of Primary Pollutants – emitted directly from the combustion
source, especially soot particles and sulphur dioxide (SO2). Reductions in these
emissions were made leading to a reduction in combustion smog occurances19.
In the last century, increasing emissions of oxides of nitrogen and sulphur due to
industrial and domestic combustion have lead to acid rain19.
NOx VOC
& s
4CH
NOx VOC
& s
ry n
ν
DDepositio
Wet deposition
h
Stratosphere
Troposphere
ea S
VOCs al ns
m e
& X
s, &
- Naturemissio
Flow of ozone frostratospher
DMS CH3
Termites, cowdomestic emissions domestic ruminants
Industrial Activity
- 19 -
L. H. Voûte GCE Green Chemistry Teacher’s Pack
Since the post-war era of the 1950s, both the population and use of motorized vehicles
has rapidly increased. These emissions caused a hazy photochemical smog19. This also
causes adverse health problems, such as eye irritations, sore throats, asthma and
respiratory diseases19. It was found that the component of photochemical smog (and
cause of these ailments) were Secondary Pollutants, made from Primary Pollutants.
The main components are ozone and PAN (peroxyacetylnitrate - CH3C(O)O2NO2)
and are formed from the action of primary pollutants (from car exhausts etc) such as
reactive VOCs and nitrogen oxides, with sunshine19. Every major city in the world
now experiences photochemical smog19. From the figure above, it can be seen that the
troposphere today has a complex array of emissions and processes.
2.1. Emitted Pollutants1
• VOCs are volatile organic compounds; these contain a large variety of different
organic compounds both emitted from anthropogenic and natural sources. They
absorb IR radiation, as does methane (CH4), and so contribute to global warming
and they are therefore greenhouse gases.
o VOCs from anthropogenic sources are mainly from the burning of fuels (such
as in industry, for energy supplies and through the usage of cars). Alkanes are
used as fuels and their combustion can be complete or incomplete, so some
light, unburned hydrocarbons are emitted during combustion, such as through
car exhausts. Incomplete combustion causes emission of CO and complete
combustion emits CO2. Additionally, the light hydrocarbons in fuel evaporate
when refuelling or storing, and others during combustion. A source of light
alkanes is due natural gas leakage and a source of alkenes is biomass burning.
o Natural sources of VOCs are from vegetation (plants, trees, fungi and algae),
which they emit as pheromones (to ward off predators, to attract insects), to
regulate their temperature or even as antifreeze. The VOCs include
hydrocarbons, CO2 from respiration and CO.
• NOx includes NO and NO2, this is formed due to high temperatures in combustion
(especially in the combustion of fossil fuels) where nitrogen and oxygen react: N2
+ O2 + heat NOx. In addition, there are some natural sources of nitrogen, such
as ammonia from fertiliser and manure23. This causes the formation of smog and
acid rain.
- 20 -
L. H. Voûte GCE Green Chemistry Teacher’s Pack
• SO2 and particulates are also released through anthropogenic processes, as
combustion of hydrocarbons releases soot and ash and combustion of
hydrocarbons containing sulphur releases sulphur dioxide. These are emitted
through car exhausts, and as pollution from industry. In addition sulphur can be
emitted from natural sources, such as volcanoes, the action of bacteria in soils and
lightning23. These can both contribute to smog and SO2 contributes to acid rain.
2.2. Removal Processes of Compounds1
• Wet deposition involves the incorporation of species into aqueous media such as
mist, rain, sea, and snow. This therefore has to involve soluble species such as the
following inorganic compounds: HNO3, H2SO4, HCl, HONO and SO2. VOCs
usually are hydrophobic and therefore insoluble and rarely are lost through wet
deposition.
• Dry deposition is removal of species through their adsorption onto air mass.
When air mass comes into contact with water, earth or vegetation the emitted
species can either physisorp (through Van der Waals forces) or chemisorp
(through a chemical reaction). The rate of this determined by the flux through the
atmospheric boundary layer (1 km form the Earth’s surface3) the rate of
adsorptions. Generally the species are polar and therefore inorganic such as
HNO3, NO2, HCl, HONO, O3 and SO2. Only very polar VOCs are lost through
this process.
• Chemical removal is the removal of VOCs through oxidation. This is mainly
done by the OH radical, but also ozone, NO3 radicals and even direct photolysis.
This is why the troposphere is said to be oxidising. Through oxidation, it reacts
with the species and eventually H2O and CO2 get out – water is then rained out (a
subcategory of wet deposition) and CO2 is a greenhouse gas.
o The OH radical is created via the mechanism:
•••
••
•
+→+
+→+
<+→+
OHOHOHD)O(
moleculeNor Oan is M re wheMP)O(MD)O(
330nm~at h OD)O(hO
21
2231
21
3 λνν
This occurs in the troposphere: a small amount of ozone is found in the
troposphere and therefore only a small amount of excited atomic oxygen
- 21 -
L. H. Voûte GCE Green Chemistry Teacher’s Pack
(O(1D)) is created by photolysis. However, as the troposphere sits below the
stratosphere, the air in it is at a higher pressure. This leads to a balance
between concentrations of water vapour and M. At these high pressures the
excited O(1D) is rapidly quenched by M, however the troposphere also has 10-
50,000 times higher water vapour concentrations than in the stratosphere so a
small amount of O(1D) reacts with water to form OH radicals.
o The OH radical reacts with VOCs (RH) via the reaction:
O HRRHOH 2+→+•
The rates of reaction (and hence lifetime of RH) increases with increasing
number of H’s as there is a greater chance of collision with . However,
with a polar atom in the molecule, such as Cl in CH3Cl, the reaction is a lot
faster as the Cl is electronegative, inducing a dipole in the molecule and
leaving the H’s a lot more positive so they are more reactive. With alkenes, an
addition reaction occurs:
•OH
2222 CH(OH)CH M CHCH OH −→+=+•
2.3. Smog Formation1
The main ingredient of smog is O31 which is caused by the action of sunlight on NOx
and VOCs. As discussed earlier, VOCs can react very quickly with the OH radical
and in heavily polluted areas, VOCs are often very prevalent – especially aromatic
compounds, alkenes and aldehydes as these react very quickly to form smog1.
Nitrogen oxides (NOx) create ozone in the troposphere. This is unwanted and harmful
to plants and humans’ respiratory systems, as well as being a major component of
smog. This occurs due to the following mechanisms1:
- 22 -
L. H. Voûte GCE Green Chemistry Teacher’s Pack
• Without NOx:
destroyed is OOCOOCO :Net
2OOHOHO
MHOMOH
COHOHCO
3
223
232
22
2
∴+→+
+→+
+→++
+→+
••
••
••
• With NOx:
produced is OOCO2OCO:NetMOMOP)O(
OP)O(NOhνNO
OHNONOHO
MHOMOH
COHOHCO
3
322
323
23
2
22
22
2
∴+→++→++
++→+
+→+
+→++
+→+
•
••
••
••
••
Figure 143 overleaf shows the complete cycle of how ozone is formed and destroyed
via the action of NOx and sunlight. In urban areas the concentration of NOx and
VOCs are always high, however one doesn’t see smog on a daily basis as intense
sunlight is required to create the OH radicals and photolyse NO2 (therefore producing
O3), so clear, still, hot days are ideal for smog formation1.
- 23 -
L. H. Voûte GCE Green Chemistry Teacher’s Pack
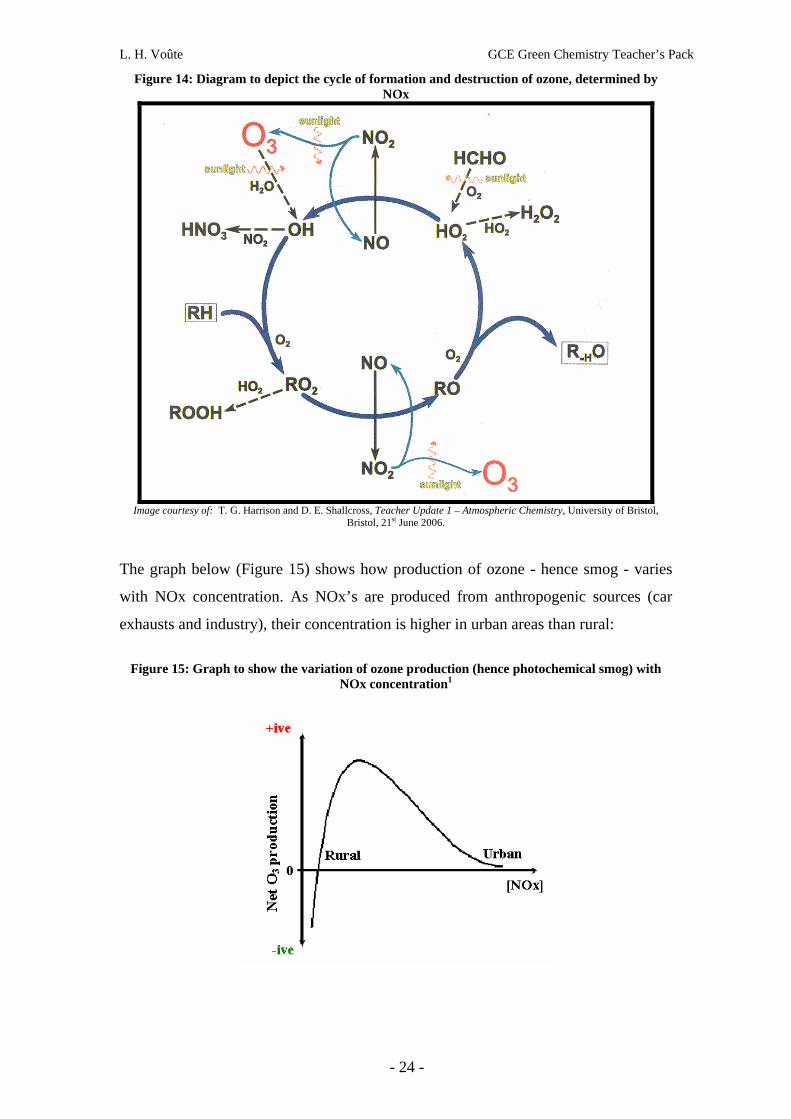
Figure 14: Diagram to depict the cycle of formation and destruction of ozone, determined by NOx
Image courtesy of: T. G. Harrison and D. E. Shallcross, Teacher Update 1 – Atmospheric Chemistry, University of Bristol,
Bristol, 21st June 2006.
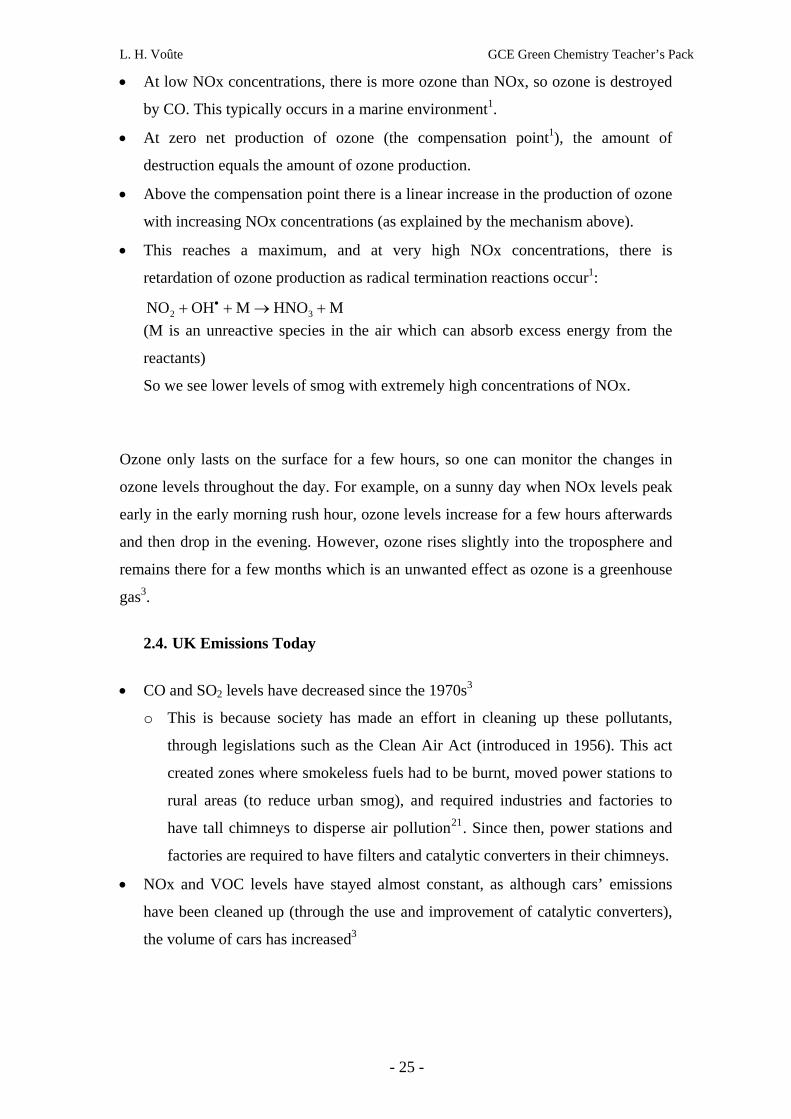
The graph below (Figure 15) shows how production of ozone - hence smog - varies
with NOx concentration. As NOx’s are produced from anthropogenic sources (car
exhausts and industry), their concentration is higher in urban areas than rural:
Figure 15: Graph to show the variation of ozone production (hence photochemical smog) with NOx concentration1
- 24 -
L. H. Voûte GCE Green Chemistry Teacher’s Pack
• At low NOx concentrations, there is more ozone than NOx, so ozone is destroyed
by CO. This typically occurs in a marine environment1.
• At zero net production of ozone (the compensation point1), the amount of
destruction equals the amount of ozone production.
• Above the compensation point there is a linear increase in the production of ozone
with increasing NOx concentrations (as explained by the mechanism above).
• This reaches a maximum, and at very high NOx concentrations, there is
retardation of ozone production as radical termination reactions occur1:
MHNOMOHNO 32 +→++ • (M is an unreactive species in the air which can absorb excess energy from the
reactants)
So we see lower levels of smog with extremely high concentrations of NOx.
Ozone only lasts on the surface for a few hours, so one can monitor the changes in
ozone levels throughout the day. For example, on a sunny day when NOx levels peak
early in the early morning rush hour, ozone levels increase for a few hours afterwards
and then drop in the evening. However, ozone rises slightly into the troposphere and
remains there for a few months which is an unwanted effect as ozone is a greenhouse
gas3.
2.4. UK Emissions Today
• CO and SO2 levels have decreased since the 1970s3
o This is because society has made an effort in cleaning up these pollutants,
through legislations such as the Clean Air Act (introduced in 1956). This act
created zones where smokeless fuels had to be burnt, moved power stations to
rural areas (to reduce urban smog), and required industries and factories to
have tall chimneys to disperse air pollution21. Since then, power stations and
factories are required to have filters and catalytic converters in their chimneys.
• NOx and VOC levels have stayed almost constant, as although cars’ emissions
have been cleaned up (through the use and improvement of catalytic converters),
the volume of cars has increased3
- 25 -

L. H. Voûte GCE Green Chemistry Teacher’s Pack
• Society has increased their awareness of pollution and its causes since the
industrial revolution. There are continuing efforts to find greener fuels to reduce
these emissions.
• Infrared spectroscopy can be used to monitor air pollution through the use of
mobile Fourier transform spectrometers as the major components (CO, CO2, SO2,
NO2 and VOCs) can be detected.
2.5. Catalytic Converters
A catalytic converter treats the exhaust of a car before it enters the atmosphere to
remove sources of air pollution.
The main components of car emissions are N2 gas (due to the fact that the majority of
air in N2 gas, so this passes through the car’s engine), CO2 and H2O (both products of
combustion). As combustion is not always complete, trace amounts of CO, VOCs
(unburned fuel that has evaporated), and NOx’s. Besides carbon dioxide’s Global
Warming Potential, the trace gases are most harmful and causes of air pollution.
• A catalytic converter is usually 3-way: it has a reduction catalyst, an
oxidation catalyst and a control system (which monitors the exhaust and
feeds back information to fuel injection system)22.
• The reduction catalyst is the first stage and uses a ceramic (usually)
honeycomb structure coated with platinum and rhodium22. It reduces NOx
emissions by22:
o Adsorbing NO and NO2 at the catalyst surface
o The NOx then undergoes a chemical reaction whereby it bonds with the
nitrogen, hence breaking the N-O bond so oxygen is free and bonds with
other oxygen atoms to form O2. The N then reacts with other N atoms on
the catalyst’s surface and so forms N2. This is then desorbed from the
catalyst’s surface as free N2 gas.
• The oxidation catalyst is the second stage and uses a platinum and palladium
catalyst coated again onto a ceramic honeycomb structure22. It oxidises
unburned hydrocarbons (VOCs) and CO22 by lowering the activation energy
for combustion of these reactants with the remaining oxygen supply in the
exhaust.
o The catalyst adsorbs CO and the VOCs onto the catalyst surface
- 26 -

L. H. Voûte GCE Green Chemistry Teacher’s Pack
o Free O2 in the exhaust gas passes over the catalyst and the catalyst
therefore aids the oxidation of the CO and VOCs – causing a chemical
reaction to form CO2.
o This CO2 doesn’t adsorb as well onto the catalyst so is released into the
exhaust.
2.6. Acid Rain
Acid rain is caused by NOx and SO2 converting to nitric acid and sulphuric acid23.
Rain is normally slightly acidic anyway, having a pH of 5.523 due to the fact that
some acids are dissolved in it from natural sources of nitrogen and sulphur as well
as carbon dioxide. However precipitation in polluted areas or downwind from
polluted air is more acidic than usual due to increased levels of NOx and SO2.
These pollutants are emitted into the atmosphere through combustion of
hydrocarbons or hydrocarbons containing sulphur (the released H2S reacts with
oxygen during the combustion process: 2222 2SOO2H3OS2H +→+ )24.
Acid) (Nitric HNOOHNO:Formation Acid Nitric
SOHHSO
Hydrolysis HSOHOHSO
in water dissolves dioxideSulphur OHSOOHSO:Chemistry Phase Aqueous -Formation Acid Sulphuric
Acid) (Sulphuric SOHOHSOSOHOOHOSO
HOSOOHSO
:ChemistryPhaseGas -Formation Acid Sulphuric
32
233
322
22(l)2(g) 2
4223
3222
22
→+
+⇔
+⇔⋅
⋅⇔+
→++→+
→+
•
−+−
−+
••
••
25
Thus, both are oxidised by the reactive hydroxyl radical (see Section 2.2 for how
is created). In the presence of water vapour, the sulphur trioxide (SO3) is
rapidly converted to sulphuric acid
•OH25. In clouds, liquid droplets of water react
much more rapidly with sulphur dioxide25.
These acids are both dissolved into water, precipitated down to earth, and the
pollutants may be deposited through dry deposition closer to their source onto
- 27 -
L. H. Voûte GCE Green Chemistry Teacher’s Pack
vegetation and soils, where the above reactions occur to create acids23. If it is
dissolved into clouds, the acids may travel a long way, even hundreds of
kilometres before it falls23 – therefore pollution recognises no boundaries and acid
rain caused by UK emissions are known to have fallen in Norway and devastated
the forests. In fact, the UK accounts for at least 16% of Norway’s acid rain26.
Effects of Acid Rain
• of rivers and lakes and so can destroy the ecosystems,
vegetation and organisms within them. pHs below 5 will stop fish eggs from
ria in the soil27.
diseases such as cancer, bronchitis, emphysema and
•
The increased acidity
hatching and below that can kills even adult fish27. So as acidity increases, the
biodiversity of lakes decreases27. Acid rain has made certain fish and species of
insects extinct27.
• Changes to the soil pH can harm plants and denature
enzymes and bacte
Image taken from: European Environment Agency Website http://reports.eea.europa.eu/2599XXX/en/page009.html
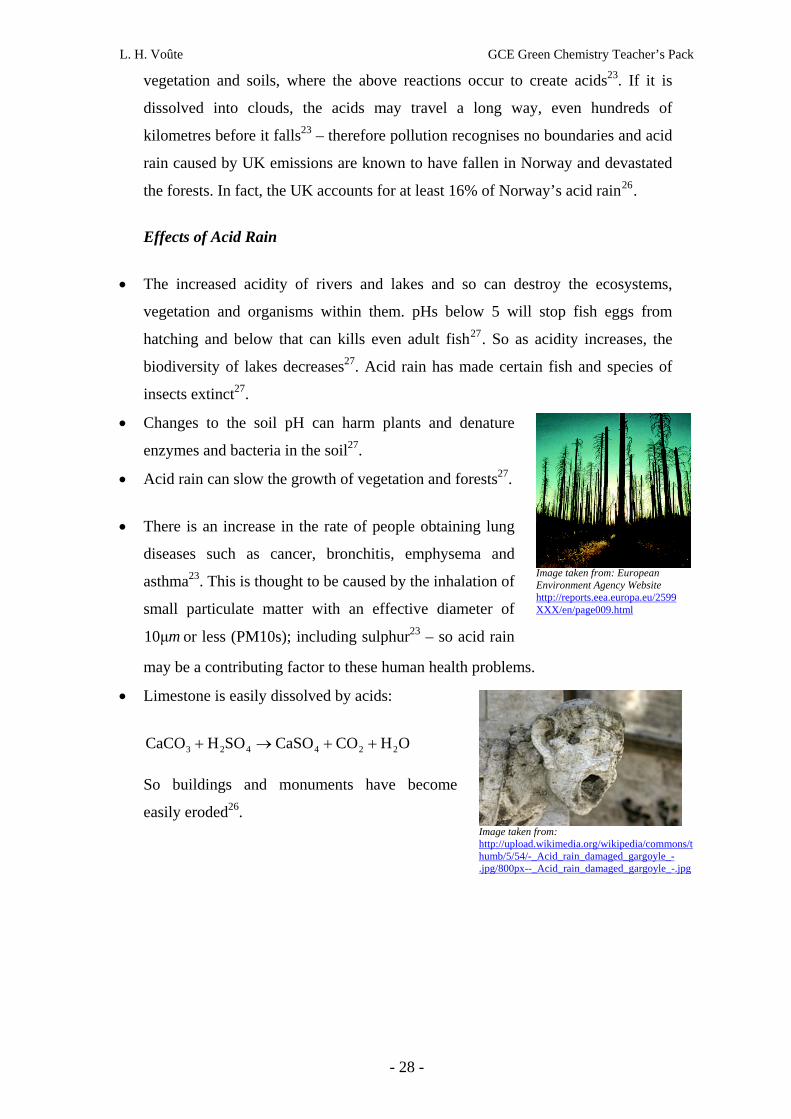
• Acid rain can slow the growth of vegetation and forests27.
• There is an increase in the rate of people obtaining lung
asthma23. This is thought to be caused by the inhalation of
small particulate matter with an effective diameter of
m0μ1 or less (PM10s); including sulphur23 – so acid rain
may be a contributing factor to these human health problems.
Limestone is easily dissolved by acids:
H O
Image taken from: http://upload.wikimedia.org/wikipedia/commons/thumb/5/54/-_Acid_rain_damaged_gargoyle_-.jpg/800px--_Acid_rain_damaged_gargoyle_-.jpg
COCaSOSOHCaCO 224423 ++→+
So buildings and monuments have become
easily eroded26.
- 28 -

L. H. Voûte GCE Green Chemistry Teacher’s Pack
Reducing Acid Rain
Efforts are being made to reduce acid rain by removal of these nitrogen and sulphur
based pollutants at their source. Sulphur dioxide can be removed from flue gases
using calcium oxide:
32 CaSOSOCaO →+
This is then easily converted to CaSO4, known as gypsum24. Gypsum is a mineral
with many uses: it is an ingredient in plaster (of dry walls) and fertilisers28. Most of
the gypsum in the EU market is made from flue gas desulphurisation24. Through the
enforcement of this process, the United States (for example) has seen a 33% decrease
in SO2 emissions between 1983 and 200224.
- 29 -

L. H. Voûte GCE Green Chemistry Teacher’s Pack
3. Global Warming

L. H. Voûte GCE Green Chemistry Teacher’s Pack
3. Global Warming
3.1. Greenhouse Effect
This is a process whereby the whereby the reflection of infrared (IR) radiation by the
Earth’s surface and incoming IR radiation from the sun is absorbed by greenhouse
gases in the troposphere. Solar radiation reaching the Earth’s surface is mainly visible
and UV light. The earth’s surface (vegetation, land and oceans) absorbs incoming
visible and UV light, which heats it up. It then re-radiates 4% of this as heat in the
form of IR radiation29. The reason why the earth doesn’t rapidly drop in temperature
at night is because greenhouse gases in the troposphere (i.e. the part of the atmosphere
closest to the Earth’s surface) absorb the radiated IR radiation in the ‘IR window’ (the
IR region of the spectrum where these gases show strong absorptions) and re-emit it
in all directions as heat, so some of this heat is transferred to the Earth and heats it up.
In addition, when the gases absorb IR radiation, their vibrational modes are excited,
so they vibrate more vigorously and are more likely to collide with other molecules,
transferring their energy. This increases the kinetic energy of other molecules and
raises the average temperature of the troposphere.60
Figure 16: Figure to show the proportions of radiation emitted, transmitted and reflected by the atmosphere and Earth's surface29
3.2. Climate Change
Climate is “the characteristic weather of a region averaged over some period of
time”1. So a change in climate is not the same as a change in weather (which can vary
on a daily basis). Climate change today is referred to as the change in climate that has
been closely observed since the early 1990’s and is thought to be caused by global
warming30.
- 30 -
L. H. Voûte GCE Green Chemistry Teacher’s Pack
3.3. Global Warming
Global warming is a controversial topic that has caused “intense and often emotional
debate” since the mid 1980s31. It refers to the recorded increase of the mean surface
temperature of the Earth, which is thought to be due to an increase in the
concentration greenhouse gases in the atmosphere due to human activity31. There has
almost definitely been a 1 degree temperature rise in the Earth’s surface temperature
over the past 100 years1.
3.3.1. Greenhouse Gases and How They Work
These greenhouse gases include H2O, CO2, CH4 and NOx molecules, and are so-
named because they absorb IR radiation and re-emit the heat in all directions –
thereby increasing the temperature of the atmosphere. NB, O2 and N2 are not
greenhouse gases since in order to absorb IR radiation there must be a change in the
dipole moment, and O2 and N2 are symmetric and so not stretch or bend would cause
a change in dipole moment. The IR radiation is of the correct frequency to be
absorbed by the electrons in the C=O bonds in carbon dioxide, O-H bonds in water
and C-H bonds in methane, causing them to vibrate, bend, rock, scissor and twist (for
example). The electrons have become excited, hence promoting the electrons to
higher vibrational energy levels. When the electrons return to their ground state, they
re-emit the energy with a frequency equal to the frequency of energy gap between the
two levels.32
The “Greenhouse Effect” of a given gas – how much it heats up the Earth’s
atmosphere - is dependent upon: 48
• Its atmospheric concentration: the greater the concentration of the gas, the more
molecules there are to absorb IR radiation.
• Its ability to absorb IR radiation: some gases absorb and re-emit IR radiation more
strongly than others.
3.3.2. Evidence for Global Warming
• The carbon dioxide and methane concentrations in the atmosphere are increasing
and they have been increasing rapidly since the 1800s.
- 31 -

L. H. Voûte GCE Green Chemistry Teacher’s Pack
Figure 17: Graph to show the increase in carbon dioxide concentration in the troposphere from 1967-19971
• Methane (CH4) levels have been increasing exponentially from the 1800s
onwards. This is probably due to thawing of permafrost which contains trapped
methane, increased rice cultivation (methanogenic bacteria live in rice paddies),
leaking of natural gases from pipelines and during transport, and increasing
ruminants1. However, some of this may be offset by the destruction of wetlands
(hence methanogenic bacteria1 – so it is a balance of the two and the former must
be dominating.
Figure 18: Graph to show the variation in methane concentrations since 1000 A.D.1
- 32 -
L. H. Voûte GCE Green Chemistry Teacher’s Pack
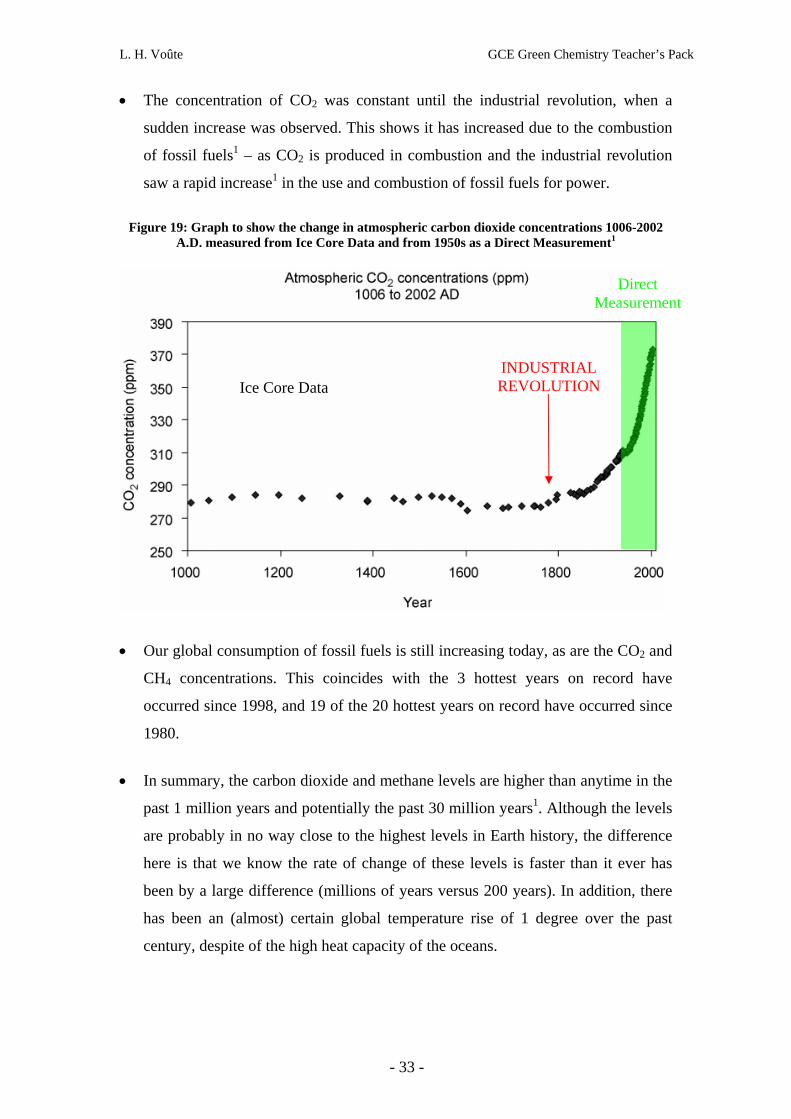
• The concentration of CO2 was constant until the industrial revolution, when a
sudden increase was observed. This shows it has increased due to the combustion
of fossil fuels1 – as CO2 is produced in combustion and the industrial revolution
saw a rapid increase1 in the use and combustion of fossil fuels for power.
Figure 19: Graph to show the change in atmospheric carbon dioxide concentrations 1006-2002 A.D. measured from Ice Core Data and from 1950s as a Direct Measurement1
Ice Core Data
Direct Measurement
INDUSTRIAL REVOLUTION
• Our global consumption of fossil fuels is still increasing today, as are the CO2 and
CH4 concentrations. This coincides with the 3 hottest years on record have
occurred since 1998, and 19 of the 20 hottest years on record have occurred since
1980.
• In summary, the carbon dioxide and methane levels are higher than anytime in the
past 1 million years and potentially the past 30 million years1. Although the levels
are probably in no way close to the highest levels in Earth history, the difference
here is that we know the rate of change of these levels is faster than it ever has
been by a large difference (millions of years versus 200 years). In addition, there
has been an (almost) certain global temperature rise of 1 degree over the past
century, despite of the high heat capacity of the oceans.
- 33 -

L. H. Voûte GCE Green Chemistry Teacher’s Pack
Figure 20: The Combined Global Land and Ocean Surface Temperature Record from 1850 to
200733
This graph further depicts the marked increase in temperature over time: 2007 was the
8th hottest year on record, 1998, 2005, 2003, 2002, 2004, 2006 and 2001 respectively
were the top 733. What is clear is the difference between anthropogenic and natural
climate change. There are variations in the climate, and CO2 and CH4 levels over
hundreds of thousands of years. However we have never before seen fast a change
over such a short period of time. The Intergovernmental Panel on Climate Change
(IPCC) was set up to evaluate the risk of climate change and make suggestions to
attenuate those risks. The panel concluded:
"Most of the observed increase in globally averaged temperatures since the mid-20th
century is very likely due to the observed increase in anthropogenic greenhouse gas
concentrations."34
"From new estimates of the combined anthropogenic forcing due to greenhouse gases,
aerosols, and land surface changes, it is extremely likely that human activities have
exerted a substantial net warming influence on climate since 1750."34
However, some scientists, such as the European Science and Environment Forum,
disagree that the observed climate change is caused by human activity as the climate
historically has been shown to fluctuate, prior to the onset of industry in modern
times. In addition, the models (and assumptions within them) used has caused
disagreement.30
- 34 -

L. H. Voûte GCE Green Chemistry Teacher’s Pack
3.3.3. Global Warming Potential
The Global Warming Potential (GWP) of a greenhouse gas is the ratio of global
warming per unit mass of the greenhouse gas to the global warming of CO2 per unit
mass35. It is therefore a measure of the relative strength of the greenhouse gas in
causing global warming.
Table 5: Table to show the GWP and lifetime in the atmosphere of selected greenhouse gases Global Warming Potential36
Greenhouse Gas Lifetime
(years)35 20 Years 100 Years 500 Years
Carbon Dioxide 1 1 1
Methane 12 62 23 7
Nitrous Oxide 114 275 296 156
CFC-1135 55 4500 3400 1400
CFC-12 116 7900 8500 4200
3.3.4. Carbon Neutral, Biofuels and Carbon Footprint
Carbon neutral refers to “an activity that has no net annual carbon (greenhouse gas)
emissions to the atmosphere”. For example:
• Bio-ethanol is in theory carbon neutral, as it is made from growing crops, mainly
corn and sugar cane, which takes its carbon from eh carbon dioxide in the air. This
carbon then is used to from the ethanol. When combusted the ethanol forms
carbon dioxide again – so there are no net emissions. It produces the same amount
of CO2 as it takes in from photosynthesis when growing. However, energy is
required to grow the crops (plant and harvest) and then to convert them to ethanol.
Fertiliser and pesticides are also required to grow the crops, however, they are
pollutants. In addition, the crops required for bio-ethanol could compete for land
with other food crops and grazing land for animals, as well as destroying natural
habitats and reducing biodiversity. It could even encourage deforestation.37
“It remains unclear if the total carbon footprint of bioethanol is actually less
than that of fossil fuels”
• The same principles above can be applied for carbon-neutral petrol and bio-diesel,
which is a mixture of methyl esters of long chain carboxylic acids.
- 35 -

L. H. Voûte GCE Green Chemistry Teacher’s Pack
• Bio-diesel (again, carbon neutral) is made through a transesterification reaction of
vegetable oils with methanol and a catalyst, such as potassium hydroxide38. The
source of the oil is usually rapeseed, palm or soybean. In the U.K. rapeseed is by
far the largest source of oil for producing biodiesel.39
The three main methods of producing biodiesel are39:
• Base-catalysed transesterification of the oil – Most common as most cost-
efficient, requires the lowest temperatures and has 98% conversion
• Acid-catalysed transesterification of the oil
• Reaction of the oil to from its fatty acids, and then reacting on to form
biodiesel
The reaction is as follows39, with the esters formed being the biodiesel itself.
• Hydrogen is also a carbon neutral fuel – it can be used in hydrogen fuel cells,
which uses oxygen as the oxidant.
• Methanol can be made by reaction of carbon monoxide with hydrogen. CO and H2
are collectively called syngas and commercially produced by reacting methane
with water or a limited supply of oxygen.
OHCH2HCO 3
OAl ZnO,Cu,
2
32
→+
The modern-day catalyst for this reaction produces high selectivity and is a
mixture of copper, zinc oxide and aluminium oxide, at 50-100 atm of pressure at
2500C.40 This is a carbon neutral process as any CO produced when combusting
natural gas can be reclaimed to produce methanol – so there are no net carbon
emissions into the atmosphere.
- 36 -

L. H. Voûte GCE Green Chemistry Teacher’s Pack
Biofuels
A biofuel is a fuel made from a living things or the waste produced by them, and so is
renewable and potentially carbon neutral41. However this is debatable for the reasons
given in the argument for bio-ethanol. A second-generation of biofuels is begin
developed, which will use the cellulose found in plants and will potentially be more
efficient, requiring fewer plants and fuels can be created from a greater range of plants
and plant waste41, reducing the loss if biodiversity that production of biofuels causes.
The living things that can produce biofuels include41:
• Wood
• Biogas (methane) from animal excrements
• Ethanol and diesel made form plants and plant waste
Carbon Footprint
“A Carbon Footprint is a measure of the impact our activities have on the
environment in terms of the amount of greenhouse gases we produce. It is measured
in units of carbon dioxide.”42
3.3.5. Controlling Global Warming and the Kyoto Protocol
As can be seen from the above discussion, the emissions of greenhouse gases and
pollutants from anthropogenic sources leads to increased atmospheric concentrations
of these gases and hence causing ozone destruction, air pollution, acid rain, and
almost certainly global warming.
Therefore, it is important that we as a society control these emissions to minimise
climate change resulting from global warming. Possible solutions to reduce the CO2
levels and emissions are:
• Carbon capture and storage: this involves the removal of waste carbon dioxide.
The CO2 can either be captured post-combustion of fossil fuels from power
stations by removal from the flue gases. The technology required for this is
already in place for other applications. It can also be removed pre-combustion by
separating natural gas (CH4) into H2 and CO (collectively called syngas) through
- 37 -

L. H. Voûte GCE Green Chemistry Teacher’s Pack
partial oxidation. Then the CO is further oxidised through the water-gas shift
reaction ( 222 HCOOHCO +→+ ) into CO2, which is then captured. The H2 then
goes on to be used as a fuel in combustion and is cleaned of carbon. The CO2 can
be transported through corrosion resistant pipelines – which are already in place
for the transport of oil and natural gas. It can then either be converted into a liquid
to be injected deep into the oceans; or stored as a gas in empty oil and gas fields
and saline formations; or by reacting it with metal oxides; it will form stable solid
carbonate minerals.43
• Encouraging the more economical use of fuels; such as turning off lights when not
in the room and turning off computers and TVs when not in use, reducing the
amount of vehicles on roads by promoting public transport and by posing ‘green
taxes’ companies might be encouraged to combine lorry loads.
• Through the use of alternative fuels, such as hydrogen, wind power, solar power,
wave power, HEP and tidal power; we would be burning fewer fossil fuels and
therefore reducing the amount of CO2, VOCs and NOx’s emitted into the
atmosphere.
• By planting more vegetation there would be increased photosynthesis which
would remove carbon dioxide from the atmosphere.
Kyoto Protocol
Our progress in reducing greenhouse gas emissions can be enforced and monitored
through initiatives such as the Kyoto protocol.
• The Kyoto protocol is an agreement signed in 1997 by at least 55 developed
countries pledging to cut greenhouse gas emissions to 5% below 1990 levels by
2008-2012.44
• The greenhouse gases they aim to reduce are: CO2 (carbon dioxide), CH4
(methane), HFCs (hydrofluorocarbons), PFCs (perfluorocarbons) and SF6 (sulphur
hexafluoride).44
• Each country had its own specific target, for example EU countries pledged to cut
emissions by 8% and Japan by 5%.44
• It does not require developing countries to cut emissions.44
• The US has currently not agreed to the protocol, claiming it will significantly
affect their economy.44
- 38 -

L. H. Voûte GCE Green Chemistry Teacher’s Pack
• However many sceptics say the agreement is almost futile without US support as
they are the world’s largest emitter of greenhouse gases, in addition to the fact
developing countries (increasing polluters as they are currently going through
their own industrial revolution) do not have to cut emissions. Additionally, the
aim to reduce greenhouse gases by 5% is claimed to be no way near enough
according to many climate scientists, and about 60% cuts are required to avoid the
risks global warming presents.44
- 39 -

L. H. Voûte GCE Green Chemistry Teacher’s Pack
4. Recycling

L. H. Voûte GCE Green Chemistry Teacher’s Pack
4. Recycling
4.1. Why Recycle
The world’s resources, such as metals and oil, are running out and finite (non-
renewable), so in order to continue to make use of these valuable substances waste
prevention has to be considered. There are also other social, economical and
environmental problems posed by waste such as where it is stored, inefficient use of
resources, the expense of disposal and creating new products from raw materials,
health risks and risks to the environment61. For example, landfill sites release
greenhouse gases (especially methane) and other toxic gases, waste can turn toxic and
local habitats are destroyed. By not recycling wood-based products deforestation
increases49, this leads to an acceleration of global warming and destruction of
ecosystems. To help deal with these issues, society, industry and governments
encourage people and companies to reduce, reuse and recycle their waste and products
they no longer need. There is an ongoing effort to change to renewable resources and
to reduce waste.
Recycling is defined as45:
“A resource recovery method involving the collection, separation, and
processing to specification of scrap materials and their use as raw materials
for manufacture into new products.”
Image taken from: http://www.unpluggedliving.com/wp-content/uploads/2007/08/recycling-image-small.jpg
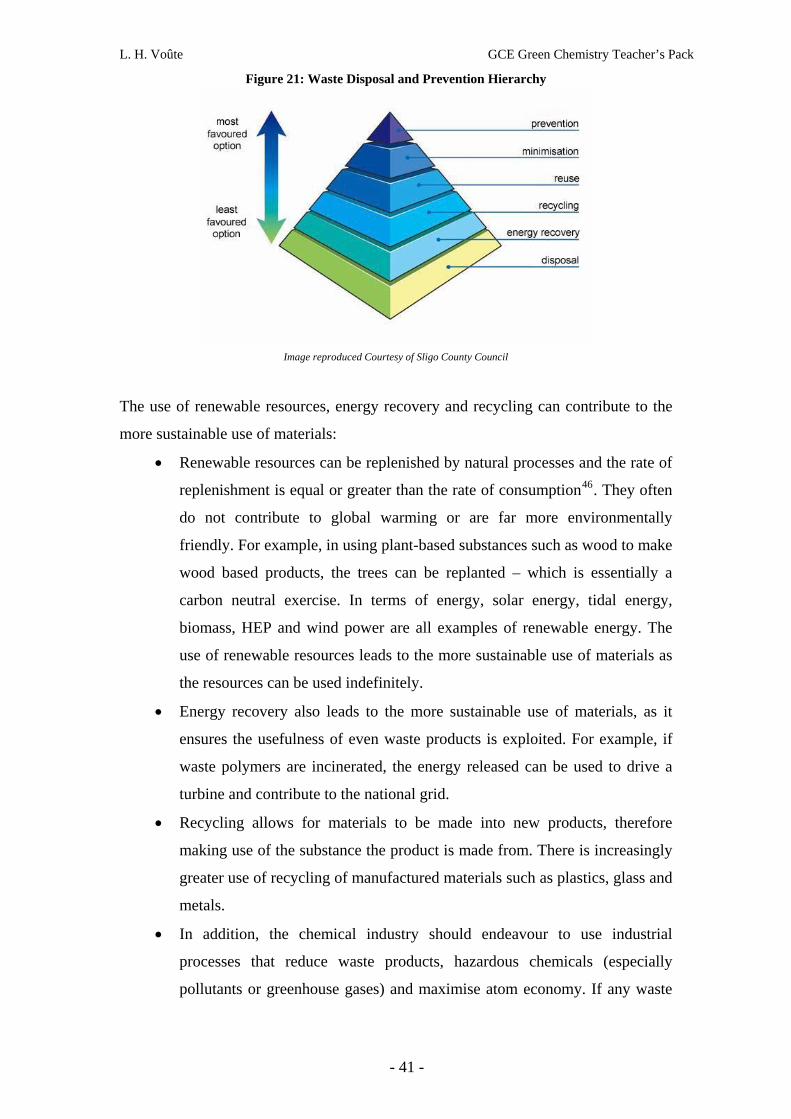
There is a widely-accepted hierarchy for waste disposal61 as depicted in Figure 21. As
can be seen the most preferred solution is prevention – so not to use that material, or
reduction of its use. Disposal is the least favoured option as it doesn’t make use of any
of the materials’ properties.
- 40 -
L. H. Voûte GCE Green Chemistry Teacher’s Pack
Figure 21: Waste Disposal and Prevention Hierarchy
Image reproduced Courtesy of Sligo County Council
The use of renewable resources, energy recovery and recycling can contribute to the
more sustainable use of materials:
• Renewable resources can be replenished by natural processes and the rate of
replenishment is equal or greater than the rate of consumption46. They often
do not contribute to global warming or are far more environmentally
friendly. For example, in using plant-based substances such as wood to make
wood based products, the trees can be replanted – which is essentially a
carbon neutral exercise. In terms of energy, solar energy, tidal energy,
biomass, HEP and wind power are all examples of renewable energy. The
use of renewable resources leads to the more sustainable use of materials as
the resources can be used indefinitely.
• Energy recovery also leads to the more sustainable use of materials, as it
ensures the usefulness of even waste products is exploited. For example, if
waste polymers are incinerated, the energy released can be used to drive a
turbine and contribute to the national grid.
• Recycling allows for materials to be made into new products, therefore
making use of the substance the product is made from. There is increasingly
greater use of recycling of manufactured materials such as plastics, glass and
metals.
• In addition, the chemical industry should endeavour to use industrial
processes that reduce waste products, hazardous chemicals (especially
pollutants or greenhouse gases) and maximise atom economy. If any waste
- 41 -

L. H. Voûte GCE Green Chemistry Teacher’s Pack
products are produced, they should be able to be degraded into safe
substances in the environment, or recycled.
Atom economy is also important in waste prevention. Atom economy is how many
reactant atoms end up in the desired product as compared to waste products and other
by-products47. Percentage atom economy is defined as:
100 UsedReactants theall ofWeight Molecular
Product Desired ofWeight Molecular Economy Atom % ×=
This is a more useful parameter than yields when considering green chemistry.
Although it is important to maximise the yield, atom economy is a better way of
measuring efficiencies between different reactions that have the aim of forming the
same product61. It can provide an extra diagnostic tool in measuring reaction
efficiencies and can sometimes compensate for low yields or poor selectivity. The
chemical industry is encouraged to use this concept when deciding on reaction type
for the production of polymers and medicines. For example, if a lot of CO2 is
produced as a by-product with a low atom economy then this is a disfavoured
reaction.
Catalysts can be used to lower the energy demand of a reaction, and reduce CO2
emissions from burning of fossil fuels.48 Catalysts can be used to make a reaction
have a better atom economy or allow a different reaction to be used with fewer waste
products and better atom economy.
4.1.1. Household Waste
In 2003/04, UK households produced 30.5 million tonnes of rubbish, and only 17% of
that was recycled. This is low compared to some other EU countries: some recycle
50% of their household waste. 60% of rubbish that goes into household bins could be
recycled and up to 50% of waste in household bins could be composted.49
- 42 -

L. H. Voûte GCE Green Chemistry Teacher’s Pack
Figure 22: Pie Chart to Show the Average Constituents of Household Waste50
Paper and Board 18%
Dense Plastic 4%
Plastic Film 3%
Garden Waste 21%
Other Combustibles
1%Kitchen Waste
17%
Fines 3% Soil and Other Organics 3%
Nappies 2%Wood 5%Glass 7%
Miscellaneous Non-
Combustibles 5%
Metal Packaging 3%
Scrap Metal/White Goods 5%
Textiles 3%
4.1.2. Aluminium and Steel
In the UK, aluminium and steel are amongst the most common metal used. Despite
the fact that per capita consumption of steel has dropped since the 1970s, the
consumption of aluminium is still growing51. Global production of aluminium
averages to about 24 million tonnes per year and for steel 1.05 billion tonnes in 2004,
an increase on 2003 of 8.8% (and excluding china an increase of 4.5%)51. This
enormous production volume and requirement for aluminium and steel clearly causes
waste disposal issues when the metal products are no longer needed. Waste metal
makes up 8% of household waste, yet only roughly a third of metal waste is currently
recycled51. An advantage of recycling metals is that they never loose their properties
no matter how many times they are recycled.
Table 6: Advantages and Disadvantages of Recycling versus Extracting Metals Pro-Recycling Scrap Metal Pro-Extraction of Metals
Metal ore’s are non-renewable and therefore will eventually run out – recycling will prevent this
Sometimes through the extraction of metals one can obtain a much purer metal than one could through recycling
Less disruption to the landscape as not quarrying. When quarrying for metals it makes large unsightly scars on the landscape. In addition, it can pollute rivers, and produces a lot of dust which can pollute the air; contributing to global dimming and respiratory diseases52
• When considering the energy required to recycle the metal, one is not considering the energy required to collect all the scrap metal from different recycling points (e.g. recycling banks and kerb-side)
- 43 -
L. H. Voûte GCE Green Chemistry Teacher’s Pack
Extracting metals can also damage the habitats and local ecosystem of where the extraction is taking place
• Therefore, the energy required to transport all the scrap metal to the recycling plant, and to sort the metals may require more than extraction of metals
Ore’s are often located in remote mountainous regions52, so it is expensive to:
• Transport the machinery to the region • Transport the ore to the extraction plant • Hire workers and house them, as not many people would
live in the area and potentially there is no housing/infrastructure
• It would also be difficult to find workers to extract the metals
It is difficult to organise and implement an efficient recycling scheme as it requires households, industry and companies to all contribute to the UK’s new metal supply. Different councils organise this in different ways, operating recycling banks or kerb-side pick up. However, this can be inefficient with not all the household’s metal being recycled and difficult to separate the waste
Reduces the waste entering landfill sites: fewer/smaller landfill sites are required as metals are not going into it. This also reduces disposal costs53. It also reduces the number of dumped cars53
Not using up valuable resources: saving the metal ores and saving resources and chemicals required in the manufacturing process53
In extraction, in order to obtain the pure metal from it’s ore it needs to be reduced. By recycling, one it not using up expensive reducing agents, such as titanium metal. If carbon (as coke or charcoal) is used, this is using up another finite resource which also is polluting. If reducing the metal through electrolysis this is also expensive
The recycling process creates jobs53
One of the major deciding factors is how much energy is required to recycle compared to how much energy is used in extracting the metal: in almost all cases, it requires much less energy to recycle the material as can be seen from the examples of steel and aluminium below
All steel cans are 100% recyclable51
All steel products can be recycled indefinitely (apart from aerosol cans) so waste disposal problems are reduced
Recycling 1 tonne steel has the following environmental benefits51:
• Saves 1.5 kg of iron ore • Saves 0.5 kg of coal • Saves 40% of water usage • Carbon dioxide is emitted when making steel from iron
ore. As this is a greenhouse gas, this contributes to global warming and climate change. Recycling 1 tonne of steel scrap saves 80% of the CO2 emissions produced
• Saves 1.28 tonnes of solid waste • Reduces air emissions by 86% (as not processing steel
from iron ore) • Reduces water pollution by 76% • Saves 75% of the energy needed to make steel from iron
- 44 -
L. H. Voûte GCE Green Chemistry Teacher’s Pack
ore
Recycling 1 tonne aluminium has the following environmental benefits51:
• Saves 6 tonnes of bauxite (aluminium’s ore)51 • Saves 4kg of chemical products, as they are not required
to extract aluminium from its ore • Produces only 5% of the CO2 emissions compared with
extracting the metal • Aluminium can be recycled indefinitely, as reprocessing
does not damage its structure. • Aluminium is the most cost effective material to recycle • Saves 95% of the energy required to extract aluminium
In the extraction of copper the following damaging environmental effects occur:
• “The waste from crushing has to be removed • The land where the open mine is becomes devastated • The waste from froth flotation, called tailings, has to be
removed • Sulfur dioxide from smelting can cause acid rain”52 • Electrolysis is required to extract the copper which is an
expensive process52
Scrap iron can also be used in a displacement reaction to extract aqueous solutions of copper54. This is advantageous as:
• A lot less energy is required than the traditional method of high-temperature reduction of copper oxide with carbon – saving money and fossil fuels.
• CO2 is not being formed - which would be released into the atmosphere, contributing to global warming - from the reduction and from using fossil fuels for energy to heat up the reaction mixture for the reduction
• Scrap iron is reused and so isn’t immediately taking up space in a landfill site
Issues Involved in the Recycling of Iron and Steel
The following steps are taken when recycling scrap metals:
• Collection of scrap metals: Metals are either collected kerbside from
household waste or at recycling collection points56. Here, people are asked to
separate their waste into types (paper, metal and glass). All the waste metal is
then transported to a central recycling plant.
- 45 -
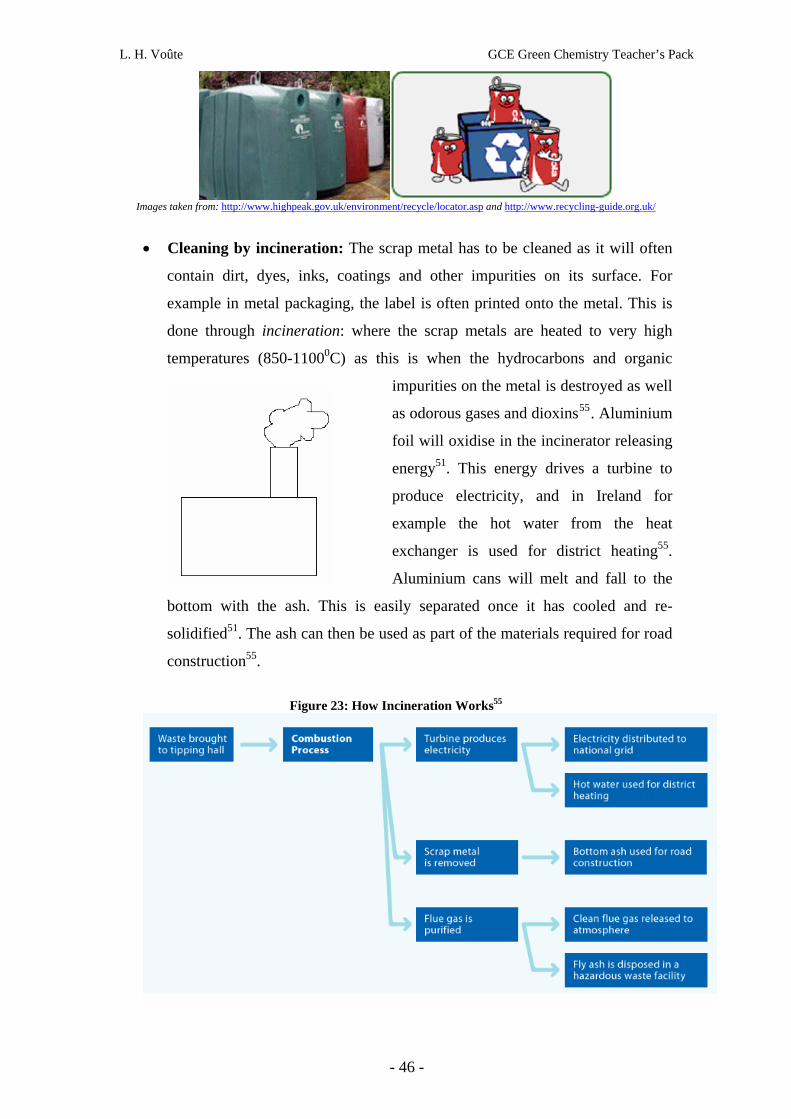
L. H. Voûte GCE Green Chemistry Teacher’s Pack
Images taken from: http://www.highpeak.gov.uk/environment/recycle/locator.asp and http://www.recycling-guide.org.uk/
• Cleaning by incineration: The scrap metal has to be cleaned as it will often
contain dirt, dyes, inks, coatings and other impurities on its surface. For
example in metal packaging, the label is often printed onto the metal. This is
done through incineration: where the scrap metals are heated to very high
temperatures (850-11000C) as this is when the hydrocarbons and organic
impurities on the metal is destroyed as well
as odorous gases and dioxins55. Aluminium
foil will oxidise in the incinerator releasing
energy51. This energy drives a turbine to
produce electricity, and in Ireland for
example the hot water from the heat
exchanger is used for district heating55.
Aluminium cans will melt and fall to the
bottom with the ash. This is easily separated once it has cooled and re-
solidified51. The ash can then be used as part of the materials required for road
construction55.
Figure 23: How Incineration Works55
- 46 -

L. H. Voûte GCE Green Chemistry Teacher’s Pack
• Sorting the metal by magnetic properties: Scrap metal is either ferrous or
non-ferrous. Ferrous means it contains iron (and so is magnetic) – so this
includes iron and steel. Non-ferrous scrap metal is everything else; for
example, aluminium, nickel, copper, lead, and precious metals.51 This
magnetic property (they are ferromagnetic or permanent magnets) of ferrous
metal allows the two groups two be easily separated and sorted: giant magnets
are used to attract ferrous scrap metal56 (iron and steel) and the non-ferrous
metal (and other waste) is left behind for further separation. This allows the
iron and steel to go on and be easily cleaned by the incinerator (if it hasn’t
already) and re-melted to turn it into ingots (large blocks) of iron or steel49.
Images taken from: http://www.wasterec.co.uk/metals.html
• Adjusting the composition of new steel: the molten iron is analysed just
before being re-added to the furnace. If the composition of the steel has to be
changed, the oxygen supply (how long and how much) is altered, and
sometimes some pure metal is added in small amounts to alter the
composition57, as it can oxidise the different components in steel.
• Scrap is used to adjust the temperature of the furnace: To decrease the
temperature of the molten metal in the furnace, more scrap iron is added,
which cools it down. To increase the temperature maybe increased by
increasing the oxygen supply passing over the burners, or adjust the
hydrocarbon fuel supply to the burners or adjusting the temperature of the
“regenerated heat from the checkers”.58
• Thereafter, the molten
iron or steel is allowed to
cool into ingots and sent
to mills where the ingots
- 47 -
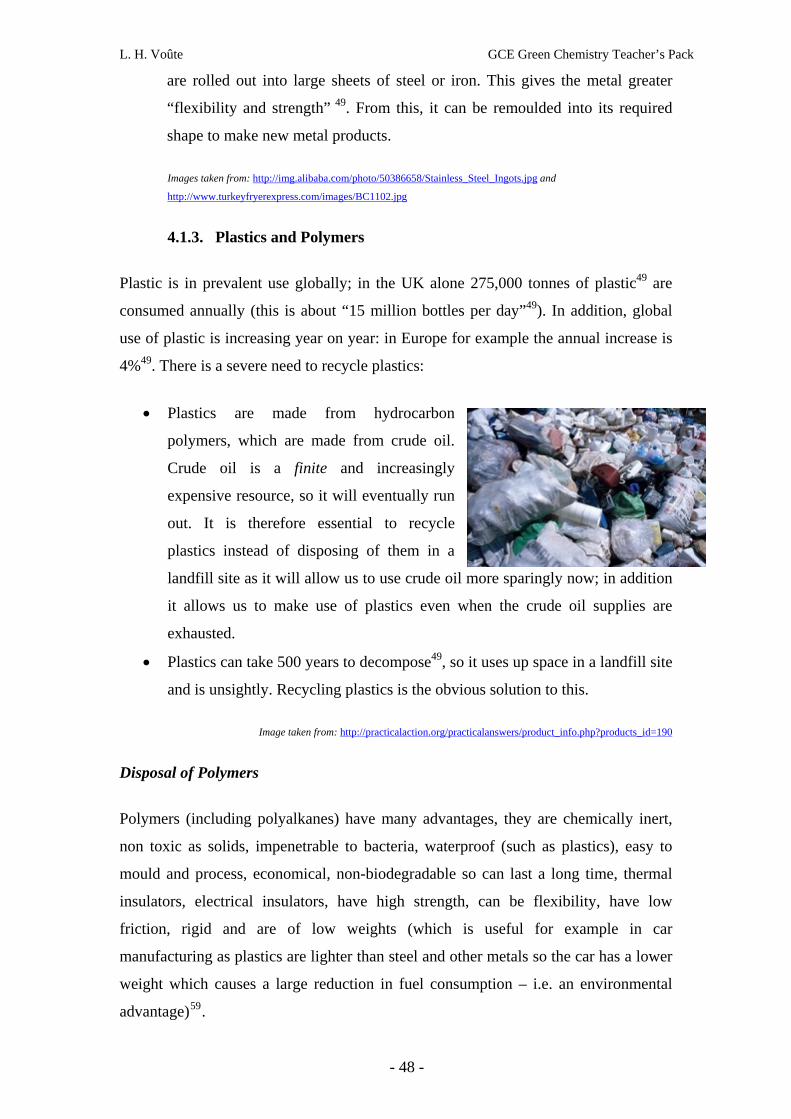
L. H. Voûte GCE Green Chemistry Teacher’s Pack
are rolled out into large sheets of steel or iron. This gives the metal greater
“flexibility and strength” 49. From this, it can be remoulded into its required
shape to make new metal products.
Images taken from: http://img.alibaba.com/photo/50386658/Stainless_Steel_Ingots.jpg and
http://www.turkeyfryerexpress.com/images/BC1102.jpg
4.1.3. Plastics and Polymers
Plastic is in prevalent use globally; in the UK alone 275,000 tonnes of plastic49 are
consumed annually (this is about “15 million bottles per day”49). In addition, global
use of plastic is increasing year on year: in Europe for example the annual increase is
4%49. There is a severe need to recycle plastics:
• Plastics are made from hydrocarbon
polymers, which are made from crude oil.
Crude oil is a finite and increasingly
expensive resource, so it will eventually run
out. It is therefore essential to recycle
plastics instead of disposing of them in a
landfill site as it will allow us to use crude oil more sparingly now; in addition
it allows us to make use of plastics even when the crude oil supplies are
exhausted.
• Plastics can take 500 years to decompose49, so it uses up space in a landfill site
and is unsightly. Recycling plastics is the obvious solution to this.
Image taken from: http://practicalaction.org/practicalanswers/product_info.php?products_id=190
Disposal of Polymers
Polymers (including polyalkanes) have many advantages, they are chemically inert,
non toxic as solids, impenetrable to bacteria, waterproof (such as plastics), easy to
mould and process, economical, non-biodegradable so can last a long time, thermal
insulators, electrical insulators, have high strength, can be flexibility, have low
friction, rigid and are of low weights (which is useful for example in car
manufacturing as plastics are lighter than steel and other metals so the car has a lower
weight which causes a large reduction in fuel consumption – i.e. an environmental
advantage)59.
- 48 -

L. H. Voûte GCE Green Chemistry Teacher’s Pack
However, a drawback of polymers is that as they are chemically inert, they are
therefore non-biodegradable, so disposal of waste polymers becomes a problem. They
can’t be left to degrade over time as they would just pollute the landscape, visually
and through leeching it can pollute the environment and the air. In addition, they are
made from crude oil which is a non-renewable fossil fuel. Obviously this will
eventually run out so as a society we have to ensure to recycling the raw material to
make the most use out of it as possible.
Today, there is an increased political and social desire to:
• Reduce waste plastic
• Recycle waste plastic to produce lower grade products or chemical feed
stocks
• Or to use waste plastic for energy production (via incineration – see Table 7
below)
In the lifecycle of a polymer (manufacture use recycle/dispose) two things
important when applying green chemistry60:
• “Minimising the hazardous waste during production of raw materials and
their resulting polymers to reduce any negative impact on the
environment”60 – this is done through careful selection of raw materials, the
synthetic route and ensuring any hazardous or environmentally unfriendly
by-products are safely removed.
• “Reducing carbon emissions resulting from the ‘life cycle’ of a polymer”60 –
this is done by recycling and avoiding landfilling (which releases methane),
degradation to CO2 and H2O, or incineration (both of which release CO2).
Table 7: Table to illustrate different Methods of Disposal of Polymers and their respective Advantages and Disadvantages
Method of Disposal Advantages Disadvantages
Reuse • This is the best method as it
doesn’t require any extra energy
to change it into a different
polymeric product, and no
resources are used up
• The lifetime of the product is
• Once the product has served
its purpose or is no longer
usable, it needs to be disposed
of somehow
• Usually cannot reuse
indefinitely
- 49 -

L. H. Voûte GCE Green Chemistry Teacher’s Pack
increased
• The product does not fill up a
landfill site or pollute the air
through incineration
Mechanical Recycling
to Lower Grade
Products & Chemical
Recycling to
Monomers61
• Doesn’t use up more crude oil
and our natural resources
• Reducing the environmental
impact through not drilling for
oil
• Saves energy as not required to
separate crude oil into fractions
and make polymers from the
fractions
• Not using up landfill sites –
reduces the amount of waste
requiring disposal
• Lower manufacturing costs for
products made from recycled
rather than raw materials
• Creates jobs
• Chemical recycling involves
breaking the polymer down to
its original monomers again. So
there is a change in the chemical
structure of the material, but the
new substance the original
material again, hence
maintaining the quality e.g.
nylon carpet recycling62. There
is the advantage that the new
“virgin” polymer has a higher
value than their mechanically
recycled equivalents61.
•
• Chemical recycling produces
chemical feed stocks which can
be used for cracking in the
production of plastics and other
• Collection, transportation and
processing costs of
recycling63
• Not all polymers can be
recycled. The main types
re:
nsity and low
)
which can a
- PTFE
- Polythene (PE) – both
high de
density
- Poly(propene) (PP
- Polystyrene (PS)
- Polyvinyl chloride (PVC)
• These different types (which
are collected altogether) have
to be separated. This is to
ensure they remain pure and
the resulting material is the
best possible quality material
with the required properties is
produced64. This separation
into types is very challenging
Finding uses for mixed
plastics is another difficulty64
• Separation of plastics is even
more complicated today as
multi-layer packaging (where
different types of plastic are
fused into one product) is
become more common64. In
addition another substance is
often fused into the material
(a composite) to ensure it has
- 50 -

L. H. Voûte GCE Green Chemistry Teacher’s Pack
chemicals
• Increased public awareness and
consumer participation
a certain property, e.g.
ed
on to and from the
from the waste
strength65
• The markets for recycl
materials can be unstable63
• Recycling plants can have
negative environmental
impacts as they are unsightly,
provide noise pollution and
air pollution due to
transportati
facilities63
• Energy recovery through
incineration is a less viable
option as combustible
materials (such as paper and
polymeric materials) are
removed
stream63
Degradation
Figure 24: Biodegradable Pl na t
66neutral
• Condensation polymers may be
photodegradable due to the
carbonyl C=O bond which
absorbs radiation, and t
•
Pots made from Corn Starch
e the process is car
here
her
ers do not
cle it
onomers and
isonous to
• By creating biodegradable
polymers, which can decompose
by microbes or light; they can
be composted and degrade over
b
a relatively short period of time
• They are produced by
renewable resources i.e.
isoprene, maize and starch – so
in essenc bon
contribute to global warming
• Most biodegradable polymers
currently break into smaller
chains, m
fore
fragments
can break
• Condensation polymers
(polyesters or polyamides)
may be hydrolysed at the ester
or amide group as part of the
degradation process, t efore
certain organisms
• Currently the Food and Drug
Administration prohibit the
use of biodegradable
polymers as they could
contaminate food (due to
they are biodegradable
• Biodegradable polym
give off toxic fumes
• Not recovering the raw
material so can not recy
ack into a new product
• The aim is that the polymer
biodegrades into CO2 and
H2O, but this would
64
Degraded polymer could
harm the local ecosystem and
environment, and is unknown
as yet whether it does or is
toxic64, e.g. it could leech into
the soil and be po
- 51 -

L. H. Voûte GCE Green Chemistry Teacher’s Pack
• Not particularly visually
polluting r the microbes in
them decomposing due to
light o
food)64
Incineration
turbine and c
u
material and bacteria
valuable organic
and CO2 and CO is
vent
used in road
operating and set-up
ted
• Not using up landfill sites
• Can use the energy evolved to
drive a reate
resource
• Contributes to global
warmingelectricity
• Reliable, safe and efficient
• Destroys potentially nsafe
released
• Toxic fumes are given off and
have to be cleaned to pre
• Destroying
polluting the atmosphere
• Ash must be sent to a landfill
and may be toxic. Although it
can be
surfacing55
• High
costs
• Waste water is crea
Landfill
• Inexpensive compared to other
e for
• Wastes resources
• Causes visual pollution, noise
pollution, air pollu
waste disposal options67
• Almost all waste is suitabl
ch as ash
not cause v
relatively empty landfill sites
tion and
nd
ding ground for
increasingly
of
a
landfill67
• Offers sometimes the only
possible method of disposal
once all other routes are
exhausted: su from pathogens
• The sites use up valuable
space in an
incinerators67
• Nowadays sites are developed
to cover the landfill so pollution
is minimised and landfill gas
can be trapped – which is a
useful low-level polluting fuel67
• Therefore new, well-designed
landfills do isual
populated world
• Sites developed before
legislation on covering and
preventing pollution are a
huge source of pollution with
unrestrained leakages
pollution67
• Old landfills allow wildlife to
repopulate on the restored land67
• There are still many large and 67
source of air pollution
• Due to overpopulation in
areas (e.g. urban), there is no
takes up land space
• Releases unpleasant a
potentially harmful odours
• Is a bree
landfill gas and leaching67
• Open landfill sites which are
currently being filled are
- 52 -

L. H. Voûte GCE Green Chemistry Teacher’s Pack
space for landfill sites.
However this is where a large
majority of waste is
generated. So there are high
transport costs (and hence
pollution) to transfer the
waste to landfill sites further
ot
efore not
o an increase in
recycling
afield67
• Despite collecting landfill gas,
a landfill site is the least
energy efficient method of
waste disposal. It requires a
lot of energy and the energy
stored in waste products is n
released to its full extent67
• Despite old landfills
providing areas of open space,
they often leach toxins hence
providing uninhabitable and
potentially dangerous land. 67
Farmers can also ther
use is to grow crops
• Currently the appeal of
landfill sites is its versatility,
low cost and ease of use. This
deters further use and
advances in other, more
innovative waste disposal
methods. However the EU
Landfill Directive and
Landfill Tax will shortly
make landfilling a much more
expensive option67, hopefully
leading t
Environmental damage is also minimised by removal of toxic waste products: such as
when incinerating halogenated polymers (such as PVC – polyvinyl chloride) as waste
products, HCl is formed – which has to be removed (by neutralisation) otherwise it
- 53 -
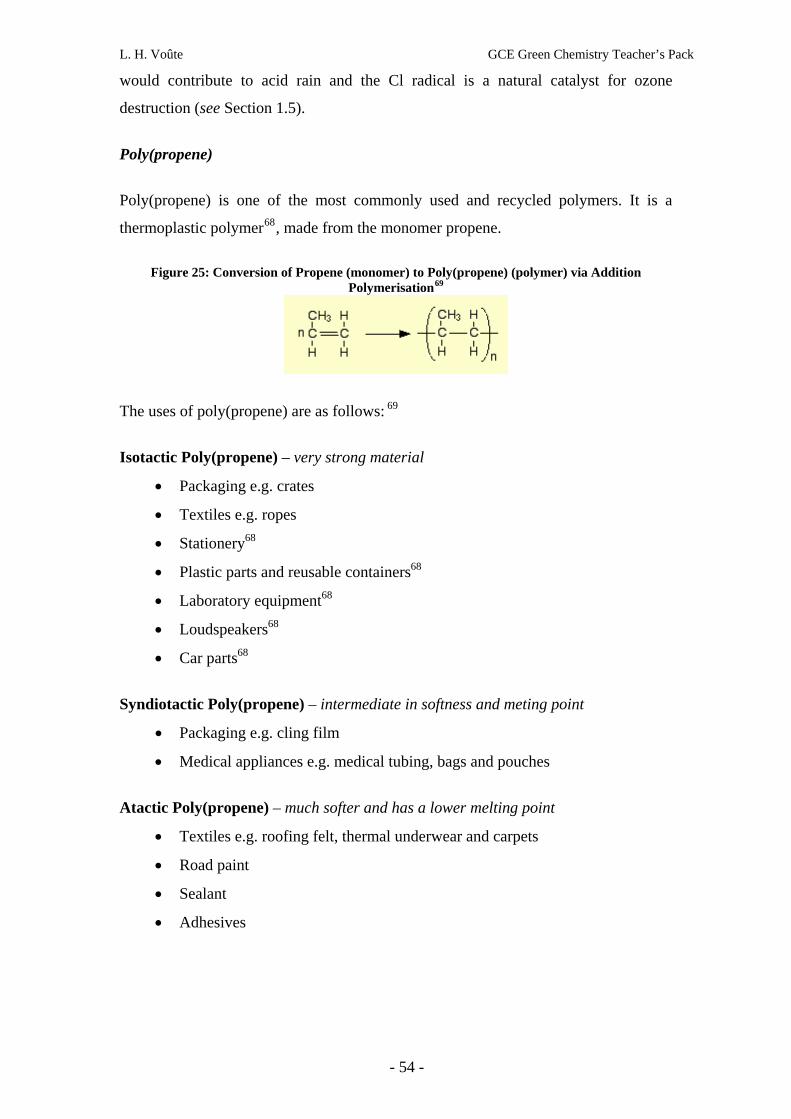
L. H. Voûte GCE Green Chemistry Teacher’s Pack
would contribute to acid rain and the Cl radical is a natural catalyst for ozone
destruction (see Section 1.5).
Poly is a
thermoplastic polymer68, made from the monomer propene.
Figure 25: Conversion of Propene (monomer) to Poly(propene) (polymer) via Addition Polymerisation69
Poly(propene)
(propene) is one of the most commonly used and recycled polymers. It
The uses of poly(propene) are as follows: 69
– very strong material
68
• Laboratory equipment68
Syndiotactic Poly(propene) – intermediate in softness and meting point
– much softer and has a lower melting point
. roofing felt, thermal underwear and carpets
• Road paint
• Sealant
• Adhesives
Isotactic Poly(propene)
• Packaging e.g. crates
• Textiles e.g. ropes 68• Stationery
• Plastic parts and reusable containers
• Loudspeakers68
• Car parts68
• Packaging e.g. cling film
• Medical appliances e.g. medical tubing, bags and pouches
Atactic Poly(propene)
• Textiles e.g
- 54 -

L. H. Voûte GCE Green Chemistry Teacher’s Pack
5. Lesson Plans and
Resources

L. H. Voûte GCE Green Chemistry Teacher’s Pack
5. Lesson Plans and Resources Based upon the AQA AS and A Level Specification for teaching in 2008
These lesson plans have been created with the AQA GCE specification in mind.
However, the activities and resources suggested can be used for any of the
specifications and a lesson plan can be chopped and mixed with the others depending
on how you as a teacher see fit, and how it fits in with your teaching methods and
timetabling. Especially as the AQA specification attaches the green chemistry topic to
where it is relevant, instead of grouping it altogether as one; you may want to do the
same with the lesson plans on the following pages – attach certain activities, resources
and ideas to where it links in with other chemistry in the course.
- 55 -

L. H. Voûte GCE Green Chemistry Teacher’s Pack
Lesson Plan 1 and
Resources:
AS Module 1 – Combustion of Alkanes:
Air Pollution

L. H. Voûte GCE Green Chemistry Teacher’s Pack
AS Module 1 – Combustion of Alkanes: Air Pollution
Resources to be used • Worksheets (attached) on air pollution. From:
D. Warren, Green chemistry: a resource outlining areas for the teaching of green and environmental chemistry and sustainable development for 11-19 year old students, Royal Society of Chemistry, 2001
• Video explaining photochemical smog: http://video.aol.com/video/researchlearn-global-warming-and-air-pollution/1399478
• www.airquality.co.uk – a website that monitors hourly a number of pollutants in many localities across the U.K.
Overall Picture • To explain the pollutants emitted from combustion of alkanes and
fossil fuels • To explain which ones contribute to air pollution, which one
contribute to acid rain and which ones contribute to global warming (i.e. they are greenhouse gases) – using video
• Do a worksheet on air pollution • To explain how these pollutants are removed through catalytic
converters and calcium oxide. • To explain the CO2 produced during combustion is released into
the atmosphere • To plot graphs of pollutant levels against time
Aim • To know that alkanes as well as fossil fuels, when combusted can
release a number of pollutants (NOx, CO2, CO and VOCs) into the atmosphere
• To understand that these pollutants can be removed using catalytic converters
• To understand that CO2, CH4 and H2O are greenhouse gases and may contribute to global warming
• To know that combustion of sulphur containing hydrocarbons produces SO2 which causes air pollution and can be removed from flue gases using calcium oxide
Objective • Be able to state which pollutants are formed during
combustion in an internal combustion engine • To be able to say NOx and SO2 cause acid rain • To able to state how a catalytic converter removes these
pollutants • To be able to write the equation of the removal of SO2
using calcium oxide and explain why this is done. • To able to state which gases are greenhouse gases and
that they therefore contribute to global warming
Links to AQA specification AS Module 1: 3.1.6. Combustion of Alkanes
Health and Safety Risk Assessment • Care must be taken when using a computer. Avoid straining
eyes and low light.
Starter Activity • Have the pupils each answer the true/false quiz (attached – please feel free to photocopy) on the combustion of alkanes and go
through the answers together as a class
Main Activity Refer to Section 2, page 19, for notes. • Explain that when fossil fuels and alkanes are combusted the internal combustion engine can produce a large number of pollutants:
NOx (N2 + O2 + heat NOx - i.e. NO and NO2), CO, CO2 and unburned hydrocarbons (i.e. VOCs). If the hydrocarbon contains sulphur, combustion of it leads to SO2 which causes air pollution and can cause acid rain (as well as NOx). Can use video link above to explain NOx forms ozone in the lower atmosphere, a secondary pollutant which is the main component of smog.
• Ask the students to complete one/more of the attached worksheets on air pollution. • Removal processes:
o Explain how a catalytic converter removes NOx’s and oxidises unburned hydrocarbons and CO to CO2 o Explain how calcium oxide can remove sulphur dioxide from flue gases using the equation: 32 CaSOSOCaO →+
• Explain, (ensuring the pupils make notes) that CO2, CH4 and H2O are greenhouse gases. They can all be released from combustion, and methane also from gas pipe leakage, ruminants, cows and methanogenic bacteria (see Section 2 for more details). Explain that greenhouse gases may contribute to global warming (no detail on global warming required).
Other possible activities (if time or for homework): • Go to the www.airquality.co.uk website, or more specifically use http://www.airquality.co.uk/archive/data_selector.php, and have
in pupils, individually or in small groups, to select a type of pollutant, and an area where you are interested in and plot graphs of how the pollutant levels change over the course of a day or week.
Plenary • Ask the pupils to name the pollutants formed when combusting alkanes • Ask which ones cause acid rain and which ones are greenhouse gases • Ask how they can be removed
- 56 -
L. H. Voûte GCE Green Chemistry Teacher’s Pack
True/False Quiz: Properties of Alkenes 1. Alkanes are a type of hydrocarbon True/False
2. Alkanes cannot be used as fuels True/False
3. Combustion of alkanes can be complete or incomplete True/False
4. Incomplete combustion is when there is a large supply of oxygen True/False
5. Incomplete combustion produces carbon monoxide (CO) True/False
______________________________________________________ True/False Quiz: Properties of Alkenes
es
6. Alkanes are a type of hydrocarbon True/False
7. Alkanes cannot be used as fuels True/False
8. Combustion of alkanes can be complete or incomplete True/False
9. Incomplete combustion is when there is a large supply of oxygen True/False
10. Incomplete combustion produces carbon monoxide (CO) True/False
______________________________________________________ True/False Quiz: Properties of Alken
es
11. Alkanes are a type of hydrocarbon True/False
12. Alkanes cannot be used as fuels True/False
13. Combustion of alkanes can be complete or incomplete True/False
14. Incomplete combustion is when there is a large supply of oxygen True/False
15. Incomplete combustion produces carbon monoxide (CO) True/False
______________________________________________________ True/False Quiz: Properties of Alken
16. Alkanes are a type of hydrocarbon True/False
17. Alkanes cannot be used as fuels True/False
18. Combustion of alkanes can be complete or incomplete True/False
19. Incomplete combustion is when there is a large supply of oxygen True/False
20. Incomplete combustion produces carbon monoxide (CO) True/False
______________________________________________________
- 57 -
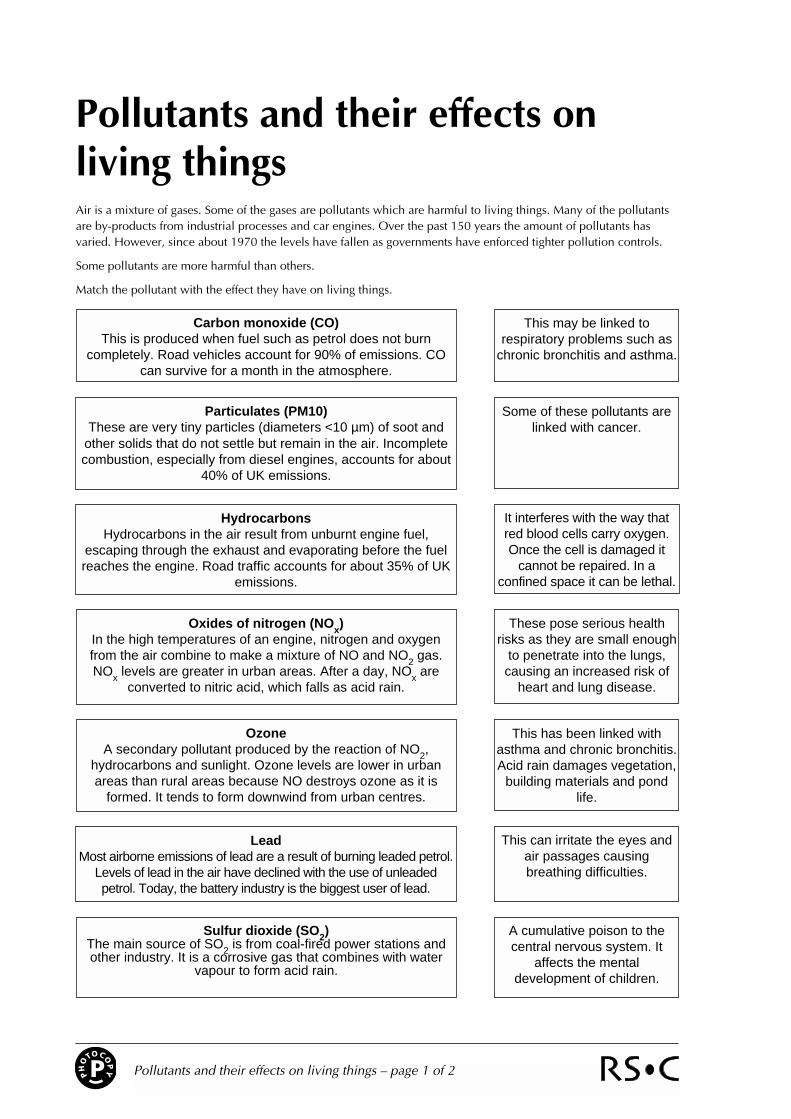
PHO
TOCOP
YP Pollutants and their effects on living things – page 1 of 2
Pollutants and their effects onliving thingsAir is a mixture of gases. Some of the gases are pollutants which are harmful to living things. Many of the pollutantsare by-products from industrial processes and car engines. Over the past 150 years the amount of pollutants hasvaried. However, since about 1970 the levels have fallen as governments have enforced tighter pollution controls.
Some pollutants are more harmful than others.
Match the pollutant with the effect they have on living things.
Carbon monoxide (CO)This is produced when fuel such as petrol does not burn
completely. Road vehicles account for 90% of emissions. COcan survive for a month in the atmosphere.
Particulates (PM10)These are very tiny particles (diameters <10 µm) of soot and
other solids that do not settle but remain in the air. Incompletecombustion, especially from diesel engines, accounts for about
40% of UK emissions.
HydrocarbonsHydrocarbons in the air result from unburnt engine fuel,
escaping through the exhaust and evaporating before the fuelreaches the engine. Road traffic accounts for about 35% of UK
emissions.
OzoneA secondary pollutant produced by the reaction of NO2,
hydrocarbons and sunlight. Ozone levels are lower in urbanareas than rural areas because NO destroys ozone as it is
formed. It tends to form downwind from urban centres.
Oxides of nitrogen (NOx)In the high temperatures of an engine, nitrogen and oxygenfrom the air combine to make a mixture of NO and NO2 gas.NOx levels are greater in urban areas. After a day, NOx are
converted to nitric acid, which falls as acid rain.
LeadMost airborne emissions of lead are a result of burning leaded petrol.
Levels of lead in the air have declined with the use of unleadedpetrol. Today, the battery industry is the biggest user of lead.
Sulfur dioxide (SO2)The main source of SO2 is from coal-fired power stations andother industry. It is a corrosive gas that combines with water
vapour to form acid rain.
This may be linked torespiratory problems such as
chronic bronchitis and asthma.
Some of these pollutants arelinked with cancer.
It interferes with the way thatred blood cells carry oxygen.Once the cell is damaged it
cannot be repaired. In aconfined space it can be lethal.
These pose serious healthrisks as they are small enough
to penetrate into the lungs,causing an increased risk of
heart and lung disease.
This has been linked withasthma and chronic bronchitis.Acid rain damages vegetation,
building materials and pondlife.
This can irritate the eyes andair passages causingbreathing difficulties.
A cumulative poison to thecentral nervous system. It
affects the mentaldevelopment of children.
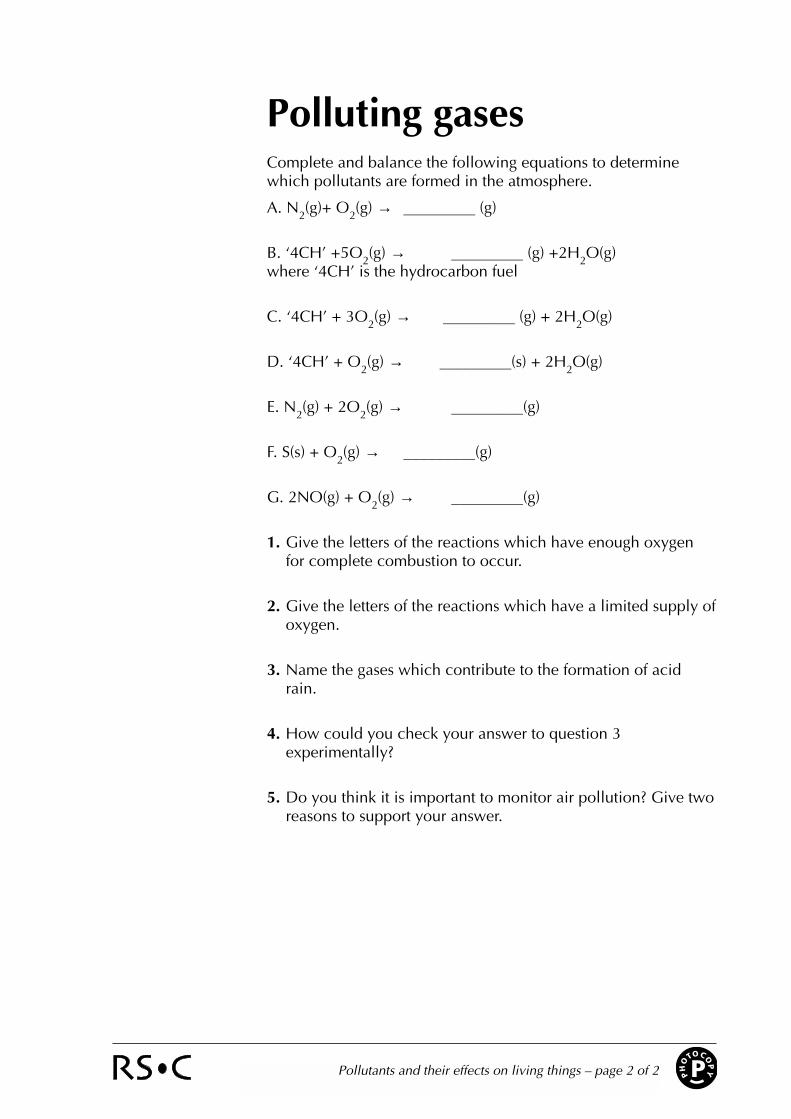
PHO
TOCOP
YPPollutants and their effects on living things – page 2 of 2
Polluting gasesComplete and balance the following equations to determinewhich pollutants are formed in the atmosphere.
A. N2(g)+ O2(g) → _________ (g)
B. ‘4CH’ +5O2(g) → _________ (g) +2H2O(g) where ‘4CH’ is the hydrocarbon fuel
C. ‘4CH’ + 3O2(g) → _________ (g) + 2H2O(g)
D. ‘4CH’ + O2(g) → _________(s) + 2H2O(g)
E. N2(g) + 2O2(g) → _________(g)
F. S(s) + O2(g) → _________(g)
G. 2NO(g) + O2(g) → _________(g)
1. Give the letters of the reactions which have enough oxygenfor complete combustion to occur.
2. Give the letters of the reactions which have a limited supply ofoxygen.
3. Name the gases which contribute to the formation of acidrain.
4. How could you check your answer to question 3experimentally?
5. Do you think it is important to monitor air pollution? Give tworeasons to support your answer.

PHO
TOCOP
YP Monitoring air pollution – page 1 of 3
Monitoring air pollutionAir pollution monitoring sites are used to collect data at regular intervals. Whenevaluating the data, it is important to know where the sites are, because pollutionlevels are different in cities and the countryside.
Urban Centre sites are located in town or city centre areas eg pedestrian precincts orshopping areas. Sampling heights are typically within 2–3 m.
Rural sites are in open country locations distanced from population centres, roads andindustrial areas.
1. Predict which air pollution monitoring site, urban or rural, will record the highestlevels of the following pollutants.
Pollutant Monitoring site Reason
NOx
Ozone O3
Fine Particles PM10*
*PM10s are particulates which have a diameter less than 10µm in diameter.
2. Carefully study the real data taken at the start of 1999 from the Leeds Urban Centresite and Narberth Rural site in Pembrokeshire.
160
140
120
100
80
60
40
20
1 3 5 7 9 11 13
Leeds NOx
Narberth NOx
NO
x le
vel /
ppb
Day

PHO
TOCOP
YPMonitoring air pollution – page 2 of 3
Was your answer to question 1 correct? Say yes or no and explain why.
____________________________________________________________________
____________________________________________________________________
____________________________________________________________________
____________________________________________________________________
____________________________________________________________________
____________________________________________________________________
The average level of pollution recorded each day is shown in the above graphs. Theselevels are compared to a standard to see if they pose a threat to our health or theenvironment. The public are alerted, and advised to take precautions, if the pollutantlevel is very high.
40
35
30
25
20
15
10
5
1 3 5 7 9 13
Narberth O3
Leeds O3
Ozo
ne le
vel /
ppb
Day11
Leeds PM10
40
35
30
25
20
15
10
5
1 3 5 7 9 13
Narberth PM10
PM
10 l
evel
µg/
m3
Day11
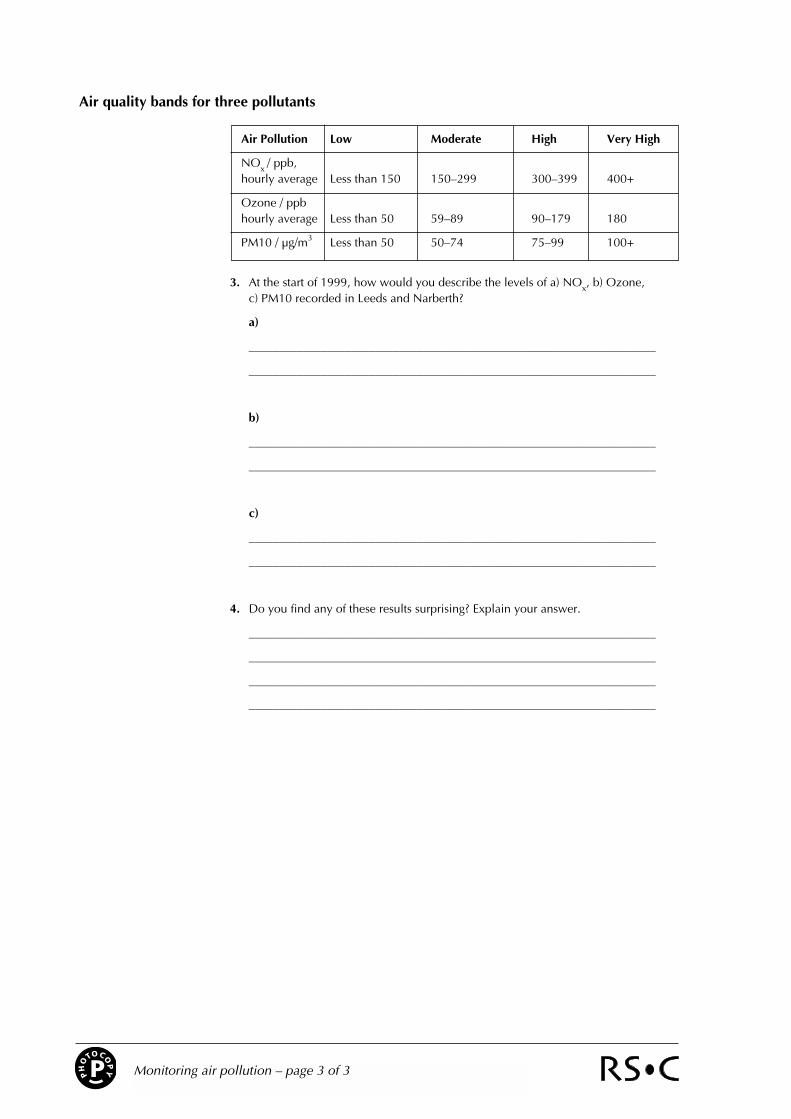
PHO
TOCOP
YP Monitoring air pollution – page 3 of 3
Air quality bands for three pollutants
Air Pollution Low Moderate High Very High
NOx / ppb, hourly average Less than 150 150–299 300–399 400+
Ozone / ppbhourly average Less than 50 59–89 90–179 180
PM10 / µg/m3 Less than 50 50–74 75–99 100+
3. At the start of 1999, how would you describe the levels of a) NOx, b) Ozone, c) PM10 recorded in Leeds and Narberth?
a)
____________________________________________________________________
____________________________________________________________________
b)
____________________________________________________________________
____________________________________________________________________
c)
____________________________________________________________________
____________________________________________________________________
4. Do you find any of these results surprising? Explain your answer.
____________________________________________________________________
____________________________________________________________________
____________________________________________________________________
____________________________________________________________________
L. H. Voûte GCE Green Chemistry Teacher’s Pack
Lesson Plan 2 and
Resources:
AS Module 2 – Extraction of Metals, Acid
Rain and Recycling

L. H. Voûte GCE Green Chemistry Teacher’s Pack
AS Module 2 – Extraction of Metals, Acid Rain and Recycling
Objective • To be able to state some advantages and disadvantages of recycling
scrap metals vs. extraction of metals • To be able to explain why it is more environmentally friendly to use
scrap iron to extract copper from aqueous solutions vs. carbon reduction of copper oxide
• To be able to describe which pollutants + hence acids cause acid rain • To be able to describe the environmental effects of acid rain • To be able to list the uses of polypropene and know that it is recycled.
Aim • To discuss the environmental and economic
advantages and disadvantages of recycling metals compared to extraction of metals, and why using scrap iron to extract copper is advantageous.
• To explain how sulphides are converted to oxides and how this can contribute to acid rain
• To understand the environmental problems of acid rain
• To explain the uses of polypropene and that it is recycled. Links to AQA specification
AS Module 2: 3.2.7. Extraction of Metals AS Module 2: 3.2.9. Polymerisation of Alkenes
Overall Picture • To hold a ‘brainstorming’ session on the pros and
cons of recycling metals vs. extraction of metals. • To remind them of sulphur dioxide causing acid
rain, showing them the animation and PowerPoint presentation.
• To do a practical demonstrating the effects of acid on limestone
• To do a worksheet on Acid Rain • To explain the uses of polypropene, a recyclable
polymer.
Resources to be used • Animation on acid rain:
http://www.dfes.gov.uk/psp/resources/Secondary/Science/Year_9/Acid_rain/Acid_rain_animation.swf
• PowerPoint Presentation on Acid Rain: cause and effects • Worksheet on acid rain:
http://chemistry.slss.ie/downloads/ch_ol_clozeacidrain.pdHealth and Safety Risk Assessment f
• Britannica Online video on Acid Rain: http://www.youtube.com/watch?v=RP-
• Wear protective lab coats and goggles • Take car when pouring the acid, using latex gloves
if possible • Place the chalk into the beaker using tongs
sU8i2edo&feature=related
Starter Activity • Hold a class ‘brainstorming’ session, writing responses on a table on the board, on the environmental and economic advantages
and disadvantages of recycling metals compared to extraction of metals, and why using scrap iron to extract copper is advantageous. Refer to Table 6 in Section 4.1.2 for a comprehensive table.
Main Activity • Remind the class of SO2 and NOx being pollutants that cause acid rain, asking how they are formed (the combustion of
hydrocarbons). • Explain that metals are usually found in ores as oxides or sulphides and when they are extracted SO2 is released, another
anthropogenic way of contributing to acid rain. • Show the animation on acid rain and the PowerPoint presentation, having the students make notes. If time, watch the Britannica
Online video – 2 minutes. • Optional Practical activity in small groups or individually : From: http://www.reachoutmichigan.org/funexperiments/agesubject/lessons/tnrcc/acidrainlesson.html
1. Explain that acids react chemically with limestone and that chalk is limestone 2. Fill a beaker 1/3 full with vinegar or H2SO4 3. Add a piece of chalk to the glass 4. Have the students write what they see happening 5. Discuss their observations and inferences. Discuss the slow deterioration of statues and buildings due to the weak acid rain
that falls on some statues and buildings. If the stone is limestone or has limestone in it, the deterioration is more rapid. • Ask the students to do the worksheet on acid rain, where the students can fill in the gaps. • To list the uses of polypropene (refer to the end of 4.1.3), and that it is a recyclable polymer.
Plenary • Ask the students to name one advantage and one disadvantage on the recycling of scrap iron • Ask the students which pollutants contribute to acid rain, which acids they form and how they are formed • Ask the class to list 3 problems caused by acid rain • Ask the class to name 3 uses of polypropene
- 58 -

Acid Rain
Lisette Voûte

Acid rain is caused by NOx and SO2
converting to nitric acid (HNO3
) and sulphuric acid (H2
SO4
)
Acid) (Nitric HNOOHNO:Formation Acid Nitric
SOHHSO
Hydrolysis HSOHOHSO
in water dissolves dioxideSulphur OHSOOHSO:Chemistry Phase Aqueous -Formation Acid Sulphuric
Acid) (Sulphuric SOHOHSOSOHOOHOSO
HOSOOHSO
:ChemistryPhaseGas-Formation Acid Sulphuric
32
233
322
22(l)2(g) 2
4223
3222
22
→+
+⇔
+⇔⋅
⋅⇔+
→++→+
→+
•
−+−
−+
••
••
Rain is normally slightly acidic anyway, having a pH of 5.5, due to:
– Natural sources of sulphur: from volcanoes, bacteria in soils and lightning
– Natural sources of nitrogen: ammonia from fertilisers and manure

• But…precipitation in polluted areas or downwind from polluted air is more acidic
than usual due to
increased levels of NOx
and SO2
• These pollutants are emitted into the atmosphere through:–
Combustion of hydrocarbons
– Combustion of hydrocarbons containing sulphur
– Extraction of metals from their metal sulphide form
NO) and NO (i.e.NOx )combustion (fromheat NO 222 →++
2222 2SOO2H3OS2H +→+
2
22
SO3Pb2PbOPbS
SOPbSPbOO232PbS
+→+
++→+

• These acids are both:–
Dissolved into water in clouds & precipitated down to earth
•
This means the clouds could travel a long way (100’s of km!) before it falls
•
UK emissions are known to have fallen in Norway and devastated the forests. In fact, the UK accounts for at least 16% of Norway’s acid rain
– The pollutants may be deposited through dry deposition
onto vegetation and soils, where they
create acids directly
Problems of Acid Rain•
The increased acidity of rivers and lakes
and so
can destroy the ecosystems, vegetation and organisms within them.
• pHs below 5 will stop fish eggs from hatching and below that can kills
even adult fish.
• So as acidity increases, the biodiversity
of lakes
decreases. •
Acid rain has made certain fish and species of insects extinct.

• Acid rain can slow the growth of vegetation and forests.
• Changes to the soil pH can harm plants and denature enzymes and bacteria in the soil.
• There is an increase in the rate of people obtaining lung diseases
such as:
– Cancer
– Bronchitis
– Emphysema
– Asthma
• This is thought to be caused by the inhalation of small particulate matter (PM10s); including sulphur –
so acid rain may be a contributing
factor to these human health problems.

• Limestone is easily dissolved by acids:
• So buildings and monuments have become easily eroded
OHCOCaSOSOHCaCO 224423 ++→+

Acid Rain
The following words are omitted from the passage below: sulfur dioxide, volcanoes, limestone, power plants, fossil fuels, acid rain, pH, oxidized, rain Write down in the spaces given below the appropriate missing word corresponding to each of the numbers 1 to 9. Unpolluted rainwater is slightly acidic. It has a (1) of approximately 5.5 due to carbon dioxide in the atmosphere. Emissions of acidic gases lead to a lowering of pH, with the formation of acid rain. The main causes of acid rain are the oxides of nitrogen and the oxides of sulfur. (2) damages soil, causes the poisoning of fish, attacks trees and erodes buildings. Oxides of nitrogen Oxides of nitrogen are released from car exhausts and _____ (3) ___where the high temperatures bring about the oxidation of atmospheric nitrogen. They are also formed in some biological processes and by lightning discharges. Nitrogen monoxide, NO, is quickly (4) in air to nitrogen dioxide, NO2. Nitrogen dioxide dissolves in water and reacts to form a mixture of HNO2 and HNO3. When this occurs in the atmosphere the result is acid rain. Oxides of sulfur Oxides of sulfur are mainly formed by the combustion of fossil fuels, particularly coal. They can also be released by (5) and by the decay of organic matter. When (6) are burned the sulfur in them forms sulfur dioxide, SO2, which is a dangerous pollutant. Sulfur dioxide dissolves in water to form sulfurous acid, H2SO3. In the atmosphere, sulfur dioxide is oxidised to sulfur trioxide, SO3. Sulfur trioxide dissolves in rainwater to form sulfuric acid, H2SO4. Thus the release of SO2 into the atmosphere is likely to result in (7) containing H2SO3 and H2SO4. Scrubbing waste gases Limestone is used to reduce sulfur dioxide emissions from coal-fired power stations. Coal is mixed with finely ground (8) . The high temperatures in the furnace cause the limestone to decompose: CaCO3 → CaO + CO2 The calcium oxide reacts with much of the (9) , preventing its release: CaO + SO2 → CaSO3 1________________ 2________________ 3 ________________ 4________________ 5________________ 6________________ 7________________ 8________________ 9________________

L. H. Voûte GCE Green Chemistry Teacher’s Pack
Lesson Plan 3 and
Resources:
AS Module 2 – Ozone Destruction
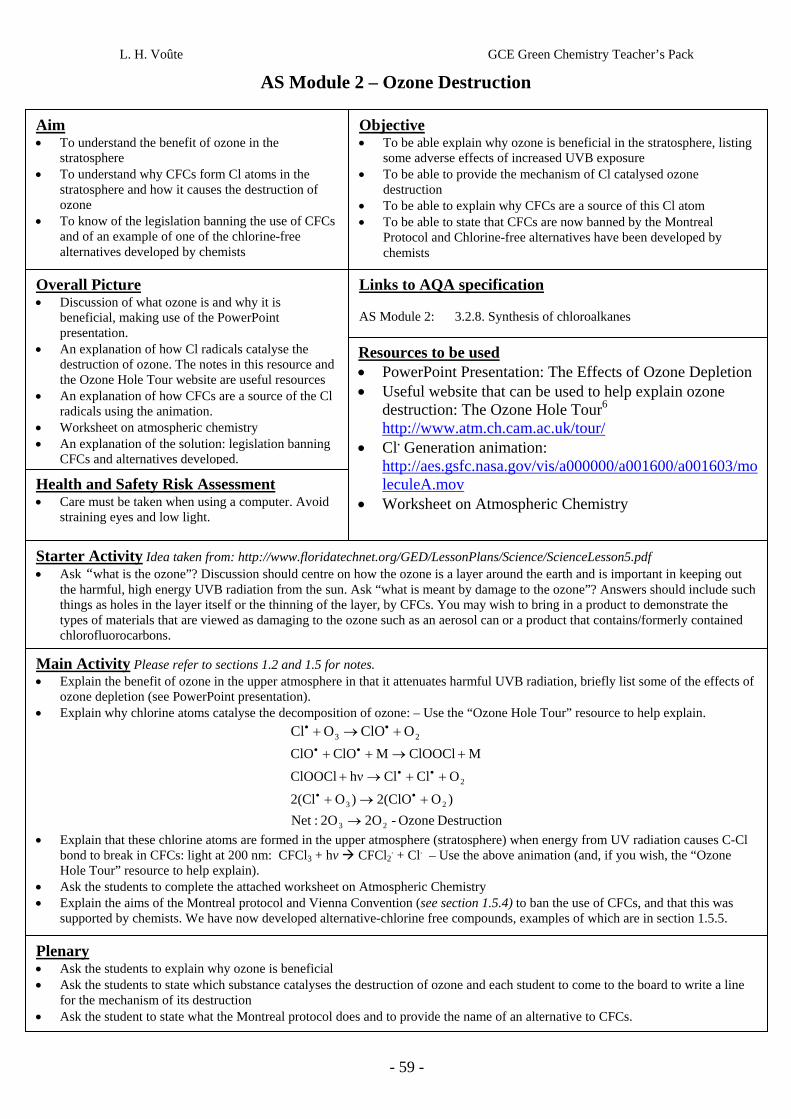
L. H. Voûte GCE Green Chemistry Teacher’s Pack
AS Module 2 – Ozone Destruction
Aim
Resources to be used • PowerPoint Presentation: The Effects of Ozone Depletion • Useful website that can be used to help explain ozone
destruction: The Ozone Hole Tour6 http://www.atm.ch.cam.ac.uk/tour/
• Cl. Generation animation: http://aes.gsfc.nasa.gov/vis/a000000/a001600/a001603/moleculeA.mov
• Worksheet on Atmospheric Chemistry Health and Safety Risk Assessment • Care must be taken when using a computer. Avoid
straining eyes and low light.
• To understand the benefit of ozone in the
stratosphere • To understand why CFCs form Cl atoms in the
stratosphere and how it causes the destruction of ozone
• To know of the legislation banning the use of CFCs and of an example of one of the chlorine-free alternatives developed by chemists
Objective • To be able explain why ozone is beneficial in the stratosphere, listing
some adverse effects of increased UVB exposure • To be able to provide the mechanism of Cl catalysed ozone
destruction • To be able to explain why CFCs are a source of this Cl atom • To be able to state that CFCs are now banned by the Montreal
Protocol and Chlorine-free alternatives have been developed by chemists
Overall Picture • Discussion of what ozone is and why it is
beneficial, making use of the PowerPoint presentation.
• An explanation of how Cl radicals catalyse the destruction of ozone. The notes in this resource and the Ozone Hole Tour website are useful resources
• An explanation of how CFCs are a source of the Cl radicals using the animation.
• Worksheet on atmospheric chemistry • An explanation of the solution: legislation banning
CFCs and alternatives develo
Links to AQA specification AS Module 2: 3.2.8. Synthesis of chloroalkanes
ped.
Starter Activity Idea taken from: http://www.floridatechnet.org/GED/LessonPlans/Science/ScienceLesson5.pdf • Ask “what is the ozone”? Discussion should centre on how the ozone is a layer around the earth and is important in keeping out
the harmful, high energy UVB radiation from the sun. Ask “what is meant by damage to the ozone”? Answers should include such things as holes in the layer itself or the thinning of the layer, by CFCs. You may wish to bring in a product to demonstrate the types of materials that are viewed as damaging to the ozone such as an aerosol can or a product that contains/formerly contained chlorofluorocarbons.
Main Activity Please refer to sections 1.2 and 1.5 for notes. • Explain the benefit of ozone in the upper atmosphere in that it attenuates harmful UVB radiation, briefly list some of the effects of
ozone depletion (see PowerPoint presentation). • Explain why chlorine atoms catalyse the decomposition of ozone: – Use the “Ozone Hole Tour” resource to help explain.
23 OClOOCl +→+ ••
nDestructio Ozone - 2O2O:Net)O2(ClO)O2(Cl
OClClhνClOOClMClOOClMClOClO
23
23
2
→+→+
++→+
+→++
••
••
••
• Explain that these chlorine atoms are formed in the upper atmosphere (stratosphere) when energy from UV radiation causes C-Cl bond to break in CFCs: light at 200 nm: CFCl3 + hv CFCl2
. + Cl. – Use the above animation (and, if you wish, the “Ozone Hole Tour” resource to help explain).
• Ask the students to complete the attached worksheet on Atmospheric Chemistry • Explain the aims of the Montreal protocol and Vienna Convention (see section 1.5.4) to ban the use of CFCs, and that this was
supported by chemists. We have now developed alternative-chlorine free compounds, examples of which are in section 1.5.5.
Plenary • Ask the students to explain why ozone is beneficial • Ask the students to state which substance catalyses the destruction of ozone and each student to come to the board to write a line
for the mechanism of its destruction • Ask the student to state what the Montreal protocol does and to provide the name of an alternative to CFCs.
- 59 -
Ozone Depletion: Why it is Dangerous
Lisette Voûte
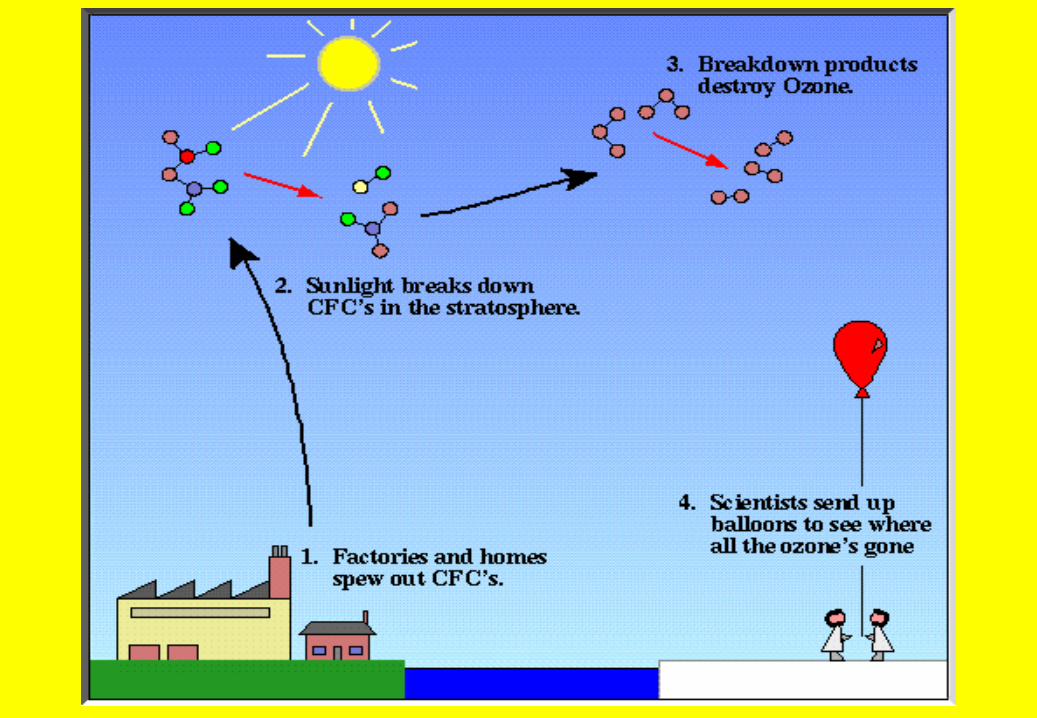

Humans•
Increased levels of dangerous high-energy UVB radiation impinging upon the earth’s surface can cause:
Melanoma and non-melanoma skin cancer•
A 10% reduction in ozone results in a 26% increase in non-melanoma skin cancer
Eye disorders and CataractsSuppression of the immune system in people of all races •
possibly leading to an increase in diseases and infections
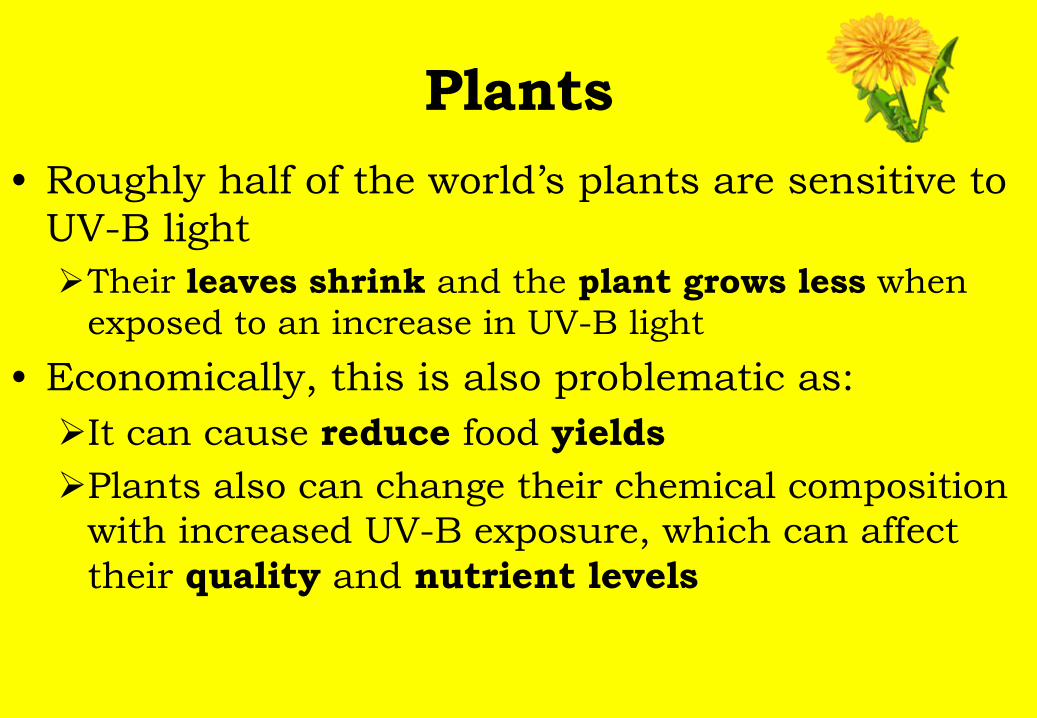
Plants•
Roughly half of the world’s plants are sensitive to UV-B light
Their leaves shrink and the plant grows less when exposed to an increase in UV-B light
• Economically, this is also problematic as:
It can cause reduce food yieldsPlants also can change their chemical composition with increased UV-B exposure, which can affect their quality and nutrient levels

Aquatic Ecosystems•
Phytoplankton
experience a similar
detrimental impact of excess UV-B
radiation that terrestrial plants do. •
This could:
Affect species further up the food chain Have a detrimental impact on the productivity of fisheries, amongst others

Air Quality•
Increased levels of surface UV radiation can increase the levels of reactive compounds in the troposphere (lower atmosphere), such as:
hydrogen peroxide acidsozone where levels of NOx are high –causing smog

Materials Damage•
Photo-oxidation
can occur to many
materials, e.g.:WoodPlasticsRubber
• This is which is when the materials become oxidized & damaged
through the action of UV
light
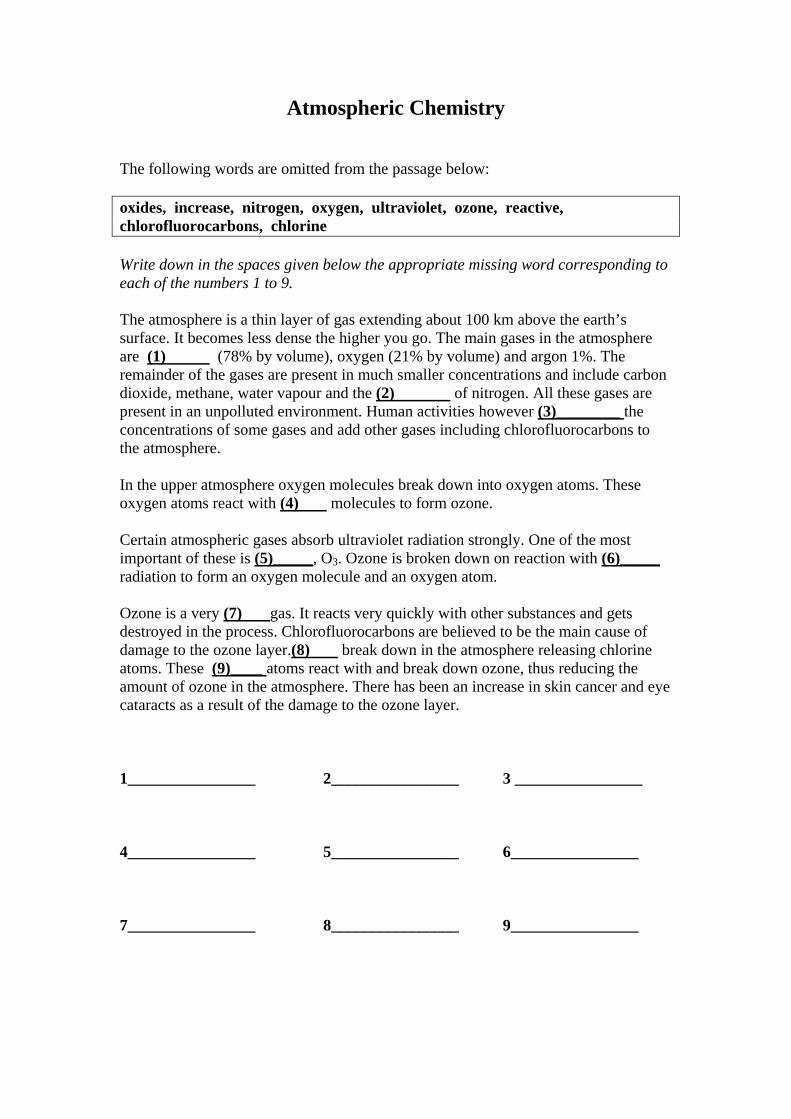
Atmospheric Chemistry
The following words are omitted from the passage below: oxides, increase, nitrogen, oxygen, ultraviolet, ozone, reactive, chlorofluorocarbons, chlorine Write down in the spaces given below the appropriate missing word corresponding to each of the numbers 1 to 9. The atmosphere is a thin layer of gas extending about 100 km above the earth’s surface. It becomes less dense the higher you go. The main gases in the atmosphere are (1) (78% by volume), oxygen (21% by volume) and argon 1%. The remainder of the gases are present in much smaller concentrations and include carbon dioxide, methane, water vapour and the (2) of nitrogen. All these gases are present in an unpolluted environment. Human activities however (3)________ the concentrations of some gases and add other gases including chlorofluorocarbons to the atmosphere. In the upper atmosphere oxygen molecules break down into oxygen atoms. These oxygen atoms react with (4) molecules to form ozone. Certain atmospheric gases absorb ultraviolet radiation strongly. One of the most important of these is (5)_____, O3. Ozone is broken down on reaction with (6)_____ radiation to form an oxygen molecule and an oxygen atom. Ozone is a very (7) gas. It reacts very quickly with other substances and gets destroyed in the process. Chlorofluorocarbons are believed to be the main cause of damage to the ozone layer.(8) break down in the atmosphere releasing chlorine atoms. These (9)____ atoms react with and break down ozone, thus reducing the amount of ozone in the atmosphere. There has been an increase in skin cancer and eye cataracts as a result of the damage to the ozone layer. 1________________ 2________________ 3 ________________ 4________________ 5________________ 6________________ 7________________ 8________________ 9________________

L. H. Voûte GCE Green Chemistry Teacher’s Pack
Lesson Plan 4 and
Resources:
AS Module 2 – Global Warming

L. H. Voûte GCE Green Chemistry Teacher’s Pack
AS Module 2 – Global Warming
Aim Objective • To understand the terms carbon neutral and biofuels and how it is
applied to methanol and bioethanol. • To understand how methanol and bioethanol are produces • Understand to what extent bioethanol is carbon neutral • To be able to explain the link between IR radiation absorption by the
bonds in greenhouse gases and global warming
• Explain the terms carbon neutral and biofuel • Understand how methanol and ethanol can
produced as carbon neutral biofuels • To discuss to what extent bioethanol is carbon
neutral • To explain the link between IR radiation absorption
by the bonds in greenhouse gases and global warming
Overall Picture Links to AQA specification AS Module 2: 3.2.3. Importance of equilibria in industrial processes AS Module 2: 3.2.10. Ethanol production AS Module 2: 3.2.11. Infra-red spectroscopy
• To discuss what carbon natural means • To use a PowerPoint presentation to explain the
production of methanol for use as a carbon-neutral fuel
• Explain what a bio-fuel is and how bioethanol is made
• Show the video documentary about biodiesel to lead into a discussion why bioethanol might not be completely carbon neutral
• Explain the link between IR radiation absorption by the bonds in greenhouse gases and global warming
• The students complete the global warming worksheet
Resources to be used • PowerPoint presentation: Carbon Neutral Methanol
Production • Video Documentary about biodiesel:
http://www.soton.ac.uk/chemistry/IDECAT/ Courtesy of: Dr. David Read, University of Southampton, Southampton, U.K.
• Worksheet on Global Warming: http://chemistry.slss.ie/downloads/ch_ol_clozegreenhouseHealth and Safety Risk Assessment
• Care must be taken when using a computer. Avoid
straining eyes and low light.
Starter Activity Please refer to section 3.3.4 for notes • Ask the class to name 3 greenhouse gases. Ask what it means to be a ‘greenhouse gas’ (contributes to global warming). Explain
what is meant by ‘carbon neutral’ to the class. Then ask them to come up with ideas in groups or as a class processes that could be considered carbon neutral.
Main Activity • Explain (can be done using PowerPoint presentation) how methanol can be a carbon neutral fuel by being made by reaction of CO
with H2, explain how use of carbon neutral alcohols as fuels is an important and essential application. • Use this to lead on to explain what a biofuel is (see section 3.3.4) and how ethanol, produced by fermentation of growing crops is a
carbon-neutral biofuel • Show the video about biodiesel (analogous process to bioethanol) • Set up a class discussion as to why, through this process, it is debatable whether it is carbon neutral. (see section 3.3.4) • Explain how IR radiation excites the bonds C=O, C-H and O-H in CO2, methane and water vapour respectively causing them to
vibrate more vigorously and then re-emit the energy in all directions as heat, thereby heating up the atmosphere (see section 3.3.1). This is why they are considered to be greenhouse gases and why they contribute to global warming; which refers to the recorded increase of the mean surface temperature of the Earth, which is thought to be due to an increase in the concentration greenhouse gases in the atmosphere due to human activity31.
• Ask the students to complete the worksheet on Global Warming.
Plenary • Ask the students what carbon neutral means • Ask them to name one carbon neutral fuel and why • Ask the students why bioethanol might not be perfectly carbon neutral • Ask the students why CO2, H21O, and CH4 are greenhouse gases in term of IR radiation.
- 60 -

Carbon Neutral Methanol Production
Lisette Voûte
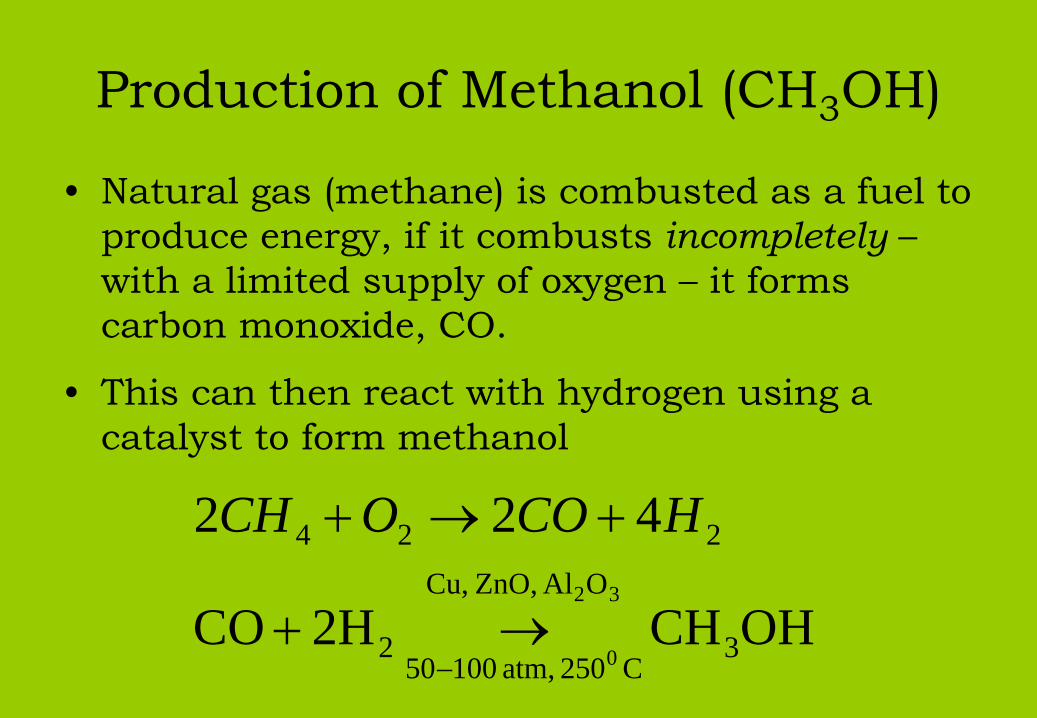
Production of Methanol (CH3
OH)
OHCH2HCO
422
3C250 atm, 10050
OAl ZnO,Cu,
2
224
0
32
−→+
+→+ HCOOCH
• Natural gas (methane) is combusted as a fuel to produce energy, if it combusts incompletely –
with a limited supply of oxygen – it forms
carbon monoxide, CO.
• This can then react with hydrogen using a catalyst to form methanol

Carbon Neutral•
This is a carbon neutral process because any CO produced when combusting natural gas can be reclaimed to produce methanol
• When the methanol is combusted as a fuel, the CO2
released has the same amount of carbon that was reclaimed from CO.So there are no net carbon emissionsinto the atmosphere
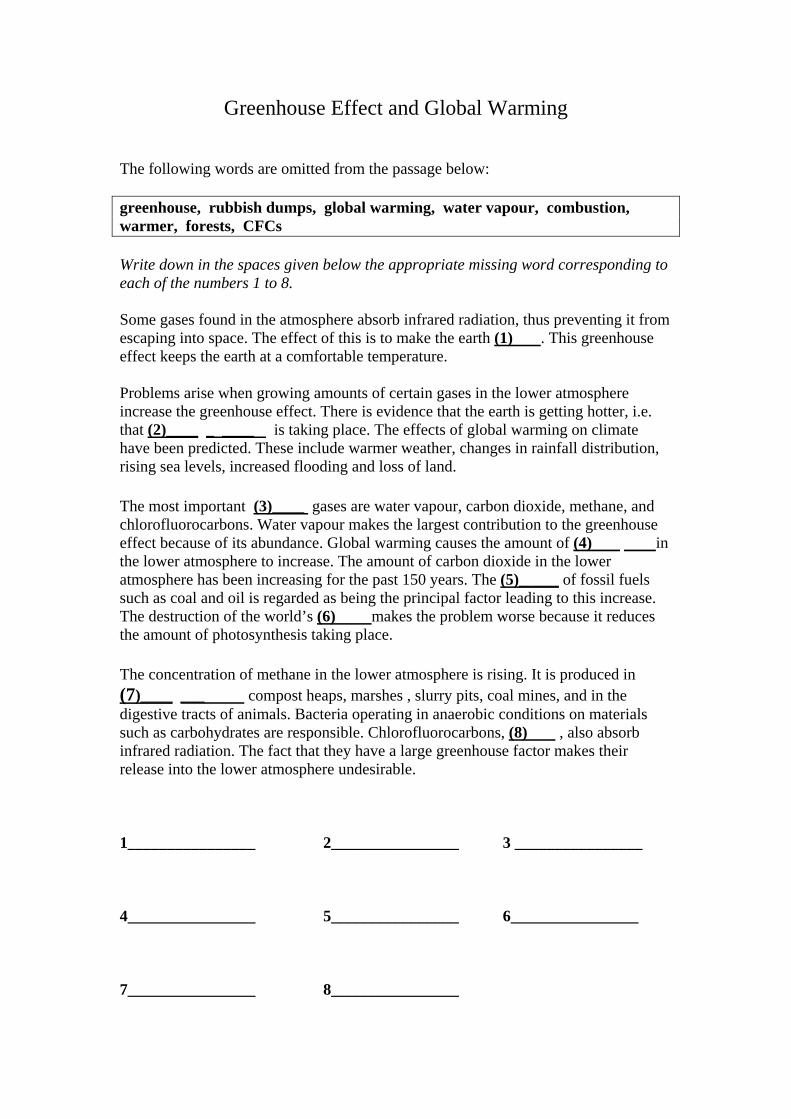
Greenhouse Effect and Global Warming
The following words are omitted from the passage below: greenhouse, rubbish dumps, global warming, water vapour, combustion, warmer, forests, CFCs Write down in the spaces given below the appropriate missing word corresponding to each of the numbers 1 to 8. Some gases found in the atmosphere absorb infrared radiation, thus preventing it from escaping into space. The effect of this is to make the earth (1) . This greenhouse effect keeps the earth at a comfortable temperature. Problems arise when growing amounts of certain gases in the lower atmosphere increase the greenhouse effect. There is evidence that the earth is getting hotter, i.e. that (2)____ _ ____ is taking place. The effects of global warming on climate have been predicted. These include warmer weather, changes in rainfall distribution, rising sea levels, increased flooding and loss of land. The most important (3)____ gases are water vapour, carbon dioxide, methane, and chlorofluorocarbons. Water vapour makes the largest contribution to the greenhouse effect because of its abundance. Global warming causes the amount of (4) in the lower atmosphere to increase. The amount of carbon dioxide in the lower atmosphere has been increasing for the past 150 years. The (5)_____ of fossil fuels such as coal and oil is regarded as being the principal factor leading to this increase. The destruction of the world’s (6) makes the problem worse because it reduces the amount of photosynthesis taking place. The concentration of methane in the lower atmosphere is rising. It is produced in (7)____ ___ compost heaps, marshes , slurry pits, coal mines, and in the digestive tracts of animals. Bacteria operating in anaerobic conditions on materials such as carbohydrates are responsible. Chlorofluorocarbons, (8) , also absorb infrared radiation. The fact that they have a large greenhouse factor makes their release into the lower atmosphere undesirable. 1________________ 2________________ 3 ________________ 4________________ 5________________ 6________________ 7________________ 8________________
L. H. Voûte GCE Green Chemistry Teacher’s Pack
Lesson Plan 5 and
Resources:
A2 Module 4 – Disposal and Recycling of
Polymers

L. H. Voûte GCE Green Chemistry Teacher’s Pack
A2 Module 4 – Disposal and Recycling of Polymers Aim
Links to AQA specification A2 Module 4: 3.4.9. Biodegradability and disposal of polymers
• To understand that polyalkenes are chemically
inert and therefore non-biodegradable • To understand that polyesters and polyamides can
be broken down by hydrolysis and are therefore biodegradable
• To appreciate the advantages and disadvantages of different methods of disposal of polymers including recycling
Objective • To be able to state why polyalkenes cannot biodegrade • To be able to state which polymers can biodegrade and how this is
done • To be able to state at least 2 advantages and disadvantages for each
method of disposal of polymers, including recycling
Resources to be used • Video of polyester hydrolysis: http://www.coolschool.ca/lor/BI12/unit2/U02L01/Hydrolysis-maltosemovie.htm • Video of polyamide hydrolysis: http://www.coolschool.ca/lor/BI12/unit2/U02L01/Hydrolysis-depeptidemovie.htm • Worksheet: Pros and Cons of Disposal of Polymers • Slide show of the process of recycling polymers:
http://www.americanchemistry.com/s_plastics/hands_on_plastics/activities/hdpe_slideshow/slide1.html
Health and Safety Risk Assessment Overall Picture • To come up with the different methods of disposal of polymers • To explain that polyalkenes are non-biodegradable, but polyesters and
polyamides are degradable: show the hydrolysis videos. • To discuss the pros and cons of the different methods of polymer
disposal, creating a table (see worksheet) as a class (possible for this to be a homework assignment)
• Optional: Practical on the hydrolysis of glycogen to glucose over time.
• If doing the practical, wear lab coat and goggles • Take care when handling HCl and K2HPO4, use
latex protective gloves • Keep test tubes in a test tube rack • Have excess acid/base at hand to neutralise any
spillages • If heating with a Bunsen burner, place away from
overhead shelving and cluttered equipment and combustible materials, do not leave open flame unattended and shut off gas when not in use. Use tongs to hold the test tube to the flame.
Starter Activity Please refer to section 4.1.3 for notes • To brainstorm as a class, writing on the board their answers different methods of disposal of polymers Main Activity • Explain that due to the unreactive alkane backbone of polyalkenes (e.g. polyethene), polyalkenes are chemically inert. This causes
them to be non-biodegradable, and can take up to 500 years to start to degrade. • Explain polyesters and polyamides can be broken down by hydrolysis and are therefore biodegradable, showing the videos • Discuss as a class the advantages and disadvantages as a class for the different methods of disposal of polymers, including
recycling, writing answers on the board and in the matrix on the attached worksheet (“Pros and Cons of Disposal of Polymers”). Alternatively, it can be written on an A3 sheet which can be photocopied and distributed to the students as it is being discussed. Table 7 is a comprehensive table of this. You can show the slide show of the process of recycling polymers (see link above).
• Optional Practical Activity: Hydrolysis of glycogen to glucose monomers (Adapted From: http://staff.science.nus.edu.sg/~dbsyhh/lab3.htm) 1. Prepare a series of seven test tubes, labeled 0 through 30 minutes in 5-minute intervals. 2. Pipette 2.5 ml of 1.0 M K2HPO4 into each tube (quenches the reaction) 3. In a separate tube, add 2.5 ml of glycogen (8 mg/ml) to 2.5 ml of 4.0 M hydrochloric acid and mix. 4. Immediately withdraw 0.5 ml of the glycogen-acid mixture and transfer it to the tube marked 0 minutes. 5. Place the remainder of the glycogen-acid solution in a vigorously boiling water bath, using a foil cap to cover the top of the
tube. 6. Remove 0.5 ml samples of 5-minute intervals for 30 minutes and transfer them to the appropriately labeled tubes containing
1.0 M K2HPO4 7. Test each of the samples for increasing levels of glucose with Benedict’s Test (a solution of copper sulphate, sodium
hydroxide, and tartaric acid) and heat. 8. Write down observations of how the colour increases in depth/intensity as more glucose is formed
Plenary • Ask the students to name the different methods of disposal of polymers • Ask the students to name 2 advantages and 2 disadvantages of recycling polymers • Say which type of polymers can be biodegraded and what is the name of the reaction type for this reaction (i.e. hydrolysis) • Ask why polyalkenes cannot biodegrade
- 61 -
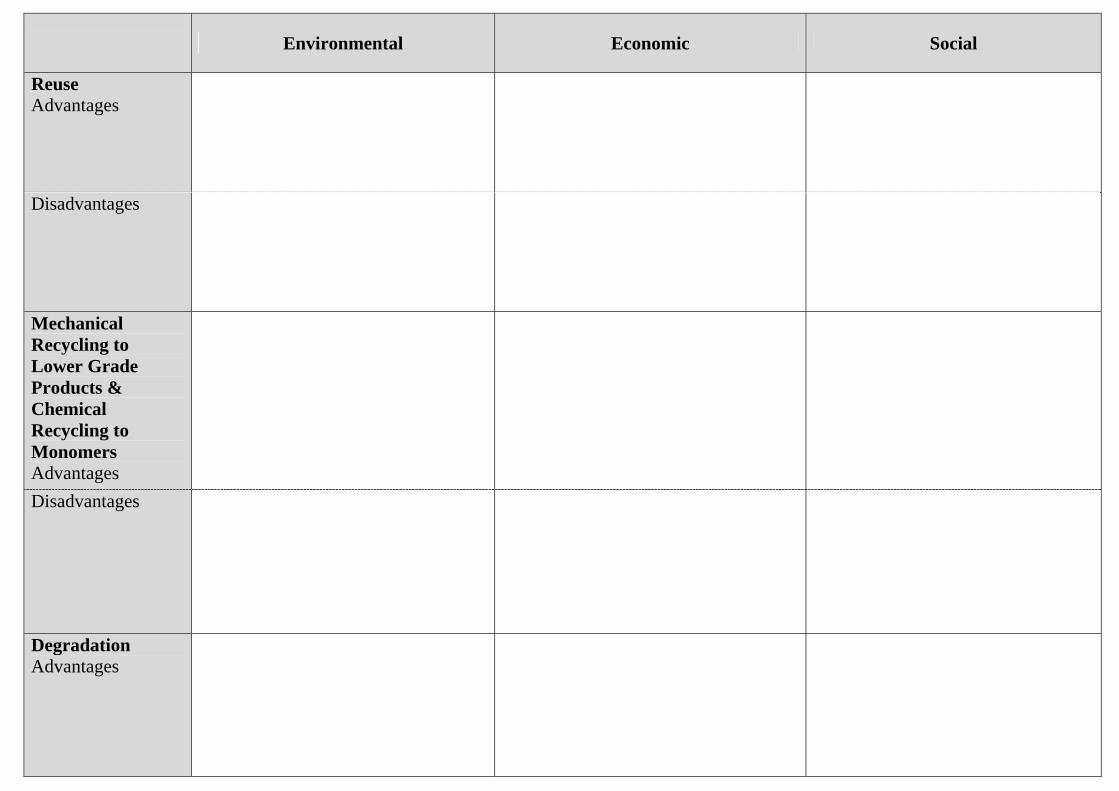
Environmental Economic Social
Reuse Advantages
Disadvantages
Mechanical Recycling to Lower Grade Products & Chemical Recycling to Monomers Advantages
Disadvantages
Degradation Advantages

Environmental Economic Social Disadvantages
Incineration Advantages
Disadvantages
Landfill Advantages
Disadvantages

L. H. Voûte GCE Green Chemistry Teacher’s Pack
Additional Green
Chemistry Resources

L. H. Voûte GCE Green Chemistry Teacher’s Pack
Additional Green Chemistry Resources
The following pages contain extra resources on Green Chemistry, reproduced from
the Royal Society of Chemistry.
Contents:
1. The Twelve Principles of Green Chemistry
2. Plastics from renewable raw materials and bio-degradable plastics
a. Rubber & Experiment: Vulcanisation of natural rubber
b. Lactic Acid - Production of a plastic from 2-hydroxypropanoic acid
(lactic acid)
c. Experiment: production of a film using starch
Video Documentary about biodiesel can be found at:
http://www.soton.ac.uk/chemistry/IDECAT/
AQA specification link: A2 Module 4: 3.4.5. Carboxylic acids and esters and Acylation
Courtesy of: Dr. David Read, University of Southampton, Southampton, U.K.
- 62 -

The twelve principles of green chemistry • It is better to prevent waste than to treat or clean up waste after it is formed.
• Synthetic methods should be designed to maximize the incorporation of all materials used in the process into the final product.
• Wherever practicable, synthetic methodologies should be designed to use and generate substances that possess little or no toxicity to human health and the environment.
• Chemical products should be designed to preserve efficacy of function while reducing toxicity.
• The use of auxiliary substances (solvents, separation agents, etc.) should be made unnecessary whenever possible and innocuous when used.
• Energy requirements should be recognized for their environmental and economic impacts and should be minimized. Synthetic methods should be conducted at ambient temperature and pressure.
• A raw material or feedstock should be renewable rather than depleting whenever technically and economically practicable.
• Unnecessary derivatization (blocking group, protection / deprotection, temporary modification of physical / chemical processes) should be avoided whenever possible.
• Catalytic reagents (as selective as possible) are superior to stoichiometric reagents.
• Chemical products should be designed so that at the end of their function they do not persist in the environment, and break down into innocuous degradation products.
• Analytical methodologies need to be further developed to allow for real-time, in-process monitoring and control prior to the formation of hazardous substances.
• Substances and the form of a substance used in a chemical process should be chosen so as to minimize the potential for chemical accidents, including releases, explosions, and fires.
These principles have been reprinted with permission from Paul T. Anstas and John C. Warner Green Chemistry: Theory and Practice, New York: Oxford University Press, 1998

Plastics from renewable raw materials and bio-degradable plastics Adapted from RSC material by Horn, Bader and Buchholz
Plastics are an indispensable part of modern society. They are used in many different areas, in daily use, in technical applications and even in medicine. It is often forgotten that many modern developments would have been impossible without the use of plastics.
Plastics may have many advantages, but they are also the subject of environmental and political debate. The use of fossil raw materials, such as oil, and the dangers which can occur as a result of its extraction and transport have been criticized, as well as the disposal and recycling of plastics. The fact that some of the problems could be reduced by using renewable raw materials for the production of plastics has been overlooked. Particularly in recent times the interest generated by such products has increased, or rather, increased again. They are the subject of this section.
What are renewable raw materials? Renewable raw materials are natural substances1 which are used by mankind for purposes other than nutrition or foodstuffs. [i]. They can be agricultural, forestry, animal or microbial products. Examples of renewable raw materials which are used industrially are cellulose, starch, sugar, oils and fats. The philosophy of the renewable management of raw materials is that only amounts which do not upset the natural biological equilibrium are extracted, and thus no disruption of the biosphere results.
The variety of renewable raw materials and their different chemical structures leads to a wide range of applications. Table 1 shows some examples.
Renewable raw material
Origin Chemical / technical product
Application (example)
Cellulose Wood, cotton Cellulose ethanoate (acetate), cellulose ether
Sheets, films, filtration condensate, construction materials
Vegetable oils eg rape Rape seed oil Rape seed oil methyl ester
Lubricant Fuel
Sugar (saccharose) Sugar cane, sugar beet
Saccharose derivates
Plastics
Starch Wheat, potatoes, corn, starch
Physically or chemically modified starch (eg hydroxypropylstarch)alkylpolyglycoside
Pregelatinized starch, binders, adhesives, finishing agents, plastics Surfactants, detergents
Flax Fibre flax (Flax) Flax fibre Fibre-reinforced materials
Latex Rubber tree Rubber Car tyres
Wool
Sheep, goats etc Clothes, insulating materials
Table 1 Examples of the application of renewable raw materials
1 These do not include mineral oil, natural gas and coal, which are natural substances, but which were formed a long time ago.
The use of renewable raw materials to satisfy human needs has been happening for thousands of years. The technique of boiling soap from plant oils and wood ash was used by the Sumerians (2500 BC). The Egyptians had already discovered the method of dyeing using henna, a powder from the leaves of the henna shrub, in the 14th century BC, as had the people of Asia Minor in the 13th century BC, using alizarin from the madder plant.
The accumulation and decomposition of biomass are in equilibrium: 120 thousand million tonnes of carbon a year are bound by photosynthesis, while 60 thousand million tonnes are respired by plants in the dark and only 60 thousand million tonnes are converted to biomass in plants. These in turn are released into the atmosphere as carbon dioxide in winter as a result of decay processes. This is how the annual balance is worked out. This balance can be disrupted by natural disasters and by mankind. Around 2 thousand million tonnes of carbon dioxide are released into the atmosphere by deforestation and soil destruction, and five thousand million tonnes by the combustion of fossil fuels.
The total biomass of the earth amounts to 1841 thousand million tonnes, or 3.6 kg m -2 of surface area, according to estimates. Phototrophic plants, which use photosynthesis to produce energy, make up 99% of this figure. However, mankind uses only 3% of the biomass produced naturally (170 thousand million tonnes), by cultivation, harvesting and processing. This amounts to 2 thousand million tonnes of wood, 1.8 thousand million tonnes of grain and 2 thousand million tonnes of other natural substances (eg sugar cane, turnips, oily fruits).
This can be compared with a worldwide consumption of 7 thousand million tonnes of oil equivalent (mineral oil, natural gas, coal) for the production of energy. Only 7% is reprocessed by the chemical industry. In 1991, the German chemical industry covered 1.8% (10%) of its raw materials demand with renewable raw materials, and the trend is rising [ii]. In the meantime, 10% of packaging chips are made from starch, and the proportion of biodegradable lubricants is over 30%.
Renewable raw materials have the big advantage over fossil raw materials that the sunlight required for their growth is available in unlimited amounts, and that the carbon dioxide released by their combustion corresponds to the amount bound by the plant during its growth. The chemical industry makes use of this advantage, as well as the ability of nature to synthesize new products. Thus, for example, soap can be made from vegetable oils in one step by an alkali ester cleavage. The basic molecular structure of the surfactant is already present and does not need to be developed via several reactions, as for example in the oxidation of alkanes to fatty acids.
However, even the cultivation and processing of renewable raw materials can cause environmental pollution, for example through the over-use of fertilizers and pesticides. Furthermore, the energy expenditure required for cultivation, harvesting and processing should not be forgotten. There are also products which are based on renewable raw materials which are not easily degradable or even toxic. As with any chemical product, this has to be carefully examined and taken into account.
[i] S. Mann, Nachwachsende Rohstoffe, Ulmer Verlag, Stuttgart 1998
[ii] M. Eggersdorfer, Perspektiven nachwachsender Rohstoffe in Energiewirtschaft und Chemie, Spektrum der Wissenschaft 1994 Nr. 6 S. 96-102

Plastics from renewable raw materials
Plastics based on renewable raw materials are not a novelty. The first plastics which were used in large amounts were modified natural products. Examples include rubber based on natural rubber (1839), celluloid from cellulose (1865) and galalith which comes from casein in milk. (1897). Natural rubber is still an important product today. In the first third of the 20th century, polymers based on renewable raw materials were dominant. Then gradually plastics based on fossil raw materials began to take over, due to their ready availability and the fact that they created completely new possibilities in the world of chemistry.
Today the interest in plastics based on renewable raw materials has increased considerably. The aim here is to move away from petroleum-based plastics towards renewable raw materials, whilst at the same time trying to synthesize new products with special, desirable properties. For example, sugars are used as the alcohol components in the production of polyurethanes, and scientists are trying to better exploit raw materials, such as cellulose, which are available in large amounts. Products which are biologically degradable, ie which can easily be disposed of after use, are also gaining considerable interest. Only a few examples of the many possibilities will be illustrated here. We will start with the classic example, rubber, and extend the range from plastics based on cellulose, starch and 2-hydroxypropanoic acid (lactic acid) to polyurethanes made using castor oil.
Rubber Rubber can be produced either synthetically, or from natural latex (or from mixtures of the two). Natural rubber is, today, an alternative to synthetic products, a fact which is highlighted by its proportion of only 30% of global rubber production.
Natural rubber is extracted from latex, the sap from the rubber tree (Hevea brasiliensis), which oozes out of the bark when the tree is damaged. Coagulation then produces solid natural rubber which is elastic and can be stretched considerably. If natural rubber is kneaded with sulphur and heated to around 400 K, rubber is then formed (vulcanisation) (Figure 2). These properties depend on the one hand on the sulfur content as well as on other additives, eg fillers such as soot and zinc oxide in the production of tyres.
n
+ S8
Sx Sx
Sx Sx
Sx n
RubberNatural rubber (polyisoprene)
Figure 2 Vulcanisation of natural rubber (poly(isoprene)) with sulfur to rubber

Experiment: vulcanisation of natural rubber In the following experiment we will be working with the natural latex concentrate Kagetex® FA [i]. The rubber dispersion is stabilized with ammonia (0.7 %) and has a dryness ratio of 61.5 %. Three types of rubber with different sulfur contents are produced [ii].
Each group of students will need
• Eye protection
• Three aluminium dishes
• A glass rod
• A mortar and pestle
• Access to an oven or drying cabinet
• Natural latex concentrate liquid (eg Kagetex® FA)
• Sulfur (flammable)
Safety • Wear eye protection
• Sulfur is flammable and its dust may be irritating to the eyes and respiratory system.
Method Different mixtures with varying amounts of sulfur are set up as shown in Table 2.
Mixture Mass of latex / g
Mass of sulfur / g Relative concentration of sulfur
1 2.0 0.1 5
2 2.0 0.5 25
3 2.0 1.0 50
Table 2 Mixtures for the experiment on vulcanisation of rubber
The sulfur is ground in the mortar and mixed with the latex in an aluminium dish. The different mixtures are then left in the drying cabinet at 140 0C.
Disposal The rubber waste can be disposed of with the household waste.
Observation Elastic products are formed. The lower the sulfur content, the more elastic and soft the rubber is.
Evaluation The degree of hardness of the rubber depends on the sulfur content. The sulfur reacts with the double bonds in the poly(isoprene) strands. Loose bonds are formed between the chains (vulcanisation). The more sulfur is added to the natural rubber, the higher the degree of intermolecular cross-linking and thus the hardness of the rubber produced.
[i] Kautschuk-Gesellschaft mbH, Frankfurt: http://www.kautschukgesellschaft.de
[ii] H. J. Bader (Hrsg.), Kunststoffe, Recycling, Alltagschemie, Band 12 der Reihe: W. Glöckner, W. Jansen, R. G. Weißenhorn (Hrsg.), Handbuch der experimentellen Chemie - Sekundarbereich II, Aulis-Verlag, Köln 1997

Production of a plastic from 2-hydroxypropanoic acid (lactic acid)
Each group of students will need • Eye protection • Test tubes • Test tube rack • Bunsen burner • Acrylic glass plate (approximately 15 cm × 15 cm) • Boiling stone • Microspatula • Tin(II) chloride (irritant) • 2-hydroxypropanoic acid (lactic acid) • Cobalt chloride paper (dried)
Safety
• Wear eye protection • Tin(II) chloride is irritating to eyes and skin, and is dangerous with oxidising agents
such as nitrates and peroxides Method 5 cm3 of 2-hydroxypropanoic acid (lactic acid) are added to a microspatula load of tin(II) chloride crystals and a boiling chip in a test tube and heated for 10 minutes whilst stirring vigorously. The vapours emitted are tested with cobalt chloride paper. If an orange-brown colour occurs in the test tube, the hot solution is poured onto the acrylic glass plate.
Disposal Plastic waste can be disposed of with other household waste.
Observation The solution applied to the acrylic glass plate solidifies and forms a yellow-brown slightly sticky mass. The cobalt chloride paper changes colour from blue to pink.
Evaluation Cobalt chloride paper is used to test for water which, as a result of the temperature, escapes as steam from the test tube. The blue dry cobalt(II) chloride forms a pink-coloured hexahydrate when combined with water.
The reaction is an esterification in which the 2-hydroxypropanoic acid (lactic acid) is converted to oligomers with loss of water. In general one molecule of alcohol reacts with one molecule of acid with loss of water to form an ester. The 2-hydroxypropanoic acid used is bifunctional. It consists of one hydroxyl and one carboxyl group which form an intermolecular bond.
The esterification is catalyzed by acid. The proton required for the first step of the esterification (protonation of the carboxyl group) is formed by the hydrolysis of tin(II) chloride with precipitation of a basic salt.
Poly(lactic acid) 2-hydroxypropanoic acid
(lactic acid)
n
nH2O
-nH2O
SnCl2 + H2O → Sn(OH)Cl + Cl- + H+
Experiment: production of a film using starch
Part a: extraction of starch
Each group of students will need • Eye protection
• Grater
• Tea strainer
• Mortar and pestle
• Two 400 cm3 beakers
• Potatoes
• Distilled or deionized water
Safety • Wear eye protection
Method 100 g of peeled and washed potatoes are ground with a grater. The mush is slurried with 100 cm3 of water and poured through a tea strainer. This process is repeated twice. The beaker is left for five minutes until the starch is precipitated on the bottom of the beaker. The remaining water is decanted off. Another 150 cm3 of water are added, stirred briefly and decanted again. This process is repeated again with 100 cm3 of water.
Disposal The potato and starch waste can be added to compost or disposed of with other household waste.
Observation A white powder can be extracted from the potatoes.
Evaluation The starch in potatoes can be extracted via a number of separation and purification steps. It is known as natural starch and is treated with cold water during the extraction process because starch does not dissolve in cold water.
Part b: production of a film
Each group of students will need • Eye protection
• One 50 cm3 round flask
• One reflux condenser
• One 25 cm3 measuring cylinder
• Three 3 cm3pipettes
• Magnetic stirrer with hot plate
• Oil bath
• Acrylic glass plate
• Drying cabinet
• Thermometer
• Spatula
• Natural potato starch (from Part (a) or a chemicals supplier)
• Propane-1, 2, 3-triol (glycerol) solution 50 %
• Hydrochloric acid 0.1 mol dm-3
• Sodium hydroxide 0.1 mol dm-3 (irritant)
• Food dye (liquid)
Safety • Wear eye protection
Method Add 25 cm3 of water to 2.5 g of potato starch, 3 cm3 hydrochloric acid and 2 cm3 proppane-1, 2, 3-triol (glycerol) solution. If you use the moist starch from Part (a), 4 g of potato starch are required. Heat for 15 minutes under reflux. The reaction is stopped by adding sodium hydroxide. The mixture can be dyed by adding 1 to 2 cm3 of food dye. The hot, viscous mass is poured uniformly onto the acrylic glass plate and dried for two days at room temperature or for approximately 90 minutes at 100 °C in a drying cabinet. If the moist starch from Part (a) is used, the amounts should be adjusted to 4 g of starch.
Disposal Waste can be added to compost or disposed of with other household waste. Neutralized liquid waste can be poured down the drain.
Observation The initially highly viscous but later thin solution can be cast into a film. The clear film can then be removed form the glass plate.
Evaluation Starch forms a film when it is dried from an aqueous solution. The reason for this is the intramolecular and intermolecular hydrogen bonds, in particular those between the long chains of the amylose molecules. However, the branched amylopectin, which makes up the larger part of the starch molecule, inhibits film formation. The reaction with diluted hydrochloric acid partially breaks down the amylopectin. This leads to improved film formation, but the product is brittle. For this reason propane-1, 2, 3-triol (glycerol) is added. Propane-1, 2, 3-triol retains water as a result of its hygroscopic properties. The bound water inhibits the formation of crystalline and brittle areas within the molecule. Thus water acts as a softener here as does propane-1, 2, 3-triol. The later is capable of slipping between the starch molecules and thus making the plastic softer.

L. H. Voûte GCE Green Chemistry Teacher’s Pack
References

L. H. Voûte GCE Green Chemistry Teacher’s Pack
- 63 -
References
1 D. E. Shallcross, Level II Chemistry Lecture Notes, University of Bristol, Bristol, February 2006. 2 William A. Arnett, The Nine Planets Solar System Tour, last updated 25th August 2006. www.nineplanets.org 3 T. G. Harrison and D. E. Shallcross, Teacher Update 1 – Atmospheric Chemistry, University of Bristol, Bristol, 21st June 2006. 4 Marianne Weingroff, Introduction to the Atmosphere: Background Material, The University Corporation for Atmospheric Research UCAR/NCAR/UOP, USA, accessed 28th January 2008. http://www.ucar.edu/learn/1_1_1.htm 5 Figure adapted from: J. Lean and C. Fröhlich, in K.S. Balasubramaniam, J.W. Harvey and D.M. Rabin (eds.), Synoptic Solar Physics, 18th NSO/Sacramento Peak Summer Workshop ASP Conference Series, in press, 1998. 6 O. Garrett and G. Carver, The Ozone Hole Tour, The University of Cambridge, Cambridge, 1998. http://www.atm.ch.cam.ac.uk/tour/part1.html 7 C. Welch, The Ozone Hole, The Ozone Hole, Inc., PA, USA, site accessed February 2008. http://www.theozonehole.com/ozoneholehistory.htm 8 R. McPeters, Total Ozone Mapping Spectrometer - Ozone Hole Monitoring, NASA/GSFC, USA, February 2008. http://toms.gsfc.nasa.gov/eptoms/dataqual/oz_hole_avg_area_v8.jpg 9 NOAA Climate Program Office, About Climate, NOAA, MD, USA, November 2007. http://www.climate.noaa.gov/index.jsp?pg=/about_climate/about_index.jsp&about=ozone 10 J. Hays and P. deMenocal, Science and Society – Stratospheric Ozone (Lectures), Columbia University, NY, USA, 2002. http://www.ldeo.columbia.edu/edu/dees/V1003/lectures/ozone/index.html 11 C. Bitz, Ozone, University of Washington, WA, USA, 2004. http://www.atmos.washington.edu/2004Q4/211/Ozone2.pdf 12 J.G. Anderson, W.H. Brune, and M.H. Proffitt, Ozone destruction by chlorine radicals within the Antarctic Vortex: The Spatial and Temporal Evolution of ClO-O3 anticorrelation based on in situ ER-2 data, Journal of Geophysical Research-Atmospheres, 1989, 94, D9 Special Issue on the Antarctic Airborne Ozone Experiment (AAOE), 11465-79. 13 Haloalkane, Wikipedia, site accessed February 2008. http://en.wikipedia.org/wiki/Haloalkane 14 Montreal Protocol, Wikipedia, site accessed February 2008. http://en.wikipedia.org/wiki/Montreal_Protocol 15 Umwelt Bundes Amt, CFCs and Halons, June 2006. http://www.umweltbundesamt.de/produkte-e/fckw/halone.htm 16 J. Reiter, CFC countdown - chlorofluorocarbon regulations, Dairy Foods, June 1992. http://findarticles.com/p/articles/mi_m3301/is_n6_v93/ai_13240114 17 M. K. Tolba, O. A. El-Kholy, E. El-Hinnawi, M. W. Holdgate, D. F. McMichael, and R. E. Munn, eds. in The world environment 1972-1992, Chapman and Hall, New York, USA, 1992, Ozone depletion Chapter 2.

L. H. Voûte GCE Green Chemistry Teacher’s Pack
- 64 -
18 Figure adapted from D. E. Shallcross, Level II Chemistry Lecture Notes – The Oxidising Capacity of the Troposphere, University of Bristol, Bristol, February 2006. 19 D. E. Shallcross, Ground Level Air Pollution, University of Bristol, Bristol, received November 2007. 20 Smog, Wikipedia, site accessed February 2008. http://en.wikipedia.org/wiki/Smog 21 Clean Air Act, Wikipedia, site accessed March 2008. http://en.wikipedia.org/wiki/Clean_Air_Act 22 Fordscorpio, Catalytic Converter – How it works, Ford, UK, 2001. http://www.fordscorpio.co.uk/cats.htm 23 CEH School Net, Acid Rain (Advanced), NERC’s Centre for Ecology and Hydrology, January 2007. http://schools.ceh.ac.uk/advanced/acidrain/acidrain1.htm 24 Sulfur Dioxide, Wikipedia, site accessed March 2008. http://en.wikipedia.org/wiki/Sulphur_dioxide 25 J. H. Seinfeld, S. N. Pandis, Atmospheric Chemistry and Physics - From Air Pollution to Climate Change, John Wiley & Sons, NJ, USA,1998. 26 Young Peoples Trust for the Environment, What is Acid Rain, site accessed March 2008. http://www.ypte.org.uk/docs/factsheets/env_facts/acid_rain.html 27 Acid Rain, Wikipedia, site accessed March 2008. http://en.wikipedia.org/wiki/Acid_rain#_note-Seinfeld_1998 28 Gypsum, Wikipedia, site accessed March 2008. http://en.wikipedia.org/wiki/Gypsum 29 University Corporation for Atmospheric Research UCAR/NCAR/UOP, Greenhouse Effect: Background Material, USA, site accessed February 2008. http://www.ucar.edu/learn/1_3_1.htm#top 30 BBC Weather Centre, Climate Change, site accessed February 2008. http://www.bbc.co.uk/climate/evidence/ 31 M.L. Khandekar, T.S. Murty, and P. Chittibabu, The Global Warming Debate: A Review of the State of Science, Pure and Applied Geophysics, 2005, 162, 1557-1586. 32 M.N.R. Ashfold, Spectroscopy Level I Chemistry 1A Lecture Notes, University of Bristol, Bristol, January 2005. 33 P. Jones, Global Temperature Record, Climatic Research Unit of the University of East Anglia and the Hadley Centre of the U.K. Meteorological Office, January 2008. 34 Intergovernmental Panel on Climate Change, A report of Working Group I The Physical Science Basis of Climate Change - Summary for Policymakers, accessed February 2008. 35 The University of Michigan, Global Warming Potential Lecture, Michigan, USA, site accessed February 2008. http://www.globalchange.umich.edu/globalchange1/current/lectures/samson/global_warming_potential 36 Atmosphere, Climate & Environment Information Programme, Global Warming Potentials, Manchester Metropolitan University, Manchester, U.K., site accessed February 2008. http://www.ace.mmu.ac.uk/eae/Global_Warming/Older/GWPs.html
L. H. Voûte GCE Green Chemistry Teacher’s Pack
- 65 -
37 C. Brahic, Bush to back bioethanol - but benefits are in the balance, New Scientist, March 2007. 38 G. Vicente, M. Martinez, and J. Aracil, Optimisation of integrated biodiesel production. Part I. A study of the biodiesel purity and yield, Bioresource Technology, 2007, 98, Issue 9, 1724-1733. 39 Energy Systems Research Unit, What is Biodiesel, University of Strathclyde, Glasgow, U.K, October 2007. 40 Methanol, Wikipedia, site accessed February 2008. http://en.wikipedia.org/wiki/Methanol 41 BBC News – Science and Technology, Quick Guide: Biofuels, January 2007. 42 Carbon Footprint Ltd, Carbon Footprint, site accessed February 2008. http://www.carbonfootprint.com/ 43 Carbon Capture and Storage, Wikipedia, site accessed February 2008. http://en.wikipedia.org/wiki/Carbon_capture_and_storage#_note-IPCC_CC 44 BBC News – Science and Technology, Q&A: The Kyoto Protocol, February 2005. 45 Secondary Materials and Recycled Textile Association, Glossary, August 2002. http://www.smartasn.org/glossary.html#R 46 Renewable Resource, Wikipedia, site accessed February 2008. http://en.wikipedia.org/wiki/Renewable_resource 47 Royal Society of Chemistry, ITU4 Green Chemistry – The Atom Economy, January 2004. 48 OCR, Chemistry A AS/A Level GCE Specification for Teaching in 2008. 49 The Guides Network, Recycling, site accessed February 2008. http://www.recycling-guide.org.uk 50 J. Parfitt, Analysis of household waste composition and factors driving waste increases, WRAP, December 2002. 51 Waste Online, Recycling Metals – Aluminium and Steel, UK, site accessed February 2008. http://www.wasteonline.org.uk/resources/InformationSheets/metals.htm 52 SF Science original material, Extracting metals from their ores, Cambridge-Hitachi, 2006. http://www.cambridge.org/uk/education/secondary/science/ks4/science_foundations/downloads/word/Chemistry%20Unit%202b.doc 53 Collins Education, Cars for Scrap (worksheet), HarperCollins Publishers, 2004. http://www.collinseducation.com/resources/worksheets/Cb4%20Cars%20for%20scrap.pdf 54 AQA, Chemistry GCE AS and A Level Specification for teaching in 2008. 55 Race Against Waste, How Incineration Works, Ireland’s Department of the Environment, Heritage & Local Government, site accessed February 2008. http://www.raceagainstwaste.ie/learn/incineration/chart/# 56 Assure, Steel Manufacturing and Recycling, document accessed February 2008. http://www.assurre.eu/uploads/documents/pub-32_en-efd92a8a-a387-435a-9fb5-f9d3f743d513.pdf 57 J. Green, J. Batchelor, and D. Yuen, The manufacture of steel, The New Zealand Institute of Chemistry, New Zealand, site accessed February 2008. http://www.nzic.org.nz/ChemProcesses/metals/8A.pdf
L. H. Voûte GCE Green Chemistry Teacher’s Pack
- 66 -
58 United States Patent, Method of Operating a basic open heath furnace, United States Patent 3859078, accessed February 2008. 59 PRIMO, Plastic Advantages, site accessed February 2008. http://www.primo.se/Plastic_advantages-760.aspx 60 OCR, Chemistry B (Salters) AS/A Level GCE Specification for Teaching in 2008. 61 M. Lancaster, Green Chemistry: An Introductory Text, RSC Paperbacks, Cambridgeshire, 2002. 62 A. Tukker, Plastics Waste - Feedstock Recycling, Chemical Recycling and Incineration, ChemTec Publishing, Netherlands, 2002. 63 Nottinghamshire County Council, Waste Local Plan, Nottinghamshire, site accessed February 2008. http://www.nottinghamshire.gov.uk/home/environment/planningmatters/mineralsandwasteplanning/localdevframework/oe-planningmatters-wastelocalplan/wastelocalplan/adoptedwasteplan/adoptedplan-chapterfive.htm 64 City of Redding, Cleaning Up the Waste Stream — Recycling Plastics, California, USA, site accessed February 2008. http://ci.redding.ca.us/solwaste/r_plastics.htm 65 Practical Action, Recycling Plastics, site accessed February 2008. http://practicalaction.org/practicalanswers/product_info.php?products_id=190 66 Science Image, Biodegradable Plant Pots, Commonwealth Scientific and Industrial Research Organisation, Australia, site accessed February 2008. http://www.scienceimage.csiro.au/index.cfm?event=site.image.detail&id=3912 67 Waste Online, Waste Management Options, UK, site accessed February 2008. http://www.wasteonline.org.uk/resources/Wasteguide/mn_wmo_landfil_overview.html 68 Polypropylene, Wikipedia, site accessed February 2008. http://en.wikipedia.org/wiki/Polypropylene 69 Chemguide, Polymerisation of alkenes, UK, site accessed February 2008. http://www.chemguide.co.uk/organicprops/alkenes/polymerisation.html