a systematic review of malnutrition screening tools for ... · review a systematic review of...
TRANSCRIPT
JAMDA 15 (2014) 171e184
JAMDA
journal homepage: www.jamda.com
Review
A Systematic Review of Malnutrition Screening Tools for the NursingHome Setting
Marian A.E. van Bokhorstede van der Schueren PhD, RD a,b,*,Patrícia Realino Guaitoli RD a, Elise P. Jansma MSc c, Henrica C.W. de Vet PhD d
aDepartment of Nutrition and Dietetics, Internal Medicine, VU University Medical Center, Amsterdam, The NetherlandsbDepartment of Nutrition, Sports, and Health, HAN University of Applied Sciences, Nijmegen, The NetherlandscMedical Library, VU Amsterdam University Library, Amsterdam, The NetherlandsdDepartment of Epidemiology and Biostatistics, EMGO Institute for Health and Care Research, VU University Medical Center, Amsterdam,The Netherlands
Keywords:Malnutritionscreeningassessmentnursing homelong term carecriterion validitypredictive validitysystematic review
MAEvB, PRG, HCWdV, and EPJ designed the studyliterature search. PRG and MAEvB judged eligibility oextraction. MAEvB and PRG drafted the manuscript. Awriting of the manuscript. All authors approved the fin
The authors declare no conflicts of interest.* Address correspondence to Marian A.E. van Bok
PhD, RD, Department of Nutrition and Dietetics, InteMedical Center, PO Box 7057, 1007 MB Amsterdam, T
E-mail address: [email protected] (M.A.ESchueren).
1525-8610/$ - see front matter � 2014 - American Mhttp://dx.doi.org/10.1016/j.jamda.2013.10.006
a b s t r a c t
Rationale: Malnutrition screening among nursing home residents is often performed with tools devel-oped for use among older subjects, and sometimes with tools designed for an adult population. Onlya few tools have been designed specifically for the nursing home setting. This systematic review assessesthe criterion and predictive validity of malnutrition screening tools used in nursing homes.Methods: The databases MEDLINE, CINAHL, and EMBASE were searched on January 30, 2013, formanuscripts including search terms for malnutrition, screening or assessment tools, and setting. Articleswere eligible for inclusion if they expressed criterion validity (how well can a tool assess nutritionalstatus) or predictive validity (how well can a tool predict clinical outcome) of malnutrition screeningtools in a nursing home population. Included were articles that had been published in the English,German, French, Dutch, Spanish, or Portuguese language.Results: The search yielded 8313 references. Of these, 24 met the inclusion criteria and were available;2 extra manuscripts were retrieved by reference checking. Twenty tools were identified. Seventeenstudies reported on criterion validity, and 9 on predictive validity. Four of the tools had been designedspecifically for use in long term care. None of the tools, not even the ones specifically designed for thenursing home setting, performed (on average) better than “fair” in either assessing the residents’nutritional status or in predicting malnutrition-related outcomes.Conclusion: The use of existing screening tools for the nursing home population carries limitations, asnone performs better than “fair” in assessing nutritional status or in predicting outcome. Also, nosuperior tool can be pointed out. This systematic review implies that further considerations regardingmalnutrition screening among nursing home residents are required.
� 2014 - American Medical Directors Association, Inc. All rights reserved.
Screening for malnutrition has received increasing attention overthe past 2 decades. After 1982, when the Subjective Global Assess-ment (SGA) was introduced as the first screening tool for malnutri-tion, a few dozen screening tools have been developed. These toolsare intended for the quick identification of patients at risk of
. IJ performed the systematicf papers and performed datall authors contributed to theal version of the manuscript.
horstede van der Schueren,rnal Medicine, VU Universityhe Netherlands.. van Bokhorstede van der
edical Directors Association, Inc. A
malnutrition, for more in-depth nutritional assessment, or for iden-tifying patients at risk of developing complications or even increasedrisk of mortality.
Malnutrition prevalence rates increase with age, due to factorssuch as multimorbidity, decreased appetite, diminished physicalfunction, oral health, the ability to eat alone or with help, and/orcognitive decline. Depending on the method or parameters used forthe nutritional assessment, prevalence rates of malnutrition amongelderly subjects range between 6.5% and 85.0%.1 For nursing homepatients, the same ranges were recently described.2,3
Early identification of nursing home residents at nutritional risk,followed by adequate nutritional intervention, is expected tocontribute to conservation of muscle function and muscle strength,and herewith to maintenance of independency, quality of life, andpossibly prolonged survival.
ll rights reserved.
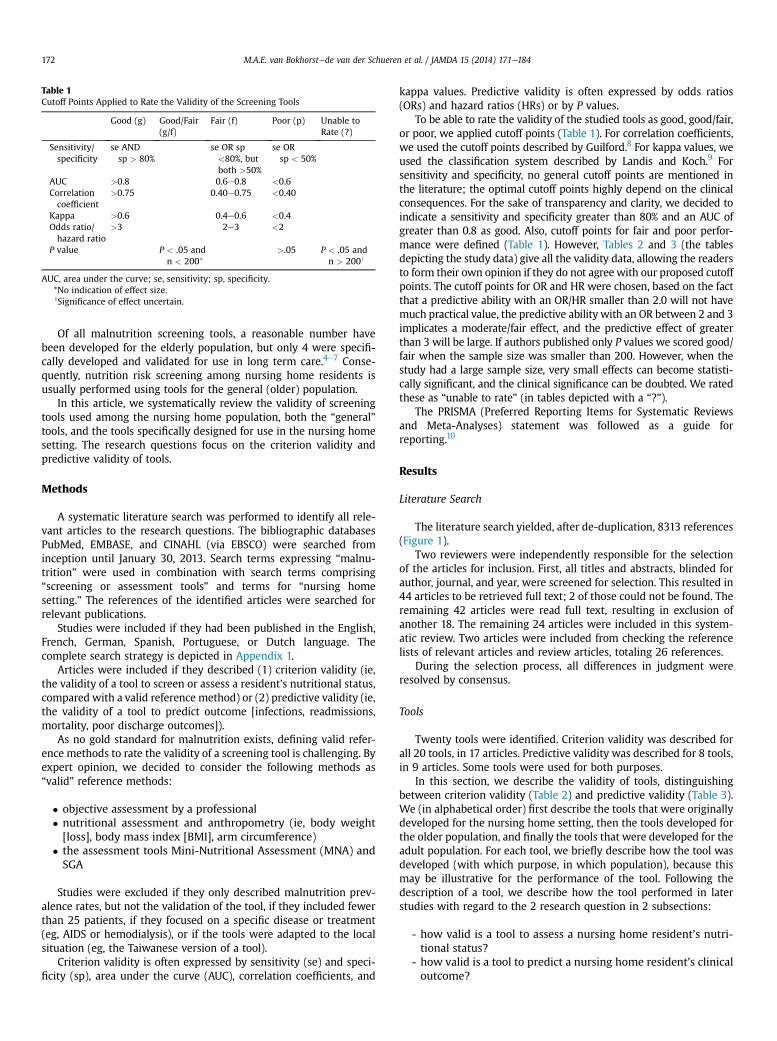
Table 1Cutoff Points Applied to Rate the Validity of the Screening Tools
Good (g) Good/Fair(g/f)
Fair (f) Poor (p) Unable toRate (?)
Sensitivity/specificity
se ANDsp > 80%
se OR sp<80%, butboth >50%
se ORsp < 50%
AUC >0.8 0.6e0.8 <0.6Correlationcoefficient
>0.75 0.40e0.75 <0.40
Kappa >0.6 0.4e0.6 <0.4Odds ratio/hazard ratio
>3 2e3 <2
P value P < .05 andn < 200*
>.05 P < .05 andn > 200y
AUC, area under the curve; se, sensitivity; sp, specificity.*No indication of effect size.ySignificance of effect uncertain.
M.A.E. van Bokhorstede van der Schueren et al. / JAMDA 15 (2014) 171e184172
Of all malnutrition screening tools, a reasonable number havebeen developed for the elderly population, but only 4 were specifi-cally developed and validated for use in long term care.4e7 Conse-quently, nutrition risk screening among nursing home residents isusually performed using tools for the general (older) population.
In this article, we systematically review the validity of screeningtools used among the nursing home population, both the “general”tools, and the tools specifically designed for use in the nursing homesetting. The research questions focus on the criterion validity andpredictive validity of tools.
Methods
A systematic literature search was performed to identify all rele-vant articles to the research questions. The bibliographic databasesPubMed, EMBASE, and CINAHL (via EBSCO) were searched frominception until January 30, 2013. Search terms expressing “malnu-trition” were used in combination with search terms comprising“screening or assessment tools” and terms for “nursing homesetting.” The references of the identified articles were searched forrelevant publications.
Studies were included if they had been published in the English,French, German, Spanish, Portuguese, or Dutch language. Thecomplete search strategy is depicted in Appendix 1.
Articles were included if they described (1) criterion validity (ie,the validity of a tool to screen or assess a resident’s nutritional status,compared with a valid reference method) or (2) predictive validity (ie,the validity of a tool to predict outcome [infections, readmissions,mortality, poor discharge outcomes]).
As no gold standard for malnutrition exists, defining valid refer-ence methods to rate the validity of a screening tool is challenging. Byexpert opinion, we decided to consider the following methods as“valid” reference methods:
� objective assessment by a professional� nutritional assessment and anthropometry (ie, body weight[loss], body mass index [BMI], arm circumference)
� the assessment tools Mini-Nutritional Assessment (MNA) andSGA
Studies were excluded if they only described malnutrition prev-alence rates, but not the validation of the tool, if they included fewerthan 25 patients, if they focused on a specific disease or treatment(eg, AIDS or hemodialysis), or if the tools were adapted to the localsituation (eg, the Taiwanese version of a tool).
Criterion validity is often expressed by sensitivity (se) and speci-ficity (sp), area under the curve (AUC), correlation coefficients, and
kappa values. Predictive validity is often expressed by odds ratios(ORs) and hazard ratios (HRs) or by P values.
To be able to rate the validity of the studied tools as good, good/fair,or poor, we applied cutoff points (Table 1). For correlation coefficients,we used the cutoff points described by Guilford.8 For kappa values, weused the classification system described by Landis and Koch.9 Forsensitivity and specificity, no general cutoff points are mentioned inthe literature; the optimal cutoff points highly depend on the clinicalconsequences. For the sake of transparency and clarity, we decided toindicate a sensitivity and specificity greater than 80% and an AUC ofgreater than 0.8 as good. Also, cutoff points for fair and poor perfor-mance were defined (Table 1). However, Tables 2 and 3 (the tablesdepicting the study data) give all the validity data, allowing the readersto form their own opinion if they do not agree with our proposed cutoffpoints. The cutoff points for OR and HR were chosen, based on the factthat a predictive ability with an OR/HR smaller than 2.0 will not havemuch practical value, the predictive ability with an OR between 2 and 3implicates a moderate/fair effect, and the predictive effect of greaterthan 3 will be large. If authors published only P values we scored good/fair when the sample size was smaller than 200. However, when thestudy had a large sample size, very small effects can become statisti-cally significant, and the clinical significance can be doubted. We ratedthese as “unable to rate” (in tables depicted with a “?”).
The PRISMA (Preferred Reporting Items for Systematic Reviewsand Meta-Analyses) statement was followed as a guide forreporting.10
Results
Literature Search
The literature search yielded, after de-duplication, 8313 references(Figure 1).
Two reviewers were independently responsible for the selectionof the articles for inclusion. First, all titles and abstracts, blinded forauthor, journal, and year, were screened for selection. This resulted in44 articles to be retrieved full text; 2 of those could not be found. Theremaining 42 articles were read full text, resulting in exclusion ofanother 18. The remaining 24 articles were included in this system-atic review. Two articles were included from checking the referencelists of relevant articles and review articles, totaling 26 references.
During the selection process, all differences in judgment wereresolved by consensus.
Tools
Twenty tools were identified. Criterion validity was described forall 20 tools, in 17 articles. Predictive validity was described for 8 tools,in 9 articles. Some tools were used for both purposes.
In this section, we describe the validity of tools, distinguishingbetween criterion validity (Table 2) and predictive validity (Table 3).We (in alphabetical order) first describe the tools that were originallydeveloped for the nursing home setting, then the tools developed forthe older population, and finally the tools that were developed for theadult population. For each tool, we briefly describe how the tool wasdeveloped (with which purpose, in which population), because thismay be illustrative for the performance of the tool. Following thedescription of a tool, we describe how the tool performed in laterstudies with regard to the 2 research question in 2 subsections:
- how valid is a tool to assess a nursing home resident’s nutri-tional status?
- how valid is a tool to predict a nursing home resident’s clinicaloutcome?
M.A.E. van Bokhorstede van der Schueren et al. / JAMDA 15 (2014) 171e184 173
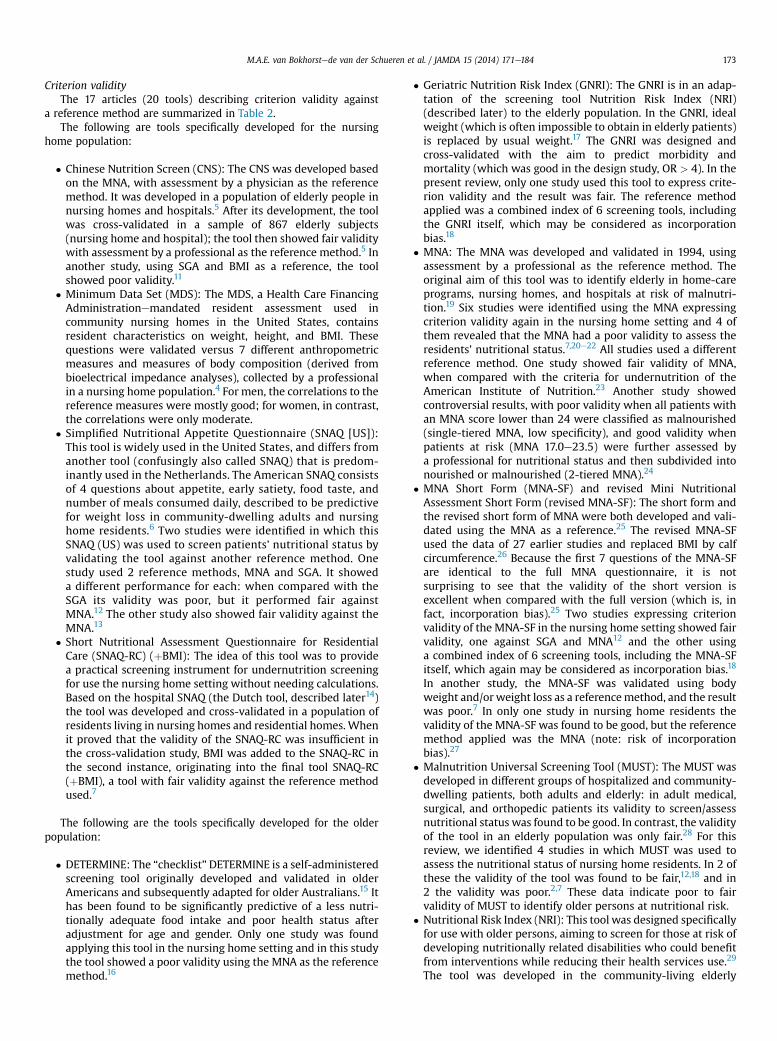
Criterion validityThe 17 articles (20 tools) describing criterion validity against
a reference method are summarized in Table 2.The following are tools specifically developed for the nursing
home population:
� Chinese Nutrition Screen (CNS): The CNS was developed basedon the MNA, with assessment by a physician as the referencemethod. It was developed in a population of elderly people innursing homes and hospitals.5 After its development, the toolwas cross-validated in a sample of 867 elderly subjects(nursing home and hospital); the tool then showed fair validitywith assessment by a professional as the reference method.5 Inanother study, using SGA and BMI as a reference, the toolshowed poor validity.11
� Minimum Data Set (MDS): The MDS, a Health Care FinancingAdministrationemandated resident assessment used incommunity nursing homes in the United States, containsresident characteristics on weight, height, and BMI. Thesequestions were validated versus 7 different anthropometricmeasures and measures of body composition (derived frombioelectrical impedance analyses), collected by a professionalin a nursing home population.4 For men, the correlations to thereference measures were mostly good; for women, in contrast,the correlations were only moderate.
� Simplified Nutritional Appetite Questionnaire (SNAQ [US]):This tool is widely used in the United States, and differs fromanother tool (confusingly also called SNAQ) that is predom-inantly used in the Netherlands. The American SNAQ consistsof 4 questions about appetite, early satiety, food taste, andnumber of meals consumed daily, described to be predictivefor weight loss in community-dwelling adults and nursinghome residents.6 Two studies were identified in which thisSNAQ (US) was used to screen patients’ nutritional status byvalidating the tool against another reference method. Onestudy used 2 reference methods, MNA and SGA. It showeda different performance for each: when compared with theSGA its validity was poor, but it performed fair againstMNA.12 The other study also showed fair validity against theMNA.13
� Short Nutritional Assessment Questionnaire for ResidentialCare (SNAQ-RC) (þBMI): The idea of this tool was to providea practical screening instrument for undernutrition screeningfor use the nursing home setting without needing calculations.Based on the hospital SNAQ (the Dutch tool, described later14)the tool was developed and cross-validated in a population ofresidents living in nursing homes and residential homes. Whenit proved that the validity of the SNAQ-RC was insufficient inthe cross-validation study, BMI was added to the SNAQ-RC inthe second instance, originating into the final tool SNAQ-RC(þBMI), a tool with fair validity against the reference methodused.7
The following are the tools specifically developed for the olderpopulation:
� DETERMINE: The “checklist”DETERMINE is a self-administeredscreening tool originally developed and validated in olderAmericans and subsequently adapted for older Australians.15 Ithas been found to be significantly predictive of a less nutri-tionally adequate food intake and poor health status afteradjustment for age and gender. Only one study was foundapplying this tool in the nursing home setting and in this studythe tool showed a poor validity using the MNA as the referencemethod.16
� Geriatric Nutrition Risk Index (GNRI): The GNRI is in an adap-tation of the screening tool Nutrition Risk Index (NRI)(described later) to the elderly population. In the GNRI, idealweight (which is often impossible to obtain in elderly patients)is replaced by usual weight.17 The GNRI was designed andcross-validated with the aim to predict morbidity andmortality (which was good in the design study, OR > 4). In thepresent review, only one study used this tool to express crite-rion validity and the result was fair. The reference methodapplied was a combined index of 6 screening tools, includingthe GNRI itself, which may be considered as incorporationbias.18
� MNA: The MNA was developed and validated in 1994, usingassessment by a professional as the reference method. Theoriginal aim of this tool was to identify elderly in home-careprograms, nursing homes, and hospitals at risk of malnutri-tion.19 Six studies were identified using the MNA expressingcriterion validity again in the nursing home setting and 4 ofthem revealed that the MNA had a poor validity to assess theresidents’ nutritional status.7,20e22 All studies used a differentreference method. One study showed fair validity of MNA,when compared with the criteria for undernutrition of theAmerican Institute of Nutrition.23 Another study showedcontroversial results, with poor validity when all patients withan MNA score lower than 24 were classified as malnourished(single-tiered MNA, low specificity), and good validity whenpatients at risk (MNA 17.0e23.5) were further assessed bya professional for nutritional status and then subdivided intonourished or malnourished (2-tiered MNA).24
� MNA Short Form (MNA-SF) and revised Mini NutritionalAssessment Short Form (revised MNA-SF): The short form andthe revised short form of MNA were both developed and vali-dated using the MNA as a reference.25 The revised MNA-SFused the data of 27 earlier studies and replaced BMI by calfcircumference.26 Because the first 7 questions of the MNA-SFare identical to the full MNA questionnaire, it is notsurprising to see that the validity of the short version isexcellent when compared with the full version (which is, infact, incorporation bias).25 Two studies expressing criterionvalidity of the MNA-SF in the nursing home setting showed fairvalidity, one against SGA and MNA12 and the other usinga combined index of 6 screening tools, including the MNA-SFitself, which again may be considered as incorporation bias.18
In another study, the MNA-SF was validated using bodyweight and/orweight loss as a referencemethod, and the resultwas poor.7 In only one study in nursing home residents thevalidity of the MNA-SF was found to be good, but the referencemethod applied was the MNA (note: risk of incorporationbias).27
� Malnutrition Universal Screening Tool (MUST): The MUST wasdeveloped in different groups of hospitalized and community-dwelling patients, both adults and elderly: in adult medical,surgical, and orthopedic patients its validity to screen/assessnutritional status was found to be good. In contrast, the validityof the tool in an elderly population was only fair.28 For thisreview, we identified 4 studies in which MUST was used toassess the nutritional status of nursing home residents. In 2 ofthese the validity of the tool was found to be fair,12,18 and in2 the validity was poor.2,7 These data indicate poor to fairvalidity of MUST to identify older persons at nutritional risk.
� Nutritional Risk Index (NRI): This tool was designed specificallyfor use with older persons, aiming to screen for those at risk ofdeveloping nutritionally related disabilities who could benefitfrom interventions while reducing their health services use.29
The tool was developed in the community-living elderly

Table 2Studies Expressing Criterion or Construct Validity of Nutrition Screening or Assessment Tools to Establish Nutritional Status
Screening Tool Author (Year) (Reference No.) Population Sample Size Reference Method Applied Diagnostic Accuracy Other* Ratingy
Tools Developed for the Nursing Home PopulationChinese Nutrition Screen (CNS) Woo, J (2005) (5) Elderly (�65 y) 867 Assessment by a professional se ¼ 60, sp ¼ 90, kappa to assessment
by professional in 2 differentpopulations ¼ 0.5 and 0.8
f
Lok, K (2009) (11) Elderly (�65 y) 511 SGA, BMI BMI <18,5: se ¼ 37, sp ¼ 83, ppv ¼ 25,npv ¼ 89.8
p
MDS (weight, height, and BMI fromMDS)
Blaum, CS (1997) (4) Elderly mean age 89.9 � 5.6 y 186 Anthropometric and body compositionmeasures of nutritional status derivedfrom bioelectrical impedancemeasurements (<25th percentile)
CCs for MDS parameters of weight andBMI ranged between 0.06 (fat freemass meneMDS BMI) to 0.83 (% bodyfat meneMDS weight), with goodcorrelations (>0.75) only betweenMDS weight and mid-arm musclearea, %BF and fat free mass in men(but not in women)
p-g
SNAQ (Simplified Nutrition AppetiteQuestionnaire)
Isenring, EA (2012) (12) Older adults (>55 y) 127 SGA, MNA to SGA: se ¼ 46 sp ¼ 77to MNA: se ¼ 71 sp ¼ 77
pf
Rolland, Y (2012) (13) Elderly (�65 y) 175 MNA SNAQ � 14: se ¼ 71 sp ¼ 74 fSNAQ-RC (Short NutritionalAssessment Questionnaire forResidential Care) without BMI
Kruizenga, HM (2010) (7) Elderly (mean age ¼ 84 y) 720 Body weight and/or weight loss se ¼ 59e45, sp ¼ 64e87, ppv ¼ 52e50npv ¼ 71e95
f
SNAQ-RC (Short NutritionalAssessment Questionnaire forResidential Care) þ BMI
se ¼ 87e87, sp ¼ 64e82, ppv ¼ 61e59npv ¼ 89e95
f
Tools Developed for the Older PopulationDETERMINE Charlton, KE (2007) (16) Elderly (>60 y) 283 MNA se ¼ 91, sp ¼ 11, ppv ¼ 56, npv ¼ 50 pGNRI Poulia, K-A (2012) (18) Elderly (>60 y) 248 Combined Index of 6 screening tools,
patients malnourished if they scorepositively on 4 out of the 6 tools
se ¼ 66, sp ¼ 92, ppv ¼ 95, npv ¼ 56 f
MNA Tarazona-Santabalbina, FJ (2009) (23) Elderly (>70 y) 52 Criteria for undernutrition of theAmerican Institute of Nutrition
se¼ 60 (95% CI 40.7e76.6) sp¼ 95 (95%CI 75e99) ppv ¼ 94 (95% CI 72e99)npv ¼ 64 (95% CI 46e79)
f
Cereda, E (2008) (20) Elderly (mean age 85.3 � 8.4 y) 123 BMI, %WL, lab, oral intake Pearson correlations of MNA to: agee0.11, BMI 0.66, %WL 0.44, AMA 0.40,diff lab parameters 0.01e0.23, oralintake 0.53
p
Christensson, L (2002) (21) Elderly (�65 y) 261 Combination of anthropometry andserum-proteins
se ¼ 96 sp ¼ 26 diagnostic predictivity31
p
Ferreira, LS (2008) (22) Elderly (>60 y) 89 Anthropometry (corrected arm musclearea - AMAc)
se¼ 84 sp¼ 36 ppv¼ 77 npv¼ 47 ROC:0.71
p
Visvanathan, R (2004) (24) Elderly (�65 y) 65 SNA (Standard Nutritional assessment-based on dieticians’ clinical practices)
Two-tiered MNA: se ¼ 89 (95% CI 69e97) sp ¼ 87 (95% CI 64e96)single-tiered MNA: se ¼ 92 (95% CI 77e98) sp ¼ 38 (95% CI 24e54)
g
p
Kruizenga, HM (2010) (7) Elderly (mean age ¼ 84 y) 308 Body weight and/or weight loss se ¼ 90e56, sp ¼ 36e58, ppv ¼ 26e26npv ¼ 94e95
p
MNA-SF Isenring, EA (2012) (12) older adults (>55 y) 127 SGA, MNA to SGA: se ¼ 86 sp ¼ 62to MNA: se ¼ 100 sp ¼ 56
ff
Poulia, K-A (2012) (18) Elderly (>60 y) 248 Combined Index of 6 screening tools,patients malnourished if they scorepositively on 4 out of the 6 tools
se ¼ 98, sp ¼ 50, ppv ¼ 80, npv ¼ 93 f
Kruizenga, HM (2010) (7) Elderly (mean age 84 y) 308 Body weight and/or weight loss se ¼ 98e96, sp ¼ 18e16, ppv ¼ 23e10npv ¼ 98e98
p
Isenring, EA (2009) (35) Elderly (mean age 84 y) 285 SGA se ¼ 84 sp ¼ 66 ppv ¼ 65 npv ¼ 84 f
M.A.E.van
Bokhorstede
vander
Schuerenet
al./JAMDA15
(2014)171
e184
174
Revised MNA-SF Garcia-Mesenguer, MJ (2013) (27) Elderly (�65 y) 895 MNA BMI-MNA-SF: “malnourished-risk” vs“well nourished: se ¼ 86, sp ¼ 88,ppv ¼ 83, npv ¼ 90, AUC ¼ 95 (95% CI94e96)CC-MNA-SF: “malnourished-risk” vs“well nourished”: se ¼ 86, sp ¼ 83,ppv ¼ 78, npv ¼ 93, AUC ¼ 92 (95% CI91e94)BMI-MNA-SF: “malnourished” vs“risk-well nourished”: se ¼ 84, sp ¼97, ppv¼ 45, npv¼ 99, AUC¼ 98 (95%CI 96e99)CC-MNA-SF: “malnourished” vs “risk-well nourished”: se ¼ 92, sp ¼ 94,ppv ¼ 31, npv ¼ 100, AUC ¼ 98 (95%CI 97e99)
g
g
g
g
MUST Diekmann, R (2013) (2) Elderly (�65 y) 200 MNA kappa ¼ 0.16 pIsenring, EA (2012) (12) Older adults (>55 y) 127 SGA, MNA To SGA: se ¼ 69 sp ¼ 97
to MNA: se ¼ 76 sp ¼ 87ff
Poulia, K-A (2012) (18) Elderly (>60 y) 248 Combined Index of 6 screening tools,patients malnourished if they scorepositively on 4 out of the 6 tools
se ¼ 87 sp ¼ 77 ppv ¼ 88,4 npv ¼ 75 f
Kruizenga, HM (2010) (7) Elderly (mean age ¼ 84 y) 308 Body weight and/or weight loss se ¼ 53e39, sp ¼ 94e96, ppv ¼ 67e48npv ¼ 89e94
p
NRI Poulia, K-A (2012) (18) Elderly (>60 y) 248 Combined Index of 6 screening tools,patients malnourished if they scorepositively on 4 out of the 6 tools
se ¼ 72, sp ¼ 49, ppv ¼ 85, npv ¼ 29 p
NUFFE Soderhamn, U (2002) (31) Elderly (�65 y) 114 MNA, anthropometry Spearman rank to MNA: e0, 74Spearman rank (at admission) to BMIe0, 25, to mid arm circumferencee0,23 and to calf circumferencee0,25
f
Rapid Screen Visvanathan, R (2004) (24) Elderly (�65 y) 65 SNA (Standard Nutritional assessment-based on dieticians’ clinical practices)
se¼ 92 (95% CI 77.4e98.0), sp¼ 38 (95%CI 24.2e53.9)
p
Simple ScreeningTool# 1 Laporte, M (2001) (33) Elderly (�65 y) 70 Assessment by a professional se ¼ 77 sp ¼ 70 fLaporte, M (2001) (32) Elderly (�65 y) 49 Assessment by a professional se ¼ 85 sp ¼ 76 f
Simple ScreeningTool# 2 Laporte, M (2001) (33) Elderly (�65 y) 70 Assessment by a professional se ¼ 87 sp ¼ 65 fLaporte, M (2001) (32) Elderly (�65 y) 49 Assessment by a professional se ¼ 90 sp ¼ 45 p
Tools Developed for the Adult PopulationMST Isenring, EA (2012) (12) older adults (>55 y) 127 SGA, MNA to SGA: se ¼ 89 sp ¼ 93
to MNA: se ¼ 94 sp ¼ 81gg
NRS Diekmann, R (2013) (2) Elderly (�65 y) 200 MNA kappa ¼ 0.13 pNRS-2002 Poulia, K-A (2012) (18) Elderly (>60 y) 248 Combined Index of 6 screening tools,
patients malnourished if they scorepositively on 4 out of the 6 tools
se ¼ 99, sp ¼ 6 ppv ¼ 68 npv ¼ 83 p
SGA Poulia, K-A (2012) (18) Elderly (>60 y) 248 Combined Index of 6 screening tools,patients malnourished if they scorepositively on 4 out of the 6 tools
se ¼ 84, sp ¼ 91, ppv ¼ 95, npv ¼ 74 g
Christensson, L (2002) (21) Elderly (�65 y) 261 Combination of anthropometry andserum-proteins
se ¼ 93, sp ¼ 61, diagnosticpredictivity ¼ 47
f
SNAQ (Short Nutritional AssessmentQuestionnaire)
Kruizenga, HM (2010) (7) Elderly (mean age ¼ 84 y) 308 Body weight and/or weight loss se ¼ 50e62, sp ¼ 85e89, ppv ¼ 44e33npv ¼ 88e96
f
AUC, area under the curve; BF, body fat; BMI, body mass index; CC, correlation coefficient; CI, confidence interval; diff, difference; GNRI, Geriatric Nutrition Risk Index; MDA, Minimum Data Set; MNA, Mini NutritionalAssessment; MNA-SF, MNA Short Form; MST, Malnutrition Screening Tool; MUST, Malnutrition Universal Screening Tool; npv, negative predictive value; NRI, Nutritional Risk Index; NRS, Nutrition Risk Screening; NUFFE,Nutritional form for the Elderly; ppv, positive predictive value; ROC, receiver operator curve; se, sensitivity; SGA, Subjective Global Assessment; sp, specificity; WL, weight loss.
*k ¼ kappa.yRating: g ¼ good, f ¼ fair, g/f ¼ good/fair, p ¼ poor, ? ¼ unable to be rated.
M.A.E.van
Bokhorstede
vander
Schuerenet
al./JAMDA15
(2014)171
e184
175
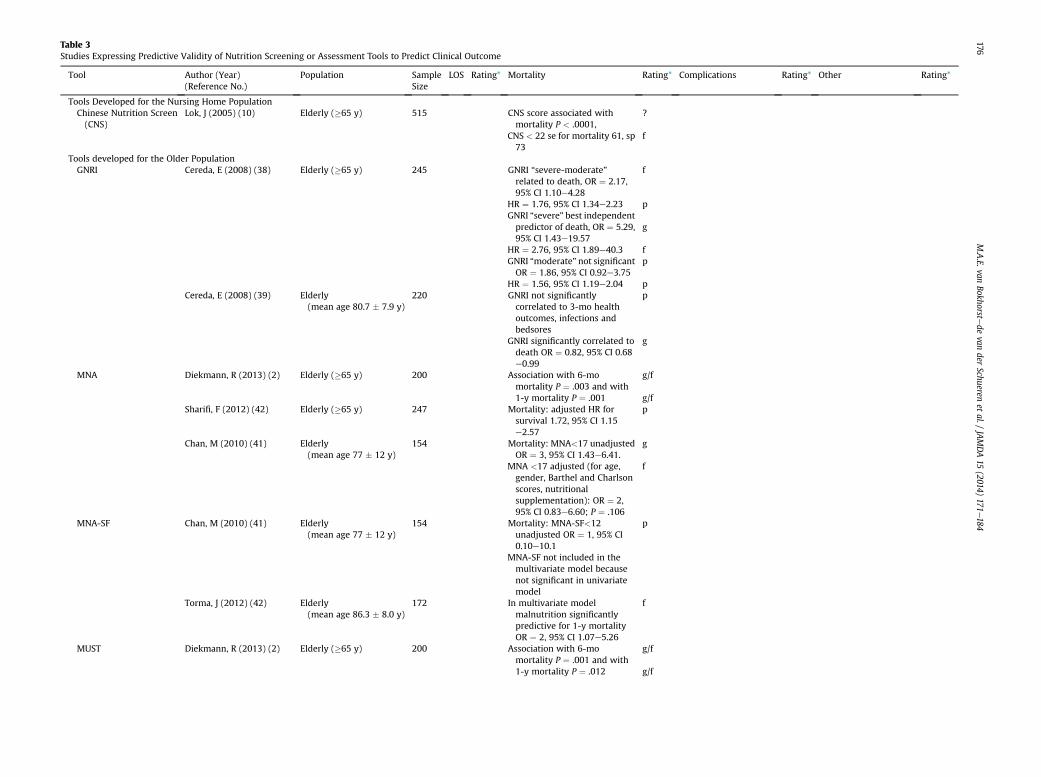
Table 3Studies Expressing Predictive Validity of Nutrition Screening or Assessment Tools to Predict Clinical Outcome
Tool Author (Year)(Reference No.)
Population SampleSize
LOS Rating* Mortality Rating* Complications Rating* Other Rating*
Tools Developed for the Nursing Home PopulationChinese Nutrition Screen(CNS)
Lok, J (2005) (10) Elderly (�65 y) 515 CNS score associated withmortality P < .0001,
CNS < 22 se for mortality 61, sp73
?
f
Tools developed for the Older PopulationGNRI Cereda, E (2008) (38) Elderly (�65 y) 245 GNRI “severe-moderate”
related to death, OR ¼ 2.17,95% CI 1.10e4.28
HR ¼ 1.76, 95% CI 1.34e2.23GNRI “severe” best independentpredictor of death, OR ¼ 5.29,95% CI 1.43e19.57
HR ¼ 2.76, 95% CI 1.89e40.3GNRI “moderate” not significantOR ¼ 1.86, 95% CI 0.92e3.75
HR ¼ 1.56, 95% CI 1.19e2.04
f
p
g
fp
pCereda, E (2008) (39) Elderly
(mean age 80.7 � 7.9 y)220 GNRI not significantly
correlated to 3-mo healthoutcomes, infections andbedsores
GNRI significantly correlated todeath OR ¼ 0.82, 95% CI 0.68e0.99
p
g
MNA Diekmann, R (2013) (2) Elderly (�65 y) 200 Association with 6-momortality P ¼ .003 and with1-y mortality P ¼ .001
g/f
g/fSharifi, F (2012) (42) Elderly (�65 y) 247 Mortality: adjusted HR for
survival 1.72, 95% CI 1.15e2.57
p
Chan, M (2010) (41) Elderly(mean age 77 � 12 y)
154 Mortality: MNA<17 unadjustedOR ¼ 3, 95% CI 1.43e6.41.
MNA <17 adjusted (for age,gender, Barthel and Charlsonscores, nutritionalsupplementation): OR ¼ 2,95% CI 0.83e6.60; P ¼ .106
g
f
MNA-SF Chan, M (2010) (41) Elderly(mean age 77 � 12 y)
154 Mortality: MNA-SF<12unadjusted OR ¼ 1, 95% CI0.10e10.1
MNA-SF not included in themultivariate model becausenot significant in univariatemodel
p
Torma, J (2012) (42) Elderly(mean age 86.3 � 8.0 y)
172 In multivariate modelmalnutrition significantlypredictive for 1-y mortalityOR ¼ 2, 95% CI 1.07e5.26
f
MUST Diekmann, R (2013) (2) Elderly (�65 y) 200 Association with 6-momortality P ¼ .001 and with1-y mortality P ¼ .012
g/f
g/f
M.A.E.van
Bokhorstede
vander
Schuerenet
al./JAMDA15
(2014)171
e184
176

Rap
idScreen
Visva
nathan
,R(200
4)(23)
Elderly
(�65
y)65
Pred
ictingpoo
rdisch
arge
outcom
es(P
¼.004
)
g/f
ToolsDev
elop
edfortheAdultPo
pulation
NRS
Diekm
ann,R
(201
3)(2)
Elderly
(�65
y)20
0Assoc
iation
with6-mo
mortalityP¼.046
andwith1-
ymortalityP¼
.039
g/f
g/f
SGA
Lok,
J(200
5)(10)
Elderly
(�65
y)51
5CNSscoreassociated
with
mortalityP<
.000
1,CNS<
22se
formortality61
,sp
72
? f
Sack
s,GS(200
0)(44)
Elderly
(�65
y)53
BothSG
Aclassan
dSG
Aco
mpositescoresign
ificantly
relatedto
dea
th(P
<.05);
SGAco
mpositescore>5se
formortality¼
75,spfor
mortality¼
84
g/f
SGAclassnot
sign
ificantlyrelated
tomajor
infections(P
¼.097
),SG
Aco
mpositescore
sign
ificantlyrelated
tomajor
infections
(P¼
.043
)
p g/f
SGAco
mpositescore
>15
relatedto
read
mission
se50
,sp80
,P<
.05
f
CI,co
nfiden
ceinterval;GNRI,Geriatric
NutritionRiskIndex
;HR,h
azardratio;
LOS,
lengthof
stay
;MDA,M
inim
um
DataSe
t;MNA,M
iniN
utritional
Assessm
ent;MNA-SF,
MNASh
ortFo
rm;MST
,MalnutritionScreen
ingTo
ol;
MUST
,MalnutritionUniversalS
cree
ningTo
ol;N
RI,Nutritional
RiskIndex
;NRS,NutritionRiskScreen
ing;
NUFFE,
Nutritional
Form
FortheElderly;O
R,o
ddsratio;
se,sen
sitivity;S
GA,Subjective
Globa
lAssessm
ent;sp
,specificity.
*Rating:
g¼
good
,f¼
fair,g
/f¼
good
/fair,p¼
poo
r,?¼
unab
leto
berated.
M.A.E. van Bokhorstede van der Schueren et al. / JAMDA 15 (2014) 171e184 177
patients in 1990 and validated in the outpatient setting. In itsdevelopment study, the NRI correlated significantly with BMIand different laboratory values, reference methods that are notconsidered acceptable standards according to our criteria. TheNRI was applied in only one study in the nursing home settingand it performed poorly when compared with a combinedindex of 6 screening tools, including NRI itself. Again this maybe considered as incorporation bias.18
� Nutritional Form For the Elderly (NUFFE): The NUFFE wasdeveloped for the elderly population, applying BMI, albuminlevels, and weight index as reference methods, showing poorcorrelations to all. The instrument was designed as a form thatcontains items that reflect functional, social, nutritional, andhealth-related aspects of nutritional intake.30 After its devel-opment and validation study, the NUFFE was applied againusing anthropometry and the assessment tool MNA as a refer-ence method gold standard and the validity of the NUFFE wasfound to be fair.31
� Rapid Screen: This tool was used to assess the nutritional statusof hospitalized elderly. We were unable to retrieve its originaldevelopment study. The tool consists of BMI and/or reportedweight loss over the previous 3 months and the 2-tiered MNAprocess. For this review, we found one study validating this toolagainst dieticians’ clinical practice assessment, in which itshowed a poor validity.24
� Simple Screening Tool #1 and Simple Screening Tool #2: TheSimple Screening Tools #1 and #2 were both developedrecruiting patients from 2 settings (adults and elderly in acutecare and elderly in long term care) with the purpose ofscreening protein-energy malnutrition. The first screening toolencompassed BMI and weight loss and the second toolencompassed BMI and albumin level. In the developmentstudy, the reference method applied was assessment bya professional and the tools showed low sensitivity (less than50%), demonstrating poor validity.32 To demonstrate thecriterion validity in nursing home patients, we identified2 studies testing the Simple Screening Tool #1 and SimpleScreening Tool #2, one including 70 nursing home patients(subset of a total study population of 142) and the otherincluding 49 patients (subset of a total study population of160).32,33 Both studies applied the same reference method(in-depth assessment by a professional) for both tools. TheSimple Screening Tool #1 performed fair in the 2 studies andthe Simple Screening Tool #2 performed poorly when tested inthe smaller sample.
The following tools were developed for the adult population:
� Malnutrition Screening Tool (MST): The MST was developed inadult hospitalized patients applying the SGA as the referencemethod and showing a good validity. It is considered a “quickand easy” screening tool and it is widely used in the Austral-asian region.34 Two later studies assessed the construct validityof the MST in the nursing home population. In one, MST wascompared with SGA in the elderly population showing fairvalidity.35 A few years later, when compared with the SGA andMNA in older adults (>55 years old), the result was goodagainst both tools.12
� Nutrition Risk Screening (NRS): This tool was developed ina population of newly admitted adult medical and surgicalpatients in 1995. An assessment by a professional and thegeriatric tool NRI were chosen as the reference methods. Thecorrelations to the references applied were good and fair,respectively, but the overall data presentation of the develop-ment study was poor.36 In the only study identified describing
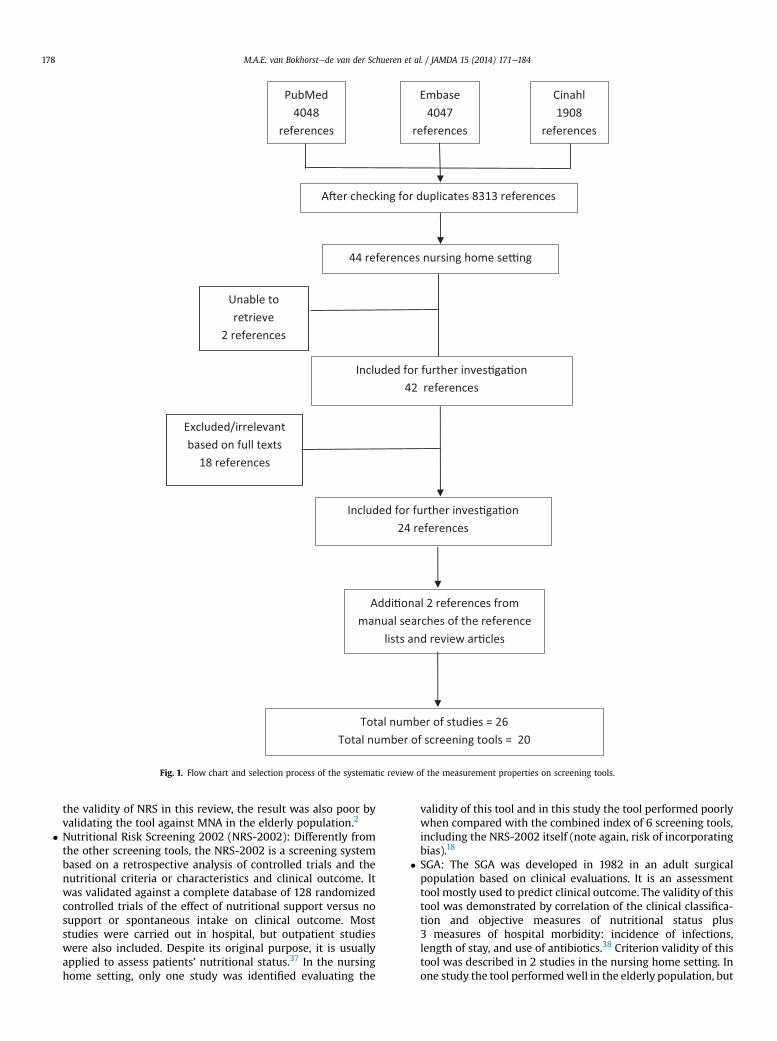
Fig. 1. Flow chart and selection process of the systematic review of the measurement properties on screening tools.
M.A.E. van Bokhorstede van der Schueren et al. / JAMDA 15 (2014) 171e184178
the validity of NRS in this review, the result was also poor byvalidating the tool against MNA in the elderly population.2
� Nutritional Risk Screening 2002 (NRS-2002): Differently fromthe other screening tools, the NRS-2002 is a screening systembased on a retrospective analysis of controlled trials and thenutritional criteria or characteristics and clinical outcome. Itwas validated against a complete database of 128 randomizedcontrolled trials of the effect of nutritional support versus nosupport or spontaneous intake on clinical outcome. Moststudies were carried out in hospital, but outpatient studieswere also included. Despite its original purpose, it is usuallyapplied to assess patients’ nutritional status.37 In the nursinghome setting, only one study was identified evaluating the
validity of this tool and in this study the tool performed poorlywhen compared with the combined index of 6 screening tools,including the NRS-2002 itself (note again, risk of incorporatingbias).18
� SGA: The SGA was developed in 1982 in an adult surgicalpopulation based on clinical evaluations. It is an assessmenttool mostly used to predict clinical outcome. The validity of thistool was demonstrated by correlation of the clinical classifica-tion and objective measures of nutritional status plus3 measures of hospital morbidity: incidence of infections,length of stay, and use of antibiotics.38 Criterion validity of thistool was described in 2 studies in the nursing home setting. Inone study the tool performedwell in the elderly population, but

M.A.E. van Bokhorstede van der Schueren et al. / JAMDA 15 (2014) 171e184 179
the referencemethod, again, was the combined index of 6 tools,one of them SGA itself (thus there may be incorporating bias).18
In the other study, the SGA showed fair validity when thereferencemethod applied was a combination of anthropometryand serum-proteins, although the last one is not considered asa “valid” reference in our review.21
� Short Nutritional Assessment Questionnaire (SNAQ [NL]): Veryconfusing, 2 tools are abbreviated as SNAQ. This “other” SNAQwas developed in the Netherlands and is the tool mostfrequently used in this country. The purpose of this tool was tobe a “quick and easy” 4-item instrument capable of identifyingadult hospitalized patients (medical and surgical) at nutritionalrisk, without the need to calculate percentage of weight loss orBMI. The reference method applied for its development andvalidation was the nutritional assessment and anthropom-etry.14 In this review, the SNAQ showed fair validity againstbody weight and/or weight loss in elderly nursing homepatients.7
Of 20 tools applied in the nursing home population, 4 wereoriginally developed for use in this specific setting (CNS, MDS, SNAQ[US tool] and SNAQ-RC [without, and with BMI]), 8 were originallydeveloped for use among elderly (DETERMINE, GNRI, MNA, MNA-SF[and its revised form], NRI, NUFFE, Rapid Screen), 5 for use amongadult persons (MST, NRS, SGA, SNAQ (Dutch tool), NRS-2002), and3 (MUST, and the Simple Screenings Tools #1 and #2) for use in bothadult and older persons. Nevertheless, the criterion validity of alltools, also the ones aiming specifically at the long term care setting,was, in general, only fair.
The tools were validated against many different semigold referencemethods, arising from the fact that no accepted gold standard exists fordefining malnutrition. The study by Poulia et al18 even used a combi-nation of 6 existing tools as the reference method. The 6 individualtools were validated against the combination of all 6, which deservesat least a methodological comment, this can induce incorporation bias,but even then the tools performed only poorly or fair.
The relative good performance of the revised form of the MNA-SFin the study by Garcia-Meseguer and Serrano-Urrea27 may raise thesuggestion that this tool deserves a better judgement than “fair.”However, the MNA-SF was validated against the full-MNA in thisstudy, with the first 6 questions being identical. Incorporation bias is,therefore, likely to explain the good result.
Predictive validityNine studies, applying 8 different tools, were identified describing
the predictive validity of malnutrition screening tools for nursinghome residents (Table 3).
The following tool was developed for the nursing homepopulation:
� CNS: In a study among 515 nursing home residents, both CNSand SGA were associated with mortality; the strength of theassociation between either tool and mortality was fair andcomparable for both tools.11
The following tools were developed for the older population:
� GNRI: The GNRI was developed with the specific aim to predictnutrition-related morbidity and mortality among olderpersons.17 For this review, 2 studies were identified, both byCereda et al.39,40 In one study, severe malnutrition had fair togood predictive validity for mortality, but moderate malnutri-tion was not predictive.39 In the other, malnutrition (by GNRI)was independently associated with death, but not with otherhealth-related outcomes.40
� MNA: The MNA, originally developed to identify malnutritionamong frail and healthy elderly in all health care settings, wasapplied in 3 studies to predict mortality among nursing homepatients.2,41,42 In the study by Chan et al,41 the MNA had goodpredictive validity for mortality in the unadjusted analyses;however, after adjusting for age, gender, comorbidities, andfunction, the predictive validity disappeared. The study bySharifi et al42 showed poor predictive validity of MNA tomortality, both in the unadjusted and in the adjusted model.Finally, in the study by Diekmann et al,2 the associationbetween MNA and mortality was expressed by P values only(P < .05), which complicates the rating of the tool becauseP values do not give an impression of the strength of theassociation. Taking into account the sample size studied(n ¼ 200), the predictive validity of MNA for mortality in thisstudy was most likely fair or good.
� MNA-SF: The study by Chan et al,41 mentioned previously, alsoassessed the predictive validity of the short form of the MNA.MNA-SF was not predictive for mortality in the univariate or inthe multivariate model. In a study by Torma et al,43 in contrast,MNA-SF showed fair to good predictive validity for mortality,with an OR of 2, adjusted for other parameters.
� MUST: Diekmann and coworkers2 assessed the predictive val-idity of more than one tool in the same population: MNA (seeearlier), MUST and NRS (see later). As described in the sectionunder MNA, data were, unfortunately, expressed only by Pvalues. MUST showed comparable results to MNA and NRS,with most likely fair to good predictive validity to predictmortality.
� Rapid Screen: The tool Rapid Screen was applied not to predictmortality, but to predict poor discharge outcomes of patientsadmitted to a subacute care facility.24 Patients identifiedmalnourished were more likely to be admitted to an acutehospital or accommodation; however, this conclusion is not tooconvincing, as data were expressed by P values only (unable torate the strength of the association).
The following tools were developed for the adult population:
� NRS: As a follow-up to the text described underMNA andMUST,Diekmann et al2 also described the results for NRS in predictingmortality, suggesting fair to good predictive validity of the tool.
� SGA: In a study by Sacks et al,44 SGA class and SGA compositescore were associated with mortality, infections, and read-missions in a geriatric population to a long term care facility. SGAclasses were derived according to the original study by Bakeret al.38 A composite score was derived based on (subjective)severity scoring of each clinical feature in the SGA. Dependingon the method (SGA class or composite score), SGA showedgood/fair (SGA class, P < .05), respectively fair (SGA compositescore, sensitivity 75, specificity 84) predictive validity formortality; poor (SGA class) or good/fair (SGA composite score)predictive validity for major infections; and fair predictive val-idity (SGA composite score only) for readmission. Lok andcolleagues11 studied the predictive validity of the SGA in a groupof 515 nursing home residents, concurrently with the CNS; bothtools showed fair predictive validity.
Nine studies described the predictive validity of screening toolsin the nursing home setting. All showed mostly fair predictive validityof tools, with no tool being superior to the other ones. The inter-pretation of the data was hampered by the fact that many of thestudies presented data as P values only.
Two studies applied more than one tool in the same population. Inone study, the tools were SGA and CNS,11 in the other study, the tools
M.A.E. van Bokhorstede van der Schueren et al. / JAMDA 15 (2014) 171e184180
were MNA, MUST, and NRS.2 It was striking to see that the perfor-mance of the different tools in the same study population was moreor less the same.
Discussion
This review shows that malnutrition screening in long term carefacilities using existing tools has serious limitations. None of thenutrition screening or assessment tools included in the studies in thisreview performed consistently well in assessing the nutritional statusof the residents, not even the tools that were originally designed forassessing the nutritional status of older persons. When reviewingthese results, the question may arise whether the nutritional status ofa nursing home resident can be captured well enough by a simplescreening or assessment tool, whether the tools are all poor, orwhether the different reference methods were perhaps inadequatefor the older population.
In addition, evaluating the predictive validity of malnutrition washindered by the identification of only 9 studies, and in some of thesestudies only P values were presented without any indication of thestrength of the association between malnutrition and outcome. Inaddition, prediction validity of tools may be affected by many con-founding factors, such as disease and the proximity to end of life.Therefore, validation using prediction may not reach a high degree ofaccuracy, as the contribution of malnutrition to, for example, the riskof dying is only small.45 None of the tools showed good predictivevalidity for malnutrition-related outcomes.
Validity of Tools
It is expected that a tool performs best when it is applied in thesame population and with the same goal as in the developmentstudy. In contrast, a tool that was developed for screening nutritionalstatus in, for example, an adult surgical population is expected toperform less adequately in predicting outcome in an older nursinghome population. This review illustrates that even the tools that werespecifically developed for use in the long term care setting did notshow good criterion or predictive validity. The question may arisewhether the nutritional status (often resulting from a multifactorialbackground) of a nursing home resident can be captured well enoughby a simple nutrition screening/assessment tool that is often largelybased on weight (loss), BMI, and appetite questions, whether thetools are all poor, or whether the different reference methods wereperhaps inadequate for the older population. Perhaps, for the nursinghome setting, factors specific to the nursing home population, forexample the ability to eat alone or with help, oral health, or dietaryintake, should be included in the tools.
Gold Standard
Expressing validity of tools in the absence of a gold standard isa challenge.46 By expert opinion, we decided to regard the assessmenttools SGA, MNA, a full nutritional assessment, or assessment bya professional as reference methods. However, these referencemethods were not specifically designed for use in the nursing homepopulation, and may, therefore, not be the ideal reference methods(missing, for example, specific nursinghomeproblems). Thus, difficultyof having good validity might come from the validation criteria, whichmight not relate to the nutritional risks encountered in nursing homes.
Weight, Height, BMI, and Anthropometric Measurements
Each tool consists of different components. Almost all toolscontain questions on weight, recent (involuntary) weight loss, height,
and/or BMI. Although no unanimously shared definition of malnu-trition exists, most experts will agree that weight, weight changes,BMI, and/or decreased intake are most likely to be part ofa definition.46
Loss of weight and BMI carry different weights in the differentscreening tools; for example, BMI is very important in MUST, whereasit represents maximally 21% of the MNA-SF and 10% of the MNA, andis not present in SNAQ.
Moreover, for older persons, cutoff points for weight, and derivedBMI, are not agreed on. The elderly are known to suffer from an age-related decrease in lean mass and an increase in body fat. This age-related phenomenon, called sarcopenia, may be accelerated by,among others, nutritional deficiencies and disuse of muscle.47,48
Because of its inability to detect age-related changes in bodycomposition (eg, spinal deformities, changed body fat redistribution),BMI is thought not to be the most appropriate predictor of morbidityand mortality in the elderly. Although the World Health Organizationdefines severe thinness by a BMI cutoff point lower than 18.5, thiscut-point is disputed for the elderly. The screening tools studiedapply BMI cutoff points ranging between 1536 and 22,24 and thesemight not be indicative for malnutrition in older subjects. In a recentsystematic review, the optimal BMI range for the lowest mortality inthe elderly was overweight (25 kg/m2 � BMI < 30 kg/m2) or mildlyobese (30 kg/m2 � BMI < 35 kg/m2).49 Higher cutoff points for BMIare therefore suggested, but the optimal cutoff point remains to bedetermined.
Another disadvantage of including weight and BMI in malnutri-tion screening tools for the elderly is that advanced dependency inactivities of daily living may hinder the measurement of weight andheight. Studies report missing weights in up to 50% of includedelderly individuals.4,50
Moreover, height measurements may have the constraints ofstanding problems, spinal deformities, and fluid disturbances.Different studies contradict on the best anthropometric predictor formortality among older persons. Arm circumference, calf circumfer-ence, lean body mass, waist circumference, or waist-hip ratio have allbeen mentioned. For the detection of undernutrition, arm circum-ference or calf circumference have been included in some of the tools,as substitutes, or even as better alternatives for BMI.26,51 Thesemeasures are more easy to obtain and the assumption is that low (armor calf) circumference is a better measure of actual body compositionthan BMI, whereas arm or calf circumference are a better reflection ofmuscle mass.
Appetite and Intake
Appetite and/or insufficient dietary intake are part of mostscreening tools as well. It is well known that older persons havea linear decrease in food intake with increasing age. This is explainedby decreased physical activity and altered metabolism with aging.52
In addition, a high level of care dependency, polypharmacy, chew-ing problems, and swallowing problems have been identified asfactors contributing to a poor intake, specifically in the nursing homesetting.
Objectifying food intake, in relation to nutritional needs, may bea challenge. Studies have shown that residents living in long termcare facilities frequently have intakes of energy, proteins, and mi-cronutrients below requirements.53,54 Energy requirements arethought to be at least 1500 kcal per day, as has recently been shownamong hospitalized geriatric patients, and protein requirements arethought to be higher than the general recommendation of 0.8 g/kgper day.55e57
If a deficient nutritional intake can be reversed, this mightimprove clinical outcome. Milne et al’s Cochrane review58 suggests
M.A.E. van Bokhorstede van der Schueren et al. / JAMDA 15 (2014) 171e184 181
that providing extra energy and protein to malnourished and/orgeriatric older individuals (eg, nursing home residents) is likely todecrease complications and mortality. It has, in addition, been sug-gested that not only the nutritional content of the nutrition offered,but also the eating environment (the environment itself, assistancewith eating) may play a role in improving the intake of theresidents.59
Multifactorial Background
A study using the Minimum Data Set in US nursing homes showedthat deficient oral intake, loss of ability to eat independently, pressureulcers, and chewing disorders were all factors associated with signs ofmalnutrition.4 Other studies have pointed out that malnutrition inthe elderly is almost always a combination of a poor intake on the onehand, and multiple other problems (either in the somatic, functional,cognitive, or social domain) on the other hand.60,61 Some authorseven suggest considering malnutrition a geriatric syndrome, havingmultiple underlying causes, and needing a multifactorialapproach.61,62 Screening tools that investigate the causes of under-nutrition, next to the nutritional status itself, are therefore of moreinterest than screening tools only inquiring for weight changes orBMI. Perhaps the ideal screening tool for the nursing home residentshould include more factors addressing the multifactorial problemsthat nursing home residents are faced with; that is, dietary factors,being (in)dependent of help for eating, environment, and oral health,next to general and anthropometric factors.
Following screening, a comprehensive geriatric assessment isnecessary to obtain more information on the possible underlyingcauses for malnutrition.62
Nutritional Intervention
Screening is meant to identify residents at nutritional risk, whoare expected to benefit from nutritional support with regard to(physical or cognitive) function, quality of life, occurrence ofcomplications, or even mortality. However, none of the studiesincluded in this review described whether the residents had receiveda nutritional intervention, and whether this had influenced theiroutcome. This kind of study should be planned for the near future,especially when investigating the predictive validity of tools (becauseof the longitudinal nature of this kind of study). For studies describingcriterion validity, this is less important, because these studies usuallyhave a cross-sectional design.
More in general, the evidence for the effectiveness of nutritionalsupplements containing protein and energy, often prescribed for olderpeople, is still limited. Supplementation is known to produce a smallweight gain in older people and mortality and complications maybe reduced in those who are undernourished. However, the latestCochrane review found no evidence of improvement in functionalbenefit or reduction in length of hospital stay with supplements.58
Naturally, residents close to the end of life, or residents withongoing cachexia (due to progressive disease) should not be offered“aggressive” nutritional therapy, as this is known to be ineffec-tive.63,64 For these persons, the therapy should aim at providingmaximal comfort and end-of life care.
Comparing Tools
The variety in study design, population, tools, reference methods,outcome measures, and follow-up time made it impossible to pooldata or to perform meta-analyses. To be able to compare tools, wehad to rely on studies applying more than one tool in the samepatient population. These studies have the advantage that they are
not biased by (differences) in study population, methodology, oroutcome measures. We identified 2 such studies. In the study byDiekmann et al,2 MUST, NRS, and MNAwere used; in the study by Loket al,11 the tools were SGA and CNS. As mentioned previously, thetools performed strikingly similarly in predicting malnutrition-related outcomes. This raises a few questions:
Is the general condition of the resident probably more predictiveof outcome than the tool? Or, is the multicausal background ofmalnutrition in this population (malnutrition as a “geriatricsyndrome”) too complex for a “simple” nutrition tool to pick up thedeficiency? Or, the most straightforward explanation: are the toolssimply not good enough for this specific population? This last ques-tion is substantiated by the fact that the tools did not perform wellwith regard to criterion validity either. We recommend that morestudies be performed in which more tools are applied to the samestudy population. Only thenwill we be able to appoint a superior tool,if there is such a tool.
Earlier Reviews
In 2012, Dent and coworkers65 published a systematic review onnutritional screening tools as predictors of mortality, functionaldecline, and move to higher-level care in older people. This reviewwas broader than our review with respect to types of studies andoutcome measures included: studies were also included if they hadbeen performed in the community or in the hospital setting; also theoutcome measures of functioning and moving to higher level of carewere considered. On the other hand, the review by Dent et al65 wasmore narrow, as it studied predictive validity only, whereas we alsoincluded studies establishing criterion validity.
Nevertheless, the conclusions of Dent et al’s review65 (including 7studies in the nursing home setting, 6 overlapping with our review)are very similar to ours: whereas Dent et al65 concludes that nutritionscreening tools have only modest positive predictive power, weconclude that the predictive validity of tools is not better than fair.
As for criterion validity, we recently published a study on thevalidity of screening tools for the hospital setting.66 Both the earlierreview and the present one conclude that there is not a singlescreening tool that is capable of optimal nutrition screening, not forhospitalized patients, nor for nursing home residents. This impliesthat a good clinical assessment, by a doctor, specialized nurse, ordietitian with interest and knowledge of (symptoms of) malnutritionremains to play a major role. These professionals should not only askfor the components that are included in the tools (weight loss, BMI, orappetite), but also rely on their clinical impression and inquire forpossible underlying causes (eg, poor dentition, swallowing problems,cognitive impairment, impaired physical functioning) of malnutrition.For the nursing home population, we suggest performing such anassessment at admission and then every 3 months thereafter.
Elia and Stratton67 recently described that screening tools de-signed for different age groups often incorporate factors that arenonmodifiable by nutritional support, among which is age itself. Theyemphasize that relying disproportionally on a particular tool or ona particular tool characteristic can be problematic, especially if agealone can predict outcome more effectively. This suggestion is espe-cially true for nursing home residents, who are often close to the endof life. Indeed, the studies included in this systematic review supportthe conclusion by Elia and Stratton.67 Not a single tool was capable ofperfectly assessing nutritional status or predicting outcome.
Strength and Limitations
For this review, we performed an extensive literature search in3 different databases and we included studies published in 5 different

M.A.E. van Bokhorstede van der Schueren et al. / JAMDA 15 (2014) 171e184182
languages. We, therefore, believe that the search has been quitecomplete. Still, we excluded studies in specific subgroups of patients,for example, hemodialysis patients, small studies, and studiesinvolving modifications of tools for, for example, the Taiwanese orKorean population.
The studies describing predictive validity of tools should be in-terpreted with caution, especially if only univariate analyses werepresented. Outcome, especially in older subjects, is known to belargely influenced by underlying disease, comorbidities, age, socialsituation, and cognitive functioning. Studies not adjusting for theseother variables are less valuable.
For reasons of comparison, we decided to rate the performance ofthe tools as good, fair, or poor. However, the cutoff points for theseratings may be discussed; they were decided on by expert opinionwithin our own research group. Depending on the purpose of thescreening, other groups may want to tighten or loosen the cutoffpoints proposed by us. This may influence the conclusions; loos-ening the cutoff points may lead to more tools performing well,tightening may lead to the contrary. Therefore, the tables present allvalidity values of the tools, allowing for the reader’s owninterpretation.
Conclusion
Existing screening tools, even those developed for the nursinghome setting, are only fairly able of assessing the nutritional status ofnursing home residents, or of predicting poor nutrition-relatedoutcomes. The ideal tool for the nursing home population shouldperhaps contain more items referring to the multifactorial back-ground of malnutrition in this specific population. The present toolscould be used as a first step in identifying residents at risk ofmalnutrition, preferably in combination with a comprehensive geri-atric assessment investigating possible causes of malnutrition.
References
1. Joosten E, Vanderelst B, Pelemans W. The effect of different diagnostic criteriaon the prevalence of malnutrition in a hospitalized geriatric population. Aging(Milano) 1999;11:390e394.
2. Diekmann R, Winning K, Uter W, et al. Screening for malnutrition amongnursing home residentsda comparative analysis of the mini nutritionalassessment, the nutritional risk screening, and the malnutrition universalscreening tool. J Nutr Health Aging 2013;17:326e331.
3. Suominen M, Muurinen S, Routasalo P, et al. Malnutrition and associatedfactors among aged residents in all nursing homes in Helsinki. Eur J Clin Nutr2005;59:578e583.
4. Blaum CS, O’Neill EF, Clements KM, et al. Validity of the minimum data set forassessing nutritional status in nursing home residents. Am J Clin Nutr 1997;66:787e794.
5. Woo J, Chumlea WC, Sun SS, et al. Development of the Chinese Nutrition Screen(CNS) for use in institutional settings. J Nutr Health Aging 2005;9:203e210.
6. Wilson MM, Thomas DR, Rubenstein LZ, et al. Appetite assessment: Simpleappetite questionnaire predicts weight loss in community-dwelling adults andnursing home residents. Am J Clin Nutr 2005;82:1074e1081.
7. Kruizenga HM, De Vet HCW, Van Marissing CME, et al. The SNAQ(RC), an easytraffic light system as a first step in the recognition of undernutrition in resi-dential care. J Nutr Health Aging 2010;14:83e89.
8. Guilford JP. Fundamental Statistics in Psychology and Education. New York:McGraw-Hill; 1956.
9. Landis JR, Koch GG. The measurement of observer agreement for categoricaldata. Biometrics 1977;33:159e174.
10. Liberati A, Altman DG, Tetzlaff J, et al. The PRISMA statement for reportingsystematic reviews and meta-analyses of studies that evaluate healthcareinterventions: Explanation and elaboration. BMJ 2009;339:b2700.
11. Lok K, Woo J, Hui E, Kwok T. Usefulness of the Chinese Nutrition Screening(CNS) tool in predicting 12 month mortality in elderly Hong Kong Chineseliving in institutions. J Nutr Health Aging 2009;13:96e101.
12. Isenring EA, Banks M, Ferguson M, Bauer JD. Beyond malnutrition screening:Appropriate methods to guide nutrition care for aged care residents. J AcadNutr Diet 2012;112:376e381.
13. Rolland Y, Perrin A, Gardette V, et al. Screening older people at risk ofmalnutrition or malnourished using the simplified nutritional assessment
questionnaire (SNAQ): A comparison with the mini-nutritional assessment(MNA) tool. J Am Med Dir Assoc 2012;13:31e34.
14. Kruizenga HM, Seidell JC, de Vet HCW, et al. Development and validation ofa hospital screening tool for malnutrition: The Short Nutritional AssessmentQuestionnaire (SNAQ). Clin Nutr 2005;24:75e82.
15. White JV, Dwyer JT, Posner BM, et al. Nutrition screening initiative: Develop-ment and implementation of the public awareness checklist and screeningtools. J Am Diet Assoc 1992;92:163e167.
16. Charlton KE, Nichols C, Bowden S, et al. Older rehabilitation patients are at highrisk of malnutrition: Evidence from a large Australian database. J Nutr HealthAging 2010;14:622e628.
17. Bouillanne O, Morineau G, Dupont C, et al. Geriatric nutritional risk index: Anew index for evaluating at-risk elderly medical patients. Am J Clin Nutr 2005;82:777e783.
18. Poulia KA, Yannakoulia M, Karageorgou D, et al. Evaluation of the efficacy of sixnutritional screening tools to predict malnutrition in the elderly. Clin Nutr2012;31:378e385.
19. Guigoz Y, Vellas B, Garry PJ. Mini nutritional assessment: A practical assess-ment tool for grading the nutritional state of elderly patients. Facts andResearch in Gerontology. Supplement. Nutrition; 1994:15e58.
20. Cereda E, Valzolgher L, Pedrolli C. Mini nutritional assessment is a goodpredictor of functional status in institutionalised elderly at risk of malnutrition.Clin Nutr 2008;27:700e705.
21. Christensson L, Unosson M, Ek AC. Evaluation of nutritional assessment tech-niques in elderly people newly admitted to municipal care. Eur J Clin Nutr2002;56:810e818.
22. Ferreira LS, Nascimento LFC, Marucci MFN. Use of the mini nutritionalassessment tool in elderly people from long-term institutions of southeast ofBrazil. J Nutr Health Aging 2008;12:213e217.
23. Tarazona-Santabalbina FJ, Belenguer Varea A, Domenech Pascual JR, et al.[Validation of MNA scale score as a nutritional risk factor in institutionalizedgeriatric patients with moderate and severe cognitive impairment]. Nutr Hosp2009;24:724e731. Spanish.
24. Visvanathan R, Penhall R, Chapman I. Nutritional screening of older people ina sub-acute care facility in Australia and its relation to discharge outcomes. AgeAgeing 2004;33:260e265.
25. Rubenstein LZ, Harker JO, Salva A, et al. Screening for undernutrition in geri-atric practice: Developing the short-form mini-nutritional assessment (MNA-SF). J Gerontol A Biol Sci Med Sci 2001;56:M366eM372.
26. Kaiser MJ, Bauer JM, Ramsch C, et al. Validation of the mini nutritionalassessment short-form (MNA-SF): A practical tool for identification of nutri-tional status. J Nutr Health Aging 2009;13:782e788.
27. Garcia-Meseguer MJ, Serrano-Urrea R. Validation of the revised mini nutri-tional assessment short-forms in nursing homes in Spain. J Nutr Health Aging2013;17:26e29.
28. Elia M. The ’MUST’ report. Nutritional screening of adults: A multidisciplinaryresponsibility. Worcs, United Kingdom: BAPEN Redditch: 2003.
29. Wolinsky FD, Coe RM, McIntosh WA, et al. Progress in the development ofa nutritional risk index. J Nutr 1990;120:1549e1553.
30. Soderhamn U, Soderhamn O. Developing and testing the nutritional form forthe elderly. Int J Nurs Pract 2001;7:336e341.
31. Soderhamn U, Soderhamn O. Reliability and validity of the nutritional form forthe elderly (NUFFE). J Adv Nurs 2002;37:28e34.
32. Laporte M, Villalon L, Payette H. Simple nutrition screening tools for healthcarefacilities: Development and validity assessment. Can J Diet Pract Res 2001;62:26e34.
33. Laporte M, Villalon L, Thibodeau J, Payette H. Validity and reliability of simplenutrition screening tools adapted to the elderly population in healthcarefacilities. J Nutr Health Aging 2001;5:292e294.
34. Ferguson M, Capra S, Bauer J, Banks M. Development of a valid and reliablemalnutrition screening tool for adult acute hospital patients. Nutrition 1999;15:458e464.
35. Isenring EA, Bauer JD, Banks M, Gaskill D. The malnutrition screening tool isa useful tool for identifying malnutrition risk in residential aged care. J HumNutr Diet 2009;22:545e550.
36. Reilly HM, Martineau JK, Moran A, Kennedy H. Nutritional screeningdevaluation and implementation of a simple nutrition risk score. Clin Nutr 1995;14:269e273.
37. Kondrup J, Rasmussen H, Hamberg O, Stanga Z. Nutritional risk screening (NRS2002): A new method based on analysis of controlled clinical trials. Clin Nutr2003;22:321e336.
38. Baker JP, Detsky AS, Wesson DE, et al. Nutritional assessment: A comparison ofclinical judgementandobjectivemeasurements.NEngl JMed1982;306:969e972.
39. Cereda E, Zagami A, Vanotti A, et al. Geriatric nutritional risk index and overall-cause mortality prediction in institutionalised elderly: A 3-year survival anal-ysis. Clin Nutr 2008;27:717e723.
40. Cereda E, Pusani C, Limonta D, Vanotti A. The association of geriatric nutritionalrisk index and total lymphocyte count with short-term nutrition-relatedcomplications in institutionalised elderly. J Am Coll Nutr 2008;27:406e413.
41. Chan M, Lim YP, Ernest A, Tan TL. Nutritional assessment in an Asian nursinghome and its association with mortality. J Nutr Health Aging 2010;14:23e28.
42. Sharifi F, Ghaderpanahi M, Fakhrzadeh H, et al. Older people’s mortality index:Development of a practical model for prediction of mortality in nursing homes(Kahrizak elderly study). Geriatr Gerontol Int 2012;12:36e45.
M.A.E. van Bokhorstede van der Schueren et al. / JAMDA 15 (2014) 171e184 183
43. Torma J, Winblad U, Cederholm T, Saletti A. Does undernutrition still prevailamong nursing home residents? Clin Nutr 2013;32:562e568.
44. Sacks GS, Dearman K, Replogle WH, et al. Use of subjective global assessmentto identify nutrition-associated complications and death in geriatric long-termcare facility residents. J Am Coll Nutr 2000;19:570e577.
45. Kuikka LK, Salminen S, Ouwehand A, et al. Inflammation markers andmalnutrition as risk factors for infections and impaired health-related qualityof life among older nursing home residents. J Am Med Dir Assoc 2009;10:348e353.
46. Meijers JM, van Bokhorst-de van der Schueren MA, Schols JM, et al. Definingmalnutrition: Mission or mission impossible? Nutrition 2010;26:432e440.
47. Fielding RA, Vellas B, Evans WJ, et al. Sarcopenia: An undiagnosed condition inolder adults. Current consensus definition: Prevalence, etiology, and conse-quences. International Working Group on Sarcopenia. J Am Med Dir Assoc2011;12:249e256.
48. Chen CC, Bai YY, Huang GH, Tang ST. Revisiting the concept of malnutrition inolder people. J Clin Nurs 2007;16:2015e2026.
49. Chang S, Beason TS, Hunleth JM, Colditz GA. A systematic review of body fatdistribution and mortality in older people. Maturitas 2012;72:175e191.
50. Beck AM, Ovesen L, Schroll M. Validation of the resident assessment instrumenttriggers in the detection of under-nutrition. Age Ageing 2001;30:161e165.
51. Wijnhoven HA, Schilp J, van Bokhorst-de van der Schueren MA, et al. Devel-opment and validation of criteria for determining undernutrition incommunity-dwelling older men and women: The short nutritional assessmentquestionnaire 65þ. Clin Nutr 2012;31:351e358.
52. Morley JE. Anorexia of aging: Physiologic and pathologic. Am J Clin Nutr 1997;66:760e773.
53. Tieland M, Borgonjen-Van den Berg KJ, van Loon LJ, de Groot LC. Dietaryprotein intake in community-dwelling, frail, and institutionalized elderlypeople: Scope for improvement. Eur J Nutr 2012;51:173e179.
54. Wendland BE, Greenwood CE, Weinberg I, Young KW. Malnutrition in institu-tionalized seniors: The iatrogenic component. J Am Geriatr Soc 2003;51:85e90.
55. Neelemaat F, van Bokhorst-de van der Schueren MA, Thijs A, et al. Restingenergy expenditure in malnourished older patients at hospital admission and
three months after discharge: Predictive equations versus measurements. ClinNutr 2012;31:958e966.
56. Wolfe RR, Miller SL, Miller KB. Optimal protein intake in the elderly. Clin Nutr2008;27:675e684.
57. Bauer J, Biolo G, Cederholm T, et al. Evidence-based recommendations foroptimal dietary protein intake in older people: A position paper from thePROT-AGE study group. J Am Med Dir Assoc 2013;14:542e559.
58. Milne AC, Potter J, Vivanti A, Avenell A. Protein and energy supplementation inelderly people at risk from malnutrition. Cochrane Database Syst Rev 2009;2:CD003288.
59. Nijs KA, de Graaf C, Siebelink E, et al. Effect of family-style meals on energyintake and risk of malnutrition in Dutch nursing home residents: A randomizedcontrolled trial. J Gerontol A Biol Sci Med Sci 2006;61:935e942.
60. Ulger Z, Halil M, Kalan I, et al. Comprehensive assessment of malnutrition riskand related factors in a large group of community-dwelling older adults. ClinNutr 2010;29:507e511.
61. Saka B, Kaya O, Ozturk GB, et al. Malnutrition in the elderly and its relationshipwith other geriatric syndromes. Clin Nutr 2010;29:745e748.
62. van Asselt DZ, van Bokhorst-de van der Schueren MA, van der Cammen TJ, et al.Assessment and treatment of malnutrition in Dutch geriatric practice:Consensus through a modified delphi study. Age Ageing 2012;41:399e404.
63. Fearon K, Strasser F, Anker SD, et al. Definition and classification of cancercachexia: An international consensus. Lancet Oncol 2011;12:489e495.
64. Good P, Cavenagh J, Mather M, Ravenscroft P. Medically assisted nutrition forpalliative care in adult patients. Cochrane Database Syst Rev 2011;4:CD006274.
65. Dent E, Visvanathan R, Piantadosi C, Chapman I. Nutritional screening tools aspredictors of mortality, functional decline, and move to higher level care inolder people: A systematic review. J Nutr Gerontol Geriatr 2012;31:97e145.
66. van Bokhorst-de van der Schueren MA, Guaitoli PR, Jansma EP, de Vet HC.Nutrition screening tools: Does one size fit all? A systematic review ofscreening tools for the hospital setting. Clin Nutr; 2013. http://dx.doi.org/10.1016/j.clnu.2013.04.008.
67. Elia M, Stratton RJ. An analytic appraisal of nutrition screening tools supportedby original data with particular reference to age. Nutrition 2012;28:477e494.

M.A.E. van Bokhorstede van der Schueren et al. / JAMDA 15 (2014) 171e184184
Appendix 1. Search strategy
To identify all relevant publications, we performed systematicsearches in the bibliographic databases PubMed, EMBASE.com, andCINAHL (via EBSCO) from inception to January 30, 2013. Searchterms included controlled terms from MeSH in PubMed, EMtree inEMBASE.com, and CINAHL Headings in CINAHL, as well as free textterms. Search terms expressing “malnutrition” were used in
Set Search Terms
#6 #5 NOT (“addresses”[Publication Type] OR “biography”[Publication Type]Type] OR “directory”[Publication Type] OR “editorial”[Publication Type]Type] OR “lectures:”[Publication Type] OR “legal cases”[Publication Type]OR “news”[Publication Type] OR “newspaper article”[Publication Type] Oworks”[Publication Type] OR “congresses”[Publication Type] OR “consendevelopment conference, nih”[Publication Type] OR “practice guideline”“humans”[MeSH Terms])
#5 #4 NOT ((“Adolescent”[Mesh] OR “Child”[Mesh] OR “Infant”[Mesh] OR adolOR girl*[tiab] OR boy*[tiab] OR teen[tiab] OR teens[tiab] OR teenager*[tiab[tiab]) NOT (“Adult”[Mesh] OR adult*[tiab] OR man[tiab] OR men[tiab] O
#4 #1 AND #2 AND #3#3 “Nursing Homes”[Mesh] OR “Hospitals”[Mesh] OR “Home Care Services”[M
Services”[Mesh] OR “Housing for the Elderly”[Mesh] OR “General Practic“Institutionalization”[Mesh] OR “Long-Term Care”[Mesh] OR “HospitalizaOR housing[tiab] OR Community Health Service*[tiab] OR communit*[tiaoutpatient*[tiab] OR ambulatory[tiab] OR Institution*[tiab] OR “Long-TerNOT medline[sb])
#2 (“Questionnaires”[Mesh] OR Questionnair*[tiab] OR Instrument*[tiab] OR S[tiab] OR Assessing[tiab] OR Self-report[tiab] OR Inventory[tiab] OR Scal[tiab] OR evaluation[tiab] OR rating[tiab] OR monitor*[tiab] OR score*[tia[tiab] OR survey*[tiab]) OR methods[sh] OR “Validation Studies”[pt] OR “
“outcome assessment (health care)”[MeSH:noexp] OR “outcome assessmvariation”[MeSH] OR “observer variation”[tiab] OR “reproducibility of reanalysis”[MeSH] OR reliab*[tiab] OR unreliab*[tiab] OR valid*[tiab] OR “co[tiab] OR homogeneous[tiab] OR “internal consistency”[tiab] OR (cronba(correlation*[tiab] OR selection*[tiab] OR reduction*[tiab])) OR agreemenvalues”[tw] OR test-retest[tiab] OR (test[tiab] AND retest[tiab]) OR (reliainterrater[tiab] OR inter-rater[tiab] OR intrarater[tiab] OR intra-rater[tiabintra-tester[tiab] OR interobserver[tiab] OR inter-observer[tiab] OR intraOR inter-technician[tiab] OR intratechnician[tiab] OR intra-technician[tiintraexaminer[tiab] OR intra-examiner[tiab] OR interindividual[tiab] OR i[tiab] OR interparticipant[tiab] OR inter-participant[tiab] OR intrapartici[tiab] OR kappas[tiab] OR repeatab*[tw] OR specificit*[tiab] OR sensitiv*AND (measure[tw] OR measures[tw] OR findings[tw] OR result[tw] OR rgeneralisa*[tiab] OR concordance[tiab] OR (intraclass[tiab] AND correlat
#1 “Malnutrition”[Mesh:NoExp] OR “Protein Deficiency”[Mesh] OR “NutritionMalnutrition[tiab] OR Undernutrition[tiab] OR ((nutritional deficienc*[timalnourishment[tiab] OR underfeeding[tiab] OR undernourishment[tiabnutritional risk*[tiab] OR nutritional status[tiab]) NOT medline[sb])
combination with search terms comprising “screening or assess-ment instruments” and terms for “nursing home setting” and“adults.” The references of the identified articles were searched forrelevant publications.
Search strategy in PubMed, January 30, 2013 (read from bottom-up).
Result
OR “case reports”[Publication Type] OR “comment”[PublicationOR “festschrift”[Publication Type] OR “interview”[PublicationOR “legislation”[Publication Type] OR “letter”[Publication Type]R “patient education handout”[Publication Type] OR “popularsus development conference”[Publication Type] OR “consensus[Publication Type]) NOT (“animals”[MeSH Terms] NOT
4048
escen*[tiab] OR child*[tiab] OR schoolchild*[tiab] OR infant*[tiab]] OR youth*[tiab] OR pediatr*[tiab] OR paediatr*[tiab] OR puber*R woman[tiab] OR women[tiab]))
4196
5366esh] OR “Housing for the Elderly”[Mesh] OR “Community Healthe”[Mesh] OR “Ambulatory Care”[Mesh] ORtion”[Mesh] OR ((hospital*[tiab] OR home[tiab] OR homes[tiab]b] OR General Practice*[tiab] OR Family Practice*[tiab] ORm Care”[tiab] OR Hospitalization[tiab] OR Hospitalisation[tiab])
970871
creen[tiab] OR Screening[tiab] OR Screener[tiab] OR Assessment*e[tiab] OR Checklist*[tiab] OR Form[tiab] OR tool[tiab] OR toolsb] OR scoring[tiab] OR index[tiab] OR indices[tiab] OR interview*Comparative Study”[pt] OR clinimetr*[tw] OR clinometr*[tw] ORent”[tiab] OR “outcome measure*”[tw] OR “observersults”[MeSH] OR reproducib*[tiab] OR “discriminantefficient of variation”[tiab] OR coefficient[tiab] OR homogeneitych*[tiab] AND (alpha[tiab] OR alphas[tiab])) OR (item[tiab] ANDt[tw] OR precision[tw] OR imprecision[tw] OR “preciseb*[tiab] AND (test[tiab] OR retest[tiab])) OR stability[tiab] OR] OR intertester[tiab] OR inter-tester[tiab] OR intratester[tiab] ORobserver[tiab] OR intra-observer[tiab] OR intertechnician[tiab]ab] OR interexaminer[tiab] OR inter-examiner[tiab] ORnter-individual[tiab] OR intraindividual[tiab] OR intra-individualpant[tiab] OR intra-participant[tiab] OR kappa[tiab] OR kappa’s[tiab] OR responsive*[tiab] OR ((replicab*[tw] OR repeated[tw])esults[tw] OR test[tw] OR tests[tw])) OR generaliza*[tiab] ORion*[tiab])
7900330
al Status”[Mesh] OR “Nutrition Assessment”[Mesh] ORab] OR nutrition deficienc*[tiab] OR depletion[tiab] OR] OR protein deficienc*[tiab] OR energy deficienc*[tiab] OR
78966