a systematic rare-earth elements and yttrium study of archean cherts
DESCRIPTION
Haruna SugaharaAbstract: A systematic REE + Y study of Archean (ca. 3.0 Ga) cherts from the Mount Goldsworthy greenstone belt inthe northeastern Pilbara Craton, Western Australia was performed in order to understand their origin anddepositional environment. Analyzed samples include microfossil-bearing black cherts from the FarrelQuartzite and a black vein chert from the underlying Warrawoona Group, and laminated to bandedchert including carbonaceous chert, jaspilite and banded iron-formation from the overlying, deepeningupwardCleaverville Formation.Laminated to banded cherts from the Cleaverville Formation show a clear stratigraphic trend upsectionof increasing Y/Ho and positive Eu-anomalies, with HREE-enrichment and positive La-anomalies. Thedata comprise a mixing array between two end-member components on a newly proposed Y/Ho–Euanomalydiagram. One end-member is interpreted to be Archean seawater, with a super-chondritic Y/Horatio (∼100) and a weak positive Eu-anomaly (∼3). The other end-member with a chondritic Y/Ho ratioand a negligible Eu-anomaly is assumed to be non-marine water such as continental run-off, groundwater, or geothermal water.Black cherts containing microfossils in the Farrel Quartzite are characterized by a positive La-anomaly,HREE-enrichment, negligible to a slight positive Eu-anomaly, and a chondritic to slightly super-chondriticY/Ho ratio. They are distinct from vein cherts with a distinct MREE-enrichment and contemporaneoushydrothermal cherts with pronounced Eu-anomaly, and plot close to the supposed non-marine endmembercomponent on the Y/Ho–Eu-anomaly diagram. The black cherts were thus precipitated from awater mass influenced significantly by for example continental run-off, ground water and/or geothermalwater, but not from high-T hydrothermal solution, increasing the credibility of microfossils containedin them.TRANSCRIPT

AMo
Ha
b
a
ARRA
KAMRNC
1
(r3b2sefe
0d
Precambrian Research 177 (2010) 73–87
Contents lists available at ScienceDirect
Precambrian Research
journa l homepage: www.e lsev ier .com/ locate /precamres
systematic rare-earth elements and yttrium study of Archean cherts at theount Goldsworthy greenstone belt in the Pilbara Craton: Implications for the
rigin of microfossil-bearing black cherts
aruna Sugaharaa, Kenichiro Sugitania,∗, Koichi Mimuraa, Fumiaki Yamashitab,1, Koshi Yamamotoa
Graduate School of Environmental Studies, Nagoya University, Chikusa-ku, Nagoya 464-8601, JapanGraduate School of Sciences, Nagoya University, Nagoya 464-8601, Japan
r t i c l e i n f o
rticle history:eceived 25 December 2008eceived in revised form 22 October 2009ccepted 26 October 2009
eywords:rcheanicrofossil-bearing black chert
are-earth elementson-marineontinental setting
a b s t r a c t
A systematic REE + Y study of Archean (ca. 3.0 Ga) cherts from the Mount Goldsworthy greenstone belt inthe northeastern Pilbara Craton, Western Australia was performed in order to understand their origin anddepositional environment. Analyzed samples include microfossil-bearing black cherts from the FarrelQuartzite and a black vein chert from the underlying Warrawoona Group, and laminated to bandedchert including carbonaceous chert, jaspilite and banded iron-formation from the overlying, deepening-upward Cleaverville Formation.
Laminated to banded cherts from the Cleaverville Formation show a clear stratigraphic trend upsectionof increasing Y/Ho and positive Eu-anomalies, with HREE-enrichment and positive La-anomalies. Thedata comprise a mixing array between two end-member components on a newly proposed Y/Ho–Eu-anomaly diagram. One end-member is interpreted to be Archean seawater, with a super-chondritic Y/Horatio (∼100) and a weak positive Eu-anomaly (∼3). The other end-member with a chondritic Y/Ho ratioand a negligible Eu-anomaly is assumed to be non-marine water such as continental run-off, groundwater, or geothermal water.
Black cherts containing microfossils in the Farrel Quartzite are characterized by a positive La-anomaly,
HREE-enrichment, negligible to a slight positive Eu-anomaly, and a chondritic to slightly super-chondriticY/Ho ratio. They are distinct from vein cherts with a distinct MREE-enrichment and contemporaneoushydrothermal cherts with pronounced Eu-anomaly, and plot close to the supposed non-marine end-member component on the Y/Ho–Eu-anomaly diagram. The black cherts were thus precipitated from awater mass influenced significantly by for example continental run-off, ground water and/or geothermalwater, but not from high-T hydrothermal solution, increasing the credibility of microfossils contained in them.. Introduction
A morphologically diverse assemblage of biological structuresthreads, films, spheroids, and lens-spindles) has recently beeneported from sedimentary carbonaceous black cherts of the ca..0 Ga Farrel Quartzite of the Mount Goldsworthy greenstoneelt in the Pilbara Craton, Western Australia (Sugitani et al.,007) (Fig. 1). Their biogenicity was claimed from indigenousness,
yngenecity, narrow size distribution, carbonaceous composition,vidence of flexible but breakable walls, apparent taphonomiceatures and the presence of colony-like aggregations (Sugitanit al., 2007). The credibility of the structures as microfossils∗ Corresponding author. Fax: +81 52 789 4865.E-mail address: [email protected] (K. Sugitani).
1 Present address: Shinto Tsushin Co., Ltd. Nagoya 460-0002, Japan.
301-9268/$ – see front matter © 2009 Elsevier B.V. All rights reserved.oi:10.1016/j.precamres.2009.10.005
© 2009 Elsevier B.V. All rights reserved.
has now become nearly compelling, supported by the follow-ing studies on highly elaborate structures and their complexoccurrences suggestive of life cycle (Sugitani et al., 2009b), paly-nological extraction of the structures (Grey and Sugitani, 2009),NanoSIMS chemical analyses of individual structures (Oehler etal., 2009) and 3D reconstruction of morphological and texturalcomplexity (Sugitani et al., 2009a). These microfossils are outstand-ing for their morphological diversity and complexity, excellentpreservation of some specimens, and large size, which are dis-tinct from many of previously reported Archean microfossils thatare generally small and simple in morphology (e.g., Knoll andBarghoorn, 1977; Dunlop et al., 1978; Rasmussen, 2000; Westall
et al., 2001). Furthermore, an association between the host chertand an evaporite bed, which can be traced ca. 7 km along the strike(Sugitani et al., 2009b), implies that there was a diverse micro-bial ecosystem flourishing in a shallow-water environment at ca.3.0 Ga.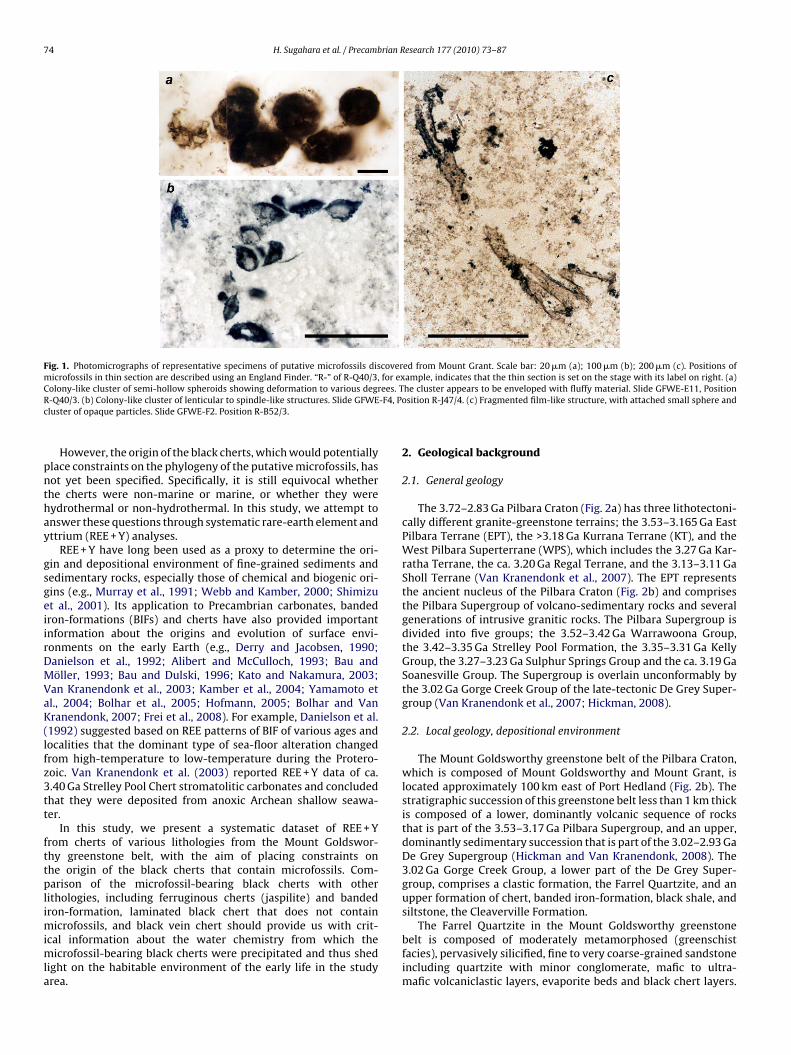
74 H. Sugahara et al. / Precambrian Research 177 (2010) 73–87
Fig. 1. Photomicrographs of representative specimens of putative microfossils discovered from Mount Grant. Scale bar: 20 �m (a); 100 �m (b); 200 �m (c). Positions ofmicrofossils in thin section are described using an England Finder. “R-” of R-Q40/3, for example, indicates that the thin section is set on the stage with its label on right. (a)C ees. TR -F4, Pc
pnthay
gsgeiirDMVaK(lfz3tt
fttplimimla
olony-like cluster of semi-hollow spheroids showing deformation to various degr-Q40/3. (b) Colony-like cluster of lenticular to spindle-like structures. Slide GFWEluster of opaque particles. Slide GFWE-F2. Position R-B52/3.
However, the origin of the black cherts, which would potentiallylace constraints on the phylogeny of the putative microfossils, hasot yet been specified. Specifically, it is still equivocal whetherhe cherts were non-marine or marine, or whether they wereydrothermal or non-hydrothermal. In this study, we attempt tonswer these questions through systematic rare-earth element andttrium (REE + Y) analyses.
REE + Y have long been used as a proxy to determine the ori-in and depositional environment of fine-grained sediments andedimentary rocks, especially those of chemical and biogenic ori-ins (e.g., Murray et al., 1991; Webb and Kamber, 2000; Shimizut al., 2001). Its application to Precambrian carbonates, bandedron-formations (BIFs) and cherts have also provided importantnformation about the origins and evolution of surface envi-onments on the early Earth (e.g., Derry and Jacobsen, 1990;anielson et al., 1992; Alibert and McCulloch, 1993; Bau andöller, 1993; Bau and Dulski, 1996; Kato and Nakamura, 2003;
an Kranendonk et al., 2003; Kamber et al., 2004; Yamamoto etl., 2004; Bolhar et al., 2005; Hofmann, 2005; Bolhar and Vanranendonk, 2007; Frei et al., 2008). For example, Danielson et al.
1992) suggested based on REE patterns of BIF of various ages andocalities that the dominant type of sea-floor alteration changedrom high-temperature to low-temperature during the Protero-oic. Van Kranendonk et al. (2003) reported REE + Y data of ca..40 Ga Strelley Pool Chert stromatolitic carbonates and concludedhat they were deposited from anoxic Archean shallow seawa-er.
In this study, we present a systematic dataset of REE + Yrom cherts of various lithologies from the Mount Goldswor-hy greenstone belt, with the aim of placing constraints onhe origin of the black cherts that contain microfossils. Com-arison of the microfossil-bearing black cherts with other
ithologies, including ferruginous cherts (jaspilite) and bandedron-formation, laminated black chert that does not contain
icrofossils, and black vein chert should provide us with crit-cal information about the water chemistry from which the
icrofossil-bearing black cherts were precipitated and thus shedight on the habitable environment of the early life in the studyrea.
he cluster appears to be enveloped with fluffy material. Slide GFWE-E11, Positionosition R-J47/4. (c) Fragmented film-like structure, with attached small sphere and
2. Geological background
2.1. General geology
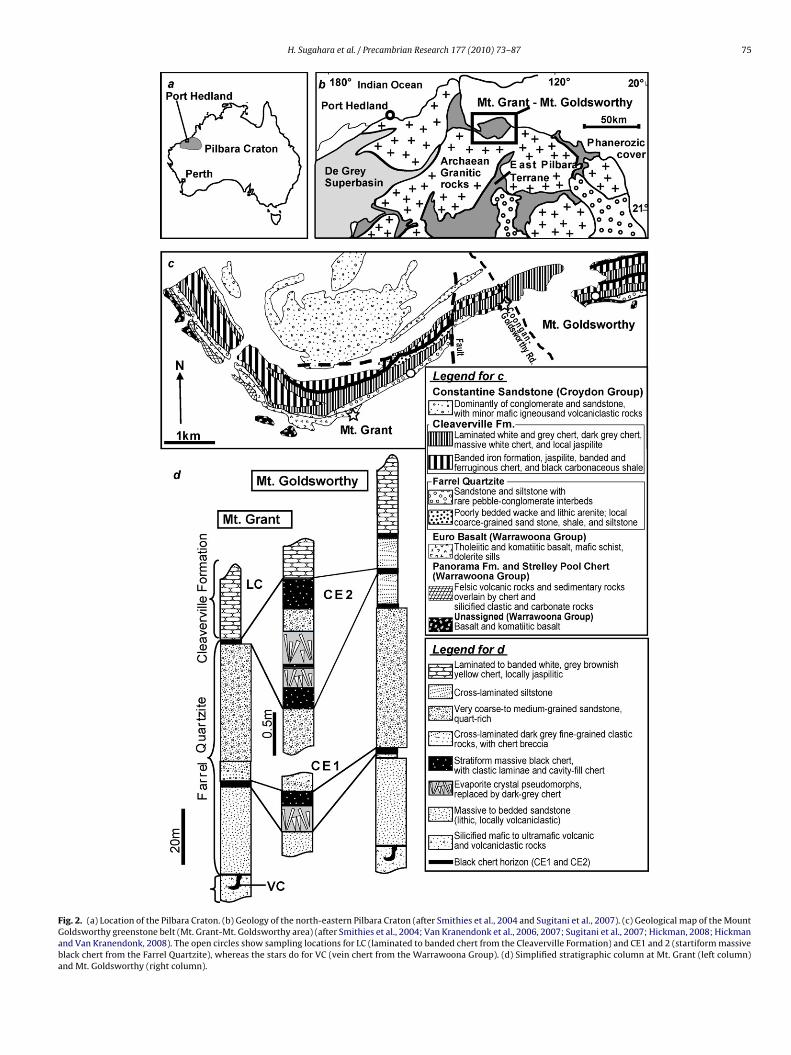
The 3.72–2.83 Ga Pilbara Craton (Fig. 2a) has three lithotectoni-cally different granite-greenstone terrains; the 3.53–3.165 Ga EastPilbara Terrane (EPT), the >3.18 Ga Kurrana Terrane (KT), and theWest Pilbara Superterrane (WPS), which includes the 3.27 Ga Kar-ratha Terrane, the ca. 3.20 Ga Regal Terrane, and the 3.13–3.11 GaSholl Terrane (Van Kranendonk et al., 2007). The EPT representsthe ancient nucleus of the Pilbara Craton (Fig. 2b) and comprisesthe Pilbara Supergroup of volcano-sedimentary rocks and severalgenerations of intrusive granitic rocks. The Pilbara Supergroup isdivided into five groups; the 3.52–3.42 Ga Warrawoona Group,the 3.42–3.35 Ga Strelley Pool Formation, the 3.35–3.31 Ga KellyGroup, the 3.27–3.23 Ga Sulphur Springs Group and the ca. 3.19 GaSoanesville Group. The Supergroup is overlain unconformably bythe 3.02 Ga Gorge Creek Group of the late-tectonic De Grey Super-group (Van Kranendonk et al., 2007; Hickman, 2008).
2.2. Local geology, depositional environment
The Mount Goldsworthy greenstone belt of the Pilbara Craton,which is composed of Mount Goldsworthy and Mount Grant, islocated approximately 100 km east of Port Hedland (Fig. 2b). Thestratigraphic succession of this greenstone belt less than 1 km thickis composed of a lower, dominantly volcanic sequence of rocksthat is part of the 3.53–3.17 Ga Pilbara Supergroup, and an upper,dominantly sedimentary succession that is part of the 3.02–2.93 GaDe Grey Supergroup (Hickman and Van Kranendonk, 2008). The3.02 Ga Gorge Creek Group, a lower part of the De Grey Super-group, comprises a clastic formation, the Farrel Quartzite, and anupper formation of chert, banded iron-formation, black shale, andsiltstone, the Cleaverville Formation.
The Farrel Quartzite in the Mount Goldsworthy greenstonebelt is composed of moderately metamorphosed (greenschistfacies), pervasively silicified, fine to very coarse-grained sandstoneincluding quartzite with minor conglomerate, mafic to ultra-mafic volcaniclastic layers, evaporite beds and black chert layers.
H. Sugahara et al. / Precambrian Research 177 (2010) 73–87 75
Fig. 2. (a) Location of the Pilbara Craton. (b) Geology of the north-eastern Pilbara Craton (after Smithies et al., 2004 and Sugitani et al., 2007). (c) Geological map of the MountGoldsworthy greenstone belt (Mt. Grant-Mt. Goldsworthy area) (after Smithies et al., 2004; Van Kranendonk et al., 2006, 2007; Sugitani et al., 2007; Hickman, 2008; Hickmanand Van Kranendonk, 2008). The open circles show sampling locations for LC (laminated to banded chert from the Cleaverville Formation) and CE1 and 2 (startiform massiveblack chert from the Farrel Quartzite), whereas the stars do for VC (vein chert from the Warrawoona Group). (d) Simplified stratigraphic column at Mt. Grant (left column)and Mt. Goldsworthy (right column).

76 H. Sugahara et al. / Precambrian Research 177 (2010) 73–87
Fig. 3. Photomicrographs of representative chert specimens. Scale bars: 200 �m (a and b); 500 �m (c and d); 1 mm (e and f). (a) LC from Mount Grant. Granular mineralsf compM abuna e-likes
AsqacG
Fvcgcp
wnofles
orming aggregates are carbonates (the arrow), whereas very fine dark particles thatount Grant, probably subjected to post-depositional reworking. (c) VC containing
nd detrital carbonaceous grains. (e) Botryoidal structure within CE2. (f) Fenestratructure.
lthough the thickness of this clastic unit is laterally variable fromeveral meters to 80 m, two beds of evaporite that occur in theuartzite at Mount Grant, particularly the upper one in CE2 (Fig. 2d),re laterally continuous. This upper evaporite bed can be traceda. 7 km along strike in the central and the western part of Mountrant.
The Farrel Quartzite is conformably overlain by the Cleavervilleormation, which dominantly consists of finely parallel-laminatedariegated chert, including dark-grey shale, carbonaceous blackhert, jaspilite and banded iron-formation, with minor coarse-rained terrigenous clastic rocks near the base. The terrigenouslastic rocks occur as beds and lenses, in some places with abundantlaty chert clasts.
Sugitani et al. (2003, 2006a) suggested that the Farrel Quartziteas deposited in a continental margin setting and that terrige-ous detrital materials may have been partially derived from
lder continental crust. Silicified evaporites probably originatedrom nahcolite (Na2HCO3), suggesting the development of shal-ow to sub-aerial conditions. This shallow to sub-aerial depositionalnvironment of the Farrel Quartzite was followed by a deeperubaqueous environment, in which finely and parallel-laminatedrise laminae are carbonaceous matter. (b) Fine carbonaceous laminations in LC fromdant carbonaceous grains. (d) CE1 characterized by fine carbonaceous laminationsirregularly shaped pure chert masses in CE2. The arrow shows a huge film-like
cherts and banded iron-formation of the Cleaverville Formationwere deposited. The higher abundance of sandstone beds andlenses in the lower part of this horizon suggests that the formationrepresents a deepening-upward sequence (Sugitani et al., 2003).
2.3. Black chert occurrences
Several different occurrences of black chert have been identi-fied. Black chert veins are less than 30 cm thick, and locally occur inthe Warrawoona Group altered volcanic and volcaniclastic rocks(Sugitani et al., 2006b). In the Farrel Quartzite, stratiform blackcherts are less than 30 cm thick and occur in close association withevaporite beds at two stratigraphic levels (Fig. 2d). These associ-ations were designated as CE1 for the lower horizon and CE2 forthe upper horizon at the top of the Farrel Quartzite, respectively(Fig. 2d). A cm-scale black vein chert locally occurs within sand-
stone of the Farrel Quartzite. Evaporite is occasionally replaced byblack chert. Stratiform black cherts are common in the CleavervilleFormation, intercalated with other variegated chert layers. To date,the microfossils have been found only in the stratiform black chertof CE2 (Sugitani et al., 2007).
rian R
3
rtaCGrafd
3
imtcqofnipt
3
nhlfat
3
scotspmtocastm
4
4
a(t
H. Sugahara et al. / Precamb
. Sample descriptions
Fifty-two chert samples were collected for analysis. We catego-ized the samples into four lithological types, including; laminatedo banded chert (LC), vein chert (VC), and stratiform chert associ-ted with evaporites (CE1 and CE2). LC samples (n = 29) are from theleaverville Formation at Mount Goldsworthy (n = 20) and at Mountrant (n = 9). VC samples (n = 5) are all from altered mafic volcanic
ocks of the Warrawoona Group at Mount Grant. CE1 samples (n = 4)re from one locality at Mount Grant. CE2 samples (n = 13) arerom Mount Grant (n = 10) and Mount Goldsworthy (n = 3). Detailedescriptions of these chert lithologies are given below.
.1. LC: laminated to banded chert
Laminated to banded chert from the Cleaverville Formations characterized by parallel lamination or banding. Lamination is
ostly planar to undulating and occasionally anastomosing. It con-ains very fine particles of carbonaceous matter, hematite and/orarbonate, in addition to predominant microcrystalline to granularuartz in the matrix (Fig. 3a). Very fine carbonaceous laminationccasionally displays reworked features such as overturning andragmentation (Fig. 3b). At Mount Goldsworthy, hematitic lami-ae are predominant and locally Fe-rich beds equivalent to banded
ron-formation are present, whereas at Mount Grant laminae com-osed of carbonaceous matter or carbonate are predominant withinhe stratigraphic interval (∼90m) from which we collected samples.
.2. VC: vein chert
Vein chert from the Warrawoona Group does not display lami-ation or bedding. Very fine carbonaceous particles are distributedomogeneously in some samples, whereas they comprise floccu-
ated grains in others (Fig. 3c). Relatively large quartz grains, lithicragments and mica are rare. This type of chert commonly containsbundant tabular crystals of secondary origin, which are assumedo be a tourmaline-group mineral, based on XRD analyses.
.3. CE1 and CE2: stratiform chert
Stratiform black chert from CE1 is characterized by parallel tolightly undulating laminations and locally has abundant detritalarbonaceous grains (Fig. 3d). Stratiform black chert CE2, on thether hand, is mostly massive, with local cross or parallel lamina-ion. It also contains a cavity-fill white chert layer with botryoidaltructures (Fig. 3e). Abundant putative microfossils of various mor-hologies (thread, film, spheroid, and spindle) are found within theassive portion of this unit, with thread-like structure found also in
he cavity-fill chert. The massive portion of this chert is composedf a microcrystalline quartz matrix with disseminated carbona-eous material, unknown acicular crystals, and sulphide. Rare baritend carbonate are also present. Carbonaceous particles in the mas-ive matrix tend to be distributed heterogeneously, resulting inhe development of irregularly shaped pure chert masses that are
orphologically similar to fenestrae (Fig. 3f).
. Analytical methods
.1. Major elements
Concentrations of selected major elements (TiO2, Al2O3, Fe2O3nd P2O5) were determined by X-ray fluorescence spectrometerXRF) (PANalytical Axios), using fused-glass discs made from a mix-ure of sample powder and Li2B4O7 in the proportion of 1:8.
esearch 177 (2010) 73–87 77
4.2. Rare-earth elements and yttrium (REE + Y)
Analyses of REE + Y followed the method of Yamamoto et al.(2004). Black chert samples (150–350 g) were coarsely crushedwith a jaw crusher. Small chips (5 mm in size) were handpicked toexclude visible detrital laminae and weathered parts. After pulver-izing with an agate mortar, HF and HClO4 (HF:HClO4 = 2:1) wereadded to sample powders (3 g) for digestion. The sample solu-tions were dried on a hot plate (180 ◦C). The dried samples weredissolved with 1.7N-HCl and supernatants were collected aftercentrifugation. This procedure from digestion with mixed acids(HF:HClO4 = 2:1) to collection of supernatants was repeated threetimes for complete decomposition of samples. REE + Y in the super-natants were separated using a cation exchange column in orderto remove interfering elements such as Ba (Hirata et al., 1988).The collected REE + Y solutions were dried on a hot plate (180 ◦C)and then dissolved in 2% HNO3. REE + Y concentrations were deter-mined by inductively coupled plasma mass spectrometer (ICP-MS).Indium and Bi were used as internal standards. Interfering oxideions of LREE (light rare-earth elements) on HREE (heavy rare-earthelements) were corrected by measuring 20 ppb LREE solutions.
4.3. Organic geochemistry
Insoluble carbonaceous material (kerogen) was extracted from24 black chert samples (5 samples of VC, 2 of CE1, 7 of CE2, and 10of LC). The carbon stable isotopic ratio of the extracted kerogenswas measured using a dual-inlet isotope ratio mass spectrometry(IRMS). The carbon content of bulk rock samples was also deter-mined, using an elemental analyzer. Detailed analytical proceduresare given below.
4.3.1. Isolation of kerogenBlack chert samples were pulverized with a stainless steel mor-
tar. Sample powders (150–350 g) were then treated with 6M-HCl.A mixed acid (HF:HCl = 4:1) was added to sample powders fordigestion, followed by rinsing with distilled water. This mixedacid treatment was repeated twice until silicates were decom-posed completely. Then, the residue was cleaned with hot HCl(80 ◦C) for 48 h, yielding residues composed of kerogen and pyrite.Kerogen was separated from pyrite using a heavy liquid (CHBr3;2.9 g/cm3). The separated kerogens were washed with CHCl2 insoxhlet extraction apparatus for 72 h, with the aim of removal ofpossible contamination by organic matter introduced during theexperiment.
4.3.2. Stable carbon isotopic ratio (ı13C)The extracted kerogen (0.5–1.0 mg) was sealed in Vycor tubes
that were preheated at 950 ◦C. Atmospheric CO2 gas was evacuatedduring sealing. Then, samples were converted into CO2 at 900 ◦C for4 h, with CuO as an oxidizer. The sample CO2 gas was first trapped inthe Vycor tube in a liquid N2 bath (−196 ◦C), and then released to thesecond tube by replacing the liquid N2 bath with a liquid N2-ethanolbath (−95 to −90 ◦C). The released CO2 gas was condensed again inthe second tube, which was subsequently sealed. Carbon isotopicratios analyzed by IRMS are written in conventional ı-notations forthe PDB scale. The precision of the IRMS analysis was ±0.05‰.
5. Results
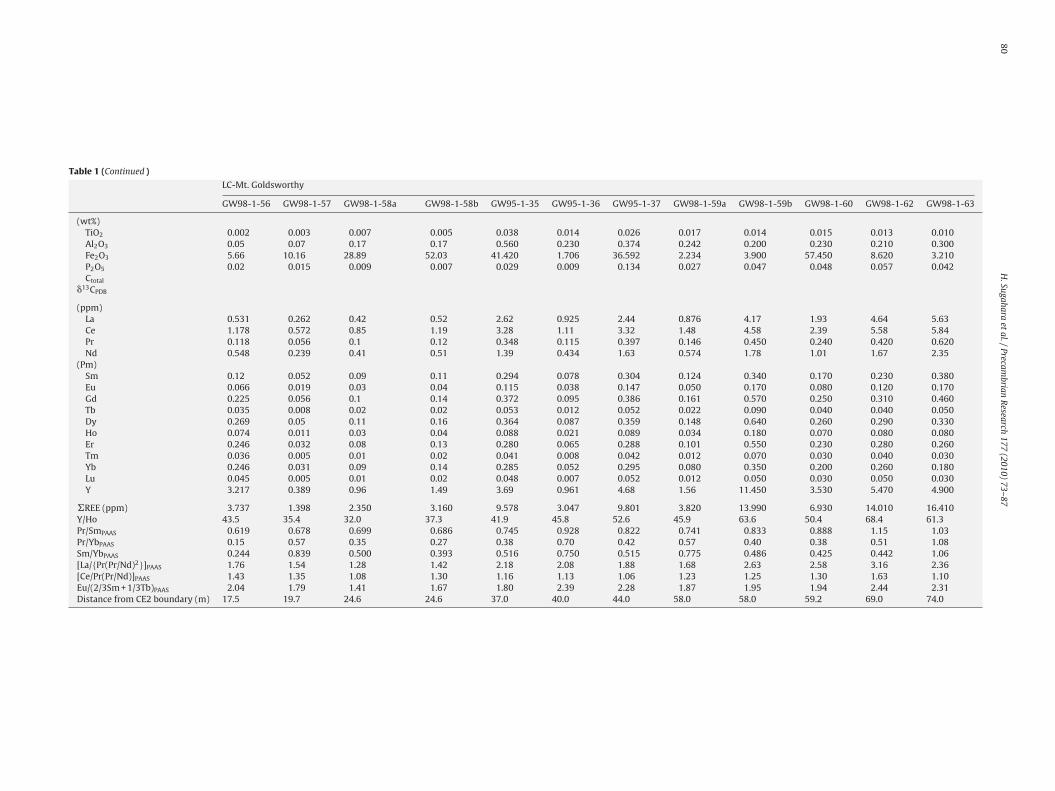
The results of chemical analyses are shown in Table 1. Averagesand ranges for some indices are listed in Table 2. Shale (PAAS)-normalized REE patterns are shown in Fig. 4.

78H
.Sugaharaet
al./Precambrian
Research
177 (2010) 73–87
Table 1Result of rare-earth elements and yttrium analysis of black carbonaceous cherts in the study (Farrel Quartzite and Cleaverville Formation).
VC CE1 CE2
GFD2 SGH1 SGH2 SGH3 SGH4 GFTE1 GFTE3 GWXB-1 GWXB-2 GFSV1 GFSV2 GFSV3 GFSV4
(wt%)TiO2 0.0623 0.0375 0.0453 0.0269 0.0163 0.0272 0.0413 0.0099 0.0206 0.0034 0.0089 0.0077Al2O3 1.13 0.842 0.913 0.3 0.227 0.467 0.994 0.237 0.357 0.07 0.195 0.104Fe2O3 0.228 0.11 0.147 0.094 0.173 0.098 0.38 0.346 0.092 0.049 0.072 0.036P2O5 0.0064 0.0069 0.0086 0.012 0.0072 0.0092 0.0086 0.0058 0.0064 0.0042 0.0046 0.0039Ctotal 0.038 0.033 0.045 0.034 0.023 0.042 0.03 0.064 0.045
�13CPDB −29.40 −31.07 −30.81 −30.51 −30.21 −28.56 −31.83 −33.57 −33.00 −33.95
(ppm)La 2.130 1.842 5.574 0.368 0.837 4.141 3.790 0.648 1.194 0.0784 0.0386 0.0528 0.0141Ce 3.470 3.065 9.133 0.745 1.872 6.062 7.038 1.191 2.182 0.112 0.0636 0.0748 0.0207Pr 0.395 0.377 1.117 0.102 0.243 0.674 0.785 0.132 0.244 0.0115 0.00657 0.00655 0.00229Nd 1.643 1.497 4.337 0.515 1.091 2.820 2.853 0.490 0.921 0.0656 0.0232 0.0208 0.00944
(Pm)Sm 0.299 0.300 0.753 0.131 0.224 0.486 0.409 0.0844 0.163 0.0098 0.00450 0.00389 0.00266Eu 0.0866 0.0812 0.201 0.0407 0.0611 0.144 0.0933 0.0271 0.0450 0.00369 0.00184 0.00296 0.00122Gd 0.267 0.260 0.668 0.142 0.169 0.350 0.249 0.0733 0.135 0.0114 0.00628 0.00470 0.00355Tb 0.035 0.025 0.061 0.020 0.017 0.047 0.026 0.0088 0.017 0.0023 0.0011 0.00074 0.00056Dy 0.173 0.122 0.315 0.126 0.0889 0.338 0.134 0.0481 0.0928 0.0142 0.00870 0.00555 0.00398Ho 0.034 0.021 0.055 0.027 0.015 0.079 0.025 0.0093 0.019 0.0032 0.0019 0.0011 0.00077Er 0.105 0.0690 0.168 0.0788 0.0407 0.222 0.0569 0.0289 0.0579 0.0101 0.00615 0.00352 0.00266Tm 0.019 0.011 0.024 0.011 0.0054 0.029 0.0076 0.0041 0.0082 0.0017 0.0009 0.0005 0.0004Yb 0.113 0.0719 0.164 0.0680 0.0345 0.193 0.0618 0.0295 0.0575 0.00899 0.00617 0.00333 0.00246Lu 0.021 0.011 0.024 0.010 0.0049 0.027 0.0086 0.0045 0.0086 0.0016 0.00092 0.00041 0.00033Y 1.061 0.576 1.458 0.862 0.369 2.714 0.715 0.305 0.590 0.114 0.0623 0.0427 0.0244
�REE (ppm) 8.789 7.753 22.593 2.385 4.703 15.613 15.537 2.779 5.143 0.335 0.170 0.182 0.065Y/Ho 31.3 26.8 26.5 31.9 25.3 34.3 29.0 32.8 31.2 35.3 32.0 39.2 31.7Pr/Smpaas 0.830 0.790 0.933 0.490 0.682 0.872 1.21 0.981 0.942 0.737 0.918 1.06 0.543Pr/Ybpaas 1.10 1.65 2.15 0.47 2.21 1.10 4.00 1.40 1.33 0.40 0.33 0.62 0.29Sm/Ybpaas 1.33 2.09 2.30 0.965 3.24 1.26 3.31 1.43 1.41 0.548 0.365 0.585 0.541[La/{Pr(Pr/Nd)2}]paas 1.70 1.40 1.36 1.66 1.26 1.95 1.16 1.24 1.27 4.00 1.33 1.47 1.89[Ce/Pr(Pr/Nd)]paas 1.13 1.00 0.98 1.14 1.07 1.17 1.01 1.04 1.05 1.72 1.06 1.12 1.15Eu/(2/3Sm + 1/3Tb)PAAS 1.55 1.59 1.58 1.52 1.63 1.68 1.41 1.78 1.54 1.55 1.64 3.43 1.98Distance from CE2 boundary (m)
CE2 LC-Mt. Grant
GFSV5 GFSV6 GFTE06-02 GFTE0604 GFWE1 GFWE2 MGTX2 GWM11A′-1 GWM11A GFTU2 GFTU4 GFTU5 GFTU6
(wt%)TiO2 0.0055 0.0053 0.0045 0.005 0.0037 0.0063 0.0113 0.0096 0.0091 0.0076Al2O3 0.072 0.125 0.065 0.079 0.086 0.117 0.208 0.102 0.169 0.122Fe2O3 0.048 0.053 0.019 0.024 0.134 0.51 0.416 0.659 0.2P2O5 0.0041 0.0048 0.004 0.0048 0.0045 0.0054 0.0045 0.0046 0.0051Ctotal 0.054 0.024 0.064 0.035 0.042 0.073 0.036
�13CPDB −33.71 −31.74 −33.37 −28.35 −27.84 −28.84 −30.88
(ppm)La 0.0397 0.205 0.0514 0.0708 0.0807 0.0317 0.0570 0.395 0.0437 0.465 0.285 0.273 1.141Ce 0.0497 0.270 0.0877 0.127 0.134 0.0661 0.0928 0.432 0.0571 0.615 0.722 0.410 2.079Pr 0.00713 0.0262 0.0100 0.0142 0.0154 0.00774 0.0101 0.0704 0.00860 0.0805 0.0528 0.0476 0.237Nd 0.0255 0.106 0.0358 0.0553 0.0551 0.0274 0.0379 0.237 0.0342 0.303 0.204 0.202 0.945
(Pm)Sm 0.00481 0.0164 0.00656 0.0111 0.0099 0.00462 0.00727 0.0391 0.00770 0.0540 0.0391 0.0393 0.180Eu 0.00140 0.00491 0.00211 0.00449 0.00387 0.00348 0.00239 0.0124 0.00270 0.0152 0.0128 0.0118 0.0476Gd 0.00508 0.0183 0.00843 0.0199 0.0101 0.00480 0.00844 0.0284 0.00850 0.0496 0.0329 0.0379 0.133Tb 0.00077 0.0033 0.0014 0.0043 0.0015 0.00068 0.0015 0.0038 0.0014 0.0074 0.0042 0.0054 0.017

H.Sugahara
etal./Precam
brianR
esearch177 (2010) 73–87
79
CE2 LC-Mt. Grant
GFSV5 GFSV6 GFTE06-02 GFTE0604 GFWE1 GFWE2 MGTX2 GWM11A′-1 GWM11A GFTU2 GFTU4 GFTU5 GFTU6
Dy 0.00557 0.0218 0.0100 0.0361 0.00973 0.00460 0.0102 0.0227 0.00920 0.0505 0.0253 0.0337 0.0907Ho 0.0011 0.0048 0.0021 0.0077 0.0020 0.00084 0.0021 0.0043 0.0018 0.012 0.0053 0.0076 0.017Er 0.00374 0.0149 0.00632 0.0209 0.00641 0.00265 0.00638 0.0131 0.00570 0.0362 0.0163 0.0246 0.0462Tm 0.0005 0.0024 0.0009 0.0024 0.0009 0.0004 0.0009 0.0019 0.0008 0.0052 0.0023 0.0038 0.0059Yb 0.00382 0.0132 0.00585 0.0133 0.00656 0.00249 0.00574 0.0136 0.00600 0.0346 0.0157 0.0238 0.0369Lu 0.00053 0.0022 0.00083 0.0017 0.00092 0.00030 0.00080 0.0020 0.00080 0.0055 0.0024 0.0041 0.0055Y 0.0348 0.153 0.0679 0.266 0.0689 0.0330 0.0771 0.112 0.0643 0.456 0.196 0.333 0.619
�REE (ppm) 0.149 0.709 0.229 0.389 0.337 0.158 0.244 1.275 0.188 1.733 1.421 1.124 4.980Y/Ho 30.7 31.5 32.7 34.4 34.6 39.1 36.9 25.8 35.7 39.3 37.0 43.6 36.7Pr/Smpaas 0.932 1.01 0.964 0.808 0.983 1.05 0.873 1.13 0.703 0.938 0.850 0.763 0.829Pr/Ybpaas 0.59 0.62 0.54 0.34 0.74 0.98 0.55 1.64 0.45 0.73 1.06 0.63 2.01Sm/Ybpaas 0.630 0.618 0.560 0.418 0.752 0.929 0.633 1.44 0.642 0.780 1.25 0.825 2.43[La/{Pr(Pr/Nd)2}]PAAS 1.30 2.31 1.17 1.36 1.21 0.93 1.44 1.15 1.46 1.48 1.46 1.87 1.39[Ce/Pr(Pr/Nd)]PAAS 0.77 1.29 0.96 1.07 0.96 0.93 1.07 0.64 0.82 0.89 1.64 1.13 1.09Eu/(2/3Sm + 1/3Tb)PAAS 1.41 1.31 1.38 1.29 1.93 3.76 1.42 1.79 1.61 1.43 1.79 1.53 1.52Distance from CE2 boundary (m) 3.5 7.0 8.0 8.5
LC-Mt. Grant LC-Mt. Goldsworthy
SGH5 SGH6 SGH7 SGH8 SGH9 GW98-1-48 GW98-1-49 GW98-1-50 GW98-1-51 GW98-1-52 GW98-1-53 GW98-1-54 GW98-1-55
(wt%)TiO2 0.0049 0.0047 0.0055 0.0045 0.0055 0.047 0.021 0.006 0.008 0.008 0.012 0.008 0.005Al2O3 0.084 0.095 0.029 0.075 0.019 0.91 0.52 0.29 0.35 0.25 0.27 0.234 0.16Fe2O3 0.168 0.188 0.219 13.416 0.029 1.26 0.2 2.77 3.13 5.22 21.04 21.848 1.11P2O5 0.0058 0.0058 0.0045 0.0135 0.0049 0.004 0.009 0.021 0.007 0.005 0.018 0.015 0.005Ctotal 0.068 0.035 0.115
�13CPDB −34.51 −26.45 −28.96 −29.37 −26.83
(ppm)La 0.265 0.499 0.172 0.458 0.00928 1.379 3.971 4.629 0.399 0.697 1.74 1.261 0.161Ce 0.216 0.447 0.166 0.794 0.0137 1.456 4.346 4.748 0.369 1.103 3.298 2.346 0.381Pr 0.0504 0.0474 0.0199 0.0873 0.00162 0.285 0.577 0.783 0.048 0.141 0.41 0.28 0.028Nd 0.200 0.158 0.0751 0.392 0.00743 1.141 2.221 3.193 0.189 0.657 1.835 1.321 0.114
(Pm)Sm 0.0388 0.0309 0.0114 0.0743 0.00189 0.231 0.395 0.523 0.038 0.143 0.383 0.313 0.027Eu 0.0155 0.0120 0.00610 0.0349 0.00093 0.071 0.117 0.141 0.017 0.05 0.138 0.124 0.011Gd 0.0482 0.0331 0.0158 0.0866 0.00354 0.291 0.433 0.37 0.049 0.154 0.479 0.444 0.043Tb 0.0073 0.0035 0.0019 0.011 0.00069 0.048 0.06 0.044 0.007 0.022 0.065 0.064 0.008Dy 0.0523 0.0196 0.0124 0.0738 0.00539 0.334 0.374 0.239 0.046 0.142 0.39 0.41 0.056Ho 0.011 0.0035 0.0030 0.018 0.0014 0.076 0.084 0.045 0.01 0.032 0.082 0.091 0.014Er 0.0343 0.0100 0.0101 0.0563 0.00473 0.237 0.241 0.121 0.032 0.099 0.223 0.252 0.043Tm 0.0045 0.0013 0.0014 0.0083 0.0007 0.034 0.031 0.016 0.004 0.015 0.029 0.031 0.005Yb 0.0280 0.00857 0.00916 0.0570 0.00452 0.225 0.182 0.107 0.028 0.1 0.174 0.181 0.031Lu 0.0040 0.0013 0.0015 0.010 0.00076 0.034 0.026 0.016 0.004 0.016 0.027 0.028 0.004Y 0.449 0.123 0.162 0.790 0.0708 2.713 3.583 1.455 0.41 1.214 2.84 3.767 0.572
�REE (ppm) 0.976 1.275 0.505 2.161 0.057 5.842 13.058 14.975 1.240 3.371 9.273 7.146 0.926Y/Ho 40.2 34.5 53.5 44.4 51.8 35.7 42.7 32.3 41.0 37.9 34.6 41.4 40.9Pr/SmPAAS 0.816 0.966 1.09 0.739 0.540 0.776 0.919 0.942 0.795 0.620 0.674 0.563 0.653Pr/YbPAAS 0.57 1.74 0.68 0.48 0.11 0.40 1.00 2.30 0.54 0.44 0.74 0.49 0.28Sm/YbPAAS 0.693 1.80 0.625 0.652 0.209 0.513 1.09 2.44 0.679 0.715 1.10 0.865 0.435[La/{Pr(Pr/Nd)2}]PAAS 1.50 2.12 2.23 1.92 2.18 1.41 1.85 1.78 2.33 1.94 1.54 1.82 1.73[Ce/Pr(Pr/Nd)]PAAS 0.53 0.97 0.98 1.26 1.20 0.63 0.90 0.77 0.94 1.13 1.11 1.22 1.71Eu/(2/3Sm + 1/3Tb)PAAS 1.81 2.10 2.56 2.30 1.62 1.34 1.46 1.58 2.05 1.71 1.70 1.74 1.50Distance from CE2 boundary (m) 91.0 80.5 68.5 37.0 22.0 4.2 4.3 6.2 7.6 10.4 11.0 11.7 14.4
80H
.Sugaharaet
al./Precambrian
Research
177 (2010) 73–87
Table 1 (Continued )
LC-Mt. Goldsworthy
GW98-1-56 GW98-1-57 GW98-1-58a GW98-1-58b GW95-1-35 GW95-1-36 GW95-1-37 GW98-1-59a GW98-1-59b GW98-1-60 GW98-1-62 GW98-1-63
(wt%)TiO2 0.002 0.003 0.007 0.005 0.038 0.014 0.026 0.017 0.014 0.015 0.013 0.010Al2O3 0.05 0.07 0.17 0.17 0.560 0.230 0.374 0.242 0.200 0.230 0.210 0.300Fe2O3 5.66 10.16 28.89 52.03 41.420 1.706 36.592 2.234 3.900 57.450 8.620 3.210P2O5 0.02 0.015 0.009 0.007 0.029 0.009 0.134 0.027 0.047 0.048 0.057 0.042Ctotal
�13CPDB
(ppm)La 0.531 0.262 0.42 0.52 2.62 0.925 2.44 0.876 4.17 1.93 4.64 5.63Ce 1.178 0.572 0.85 1.19 3.28 1.11 3.32 1.48 4.58 2.39 5.58 5.84Pr 0.118 0.056 0.1 0.12 0.348 0.115 0.397 0.146 0.450 0.240 0.420 0.620Nd 0.548 0.239 0.41 0.51 1.39 0.434 1.63 0.574 1.78 1.01 1.67 2.35
(Pm)Sm 0.12 0.052 0.09 0.11 0.294 0.078 0.304 0.124 0.340 0.170 0.230 0.380Eu 0.066 0.019 0.03 0.04 0.115 0.038 0.147 0.050 0.170 0.080 0.120 0.170Gd 0.225 0.056 0.1 0.14 0.372 0.095 0.386 0.161 0.570 0.250 0.310 0.460Tb 0.035 0.008 0.02 0.02 0.053 0.012 0.052 0.022 0.090 0.040 0.040 0.050Dy 0.269 0.05 0.11 0.16 0.364 0.087 0.359 0.148 0.640 0.260 0.290 0.330Ho 0.074 0.011 0.03 0.04 0.088 0.021 0.089 0.034 0.180 0.070 0.080 0.080Er 0.246 0.032 0.08 0.13 0.280 0.065 0.288 0.101 0.550 0.230 0.280 0.260Tm 0.036 0.005 0.01 0.02 0.041 0.008 0.042 0.012 0.070 0.030 0.040 0.030Yb 0.246 0.031 0.09 0.14 0.285 0.052 0.295 0.080 0.350 0.200 0.260 0.180Lu 0.045 0.005 0.01 0.02 0.048 0.007 0.052 0.012 0.050 0.030 0.050 0.030Y 3.217 0.389 0.96 1.49 3.69 0.961 4.68 1.56 11.450 3.530 5.470 4.900
�REE (ppm) 3.737 1.398 2.350 3.160 9.578 3.047 9.801 3.820 13.990 6.930 14.010 16.410Y/Ho 43.5 35.4 32.0 37.3 41.9 45.8 52.6 45.9 63.6 50.4 68.4 61.3Pr/SmPAAS 0.619 0.678 0.699 0.686 0.745 0.928 0.822 0.741 0.833 0.888 1.15 1.03Pr/YbPAAS 0.15 0.57 0.35 0.27 0.38 0.70 0.42 0.57 0.40 0.38 0.51 1.08Sm/YbPAAS 0.244 0.839 0.500 0.393 0.516 0.750 0.515 0.775 0.486 0.425 0.442 1.06[La/{Pr(Pr/Nd)2}]PAAS 1.76 1.54 1.28 1.42 2.18 2.08 1.88 1.68 2.63 2.58 3.16 2.36[Ce/Pr(Pr/Nd)]PAAS 1.43 1.35 1.08 1.30 1.16 1.13 1.06 1.23 1.25 1.30 1.63 1.10Eu/(2/3Sm + 1/3Tb)PAAS 2.04 1.79 1.41 1.67 1.80 2.39 2.28 1.87 1.95 1.94 2.44 2.31Distance from CE2 boundary (m) 17.5 19.7 24.6 24.6 37.0 40.0 44.0 58.0 58.0 59.2 69.0 74.0

H. Sugahara et al. / Precambrian Research 177 (2010) 73–87 81
F nan,C c) CE2( bande
5
TF5ip
5
R(
(Sm/YbPAAS = 1.26–3.31), chondritic to super-chondritic Y/Ho ratios(Y/Ho = 29.0–34.3), and slight to moderate positive anomalies of La(1.16–1.95) and Eu (1.41–1.78) (Fig. 4b); Ce-anomalies are negligi-ble (1.01–1.17).
ig. 4. Shale-normalized (PAAS; Post-Archean Australian Shale, Taylor and McLenE1 (stratiform black chert associated with evaporite containing no microfossil); (laminated to banded chert from Mt. Grant); (e) LC-Mt. Goldsworthy (laminated to
.1. Major elements
All chert samples are characterized by low concentrations ofiO2 and Al2O3 (TiO2 = 0.002–0.062%, Al2O3 = 0.02–1.13%)(Table 1).e2O3 (as total iron) concentrations range widely from 0.019 to7.45%, reflecting the wide range of lithology. Total carbon content
s from 0.023 to 0.073%, with an exception of SGH8 (0.12%) thatrobably is attributed to higher abundance of carbonate.
.2. Rare-earth elements
VC samples are characterized by slight enrichment of lightEE (LREE) and middle REE (MREE) relative to heavy REEHREE) (Pr/YbPAAS = 0.47–2.21, Sm/YbPAAS = 0.965–3.24) (Table 2;
1985) REE + Y patterns of cherts of different occurrences: (a) VC (vein chert); (b)(stratiform black chert with evaporite containing microfossils); (d) LC-Mt. Grant
d chert from Mt. Goldsworthy).
Fig. 4a). Y/Ho ranges from 25.3 to 31.9, representing chondritic(Y/Ho = 26–27; Pack et al., 2007) to slightly super-chondritic val-ues. The samples show slight to moderate positive anomalies of Laand Eu (1.26–1.70 for La and 1.52–1.63 for Eu), but Ce-anomaliesare negligible (0.98–1.14).1 CE1 samples are characterized byrelative enrichment of LREE (Pr/YbPAAS = 1.10–4.00) and MREE
1 La-anomaly, Ce-anomaly and Eu-anomaly are calculated by[La/{Pr(Pr/Nd)2}]PAAS, [Ce/{Pr(Pr/Nd)}]PAAS (after Lawrence et al., 2006) and[Eu/(2/3Sm+1/3Tb)]PAAS, respectively.

82 H. Sugahara et al. / Precambrian R
Tab
le2
Sum
mar
yof
min
imu
m,m
axim
um
and
aver
age
valu
esof
REE
feat
ure
s.
VC
(n=
5)C
E1(n
=4)
CE2
(n=
13)
LC-M
t.G
ran
t(n
=9)
LC-M
t.G
old
swor
thy
(n=
20)
Min
.M
ax.
Mea
nS.
D.
Min
.M
ax.
Mea
nS.
D.
Min
.M
ax.
Mea
nS.
D.
Min
.M
ax.
Mea
nS.
D.
Min
.M
ax.
Mea
nS.
D.
�R
EE(p
pm
)2.
385
22.5
939.
245
10.2
762.
779
15.6
139.
768
6.77
50.
149
1.27
50.
341
0.32
40.
057
4.98
01.
581
1.41
81.
240
16.4
107.
203
5.10
1Y
/Ho
25.3
31.9
28.4
3.3
29.0
34.3
31.8
2.3
25.8
39.2
33.8
3.7
36.7
53.5
42.3
6.7
32.0
68.4
44.2
10.3
Pr/S
mPA
AS
0.49
0.93
30.
740.
220.
872
1.21
1.00
0.14
0.54
31.
130.
900.
170.
540
1.09
0.84
0.16
0.56
31.
150.
790.
15Pr
/Yb P
AA
S0.
472.
211.
520.
881.
104.
001.
961.
370.
291.
640.
620.
360.
111.
740.
890.
620.
152.
30.
60.
5Sm
/Yb P
AA
S0.
965
3.24
1.99
1.14
1.26
3.31
1.85
0.97
0.36
51.
440.
670.
270.
209
2.43
1.03
0.69
0.24
41.
100.
740.
47[L
a/{P
r(Pr
/Nd
)2}]
PAA
S1.
261.
701.
480.
191.
161.
951.
400.
370.
934.
001.
620.
801.
392.
231.
800.
341.
283.
161.
950.
48[C
e/Pr
(Pr/
Nd
)]PA
AS
0.98
1.14
1.06
0.07
1.01
1.17
1.07
0.07
0.64
1.72
1.04
0.27
0.53
1.64
1.08
0.30
0.63
1.71
1.17
0.26
Eu/(
2/3S
m+
1/3T
b)PA
AS
1.52
1.63
1.57
0.06
1.41
1.78
1.60
0.16
1.29
3.76
1.89
0.79
1.43
2.56
1.85
0.39
1.34
2.44
1.85
0.33
esearch 177 (2010) 73–87
Unlike VC and CE1, most CE2 samples have slightly HREE-enriched patterns (Pr/YbPAAS = 0.29–1.64, Sm/YbPAAS = 0.365–1.44)and Y/Ho ratios are slightly super-chondritic (25.8–39.2). Thesamples, except one, also have positive La-anomalies (1.15–4.00)and positive Eu-anomalies (1.29–3.76). Ce-anomalies range widelyfrom 0.64 to 1.72, although in most samples they are less than 1.0.
LC samples from Mount Goldsworthy and Mount Grant are com-monly enriched in HREE, except for several samples. Y/Ho ratios ofMt. Goldsworthy samples tend to be larger (32.0–68.4) than Mt.Grant samples (36.7–53.5). Most samples show positive anomaliesof La and Eu. In Mount Grant samples, the La-anomalies range from1.39 to 2.23 and Eu-anomalies range from 1.43 to 2.56. In MountGoldsworthy samples, La-anomalies range from 1.28 to 3.16 andEu-anomalies range from 1.34 to 2.44.
5.3. Carbon isotopes
Kerogen samples have significantly light isotopic values rangingfrom −34.5 to −26.5‰ (Table 1), although there are slight differencein ı13C values between different chert lithologies. CE2 samples tendto have lighter values (from −29.4 to −31.07‰ with an average of−33.2 ± 0.8‰) compared with the other lithologies. Two CE1 sam-ples have values of −31.8 and −28.5‰, and VC samples range from−31.1 to −29.4‰, with an average of −30.4 ± 0.6‰. LC samples tendto have relatively heavier ı13C values from −34.5 to −26.5‰, withan average of −29.0 ± 2.4‰.
6. Discussion
6.1. Evaluation of contamination of clastic material
Prior to interpreting REE + Y characteristics of the chert samplesin the context of parental solution geochemistry, it is necessary toevaluate the possible influence of clastic material contained withinthem. This is because if the chert samples were significantly con-taminated with clastic material with high REE abundances, thenthe REE characteristics of chemically precipitated phases wouldbe obscured. The cherts are interbedded with clastic rocks, suchas sandstones and volcaniclastic rocks, indicating that they arepotentially contaminated with clastic material. Therefore, carefulevaluation of possible clastic contamination is necessary.
In Fig. 5, the relationships of total REE, Pr/YbPAAS, Y/Ho, La-anomalies ([La/{Pr(Pr/Nd)2}]PAAS), Ce-anomalies ([Ce/{Pr(Pr/Nd)}]PAAS) and Eu-anomalies ([Eu/(2/3Sm + 1/3Tb)]PAAS) with TiO2,which represents the amount of contaminated clastic material,are shown. The chert samples have relatively low concentrationsof TiO2 (<0.07%) and as a whole do not show clear correlationbetween TiO2 and total REE. LC samples from Mount Goldsworthy,and VC and CE2 samples tend to be enriched in TiO2 and totalREE relative to other types of cherts. VC and CE1 samples alsoshow a positive correlation between total REE and TiO2. How-ever, REE + Y patterns of studied samples show almost parallelpatterns among the same sample group, despite variations ofTiO2 concentrations (Fig. 4). Additionally, there is no systematicrelationships of TiO2 concentrations with Pr/YbPAAS, Y/Ho ratios,La-anomalies, Ce-anomalies and Eu-anomalies. Consequently, itcan be reasonably assumed that contamination by clastic materialdoes not significantly obscure the REE signatures of the chemicallyprecipitated phase of chert in the analyzed samples.
6.2. REE + Y characteristics of laminated to banded chert (LC)
Stratigraphic and lithological data suggest that the depositionalsetting of the sedimentary succession at the Mount Goldsworthygreenstone belt changed from a shallow, closed to semi-closedbasin, in which black chert and CE1 and CE2 evaporite beds were

H. Sugahara et al. / Precambrian Research 177 (2010) 73–87 83
F S (b),(
dnsw
6
aLcatscaKprtaiw
ig. 5. Relationships of TiO2 concentration with total REE concentration (a), Pr/YbPAA
e), and [Eu/(2/3Sm + 1/3Tb)]PAAS (Eu-anomaly) (f).
eposited, to relatively deeper water conditions under which lami-ated to banded chert (LC) was deposited (Sugitani et al., 2003; alsoee Fig. 2d). The geological context favours a marine origin for LC,hich can be tested by examination of their REE + Y characteristics.
.2.1. Description of REE + Y featuresThe shale-normalized REE characteristics of most LC samples
re: (1) enrichment of HREE relative to LREE and MREE; (2) positivea-anomalies; (3) a wide range of Y/Ho, from chondritic to super-hondritic values (up to 70), positive Eu-anomalies (up to 2.56), andwide range of Ce-anomalies (Table 1 and Figs. 4 and 6). Among
hese characteristics, HREE-enrichment, positive La-anomalies anduper-chondritic Y/Ho values characterize modern seawater, andhemical and biogenic sediments of seawater origin (Masuda etl., 1987; Lee and Byrne, 1993; Bau and Dulski, 1996; Webb andamber, 2000). HREE-enrichment is explained by preferential cou-ling of HREE with carbonate ions due to their smaller ionic
adius compared to LREE and MREE, resulting in selective reten-ion of HREE in seawater and thus their relative enrichment (Leend Byrne, 1993). The positive La-anomaly, on the other hand,s explained by the W-type tetrad effect that is observed in sea-ater and chemical sediments of seawater origin (Masuda and
Y/Ho (c), [La/{Pr(Pr/Nd)2}]PAAS (La-anomaly) (d), [Ce/{Pr(Pr/Nd)}]PAAS (Ce-anomaly)
Ikeuchi, 1979; Masuda et al., 1987; Ohta and Kawabe, 2000). HREE-enrichment and positive La-anomalies have been reported fromArchean chemical sediments such as cherts, BIFs, stromatolites andinter-pillow carbonates, and often taken as evidence for their sea-water origin (Van Kranendonk et al., 2003; Yamamoto et al., 2004;Kamber et al., 2004; Bolhar et al., 2004, 2005).
Y/Ho ratios range from 36.7 to 53.5 for Mount Grant LC sam-ples, and from 32.0 to 68.4 for Mount Goldsworthy samples. Aboutone-half of samples have markedly higher Y/Ho (>45). Such frac-tionated Y/Ho ratios have been observed for modern seawater andis interpreted to reflect preferential scavenging of REE by particu-late matter in the seawater column (Nozaki et al., 1997) and/or nearhydrothermal vent settings (Bau and Dulski, 1999). On the otherhand, no fractionations are expected between Y and Ho during hightemperature fluid–rock interaction (Bolhar et al., 2005), resultingin chondritic values of hydrothermal water (Y/Ho = 26–27; Pack etal., 2007). Data of Y/Ho for river waters are scarce and variable,
with commonly lower values than for seawater and with someequal to upper continental crust (28) (Nozaki et al., 1997; Lawrenceet al., 2006). Like HREE-enrichment and positive La-anomalies,Y/Ho ratios have recently been used as a proxy for a marine ornon-marine origin of Archean chemical sedimentary rocks (e.g.,
84 H. Sugahara et al. / Precambrian R
Fig. 6. [La/{Pr(Pr/Nd)2}]PAAS vs. [Ce/{Pr(Pr/Nd)}]PAAS plot, discriminating betweenLa-anomaly and Ce-anomaly (after Lawrence et al., 2006). Panorama Formation BIFsamples of hydrothermal origin (Archean) (Bolhar et al., 2005), and Strelley PoolChert carbonates (Archean) (Van Kranendonk et al., 2003) and Holocene micro-bawm
B
6
sE1asae
Ff
ialites (Webb and Kamber, 2000) of seawater origin are also plotted. LC samplesnd Strelley Pool Chert carbonates tend to have higher La-anomalies, comparedith the majority of CE1 and 2 and VC samples, Panorama samples and Holoceneicrobialites.
olhar and Van Kranendonk, 2007).
.2.2. InterpretationIt is noteworthy that Y/Ho ratios of LC samples show a clear
tratigraphic trend of increasing Y/Ho upsection (Fig. 7a). Like Y/Ho,u-anomalies of LC samples also show an increase upsection from
.3 to 2.5 (Fig. 7b). Positive Eu-anomalies often have been regardeds the signature of a hydrothermal component in Archean chemicaledimentary rocks (Danielson et al., 1992; Sugitani, 1992; Kato etl., 1998; Bau and Dulski, 1999; Kato and Nakamura, 2003; Bolhart al., 2005), because modern high-T hydrothermal vent solutionsig. 7. Stratigraphic trends of Y/Ho ratio (a) and [Eu/(2/3Sm + 1/3Tb)]PAAS (Eu-anomaly) (brom the boundary between the Farrel Quartzite and the Cleaverville Formation.
esearch 177 (2010) 73–87
are commonly characterized by a distinct positive Eu-anomaly andhydrothermal activity can be assumed to have been more activein the Archean. This anomaly is attributed to the change of valencestate from Eu3+ to more soluble Eu2+ during water–rock interactionunder the strongly reducing and high temperature condition (Bau,1991; Douville et al., 1999, and referenced therein). Even in thereducing Archean atmosphere (e.g., Holland, 1994), surface weath-ering could not have produced continental run-off with a significantpositive Eu-anomaly (Danielson et al., 1992).
From the stratigraphic change of lithology, we suggest that theevaporite and black chert deposition in a closed to semi-closedsedimentary basin was followed by the deposition of chemical sed-iments that represent a deeper water depositional environment. Itis thus plausible that the basin water chemistry gradually changed.The observed increasing upward stratigraphic trend of Y/Ho andEu-anomalies can be interpreted in the context of this model of thebasin evolution (Fig. 7). Whereas it is possible that the trend of Y/Hois a result of fractionation between particulate matter and solu-tion, Y/Ho correlates neither with Fe2O3 concentrations (Fig. 8a)nor lithological variations (jaspilitic or carbonaceous) but in consis-tent with the trend of Eu-anomalies independent of a fractionationeffect, as indicated by the lack of correlation with Fe2O3 (Fig. 8b).It is possible that REE + Y features in the Archean seawater weredepth-dependent, which however does not readily mean that thefeatures in chemical precipitates simply reflect the depth of depo-sition. Rather we suggest that the changes can be interpreted asinflow of water with a relatively strong positive Eu-anomaly andsuper-chondritic Y/Ho into the basin, where it mixed with a watermass with a negligible Eu-anomaly and chondritic Y/Ho, of proba-ble non-marine origin. This introduced water represents seawater,which is consistent with the HREE-enrichment of most LC samples.Additionally, all LC samples have positive La-anomalies (1.28–3.16)and samples from the upper horizons have higher values (1.92–2.23for the uppermost four samples from Mount Grant and 2.36–3.16for the uppermost four samples from Mount Goldsworthy), sup-porting our inference of increasing influence of seawater inflowduring chert deposition of the Cleaverville Formation.
6.3. REE + Y systematics of cherts
Chert lithologies VC, CE1 and CE2 have somewhat differentREE + Y characteristics from LC samples, as summarized below.
(1) VC samples do not show HREE-enrichment relative to LREEand MREE, but rather tend to be enriched in MREE (Fig. 4a).They show positive La-anomalies (1.26–1.70) and no distinctnegative Ce-anomalies (0.98–1.14). Y/Ho ratios are chondritic
) in LC from Mount Grant and Mount Goldsworthy. Vertical axis indicates distance

H. Sugahara et al. / Precambrian Research 177 (2010) 73–87 85
Y/Ho (
(
(
fwsifpttbcsp
sgAt
6
aYppiesEeoAa12
slightly super-chondritic Y/Ho ratios and positive but variable Eu-anomalies up to 4.5, which could be explained by mixing of high-Thydrothermal solution and another end-member characterized bychondritic Y/Ho and a slight positive Eu-anomaly.
Fig. 8. Relationships of Fe2O3 concentration with
to slightly super-chondritic (25.3–31.9), with negligible Eu-anomalies (Eu/Eu* < 1.7).
2) CE1 samples do not show HREE-enrichment but are slightlyLREE-enriched. They have a positive La-anomaly (1.16–1.95),no negative Ce-anomaly (1.01–1.17), slightly super-chondriticY/Ho ratios (29.0–34.3) and a slight Eu-anomalies (1.41–1.78).
3) CE2 samples are commonly enriched in HREE, and are morediverse in some other indices compared with VC and CE1 sam-ples. La- and Ce-anomalies vary from 0.93 to 4.00 and 0.64to 1.72, respectively. Positive Eu-anomalies are not significant(<2), except for two samples. Y/Ho ratios are slightly super-chondritic, at less than 40.
REE + Y characteristics of VC and CE1 samples are quite distinctrom LC samples that are assumed to have been deposited fromater mass influenced by seawater, whereas CE2 samples share
ome common REE signatures with LC samples. This is not surpris-ng because VC samples are from vein chert, indicating that theirormation process and source solution were different from LC sam-les of undoubtedly sedimentary origin. It also seems reasonablehat regardless of their similar occurrence (Fig. 2d), REE + Y charac-eristics of CE1 and CE2 are not the same (for instance, see Fig. 4),ecause deposition of CE1 represents an interruption of continuouslastic sedimentation, whereas CE2 represents the end of clasticedimentation and a transition to facies dominated by chemicalrecipitation.
In order to understand comprehensively and more simply theource of these cherts, we introduce a new Y/Ho–Eu-anomaly dia-ram, which provides some constraints on the composition ofrchean seawater, high-T hydrothermal solutions and other poten-
ial sources for the cherts.
.3.1. Y/Ho–Eu-anomaly systematicsOn an Y/Ho–Eu-anomaly diagram (Fig. 9) LC samples show
positive correlation between these indices, because both the/Ho ratios and Eu-anomalies generally increase upsection. Asreviously discussed, REE + Y of LC samples were derived at leastartially to mostly from Archean seawater. Thus the trends towards
ncreasing values could plausibly lead to an Archean seawaternd-member. Although our data could not specify the Archeaneawater end-member, it would plausibly have Y/Ho value andu-anomaly that are less than 100 and 3, respectively. This infer-nce is not inconsistent with data from the carbonate rocks
f the Strelley Pool Chert (3.40 Ga) that is thought to be ofrchean seawater origin (Van Kranendonk et al., 2003) (Fig. 9)nd other data from Archean chemical sediments (Bau and Dulski,996; Kato et al., 1998; Kamber and Webb, 2001; Bolhar et al.,005).a) and [Eu/(2/3Sm + 1/3Tb)]PAAS (Eu-anomaly) (b).
Eu-anomalies in Archean chemical sedimentary rocks were onceinterpreted to be of hydrothermal origin (e.g., Sugitani, 1992).However, they were not necessarily directly precipitated fromhigh temperature hydrothermal solutions; Eu-enrichment is ratherconsidered a signature of the Archean oceans (Danielson et al.,1992; Tice and Lowe, 2006a,b). In modern oceans, REE are scav-enged by co-precipitation with Fe and Mn oxyhydroxides shortlyafter emission from the vents, and the hydrothermal input to themodern ocean is negligible (Bau and Dulski, 1999). By contrast,in the Archean this scavenging process had not been in oper-ation due to low levels of oxygen (Holland, 1994; Farquhar etal., 2000). Thus, the influence of a hydrothermal input into theArchean surface ocean was larger than today, considering muchhigher hydrothermal fluxes from mid ocean ridges at that time(Danielson et al., 1992). High temperature hydrothermal solutions,on the other hand, would be inferred from data of jasper and sideriteof the Panorama Formation that is thought formed from high-Thydrothermal fluids and shallow seawater in a volcanic caldera set-ting (Bolhar et al., 2005). They comprise the array with chondritic to
Fig. 9. Binary plot of Y/Ho ratio and [Eu/(2/3Sm + 1/3Tb)]PAAS (Eu-anomaly). Therecan be seen a positive correlation observed for LC from the Cleaverville Formation,reflecting the stratigraphic co-variation of these two indices. This implies a changeof basin water chemistry (also see text).
8 rian R
6
pYco
(sanYtlsrs2mis
enmtlcfed
6
antedbcbsSio
ihmtie3smT
7
ocG
6 H. Sugahara et al. / Precamb
.3.2. Sources of VC, CE1 and CE2 chertsOn the Y/Ho–Eu-anomaly diagram, most VC, CE1 and CE2 sam-
les plot within a relatively narrow area of slightly super-chondritic/Ho ratios and small positive Eu-anomalies (Fig. 9). This area islose to, or overlaps with some of LC samples from the lower partf the Cleaverville Formation.
CE1 and CE2 cherts are closely associated with evaporite bedsFig. 2d), which suggests that the cherts were formed in a closed toemi-closed basin most likely in a continental setting (Sugitani etl., 2003, 2006a). In this setting, water mass was likely influenced byon-marine water. Slight LREE-enrichment, slight super-chondritic/Ho ratios and negligible Eu-anomalies of CE1 samples all refutehat they originated solely from seawater: rather, they are moreikely precipitated from a water mass whose REE + Y features wereignificantly controlled by non-marine sources such as continentalun-off and ground water, and possibly geothermal water, con-idering it does not always have positive Eu-anomaly (e.g., Wood,006). CE2 samples except for two samples, on the other hand, haveore seawater-like REE + Y features as described above, suggest-
ng their precipitation from a water mass that was influenced byeawater components to a larger degree.
Although REE + Y characteristics of VC samples are difficult toxplain, the results of our study suggest that black vein chert wouldot be necessarily products of high-temperature deep hydrother-al activity (Van Kranendonk, 2006; Lindsay et al., 2007). Rather,
he origin of black vein chert studied here could be interpreted asow-T hydrothermal activity or in an analogy with the carbona-eous vein chert in Barberton greenstone belt, which were thoughtormed by hydraulic fracturing (Hofmann and Bolhar, 2007). Inither case, it can be emphasized that REE characteristics of VC areistinct from microfossil-bearing CE2.
.4. Implications of Archean non-marine ecosystem
Despite the similar occurrence with CE2 samples containingbundant microfossils of diverse morphologies, CE1 black cherts doot contain microfossils. However, this may be merely attributedo their destruction during reworking and transportation, consid-ring that sedimentary textures of the CE1 cherts indicate theireposition under a higher energy environment compared with CE2lack chert (Sugitani et al., 2007). In either case, significantly lightarbon isotopic values are consistent with a biogenic origin of car-onaceous matter. Although light carbon isotopes cannot be “amoking-gun” for microbes (Brasier et al., 2005; McCollom andeewald, 2006; Lindsay et al., 2007), the presence of microfossilsn black chert of the similar occurrence (CE2) supports the biogenicrigin of CE1 carbonaceous matter.
CE2 black cherts are also believed deposited in the evapor-tic basin to which both non-marine and marine waters couldave inflow as discussed above. Unfortunately, source of non-arine water cannot yet be specified. It is, however, inferred from
he present results that microorganisms had already flourishedn shallow, evaporitic environment and even comprised complexcosystem, probably in the continental margin setting by at least.0 Ga. This is consistent with or supports some previous studiesuggesting the early evolution of shallow to sub-aerial and/or non-arine ecosystem (e.g., Watanabe et al., 2000; Allwood et al., 2006;
ice and Lowe, 2006a,b; Bolhar and Van Kranendonk, 2007).
. Conclusions
Systematic REE + Y analyses were conducted to understand therigins and depositional environments of Archean (ca. 3.0 Ga)herts of various lithologies and occurrences from the Mountoldsworthy greenstone belt in the Pilbara Craton, including black
esearch 177 (2010) 73–87
carbonaceous cherts that contain morphologically diverse, abun-dant microfossils (Sugitani et al., 2007). The chert samples for thisstudy include black vein chert (VC) in the Warrawona Group maficto ultramafic volcanic sequence, stratiform black chert associatedwith evaporite (CE1 and CE2) in the Farrel Quartzite and varicoloredlaminated to banded chert (LC) in the Cleaverville Formation. Lam-inated to banded cherts (LC) of the Cleaverville Formation showa clear stratigraphic trend of increasing Y/Ho and Eu-anomaly,with HREE-enrichment and a positive La-anomaly. On the pro-posed Y/Ho–Eu-anomaly diagram, LC samples comprise an arrayshowing mixing of the two end-member components; one is themost likely Archean seawater with super-chondritic (∼100) Y/Horatio and a weak positive Eu-anomaly (∼3) and the other charac-terized by chondritic Y/Ho and negligible Eu-anomaly is assumedto be non-marine water such as continental run-off, ground water,or geothermal water, considering their supposed continental mar-gin depositional setting for the Farrel Quartzite (Sugitani et al.,2003, 2006a). Other chert samples including black cherts associ-ated evaporite (CE1 and CE2) in the Farrel Quartzite, except two,plot on the array defined by LC, clustering around the supposednon-marine end-member component. The result suggests that thewater mass chemistry, from which CE1 and CE2 black cherts wereprecipitated, was influenced significantly by non-marine water andthat formation of black vein chert (VC) is not necessarily attributedto high-T hydrothermal activity. The microfossil-bearing blackcherts of the ca. 3.0 Ga Farrel Quartzite in the Mount Goldswor-thy greenstone belt were formed in a moderate and habitablecondition.
Acknowledgements
This paper is a product of a grant-in-aid supported by the JapanSociety for the Promotion of Science (No. 19340150). We wish toexpress our gratitude to Dr. K. Grey for her support to our fieldworkin the Pilbara Craton and to Dr. M.J. Van Kranendonk for his help-ful comments on interpretations of geology of Mount Goldsworthyand Mount Grant area and for informal review and constructivecomments. We also acknowledge to Mike Tice and an anonymousreviewer for their critical and constructive comments.
References
Alibert, C., McCulloch, M.T., 1993. Rare earth element and neodymium isotopic com-positions of the banded iron-formations and associated shales from Hamersley,western Australia. Geochim. Cosmochim. Acta 57, 187–204.
Allwood, A.C., Walter, M.R., Kamber, B.S., Marshall, C.P., Burch, I.W., 2006. Stroma-tolite reef from the Early Archaean era of Australia. Nature 441, 714–718.
Bau, M., 1991. Rare-earth element mobility during hydrothermal and metamorphicfluid–rock interaction and the significance of the oxidation state of europium.Chem. Geol. 93, 219–230.
Bau, M., Dulski, P., 1996. Distribution of yttrium and rare-earth element in the Pengeand Kuruman iron-formations, Transvaal Supergroup, South Africa. PrecambrianRes. 79, 37–55.
Bau, M., Dulski, P., 1999. Comparing yttrium and rare earths in hydrothermal fluidsfrom the Mid-Atlantic Ridge: implications for Y and REE behaviour during near-vent mixing and for the Y/Ho ratio of Proterozoic seawater. Chem. Geol. 155,77–90.
Bau, M., Möller, P., 1993. Rare earth element systematics of the chemically precipi-tated component in Early Precambrian iron formations and the evolution of theterrestrial atmosphere-hydrosphere-lithosphere system. Geochim. Cosmochim.Acta 57, 2239–2249.
Bolhar, R., Van Kranendonk, M.J., Kamber, B.S., 2005. A trace element study ofsiderite-jasper banded iron formation in the 3.45 Ga Warrawoona Group, PilbaraCraton-Formation from hydrothermal fluids and shallow seawater. PrecambrianRes. 137, 93–114.
Bolhar, R., Van Kranendonk, M.J., 2007. A non-marine depositional setting for thenorthern Fortescue Group, Pilbara Craton, inferred from trace element geochem-
istry of stromatolitic carbonates. Precambrian Res. 155, 229–250.Bolhar, R., Kamber, B.S., Moorbath, S., Fedo, C.M., Whitehouse, M.J., 2004. Character-isation of early Archaean chemical sediments by trace element signatures. EarthPlanet. Sci. Lett. 222, 43–60.
Brasier, M.D., Green, O.R., Lindsay, J.F., McLoughlin, N., Steele, A., Stoakes, C., 2005.Critical testing of Earth’s oldest putative fossil assemblage from the ∼3.5 Ga Apex

rian R
D
D
D
D
F
F
G
H
H
H
H
H
H
K
K
K
K
K
L
L
L
M
M
M
M
N
O
O
Wood, S.A., 2006. Rare earth element systematics of acidic geothermal waters from
H. Sugahara et al. / Precamb
chert, Chinaman Creek, Western Australia. Precambrian Res. 140, 55–102.anielson, A., Möller, P., Dulski, P., 1992. The europium anomalies in banded iron
formations and the thermal history of the oceanic crust. Chem. Geol. 97, 89–100.erry, L.A., Jacobsen, S.B., 1990. The chemical evolution of Precambrian seawater:
evidence from REEs in banded iron formations. Geochim. Cosmochim. Acta 54,2965–2977.
ouville, E., Bienvenu, P., Charlou, J.L., Donval, J.P., Fouquet, Y., Appriou, P., Gamo,T., 1999. Yttrium and rare earth elements in fluids from various deep-seahydrothermal systems. Geochim. Cosmochim. Acta 63, 627–643.
unlop, J.S.R., Milne, V.A., Groves, D.I., Muir, M.D., 1978. A new microfossil assem-blage from the Archaean of Western Australia. Nature 274, 676–678.
arquhar, J., Bao, H., Thiemens, M., 2000. Atmospheric influence of earth’s earliestsulfur cycle. Science 289, 756–758.
rei, R., Dahl, P.S., Duke, E.F., Frei, K.M., Hansen, T.R., Frandsson, M.M., Jensen, L.A.,2008. Trace element and isotopic characterization of Neoarchean and Paleopro-terozoic iron formations in the Black Hills (South Dakota, USA): assessment ofchemical change during 2.9–1.9 Ga deposition bracketing the 2.4–2.2 Ga firstrise of atmospheric oxygen. Precambrian Res. 162, 441–474.
rey, K., Sugitani, K., 2009. Palynology of Archean microfossils (ca. 3.0 Ga) fromthe Mount Grant area, Pilbara Craton, Western Australia: further evidence ofbiogenicity. Precambrian Res. 173, 60–69.
ickman, A.H., 2008. Regional review of the 3426-3350 Ma Strelley Pool Forma-tion, Pilbara Craton, Western Australia. Geological Survey of Western Australia,Record 2008/15.
ickman, A.H., Van Kranendonk, M.J., 2008. Archean crustal evolution and min-eralization of the northern Pilbara Craton—a field guide. Geological Survey ofWestern Australia, Record 2008/13.
irata, T., Shimizu, H., Akagi, T., Sawatari, H., Masuda, A., 1988. Precise determina-tion of rare earth elements in geological standard rocks by inductively coupledplasma source mass spectrometry. Anal. Sci. 4, 637–643.
ofmann, A., 2005. The geochemistry of sedimentary rocks from the Fig Tree Group,Barberton greenstone belt: implications for tectonic, hydrothermal and surfaceprocesses during mid-Archaean times. Precambrian Res. 143, 23–49.
ofmann, A., Bolhar, R., 2007. Carbonaceous cherts in the Barberton greenstonebelt and their significance for the study of early life in the Archean record.Astrobiology 7, 355–388.
olland, H.D., 1994. Early Proterozoic atmospheric change. In: Bengston, S. (Ed.),Early Life on Earth. Columbia University Press, New York, pp. 237–244.
ato, Y., Nakamura, K., 2003. Origin and global tectonic significance of Early Archeancherts from the Marble Bar greenstone belt, Pilbara Craton, Western Australia.Precambrian Res. 125, 191–243.
ato, Y., Ohta, I., Tsunematsu, T., Watanabe, Y., Isozaki, Y., Maruyama, S., Imai,N., 1998. Rare earth element variations in mid-Archean banded iron forma-tions: Implications for the chemistry of ocean and continent and plate tectonics.Geochim. Cosmochim. Acta 62, 3475–3497.
amber, B.S., Bolhar, R., Webb, G.E., 2004. Geochemistry of late Archaean stroma-tolites from Zimbabwe: evidence for microbial life in restricted epicontinentalseas. Precambrian Res. 132, 379–399.
amber, B.S., Webb, G.E., 2001. The geochemistry of late Archean microbial carbon-ate: implications for ocean chemistry and continental erosion history. Geochim.Cosmochim. Acta 65, 2509–2525.
noll, A.H., Barghoorn, E.S., 1977. Archean microfossils showing cell division fromthe Swaziland system of South Africa. Science 198, 396–398.
ee, J.H., Byrne, R.H., 1993. Complexation of trivalent rare earth elements (Ce, Eu,Gd, Tb, Yb) by carbonate ions. Geochim. Cosmochim. Acta 57, 295–302.
indsay, J.F., Brasier, M.D., McLoughlin, N., Green, O.R., Fogel, M., Steele, A., Mertz-man, S.A., 2007. The problem of deep carbon—an Archean paradox. PrecambrianRes. 143, 1–22.
awrence, M.G., Greig, A., Collerson, K.D., Kamber, B.S., 2006. Rare earth element andyttrium variability in South East Queensland waterways. Aquat. Geochem. 12,39–72.
asuda, A., Kawakami, O., Dohmoto, Y., Takenaka, T., 1987. Lanthanide tetrad effectsin nature: two mutually opposite types, W and M. Geochem. J. 21, 119–124.
asuda, A., Ikeuchi, Y., 1979. Lanthanide tetrad effect observed in marine environ-ment. Geochem. J. 13, 19–22.
cCollom, T.M., Seewald, J.S., 2006. Carbon isotope composition of organic com-pounds produced by abiotic synthesis under hydrothermal conditions. EarthPlanet. Sci. Lett. 243, 74–84.
urray, R.W., Buchholtz ten Brink, M.R., Gerlach, D.C., Russ III, G.P., Jones, D.J., 1991.Rare earth, major, and trace elements in chert from the Franciscan Complexand Monterey Gorup, California: assessing REE sources to fine-grained marinesediments. Geochim. Cosmochim. Acta 55, 1875–1895.
ozaki, Y., Zhang, J., Amakawa, H., 1997. The fractionation between Y and Ho in the
marine environment. Earth Planet. Sci. Lett. 148, 329–340.ehler, D.Z., Robert, F., Walter, M.R., Sugitani, K., Allwood, A., Meibom, A., Mostefaoui,S., Selo, M., Thomen, A., Gibson, E.K., 2009. NanoSIMS: insights to biogenicity andsyngeneity of Archaean carbonaceous structures. Precambrian Res. 173, 70–78.
hta, A., Kawabe, I., 2000. Theoretical study of tetrad effects observed in REE distri-bution coefficients between marine Fe–Mn deposit and deep seawater, and in
esearch 177 (2010) 73–87 87
REE(III)-carbonate complexation constants. Geochem. J. 34, 455–473.Pack, A., Russell, S.S., Shelley, J.M.G., Van Zuilen, M., 2007. Geo- and cosmochem-
istry of the twin elements yttrium and holmium. Geochim. Cosmochim. Acta71, 4592–4608.
Rasmussen, B., 2000. Filamentous microfossils in a 3,235-million-year-old vol-canogenic massive sulphide deposit. Nature 405, 676–679.
Shimizu, H., Kunimaru, T., Yoneda, S., Adachi, M., 2001. Sources and depositionalenvironments of some Permian and Triassic cherts: significance of Rb–Sr andSm–Nd isotopic and REE abundance data. J. Geol. 109, 105–125.
Smithies, R.H., Van Kranendonk, M.J., Hickman, A.H., 2004. De Grey, W.A. Sheet 2757(Version 2.0): Western Australia Geological Survey, 1:100000 Geological Series.
Sugitani, K., 1992. Geochemical characteristics of Archean cherts and other sedi-mentary rocks in the Pilbara Block, Western Australia: evidence for Archeanseawater enriched in hydrothermally-derived iron and silica. Precambrian Res.57, 21–47.
Sugitani, K., Grey, K., Nagaoka, T., Mimura, K., 2009a. Three-dimensional mor-phological and textural complexity of Archean putative microfossils fromthe northeastern Pilbara Craton: indications of biogenicity of large (>15 �m)spheroidal and spindle-like structures. Astrobiology 9, 603–615.
Sugitani, K., Grey, K., Nagaoka, T., Mimura, K., Walter, M.R., 2009b. Taxonomy andbiogenicity of Archaean spheroidal microfossils (c. 3.0 Ga) from the MountGoldsworthy–Mount Grant area in the northeastern Pilbara Craton, WesternAustralia. Precambrian Res. 173, 50–59.
Sugitani, K., Mimura, K., Suzuki, K., Nagamine, K., Sugisaki, R., 2003. Stratigraphy andsedimentary petrology of an Archean volcanic-sedimentary succession at Mt.Goldsworthy in the Pilbara Block, Western Australia: implications of evaporite(nahcolite) and barite deposition. Precambrian Res. 120, 55–79.
Sugitani, K., Yamashita, F., Nagaoka, T., Yamamoto, K., Minami, M., Mimura, K.,Suzuki, K., 2006a. Geochemistry and sedimentary petrology of Archean clasticsedimentary rocks at Mt.Goldsworthy, Pilbara Craton, Western Australia: evi-dence for the early evolution of continental crust and hydrothermal alteration.Precambrian Res. 147, 124–147.
Sugitani, K., Yamashita, F., Nagaoka, T., Minami, M., Yamamoto, K., 2006b. Geo-chemistry of heavily altered Archaean volcanic and volcaniclastic rocks of theWarrawoona Group, at Mt. Goldsworthy in the Pilbara Craton, Western Aus-tralia: implications for alteration and origin. Geochem. J. 40, 523–535.
Sugitani, K., Grey, K., Allwood, A., Nagaoka, T., Mimura, K., Minami, M., Marshall,C.P., Van Kranendonk, M.J., Walter, M.R., 2007. Diverse microstructures fromArchaean chert from the Mount Goldsworthy–Mount Grant area, Pilbara Craton,Western Australia: Microfossils, dubiofossils, or pseudofossils? PrecambrianRes. 158, 228–262.
Taylor, S.R., McLennan, S.M., 1985. The Continental Crust: Its Composition and ItsEvolution. Blackwell, Oxford, 312 pp.
Tice, M.M., Lowe, D.R., 2006a. The origin of carbonaceous matter in pre-3.0 Ga green-stone terrains: a review and new evidence from the 3.42 Ga Buck Reef Chert.Earth Sci. Rev. 76, 259–300.
Tice, M.M., Lowe, D.R., 2006b. Hydrogen-based carbon fixation in the earliest knownphotosynthetic organisms. Geology 34, 37–40.
Van Kranendonk, M.J., 2006. Volcanic degassing, hydrothermal circulation and theflourishing of early life on Earth: a review of the evidence from c. 3490–3240 Marocks of the Pilbara Supergroup, Pilbara Craton, Western Australia. Earth Sci. Rev.74, 197–240.
Van Kranendonk, M.J., Webb, G.E., Kamber, B.S., 2003. Geological and trace elementevidence for a marine sedimentary environment of deposition and biogenicity of3.45 Ga stromatolitic carbonates in the Pilbara Craton, and support for a reducingArchaean ocean. Geobiology 1, 91–108.
Van Kranendonk, M.J., Hickman, A.H., Smithies, R.H., Williams, I.R., Bagas, L., Farrell,T.R., 2006. Revised lithostratigraphy of Archean supracrustal and intrusive rocksin the northern Pilbara Craton, Western Australia. Geological Survey of WesternAustralia, Record 2006/15.
Van Kranendonk, M.J., Smithies, R.H., Hickman, A.H., Champion, D.C., 2007. Review:secular tectonic evolution of Archaean continental crust: interplay between hor-izontal and vertical processes in the formation of the Pilbara Craton, Australia.Terra Nova 19, 1–38.
Watanabe, Y., Martini, J.E.J., Ohmoto, H., 2000. Geochemical evidence for terrestrialecosystems 2.6 billion years ago. Nature 408, 574–578.
Webb, G.E., Kamber, B.S., 2000. Rare earth elements in Holocene reefal microbialites:a new shallow seawater proxy. Geochim. Cosmochim. Acta 64, 1557–1565.
Westall, F., de Wit, M.J., Dann, J., van der Gaast, S., de Ronde, C.E.J., Gerneke, D.,2001. Early Archean fossil bacteria and biofilms in hydrothermally-influencedsediments from the Barberton Greenstone Belt, South Africa. Precambrian Res.106, 93–116.
Taupo Volcanic Zone, New Zealand. J. Geochem. Explor. 89, 424–427.Yamamoto, K., Itoh, N., Matsumoto, T., Tanaka, T., Adachi, M., 2004. Geochemistry of
Precambrian carbonate intercalated in pillows and its host basalt: implicationsfor the REE composition of circa 3.4 Ga seawater. Precambrian Res. 135, 331–344.