a systematic and meta-analysis review on the diagnostic
TRANSCRIPT

RESEARCH Open Access
A systematic and meta-analysis review onthe diagnostic accuracy of antibodies in theserological diagnosis of COVID-19Arthur Vengesai1,2* , Herald Midzi1, Maritha Kasambala1, Hamlet Mutandadzi3, Tariro L. Mduluza-Jokonya1,2,Simbarashe Rusakaniko3, Francisca Mutapi4, Thajasvarie Naicker2 and Takafira Mduluza1,2
Abstract
Background: Serological testing based on different antibody types are an alternative method being used todiagnose SARS-CoV-2 and has the potential of having higher diagnostic accuracy compared to the current goldstandard rRT-PCR. Therefore, the objective of this review was to evaluate the diagnostic accuracy of IgG and IgMbased point-of-care (POC) lateral flow immunoassay (LFIA), chemiluminescence enzyme immunoassay (CLIA),fluorescence enzyme-linked immunoassay (FIA) and ELISA systems that detect SARS-CoV-2 antigens.
Method: A systematic literature search was carried out in PubMed, Medline complete and MedRxiv. Studiesevaluating the diagnostic accuracy of serological assays for SARS-CoV-2 were eligible. Study selection and data-extraction were performed by two authors independently. QUADAS-2 checklist tool was used to assess the qualityof the studies. The bivariate model and the hierarchical summary receiver operating characteristic curve modelwere performed to evaluate the diagnostic accuracy of the serological tests. Subgroup meta-analysis was performedto explore the heterogeneity.
Results: The pooled sensitivity for IgG (n = 17), IgM (n = 16) and IgG-IgM (n = 24) based LFIA tests were0.5856, 0.4637 and 0.6886, respectively compared to rRT-PCR method. The pooled sensitivity for IgG (n = 9)and IgM (n = 10) based CLIA tests were 0.9311 and 0.8516, respectively compared to rRT-PCR. The pooledsensitivity the IgG (n = 10), IgM (n = 11) and IgG-IgM (n = 5) based ELISA tests were 0.8292, 0.8388 and0.8531 respectively compared to rRT-PCR. All tests displayed high specificities ranging from 0.9693 to 0.9991.Amongst the evaluated tests, IgG based CLIA expressed the highest sensitivity signifying its accurate detectionof the largest proportion of infections identified by rRT-PCR. ELISA and CLIA tests performed better in termsof sensitivity compared to LFIA. IgG based tests performed better compared to IgM except for the ELISA.
(Continued on next page)
© The Author(s). 2021 Open Access This article is licensed under a Creative Commons Attribution 4.0 International License,which permits use, sharing, adaptation, distribution and reproduction in any medium or format, as long as you giveappropriate credit to the original author(s) and the source, provide a link to the Creative Commons licence, and indicate ifchanges were made. The images or other third party material in this article are included in the article's Creative Commonslicence, unless indicated otherwise in a credit line to the material. If material is not included in the article's Creative Commonslicence and your intended use is not permitted by statutory regulation or exceeds the permitted use, you will need to obtainpermission directly from the copyright holder. To view a copy of this licence, visit http://creativecommons.org/licenses/by/4.0/.The Creative Commons Public Domain Dedication waiver (http://creativecommons.org/publicdomain/zero/1.0/) applies to thedata made available in this article, unless otherwise stated in a credit line to the data.
* Correspondence: [email protected] of Biochemistry, University of Zimbabwe, P.O. Box MP 167, MtPleasant, Harare, Zimbabwe2Optics and Imaging, Doris Duke Medical Research Institute, College ofHealth Sciences, University of KwaZulu-Natal, Durban, KwaZulu-Natal, SouthAfricaFull list of author information is available at the end of the article
Vengesai et al. Systematic Reviews (2021) 10:155 https://doi.org/10.1186/s13643-021-01689-3

(Continued from previous page)
Conclusions: We report that IgG-IgM based ELISA tests have the best overall diagnostic test accuracy.Moreover, irrespective of the method, a combined IgG/IgM test seems to be a better choice in terms ofsensitivity than measuring either antibody type independently. Given the poor performances of the currentLFIA devices, there is a need for more research on the development of highly sensitivity and specific POCLFIA that are adequate for most individual patient applications and attractive for large sero-prevalence studies.
Systematic review registration: PROSPERO CRD42020179112
Keywords: Serology, COVID-19, SARS-CoV2, rRT-PCR, IgG, IgM, Specificity, Sensitivity
IntroductionCoronavirus disease 2019 (COVID-19) is a major contagiouspandemic of respiratory disease caused by the severe acuterespiratory syndrome coronavirus 2 (SARS-CoV-2), which isalso known as novel (new) coronavirus 2019-nCoV [1–3].The first COVID-19 cases were identified in December 2019from Wuhan, Hubei Province, China [4]. On November 182020, according to the European Centre for Disease Preven-tion and Control, COVID-19 Situation update, there were55,743,951 confirmed cases and 1,339,436 deaths reportedworldwide [5]. Although the COVID-19 clinical features arenot yet fully known and understood, clinicians have reportedclinical manifestations that range from asymptomaticcases to patients with mild and severe respiratory illness,with or without pneumonia, fever, cough and shortness ofbreath. Older people (>65 years) and people of all ageswith severe chronic medical conditions such as lung dis-ease, heart disease and diabetes seem to have a higher riskof succumbing to severe COVID-19 illness [6].Early and accurate diagnostic testing for COVID-19 is
critical for tracking the SARS-CoV-2, understanding thevirus epidemiology, informing case management,suppressing transmission and for quarantine purposes [7,8]. The standard diagnostic confirmatory test for COVID-19 is based on the detection of nucleic acids of SARS-CoV-2 by nucleic acid amplification tests, such as real-time reverse-transcriptase polymerase chain reaction(rRT-PCR). The test identifies viral nucleic acids whenpresent in sufficient quantity in sputum, throat swabs andsecretions of the lower respiratory tract. In some patients,SARS-CoV-2 RNA detection in blood and oral fluid speci-mens has been reported; however, limited data is availableon adequacy of SARS-CoV-2 detection in these specimens[9]. The rRT-PCR test is time consuming as it takes be-tween 4 to 6 h for completion. It requires expensive spe-cialist equipment, skilled laboratory personal for samplepreparation and testing and PCR reagents, creating diag-nostic delays and limiting use in real-life situations whenrapid diagnosis is required for fast intervention decisions.Therefore, less expensive and easy implementable testsare required for SARS-CoV-2 detection. Another limita-tion of using rRT-PCR involves the use of swabs from theupper respiratory tract which can be falsely diagnosed as
negative due to the poor quality of the sample or acquir-ing the sample at an incorrect timeframe; notably, viralload in upper respiratory tract secretions peak in the firstweek of symptoms but may decline below the limit of de-tection in patients presenting late with symptoms [8, 10–12]. Missing the time-window of viral replication may alsoprovide false negative results. Moreover, after a variableperiod of time, one expects the rRT-PCR result to becomenegative due to cessation of viral shedding [13].False-negative rRT-PCR results are common during
diagnosis of SARS-CoV-2. The Fever Clinic of theBeijing Haidian Hospital collected data from January2020 which indicated that only two out of ten nega-tive cases diagnosed by rRT-PCR test were confirmedto be true positive for COVID-19. This yielded an ap-proximately 20% false-negative rate of rRT-PCR [12].Zhang et al. also showed that the current strategy forthe detection of viral RNA in oral swabs used forSARS-CoV-2 diagnosis is not 100% accurate. Thepresence of the virus has been detected in anal swabsor blood samples of patients whilst their oral swabsdiagnosis reports a negative result. This observationimplies that a patient cannot be discharged basedpurely on oral swab samples being negative [14].A false negative diagnosis may have grave conse-
quences, especially at this stage of the COVID-19pandemic by allowing SARS-CoV-2 infected patientsto spread the infection thereby hampering the effortsto contain the spread of the virus [8]. Additionalscreening methods that can detect the presence of in-fection despite lower viral titres are highly beneficialto ensure timely diagnosis of all COVID-19 patients.Detection of serum specific anti-SARS-CoV-2 anti-bodies, both immunoglobulin G (IgG) and M (IgM),which are produced rapidly after the infection pro-vides an alternative highly sensitive and accurate solu-tion and compensates for the limitations of rRT-PCR.The serological methods could also be a more prac-tical alternative to chest CT [8, 15, 16]. Immuno-globulin G antibodies permit the use of serologicaltools to better understand the overall rate of COVID-19 infections including the rate of asymptomatic in-fections [8].
Vengesai et al. Systematic Reviews (2021) 10:155 Page 2 of 23
However, the dynamics of blood or serum antibodies inthe cases of COVID-19 are not well evaluated. Currently,the serological dynamics of COVID-19 patients remainlimited. Also, before diagnostic assays are widely deployed,their performance characteristics need to be evaluated.Therefore, the objective of this review was to evaluate thediagnostic accuracy of IgG and IgM (together or separ-ately) based point-of-care (POC) lateral flow immunoassay(LFIA), chemiluminescence enzyme immunoassay (CLIA),fluorescence enzyme-linked immunoassay (FIA) andenzyme-linked immunosorbent assay (ELISA) to detectantigens against SARS-CoV-2.
Review questionsThe primary research question of this systematic reviewwas ‘What is the diagnostic accuracy of antibody ser-ology tests for COVID-19 using the bivariate model andthe hierarchical summary receiver operating characteris-tic curve (HSROC) model?’
Materials and methodsWe conducted a systematic review and meta-analysis inaccordance with the recommendations of the PreferredReporting Items for Systematic Reviews and Meta-Analyses of Diagnostic test accuracy (PRISMA-DTA) [17](Additional file 1). We used the Cochrane recommenda-tions to report systematic reviews and meta-analyses ofstudies on diagnostic accuracy [18]. We also used proto-cols from published systematic and meta-analysis reviewsto develop our protocol [19–22]. The developed system-atic review protocol was registered in the InternationalProspective Register of Systematic Reviews registrationnumber CRD42020179112.
Eligibility criteriaCross-sectional studies would be the ideal study type toanswer our review questions. However, as we anticipatedthat serological diagnosis cross-sectional studies forCOVID-19 would be very sparse, we decided to includecase-control studies. The inclusion criteria comprisedstudies in which the study population (n≥10) were sub-jected to COVID-19 rRT-PCR testing or genetic sequen-cing as the reference standards and either one or all of thefollowing serological tests; point-of-care (POC), lateralflow immunoassay (LFIA), chemiluminescence enzymeimmunoassay (CLIA), fluorescence immunoassays (FIA)and enzyme-linked immunoassay (ELISA). Studies thatused chest CT images, epidemiological history, well-defined clinical features accompanied by rRT-PCR as areference standard were included. The diagnostic accuracyof the tests was defined as the primary outcome. Originalstudies were included without restriction based on lan-guage or geographical location. We included studies be-tween 1 January 2020, and 27 April 2020. Animal studies,
in vitro-based studies and survey studies investigatingseroprevalence were excluded from the study.
Information sources and search strategiesThe following databases were searched for studies: MEDLINE Complete (EBSCO), PubMed, and MedRxiv (apreprint server for health sciences which distributescomplete but unpublished manuscripts). We performedthe search strategy on studies dated until 29 April 2020.The data bases were searched using predefined keywords:COVID-19 and serologic test and their synonyms.Appendix 1 illustrates the search strategy for PubMed,which was adapted for the other data bases. Additionalstudies were identified by contacting experts in the fieldand by searching reference lists from primary studies,review articles and textbook chapters.
Study selection and data extractionTwo authors (AV and HM) assessed the titles identi-fied by the search, excluding those obviously irrele-vant to the serological diagnosis of COVID-19.Letters, review articles and articles clearly irrelevantbased on examination of the abstract and other notesand duplicates were excluded next. The eligibility ofthe remaining potentially relevant articles was judgedon full-text publications.Data extraction was conducted independently by two
authors (AV and HM) to avoid bias and discrepanciesand was resolved by discussion. Where an agreementcould not be reached, a third author was consulted.Where it remained unclear whether a study is eligiblefor inclusion, it was then excluded. Whilst extractingdata, authors also had to decide whether a study was acase-control or a cross-sectional study. The followingdata were extracted.
� Study authors and publication year� Study design� Case definition (inclusion/exclusion criteria)� Participant demographics� Reference standard (including criteria for positive
test)� Index tests [cutoff values (prespecified or not) and
whether the test was a commercial of in-house test]� Geographical location of data collection� Index/reference time interval� Distribution of severity of disease in those with
target condition� Other diagnoses in those without target condition� Numbers of TPs, FNs, FPs and FNs
Other considerations and exclusion criteriaStudies, from which a 2×2 table containing true posi-tives, false positives, false negatives and true negatives
Vengesai et al. Systematic Reviews (2021) 10:155 Page 3 of 23
could not be drawn, were excluded. Furthermore, studiesthat were too unspecific in their reporting to ensure thatthey fulfilled the above criteria, were excluded.
Assessment of methodological qualityThe QUADAS-2 tool was used to assess the methodo-logical quality of all studies included in this systematic re-view [23]. QUADAS-2 consists of four key domains:patient selection, index test, reference standard and flowand timing. We assessed all domains for risk of bias(ROB) potential and the first three domains for applicabil-ity concerns. Risk of bias was judged as ‘low,’ ‘high’ or‘unclear’. Details are shown in Appendix 2. Two reviewauthors (AV and HM) independently completedQUADAS-2. The divergences were resolved by consensusamongst the researchers.
Statistical analysis and data synthesisDiagnostic accuracyFor each study, we constructed 2 × 2 tables for truepositives (TP), true negatives (TN), false positives (FP) andfalse negatives (FN). Where only sensitivity and specificityestimates were reported, we derived the two-by-two tablefrom the reported data. We constructed forest plots dis-playing sensitivity and specificity of the index tests fromcontingency tables assuming that the reference methodwas 100% sensitive and specific. Data were entered intothe Review Manager (RevMan) software for Windowsv.5.3 (Cochrane Collaboration, Copenhagen, Denmark)and forest plots were created with 95% confidence interval(CI) for sensitivity and specificity for each study.Studies were submitted to meta-analysis when three
conditions were met: sample size was greater than 20;sensitivity and specificity were available for the indexand control group was included in the analysis. Weused the two recommended random-effects hierarch-ical methods: the bivariate model and the hierarchicalsummary receiver operating characteristic (HSROC)model for performing the meta-analysis. The focus ofthe bivariate model is estimation of a summary point(summary sensitivity and specificity). HSROC modelis on estimating an SROC curve [24]. The summaryestimates of sensitivity and specificity and 95% CI andthe HSROC were calculated using OpenMeta-Analystfor windows 10 (open-source, cross-platform foradvanced meta-analysis).
Investigations of heterogeneityWe investigated heterogeneity by adding antigen typeas the covariate. The following approach was taken:Firstly, the variation in accuracy between IgG or IgMor IgG-IgM based LFIA, CLIA and ELISA serologicaltesting was analysed (Table 2). Then, the effect of theantigen type was investigated using subgroup meta-
analysis in OpenMeta-analyst. I^2 values close to 0% wereconsidered as having no heterogeneity between studies;values close to 25 %, low heterogeneity; values close to50%, moderate heterogeneity and values close to 75%, highheterogeneity between studies [25].
Assessment of publication biasIn this review, we did not assess for reporting bias.The studies included in our meta-analysis showed alot of heterogeneity; therefore, assessments for report-ing bias may not yield conclusive results. This wasadopted from the approach used by Ochodo et al.[26].
Test sensitivity by time since onset of symptomsWe stratified data by days since COVID-19 symptomonset to specimen collection. Then, we constructed for-est plots (95 % CI) displaying test sensitivity by timesince onset of symptoms using the RevMan software forWindows v.5.3 (Cochrane Collaboration, Copenhagen,Denmark).
ResultsStudy inclusionThe results of the search and selection process are pre-sented in Fig. 1. A total of 202 articles were identified.Amongst these, 40 were MedRxiv preprints and 162were fully published articles from MEDLINE Complete(EBSCO) and PubMed. Two articles were identified fromother sources for example manual search. After abstract/title exclusion and removing duplicates, 74 articles weresubmitted to full-text screening and 31 of these were in-cluded for the systematic review. Most articles were ex-cluded because they did not present sufficient datahence it was not possible to extract data to construct 2× 2 table and 1 article was excluded because it was onlyavailable in Chinese. A total of 29 articles describing theresults of 99 independent studies/data sets (19, 23 and57 investigating LFIA, CLIA and ELISA respectively)were eligible for the meta-analysis.
Characteristics of the studiesThe general characteristics of the included articlesare presented in Table 1. All the published articles(n = 14) included in the review were published in2020 because COVID-19 is an emerging disease. The17 unpublished articles were MedRxiv preprintswhich have been submitted to different journals forpublication. Twenty five articles included in the re-view had a case-control design, comparing a groupof well-defined cases with a group of healthy con-trols or controls with diseases or COVID-19 rRT-PCR negative patients, and only six studies werecross sectional studies. One study had no control
Vengesai et al. Systematic Reviews (2021) 10:155 Page 4 of 23

group and was excluded in the meta-analysis [27].Most of the studies (n = 22) were conducted inChina where the COVID-19 pandemic began and 3studies were conducted in Italy whilst, USA whilstUK, Denmark, Germany, Spain and Japan each con-ducted one study.Most articles (n = 26) included in the review clearly
stated that the gold standard nucleic acid tests (rRT-PCR or deep sequencing) were used as the referencestandard. However, five articles used a combination ofepidemiological risk, clinical features, chest CT imagesand rRT-PCR. In one article, the reference standard usedwas not stated but all the patients in the study wereCOVID-19 patients [38].Point-of-care (POC) lateral flow immunoassays
(LFIA) were used in 14 articles, CLIA were used in 9articles and ELISA were used in 13 articles. We did
not identify articles using FIA that met our inclusioncriteria. One study did not specify the serologicalassay used and it was excluded from the review [31].One study used a LIPS which is performed in solu-tion, thus maintaining the native antigen conform-ation [54]. Most of the serological assay test kits werecommercial (n = 21) and 12 were in-house. ThreeSARS-CoV-2 antigens, Spike protein (S), nucleocapsidprotein (N) and envelope protein (E) were used to-gether or separately in studies included in the review.The spike protein and nucleocapsid were used as theantigen in 9 articles and 6 articles respectively. Fivearticles used both S and N as the antigens separately.In 3 articles, S and N antigens (S-N) were used to-gether as the antigen. In 1 article, N and E antigens(N-E) were used together as the antigen. In 7 articles,the name of antigen used was not given.
Fig. 1 PRISMA flow diagram for selection of articles for meta-analysis
Vengesai et al. Systematic Reviews (2021) 10:155 Page 5 of 23

Table
1Thege
neralcharacteristicsof
thestud
iesinclud
edin
thereview
Stud
yID
Cou
ntry
Antibod
ytype
Antigen
type
Com
mercial
Referenc
estan
dard
Index
test
Con
trol
group
/com
parison
group
Kai-W
angTo
[27]
P,CS
China
IgGandIgM
SandN
Inho
use
rRT-PC
RELISA
Nocontrol
Cassaniti[28]
P,CS
Italy
IgG,IgM
andIgG-Ig
MS
Com
mercial
rRT-PC
RPO
CLFIA
Patientswith
feverandrespiratory
synd
rome/RT-PCRne
gative
Duchu
anLin[29]
China
IgG,IgM
andIgG-Ig
MN
Inho
use
Epidem
iological
risk/clinicalfeatures/
rRT-PC
R
CLIA
Health
yindividu
alsandtube
rculosis
patients
JieXiang[30]
China
IgG,IgM
andIgG-Ig
MCom
mercial
rRT-PC
RELISAandPO
CLFIA
Health
yindividu
als
LiGuo
[13]
PChina
IgM
NInho
use
Deepsequ
encing
andrRT-PC
RELISA
Adu
ltpatientswith
acutelower
respiratory
tractinfections
(ALRTIs)
RuiLiu
[31]
CS
China
IgM
NInho
use
rRT-PC
RCOVID-19rRT-PC
Rne
gativepatients
Wanbing
Liu[32]
PChina
IgG,IgM
andIgG-Ig
MSandN
Com
mercial
rRT-PC
RELISA
Health
yindividu
als
XuefeiCai[33]
China
IgG,IgM
andIgG-Ig
MS
Inho
use
rRT-PC
RPeptide-based
magne
ticCLIA
Mixed
diseases
andhe
althycontrols
YubaoPan[34]
CS
China
IgG,IgM
andIgG-Ig
MCom
mercial
rRT-PC
RPO
CLFIA
COVID-19rRT-PC
Rne
gativepatients
YujiaoJin
[35]
PChina
IgG,IgM
andIgG-Ig
MS-N
Com
mercial
rRT-PC
RCLIA
Patientswith
suspectedSA
RS-CoV
-2infectionbu
twith
negativerRT-PC
Rresults
Zhao
[36]
PChina
IgGandIgM
SCom
mercial
Che
stCTim
ages/
epidem
iological
history/clinical
diagno
sis/rRT-PC
R
ELISA
Health
yindividu
als
Zhen
gtuLi[37]
PChina
IgG,IgM
andIgG-Ig
MS
Com
mercial
rRT-PC
RPO
CLFIA
Health
yindividu
als
Rong
qing
Zhao
[38]
China
IgG-Ig
MS
Inho
use
Not
clearbu
tall
caseswereconfirm
edCOVID-19patients
ELISA
Health
yindividu
als(sam
ples
collected
before
anddu
ringtheCOVID-19
pand
emic)
Ping
ping
Zhang[39]
China
IgG-Ig
MS
Inho
use
rRT-PC
RPO
CLFIA
COVID-19rRT-PC
Rne
gativepatients
Paradiso
[40]
Italy
IgG-Ig
MS
Com
mercial
rRT-PC
RPO
CLFIA
Patientswith
COVID-19disease
orienting-symptom
sbu
trRT-PC
Rne
gative
HuanMa[41]
China
IgA,IgG
,IgM
,IgG
-IgM
andAb
SandN
Inho
use
rRT-PC
RCLIA
Health
yindividu
als,COVID-19
suspectedindividu
alsandmixed
diseasegrou
p
Qian[15]
China
IgGandIgM
S-N
Com
mercial
rRT-PC
RCLIA
Health
yindividu
alsandho
spitalised
individu
als
Ling
Zhon
g[42]
PChina
IgGandIgM
Inho
use
rRT-PC
RCLIAandELISA
Health
yindividu
als
Jiajia
Xie[43]
P,CS
China
IgGandIgM
E-N
Com
mercial
Che
stCTim
ages/
epidem
iologicalh
istory/
clinicaldiagno
sis/rRT-PC
R
CLIA
Clinicallyconfirm
edCOVID-19rRT-PC
Rne
gativepatients
Infantino[44]
PItaly
IgGandIgM
S-N
Com
mercial
rRT-PC
RCLIA
Mixed
diseases
patientsandbloo
ddo
norspre-COVID-19
Vengesai et al. Systematic Reviews (2021) 10:155 Page 6 of 23
Table
1Thege
neralcharacteristicsof
thestud
iesinclud
edin
thereview
(Con
tinued)
Stud
yID
Cou
ntry
Antibod
ytype
Antigen
type
Com
mercial
Referenc
estan
dard
Index
test
Con
trol
group
/com
parison
group
Adams[45]
UK
IgG,IgM
andIgG-Ig
MS
Inho
use(ELISA
)and
Com
mercial(LFIA)
rRT-PC
RELISAandPO
CLFIA
Health
ybloo
dandICUcerebralorgan
dono
rsbefore
theCO
VID-19pand
emic
Lassaunière[46]
Den
mark
IgA,IgG
andAb
SCom
mercial
rRT-PC
RELISAandPO
CLFIA
Health
yindividu
alsandmixed
diseases
patients(includ
ingacuterespiratory
tractinfections
caused
byothercoron
avirusesandno
n-corona
viruses
Qiang
Wang[47]
PChina
IgG,IgM
andIgG-Ig
MCom
mercial
Che
stCTim
ages/
epidem
iologicalh
istory/
clinicaldiagno
sis/rRT-PC
R
ELISAandPO
CLFIA
COVID-19clinicalne
gativemixed
diseases
patients
FeiX
iang
[30]
PChina
IgGandIgM
NCom
mercial
rRT-PC
RELISA
Health
ybloo
ddo
norsor
from
patients
with
othe
rdiseaseho
spitalised
BinLou[48]
China
IgG,IgM
andAb
SandN
Com
mercial
rRT-PC
RELISA,C
LIAandPO
CLFIA
Health
yIndividu
als
LeiLiu
[49]
China
IgG-Ig
MN
Com
mercial
rRT-PC
RELISA
Rand
omlyselected
ordinary
patients
andhe
althybloo
ddo
nors
Imai[50]
Japan
IgG,IgM
andIgG-Ig
MCom
mercial
rRT-PC
RPO
CLFIA
Non
-COVID-19patients(from
Aprilto
Octob
er2019
Pérez-García[51]
Spain
IgG,IgM
andIgG-Ig
MCom
mercial
rRT-PC
RPO
CLFIA
Health
yindividu
als(sam
ples
collected
before
theCOVID-19pand
emic)
Zhen
huaChe
n[52]
PChina
IgG
NInho
use
rRT-PC
RPO
CLFIA
Clinicallysuspicious
forthepresen
ceof
anti-SA
RS-CoV
-2
Doh
la[53]
P,CS
German
IgG,IgM
andIgG-Ig
MCom
mercial
RT-qPC
RPO
CLFIA
COVID-19RT-qPC
Rne
gativepatients
Burbelo[54]
USA
Ab
SandN
Inho
use
RT-PCR
LIPS
Subjectswith
COVID-19-likesymptom
sor
househ
oldcontactsof
person
swith
COVID-19(not
tested
byPC
R),and
bloo
ddo
norswho
donatedsamples
before
2018.
Stud
ieswith
Psupe
rscripts
werepu
blishe
darticlesan
dwith
outPsupe
rscripts
wereMed
Rxiv
prep
rints
Stud
ieswith
CSsupe
rscripts
arecrosssectiona
lstudies
andwith
outCSsupe
rscripts
arecase
controlstudies
IgG-Ig
Mmeans
that
either
oneof
them
orbo
thwerede
tected
inserum
Abmeans
totala
ntibod
ies
Vengesai et al. Systematic Reviews (2021) 10:155 Page 7 of 23

Methodological quality of included studiesThe methodological quality of the included studiesfor the IgG or IgM or IgG-IgM based LFIA, CLIAand ELISA summarised across all studies are shown
in Figs. 2b, 3b and 4b. Figures 2a, 3a and 4a show forthe risk of bias and applicability concerns summaryresults for the LFIA, CLIA and ELISA individualstudies respectively. None of the studies included in
Fig. 2 LFIA methodological quality summary table and graph. a Risk of bias and applicability concerns summary: review authors’ judgementsabout each domain for each included study. b QUADAS-2 bias assessment and QUADAS-2 applicability assessment item presented aspercentages across all included studies. On the left, risk of bias graph and on the right applicability concerns graph. c Risk of bias andapplicability concerns summary: review authors. Low, low risk of bias; high, high risk of bias; unclear, bias is unclear
Vengesai et al. Systematic Reviews (2021) 10:155 Page 8 of 23
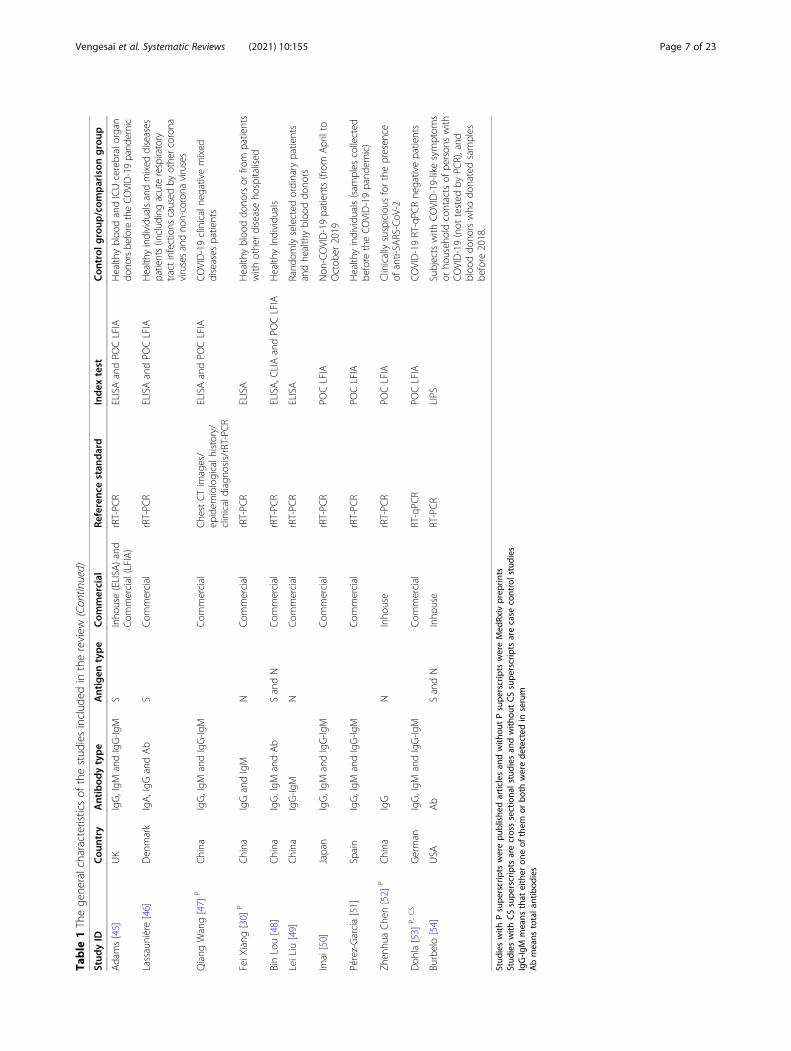
this review had low risk of bias in all four QUADAS-2 domains. Generally, case control studies were ofhigh risk of bias and high concern in the patients andtiming and flow domains and cross sectional studieswere of low risk of bias and low concern in alldomains.
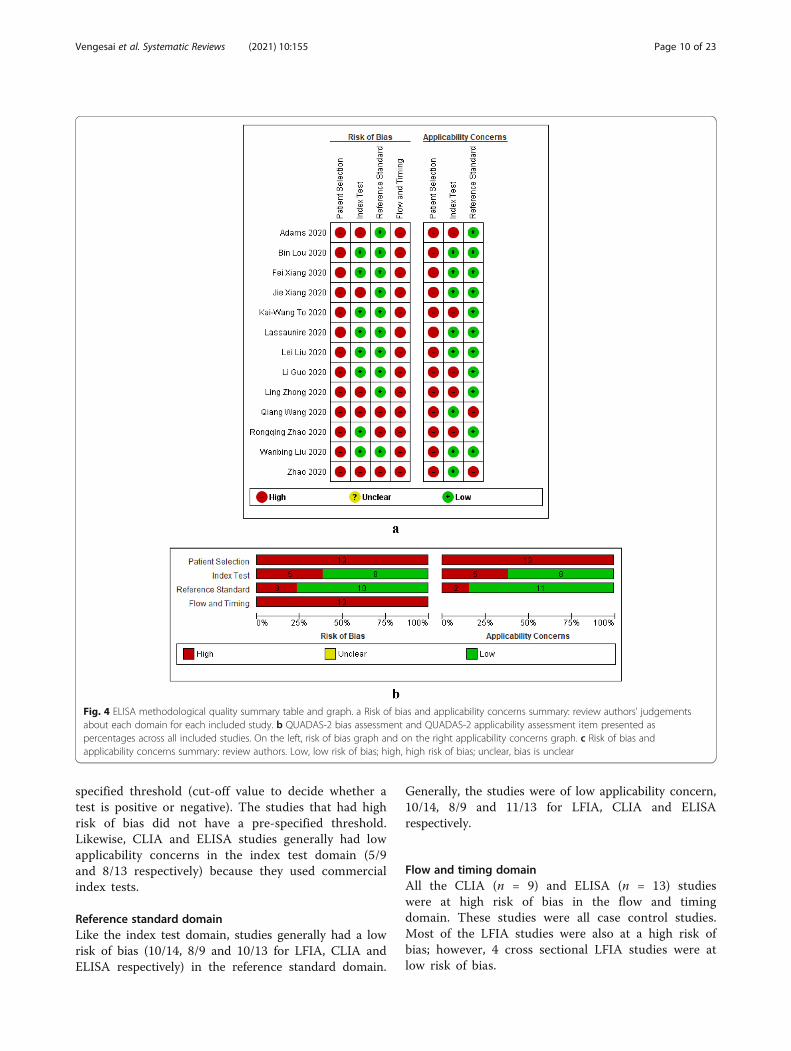
Patient selection domainGenerally, most studies included were at risk of biasand had high concerns regarding applicability. Studieswere mostly case control studies and they did not in-clude a consecutive or random series of participantsimplying that the patients that were included are notrepresentative for clinical use. All thirteen ELISAstudies were at high risk of bias and had high con-cerns regarding applicability. For CLIA, all the 9 stud-ies included had high risk of bias and only 1 cross
sectional study had low applicability concerns. Gener-ally, LFIA had more studies (n = 4) with low risk ofbias and applicability concerns in the patient selectiondomain because there were 4 LFIA cross-sectionalstudies.
Index test domainThe LFIA studies had a high risk of bias (9/14) andhigh applicability concerns (12/14) in the index testdomain. The high risk of bias was due to no blindingbetween the index test and the reference test. Thehigh applicability concerns were due to tests usingserum or plasma instead of whole blood which wouldmake the test less amenable to use at the point ofcare. The CLIA and ELISA studies generally had alow risk of bias (6/9 and 8/13 respectively). This wasbecause most studies were automated and had a pre-
Fig. 3 CLIA methodological quality summary table and graph. a Risk of bias and applicability concerns summary: review authors’ judgementsabout each domain for each included study. b QUADAS-2 bias assessment and QUADAS-2 applicability assessment item presented aspercentages across all included studies. On the left, risk of bias graph and on the right applicability concerns graph. c Risk of bias andapplicability concerns summary: review authors. Low, low risk of bias; high, high risk of bias; unclear, bias is unclear
Vengesai et al. Systematic Reviews (2021) 10:155 Page 9 of 23
specified threshold (cut-off value to decide whether atest is positive or negative). The studies that had highrisk of bias did not have a pre-specified threshold.Likewise, CLIA and ELISA studies generally had lowapplicability concerns in the index test domain (5/9and 8/13 respectively) because they used commercialindex tests.
Reference standard domainLike the index test domain, studies generally had a lowrisk of bias (10/14, 8/9 and 10/13 for LFIA, CLIA andELISA respectively) in the reference standard domain.
Generally, the studies were of low applicability concern,10/14, 8/9 and 11/13 for LFIA, CLIA and ELISArespectively.
Flow and timing domainAll the CLIA (n = 9) and ELISA (n = 13) studieswere at high risk of bias in the flow and timingdomain. These studies were all case control studies.Most of the LFIA studies were also at a high risk ofbias; however, 4 cross sectional LFIA studies were atlow risk of bias.
Fig. 4 ELISA methodological quality summary table and graph. a Risk of bias and applicability concerns summary: review authors’ judgementsabout each domain for each included study. b QUADAS-2 bias assessment and QUADAS-2 applicability assessment item presented aspercentages across all included studies. On the left, risk of bias graph and on the right applicability concerns graph. c Risk of bias andapplicability concerns summary: review authors. Low, low risk of bias; high, high risk of bias; unclear, bias is unclear
Vengesai et al. Systematic Reviews (2021) 10:155 Page 10 of 23

a
b
c
Fig. 5 Forest plot of sensitivity, specificity and heterogeneity of serological LFIA diagnosis of COVID-19. a Forest plot for the IgG LFIA. b Forestplot for the IgM based LFIA. c Forest plot for the IgG-IgM based LFIA
Vengesai et al. Systematic Reviews (2021) 10:155 Page 11 of 23

Quantitative synthesis and meta-analysisFirstly, we considered performance of the LFIA de-vices using rRT-PCR-confirmed cases as the referencestandard. The forest plots in Fig. 5 show the sensitiv-ity, specificity range and heterogeneity for the threeIgG or IgM or IgG-IgM based LFIA detectingCOVID-19 across the included studies. Overall, thesensitivity varied widely across studies in contrast tothe specificity which did not vary much except for 2studies, Yunbao Pan, 2020, and Qiang Wang, 2020,which had the lowest and second lowest specificitiesrespectively. Amongst the IgG based LFIA tests (n =17), the sensitivity estimates ranged from 0.14 (95%CI 0.09-0.21) (Imai, 2020) to 1.00 (95% CI 0.77-1.00)(Qiang Wang, 2020) and specificity estimates ranged
from 0.41 (95% CI 0.21-0.64) (Yunbao Pan, 2020) to1.00 (95% CI 0.97-1.00) (Bin Lou, 2020) (Fig. 5a). Forthe IgM based LFIA tests (n = 16), the sensitivity es-timates ranged from 0.05 (95% CI 0.01-0.18) Adams(assay 4 to 1.00) (95% CI 0.77-1.00) (Qiang Wang,2020) and specificity estimates ranged from 0.64 (95%CI 0.41-0.83) (Yunbao Pan, 2020) to 1.00 (95% CI0.94-1.00) (Adams assays 4 and 5) (Fig. 5b). For theIgG-IgM based LFIA tests (n = 24), the sensitivity es-timates ranged from 0.18 (95% CI 0.08-0.34) (Cassa-niti, 2020) to 1.00 (95% CI 0.77-1.00) (Qiang Wang,2020), with most of the studies having sensitivitiesover 0.55 and specificity estimates ranged from 0.36(95% CI 0.17-0.59) (Yunbao Pan, 2020) to 1.00 (95%CI 0.94-1.00) (Adams assays 2 and 3) (Fig. 5c).
a
b
c
Fig. 6 Forest plot of sensitivity, specificity and heterogeneity of serological CLIA diagnosis of COVID-19. a Forest plot for the IgG CLIA. b Forestplot for the IgM based CLIA. c Forest plot for the IgG-IgM based CLIA
Vengesai et al. Systematic Reviews (2021) 10:155 Page 12 of 23
We then considered performance of the different IgGor IgM or IgG-IgM based CLIA test using rRT-PCR-confirmed cases as the reference standard (Fig. 6a, b andc). Considering any positive result (IgM positive, IgGpositive or both), CLIA serological tests achieved sensi-tivity ranging from 0.48 (95% CI 0.29-0.68%) (Yujiao Jin,2020) to 1.00 (95% CI 0.79-1.00) with most studies beingbetween 0.80 and 1. The specificity was over 0.80 inmost tests except for 2 tests, one IgG based test and one
IgM based test which had the lowest 0.00 (95% CI 0.00-0.009) and second lowest 0.15 (95% CI 0.06-0.30) speci-ficities respectively.Lastly, we evaluated the performance of the differ-
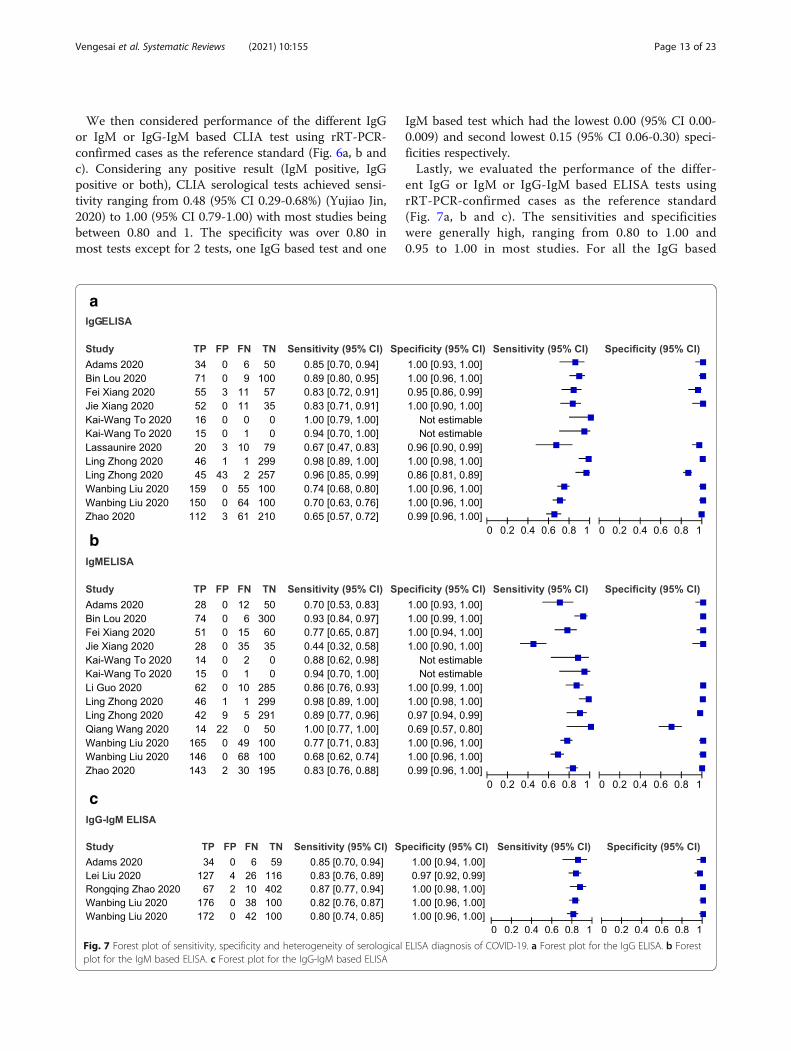
ent IgG or IgM or IgG-IgM based ELISA tests usingrRT-PCR-confirmed cases as the reference standard(Fig. 7a, b and c). The sensitivities and specificitieswere generally high, ranging from 0.80 to 1.00 and0.95 to 1.00 in most studies. For all the IgG based
a
b
c
Fig. 7 Forest plot of sensitivity, specificity and heterogeneity of serological ELISA diagnosis of COVID-19. a Forest plot for the IgG ELISA. b Forestplot for the IgM based ELISA. c Forest plot for the IgG-IgM based ELISA
Vengesai et al. Systematic Reviews (2021) 10:155 Page 13 of 23
ELISA tests (n = 10), the sensitivity estimates rangedfrom 0.65 (95% CI 0.57-0.72) (Zhao, 2020) to 1.00(95% CI 0.79-1.00) (Kai-Wang To, 2020) and specifi-city estimates from 0.86 (95% CI 0.51-0.89) to 1.00(95% CI 0.98-1.00) (Ling Zhong, 2020) (Fig. 7a). Inthe IgM based tests (n = 11), the sensitivity and spe-cificity in the individual studies ranged from 0.44
(95% CI 0.32-0.58) (Jie Xiang, 2020) to 1.00 (95% CI0.77–1.00) (Qiang Wang, 2020) and 0.69 (95% CI0.57-0.80) (Qiang Wang, 2020) to 1.00 (95% CI0.99–1.00) (Ling Zhong, 2020), respectively (Fig. 7b).The sensitivity across the 5 studies included in theIgG-IgM based ELISA tests ranged from 0.80 (95%CI 0.74-0.85) (Wanbing Liu, 2020) to 0.87 (95% CI
a b
c
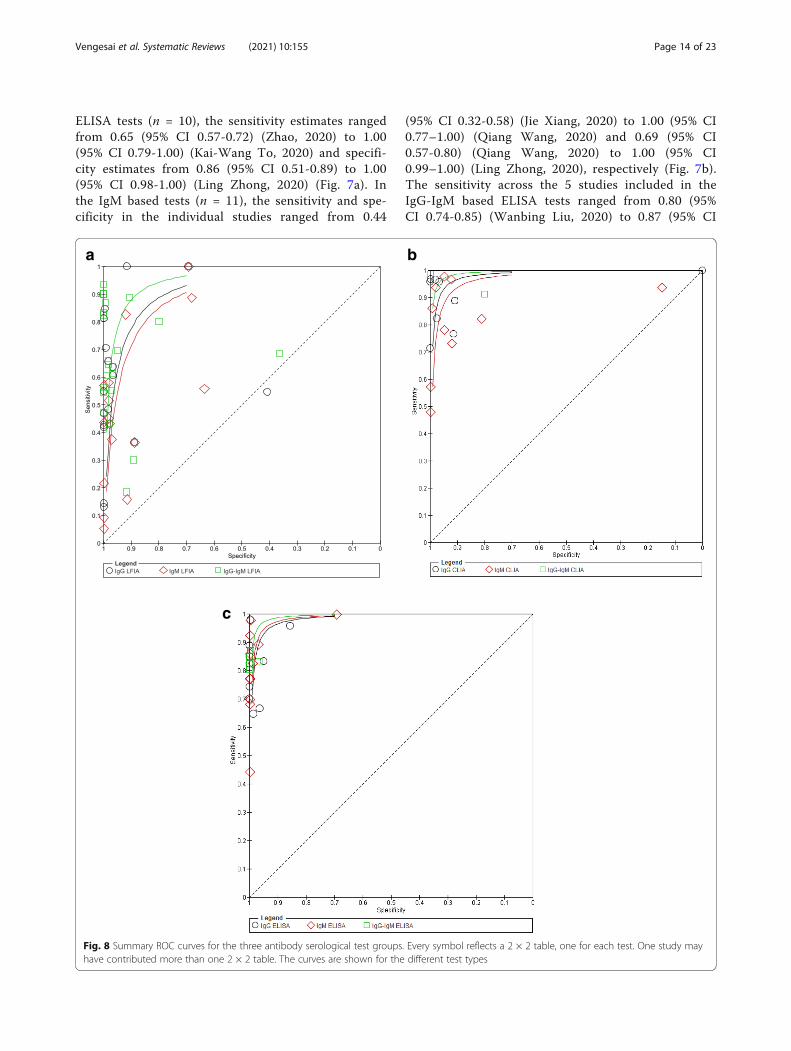
Fig. 8 Summary ROC curves for the three antibody serological test groups. Every symbol reflects a 2 × 2 table, one for each test. One study mayhave contributed more than one 2 × 2 table. The curves are shown for the different test types
Vengesai et al. Systematic Reviews (2021) 10:155 Page 14 of 23
0.77-0.94) (Rongqing Zhao, 2020). On the otherhand, specificity across the 5 studies ranged from0.97 (95% CI 0.92-0.99) (Lei Liu, 2020) to 1.00 (95%CI 0.98-1.00) (Rongqing Zhao, 2020) (Fig. 7c).We also constructed the SROC curves for all the three
antibody based serological tests (Fig. 8). However, wedid not calculate the area under the ROC (AUROC).From the SROC, we visually assessed heterogeneity be-tween the different tests. Diagonal line indicated uselesstests and the best tests were clustered further up to thetop left hand corner.The bivariate model and the hierarchical summary
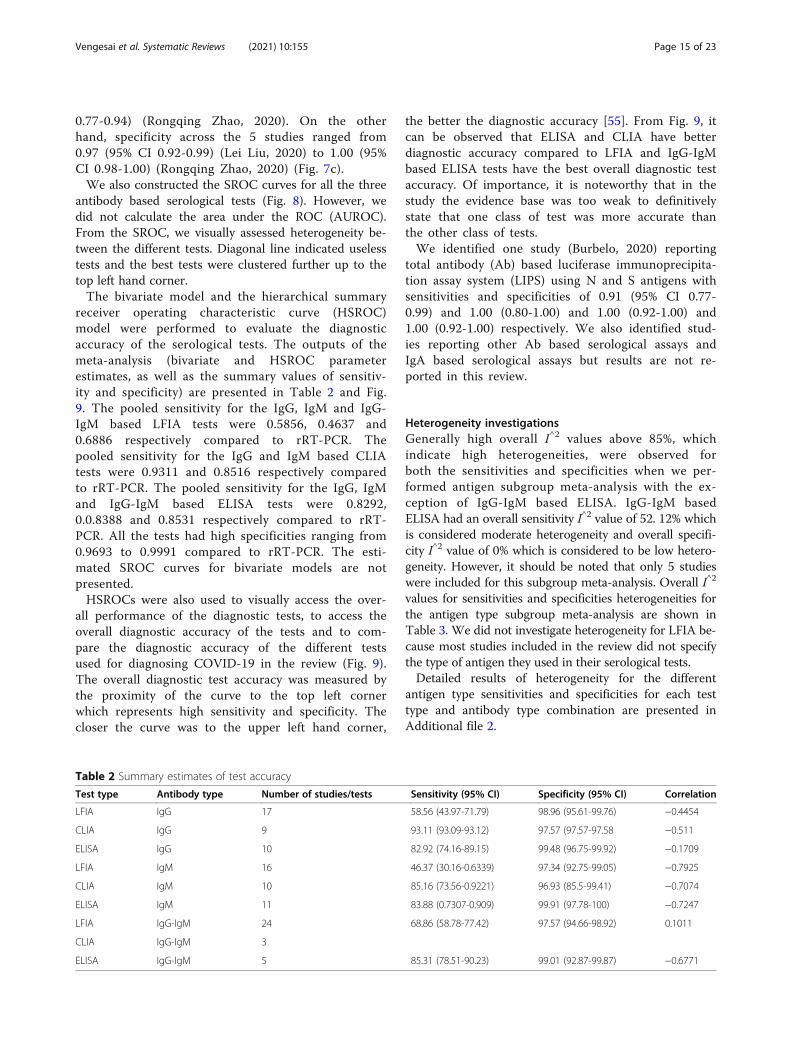
receiver operating characteristic curve (HSROC)model were performed to evaluate the diagnosticaccuracy of the serological tests. The outputs of themeta-analysis (bivariate and HSROC parameterestimates, as well as the summary values of sensitiv-ity and specificity) are presented in Table 2 and Fig.9. The pooled sensitivity for the IgG, IgM and IgG-IgM based LFIA tests were 0.5856, 0.4637 and0.6886 respectively compared to rRT-PCR. Thepooled sensitivity for the IgG and IgM based CLIAtests were 0.9311 and 0.8516 respectively comparedto rRT-PCR. The pooled sensitivity for the IgG, IgMand IgG-IgM based ELISA tests were 0.8292,0.0.8388 and 0.8531 respectively compared to rRT-PCR. All the tests had high specificities ranging from0.9693 to 0.9991 compared to rRT-PCR. The esti-mated SROC curves for bivariate models are notpresented.HSROCs were also used to visually access the over-
all performance of the diagnostic tests, to access theoverall diagnostic accuracy of the tests and to com-pare the diagnostic accuracy of the different testsused for diagnosing COVID-19 in the review (Fig. 9).The overall diagnostic test accuracy was measured bythe proximity of the curve to the top left cornerwhich represents high sensitivity and specificity. Thecloser the curve was to the upper left hand corner,
the better the diagnostic accuracy [55]. From Fig. 9, itcan be observed that ELISA and CLIA have betterdiagnostic accuracy compared to LFIA and IgG-IgMbased ELISA tests have the best overall diagnostic testaccuracy. Of importance, it is noteworthy that in thestudy the evidence base was too weak to definitivelystate that one class of test was more accurate thanthe other class of tests.We identified one study (Burbelo, 2020) reporting
total antibody (Ab) based luciferase immunoprecipita-tion assay system (LIPS) using N and S antigens withsensitivities and specificities of 0.91 (95% CI 0.77-0.99) and 1.00 (0.80-1.00) and 1.00 (0.92-1.00) and1.00 (0.92-1.00) respectively. We also identified stud-ies reporting other Ab based serological assays andIgA based serological assays but results are not re-ported in this review.
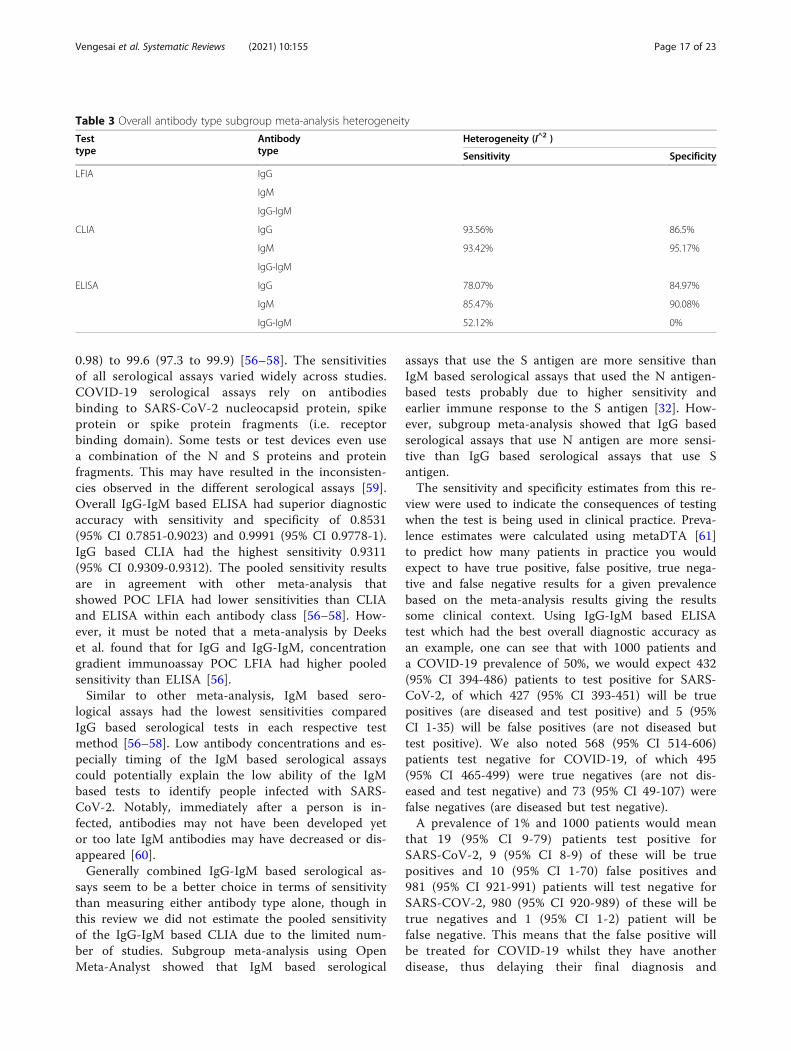
Heterogeneity investigationsGenerally high overall I^2 values above 85%, whichindicate high heterogeneities, were observed forboth the sensitivities and specificities when we per-formed antigen subgroup meta-analysis with the ex-ception of IgG-IgM based ELISA. IgG-IgM basedELISA had an overall sensitivity I^2 value of 52. 12% whichis considered moderate heterogeneity and overall specifi-city I^2 value of 0% which is considered to be low hetero-geneity. However, it should be noted that only 5 studieswere included for this subgroup meta-analysis. Overall I^2
values for sensitivities and specificities heterogeneities forthe antigen type subgroup meta-analysis are shown inTable 3. We did not investigate heterogeneity for LFIA be-cause most studies included in the review did not specifythe type of antigen they used in their serological tests.Detailed results of heterogeneity for the different
antigen type sensitivities and specificities for each testtype and antibody type combination are presented inAdditional file 2.
Table 2 Summary estimates of test accuracy
Test type Antibody type Number of studies/tests Sensitivity (95% CI) Specificity (95% CI) Correlation
LFIA IgG 17 58.56 (43.97-71.79) 98.96 (95.61-99.76) −0.4454
CLIA IgG 9 93.11 (93.09-93.12) 97.57 (97.57-97.58 −0.511
ELISA IgG 10 82.92 (74.16-89.15) 99.48 (96.75-99.92) −0.1709
LFIA IgM 16 46.37 (30.16-0.6339) 97.34 (92.75-99.05) −0.7925
CLIA IgM 10 85.16 (73.56-0.9221) 96.93 (85.5-99.41) −0.7074
ELISA IgM 11 83.88 (0.7307-0.909) 99.91 (97.78-100) −0.7247
LFIA IgG-IgM 24 68.86 (58.78-77.42) 97.57 (94.66-98.92) 0.1011
CLIA IgG-IgM 3
ELISA IgG-IgM 5 85.31 (78.51-90.23) 99.01 (92.87-99.87) −0.6771
Vengesai et al. Systematic Reviews (2021) 10:155 Page 15 of 23

Test sensitivity by time since onset of symptomsFigure 10 shows forest plots for antibody positive rates forIgG (25 tests), IgM (22 tests) and IgG-IgM (30 tests),stratified by days since initial symptom onset to specimencollection. The sensitivity of the serological tests generallyincreased with increased time from symptoms onset.Regardless of test method (ELISA or CLIA or LFIA), thesensitivities for IgG and IgM based tests were generallylow in the first week (1-7 days) of symptom onsetfollowed by the second (7-14 days) and the sensitiv-ities were generally highest in the third week or later(>14 days) for each test. Data on specificity stratifiedby specimen collection since symptom onset was notavailable for all the studies.
DiscussionCOVID-19 is a major healthcare challenge globally.One key aspect of limiting SARS-CoV-2 spread is toensure early and accurate diagnosis of the viral in-fection. In this study, we performed a meta-analysisto evaluate the diagnostic accuracy of IgG and IgMbased serological assays offered to detect antigensagainst rRT-PCR positive SARS-CoV-2 patients. Themeta-analysis showed that all serological assaysyielded high specificities ranging from 0.9693 (95%CI 0.855-0.9941) to 0.9991 (95% CI 0.9778-1) incomparison to rRT-PCR. Meta-analysis by Wanget al., Bastos et al. and Deeks et al. observed similarpooled specificities ranging from 0.95 (95% CI 0.91–
Fig. 9 Hierarchical summary receiver operating characteristic (HSROC) curve obtained using OpenMeta-Analyst. Every circle represents thesensitivity and specificity estimates of individual studies in the meta-analysis, and the size of the circle reflects the sample size. The black dotsindicate summary points of sensitivity and specificity; HSROC curve is the line passing through summary point. The curve is the regression linethat summarises the overall diagnostic accuracy. a HSROC for IgG serological tests. b HSROC for IgM serological tests. c HSROC IgG-IgMserological tests. 1, LFIA HSROC; 2, CLIA HSROC and 3, ELISA HSROC
Vengesai et al. Systematic Reviews (2021) 10:155 Page 16 of 23
0.98) to 99.6 (97.3 to 99.9) [56–58]. The sensitivitiesof all serological assays varied widely across studies.COVID-19 serological assays rely on antibodiesbinding to SARS-CoV-2 nucleocapsid protein, spikeprotein or spike protein fragments (i.e. receptorbinding domain). Some tests or test devices even usea combination of the N and S proteins and proteinfragments. This may have resulted in the inconsisten-cies observed in the different serological assays [59].Overall IgG-IgM based ELISA had superior diagnosticaccuracy with sensitivity and specificity of 0.8531(95% CI 0.7851-0.9023) and 0.9991 (95% CI 0.9778-1).IgG based CLIA had the highest sensitivity 0.9311(95% CI 0.9309-0.9312). The pooled sensitivity resultsare in agreement with other meta-analysis thatshowed POC LFIA had lower sensitivities than CLIAand ELISA within each antibody class [56–58]. How-ever, it must be noted that a meta-analysis by Deekset al. found that for IgG and IgG-IgM, concentrationgradient immunoassay POC LFIA had higher pooledsensitivity than ELISA [56].Similar to other meta-analysis, IgM based sero-
logical assays had the lowest sensitivities comparedIgG based serological tests in each respective testmethod [56–58]. Low antibody concentrations and es-pecially timing of the IgM based serological assayscould potentially explain the low ability of the IgMbased tests to identify people infected with SARS-CoV-2. Notably, immediately after a person is in-fected, antibodies may not have been developed yetor too late IgM antibodies may have decreased or dis-appeared [60].Generally combined IgG-IgM based serological as-
says seem to be a better choice in terms of sensitivitythan measuring either antibody type alone, though inthis review we did not estimate the pooled sensitivityof the IgG-IgM based CLIA due to the limited num-ber of studies. Subgroup meta-analysis using OpenMeta-Analyst showed that IgM based serological
assays that use the S antigen are more sensitive thanIgM based serological assays that used the N antigen-based tests probably due to higher sensitivity andearlier immune response to the S antigen [32]. How-ever, subgroup meta-analysis showed that IgG basedserological assays that use N antigen are more sensi-tive than IgG based serological assays that use Santigen.The sensitivity and specificity estimates from this re-
view were used to indicate the consequences of testingwhen the test is being used in clinical practice. Preva-lence estimates were calculated using metaDTA [61]to predict how many patients in practice you wouldexpect to have true positive, false positive, true nega-tive and false negative results for a given prevalencebased on the meta-analysis results giving the resultssome clinical context. Using IgG-IgM based ELISAtest which had the best overall diagnostic accuracy asan example, one can see that with 1000 patients anda COVID-19 prevalence of 50%, we would expect 432(95% CI 394-486) patients to test positive for SARS-CoV-2, of which 427 (95% CI 393-451) will be truepositives (are diseased and test positive) and 5 (95%CI 1-35) will be false positives (are not diseased buttest positive). We also noted 568 (95% CI 514-606)patients test negative for COVID-19, of which 495(95% CI 465-499) were true negatives (are not dis-eased and test negative) and 73 (95% CI 49-107) werefalse negatives (are diseased but test negative).A prevalence of 1% and 1000 patients would mean
that 19 (95% CI 9-79) patients test positive forSARS-CoV-2, 9 (95% CI 8-9) of these will be truepositives and 10 (95% CI 1-70) false positives and981 (95% CI 921-991) patients will test negative forSARS-COV-2, 980 (95% CI 920-989) of these will betrue negatives and 1 (95% CI 1-2) patient will befalse negative. This means that the false positive willbe treated for COVID-19 whilst they have anotherdisease, thus delaying their final diagnosis and
Table 3 Overall antibody type subgroup meta-analysis heterogeneity
Testtype
Antibodytype
Heterogeneity (I^2 )
Sensitivity Specificity
LFIA IgG
IgM
IgG-IgM
CLIA IgG 93.56% 86.5%
IgM 93.42% 95.17%
IgG-IgM
ELISA IgG 78.07% 84.97%
IgM 85.47% 90.08%
IgG-IgM 52.12% 0%
Vengesai et al. Systematic Reviews (2021) 10:155 Page 17 of 23

Fig. 10 Forest plot of studies evaluating tests for detection of IgG, IgM and IgG-IgM according to days since COVID-19 symptom onset tospecimen collection. In brackets () are the number of days since symptom onset to specimen collection. Artron, Auto Bio CTK Biotech CTKBiotech are test names all reported in a study by Lassaunire et al
Vengesai et al. Systematic Reviews (2021) 10:155 Page 18 of 23
subsequent treatment. In the false-negatives,COVID-19 diagnosis will be missed or delayed andthe patients will not be quarantined and they willthus spread the SARS-CoV-2 to other patients in thehospital/clinic. Nonetheless, despite calculations likethese providing insight in the consequences of test-ing, they should be taken with caution.Using the inferences for LIFA using the IgG-IgM
based test [sensitivity 0.6886 (0.5878-0.7742) andspecificity 0.9757 (0.9466-0.9892)]. We see that for1000 patients and a COVID-19 prevalence of 50%,we would expect 356 (95% CI 299-414) patients totest positive for SARS-CoV-2, 324 (95% CI 294-387)of which will be true positives and 12 (95% CI 5-27)will be false positives. We would also expect 644(95% CI 586-701) patients to test negative for theCOVID-19, 488 (95% CI 473-495) of which will betrue negatives and 156 (95% CI 113-206) are falsenegatives. A prevalence of 1% and 1000 patientswould mean 31 (95% CI 16-62) patients test positivefor SARS-CoV-2, 7 (95% CI 6-8) of these will betrue positives and 24 (95% CI 10-54) false positivesand 969 (95% CI 938-984) patients to test negativefor COVID, 966 (95% CI 936-980) of these will betrue negatives and 3 (95% CI 2-4) are false negatives.Compared to IgG-IgM based ELISA, the IgG-IgMbased LFIA has higher rates of false positives andfalse negatives.
LimitationSerological tests for SARS-CoV-2 have accuracy is-sues that warrant attention. They measure specificantibody responses which may take some weeks todevelop after disease onset reducing the sensitivity ofthe assay. If blood samples were collected during theearly stage of the infection, they may produce falsenegative results. They do not directly detect thepresence of the virus. Further, antibodies may bepresent when SARS-CoV-2 is no longer present giv-ing false positive case diagnosis. Moreover, since theidentity of the N protein of SARS-CoV-2 and SARS-CoV reached up to 91.2%, there is probability of across reaction between the N protein of SARS-CoV-2 and antibodies against other human coronaviruses.Other molecules including interferon, rheumatoidfactor and non-specific IgM may cause false positiveresults [42].Most studies included in the meta-analysis were case-
control studies. These may be easy to perform in a la-boratory setting than cross-sectional designs, but theirresults are less representative for clinical practice. Theperformance of diagnostic tests very much depends onthe population in which the test is being used. Futurestudies should therefore be prospective cross-sectional
studies including a consecutive sample of presentingpatients.Index tests need to be evaluated to determine their
sensitivity and specificity, ideally by comparison witha standard confirmatory test. An important limita-tion with the rRT-PCR, the standard confirmatorytest for COVID-19 is the risk of false-negative re-sults [62]. Two reviews of the accuracy of rRT-PCRCOVID-19 tests reported false negative rates of be-tween 2% and 29%, based on negative rRT-PCR testswhich were positive on repeat rRT-PCR testing [63,64]. False negative results of rRT-PCR tests can leaddecreased specificity of the serological tests (indextests). The rRT-PCR negative results picked up aspositive tests by the serological tests will be treatedas false positives thereby lowering the specificity ofthe serological tests. In order to reduce false-negative results, Bastos et al. recommended that thestandard confirmatory test should consist of RT-PCRperformed on at least two consecutive specimensand when possible it must include viral cultures[57].
ConclusionGiven the poor performance of the current LFIA de-vices, we recommend more research to develop highlysensitivity and specific POC LFIA that are adequatefor most individual patient applications and attractivefor large seroprevalence studies. The use of CLIA andELISA for diagnosis has high sensitivity and is com-parable to using rRT-PCR. They may be calibrated tobe specific for detecting and quantifying SARSCoV-2IgM and IgG. More serological data should be col-lected to elucidate the clinical and epidemiologicalutility of IgG and IgM serological measurements todetect symptomatic and asymptomatic cases ofCOVID-19.
Appendix 1Search strategy in PubMed
Search Query Itemsfound
#20 Search (((((COVID-19[Title/Abstract]) OR SARS-CoV-2[Title/Abstract]) OR 2019-nCoV[Title/Abstract]) ORWuhan Coronavirus[Title/Abstract])) AND(((((((((((((Serologic test) OR Serologic method) ORSerological test) OR Serological method) OR Sero-diagnosis) OR Immunodiagnosis) OR Immunologicaltest) OR Immunological method) OR Antibody de-tection) OR Antigen detection) OR IgM) OR IgG) ORImmunochromatography)
78
#19 Search ((((((((((((Serologic test) OR Serologic method)OR Serological test) OR Serological method) ORSerodiagnosis) OR Immunodiagnosis) ORImmunological test) OR Immunological method) OR
822733
Vengesai et al. Systematic Reviews (2021) 10:155 Page 19 of 23
Search strategy in PubMed (Continued)
Search Query Itemsfound
Antibody detection) OR Antigen detection) OR IgM)OR IgG) OR Immunochromatography
#18 Search Immunochromatography 69624
#17 Search IgG 143941
#16 Search IgM 66041
#15 Search Antigen detection 82456
#14 Search Antibody detection 99123
#13 Search Immunological method 39637
#12 Search Immunological test 456120
#11 Search Immunodiagnosis 450622
#10 Search Serodiagnosis 184574
#9 Search Serological method 24322
#8 Search Serological test 191599
#7 Search Serologic method 16939
#6 Search Serologic test 184758
#5 Search (((COVID-19[Title/Abstract]) OR SARS-CoV-2[Title/Abstract]) OR 2019-nCoV[Title/Abstract]) ORWuhan Coronavirus[Title/Abstract]
6734
#4 Search Wuhan Coronavirus[Title/Abstract] 14
#3 Search 2019-nCoV[Title/Abstract] 547
#2 Search SARS-CoV-2[Title/Abstract] 1898
#1 Search COVID-19[Title/Abstract] 5985
Appendix 2Rating of QUADAS-2 items1. Patient selection1a. Risk of bias, signalling questions
� Was a case-control design avoided?▪ Case-control designs, especially if they includehealthy controls, carry a high risk of bias.Therefore, all case-control studies are automatic-ally rated to be of high risk of bias in the overalljudgement.
� Was a consecutive or random sample of patientsenrolled?
� Did the study avoid inappropriate exclusions?� Overall judgement:
▪ Case-control studies were always rated as havinga high risk of bias.▪ Cross-sectional studies: only low risk of bias ifthe other two signalling questions are answeredwith ‘yes’. If one of the questions was answered‘no’, then high risk of bias. Otherwise ‘unclear’.
1b. Concerns regarding applicability: this concerns theextent to which the patients (both cases and controls)
that were included in a study are representative for thepatients which will receive these serology tests.
� Is there concern that the included patients do notmatch the review question?▪ All case-control studies are by default rated ‘highconcern’. All cross-sectional studies are bydefault ‘low concern’, except when the used casedefinition was not very clear.
2. Index test2a. Risk of bias, signalling questions
� Were the index test results interpreted withoutknowledge of the results of the reference standard?
� If a threshold was used, was it pre-specified? Byselecting the cut-off value with the highestsensitivity and/or specificity, researchersartificially optimise the accuracy of their tests,which may lead to an overestimation of sensitivity andspecificity. POC LFIA threshold were pre-specifiedand the signal was the development of a line orcolour.
� Overall judgement:▪ If a study was not reporting results fromautomated assays and it did not explicitlymention blinding then tests were automaticallyrated as high risk.
▪ If there was blinding and the second questionwas answered with ‘yes’, overall judgement was‘low’.
2b. Concerns regarding applicability: this concerns theextent to which the index test evaluated is representativeof the tests that will be used in practice.
� Are there concerns that the index test, itsapplication or interpretation deviate from the reviewquestion?▪ All in-house tests were automatically rated as‘high concern’.
▪ If serum or plasma samples not blood were usedfor POC LFIA then tests were automaticallyrated high concern
Risk of bias and concerns regarding applicability wereassessed for each test separately.
3. Reference standard3a. Risk of bias, signalling questions
� Is the reference standard likely to correctly classifythe target condition?
Vengesai et al. Systematic Reviews (2021) 10:155 Page 20 of 23

▪ Assumption: This will likely be the case for case-control studies that use the ‘correct’ casedefinitions
▪ This is also likely for cross-sectional studieswhich use the ‘correct’ case definitions.
� Were the reference standard results interpretedwithout knowledge of the results of the index test?▪ Assumption: This will likely be the case for mostcase-control studies, but only if serology was notpart of the case definition.
▪ For cross-sectional studies, this should beexplicitly stated.
� Overall judgement risk of bias:▪ Case-control studies with clear case definitionswere rated as having a ‘low’ risk of bias.
▪ case-control studies with unclear/wrong casedefinitions rated as ‘unclear’ Or ‘high risk’ of biasrespectively
▪ Cross-sectional studies with a clear casedefinition and the second question answeredwith ‘yes’: low risk of bias.
▪ Otherwise ‘unclear’.
3b. Concerns regarding applicability: Are there concernsthat the target condition as defined by the referencestandard does not match the review question?
▪ If serology is included in the case definition, there isan incorporation bias and thus a high risk of bias.
▪ If a case-control study uses clear criteria and does notinclude serology in these criteria: ‘low’ concern of bias.
4. Risk of bias regarding flow and timing, signallingquestions
� Was there an appropriate interval between indextest(s) and reference standard?▪ We expected that studies with a cross-sectionaldesign conducted most tests on a datesufficiently close to the final diagnosis. If we hadreason to suspect that the patient status changedbetween the time of testing and the time ofdiagnosis, we rated this as ‘no’.
▪ For case-control studies, this was always rated as‘no’, because serology was always determinedafter the case definitions were defined,sometimes with a long delay.
� Did patients receive the same reference standard?� Were all patients included in the analysis?
▪ This was rated ‘no’ for all case-control studies.� Overall judgement:
▪ Case-control studies were always rated as havinga high risk of bias.
▪ For cross-sectional studies, we perceived a lowrisk of bias if all three questions were answeredwith ‘yes’; a high risk of bias was perceived if atleast one of them was answered ‘no’. All otherpossibilities were rated as ‘unclear’ [65].
AbbreviationsCOVID-19: Coronavirus disease 2019; SARS: Severe acute respiratorysyndrome; SARS-CoV-2: Severe acute respiratory syndrome coronavirus 2;STARD: Standards for the reporting of diagnostic accuracy studies; QUADAS-2: Quality Assessment of Diagnostic Accuracy Studies-2; rRT-PCR: Real-timereverse-transcriptase polymerase chain reaction; PRISMA-DTA: PreferredReporting Items for Systematic Reviews and Meta-Analyses of Diagnostic testaccuracy; DTA: Diagnostic test accuracy; RT-qPCR: Quantitative real-time poly-merase chain reaction; POC: Point-of-care; LFIA: Lateral flow immunoassays;CLIA: Chemiluminescence enzyme immunoassay; FIA: Fluorescence;EISA: Enzyme-linked immunoassay; LIPS: Luciferase immunoprecipitationassay systems; S: SARS-CoV-2 spike protein; N: SARS-CoV-2 nucleocapsidprotein; E: SARS-CoV-2 envelope protein; HSROC: Hierarchical summaryreceiver operating characteristic; TP: True positive; FN: False negative;FP: False positive; TN: True negative
Supplementary InformationThe online version contains supplementary material available at https://doi.org/10.1186/s13643-021-01689-3.
Additional file 1. PRISMA-DTA Checklist
Additional file 2. Antigen type subgroup-meta analysis results
AcknowledgementsNot applicable
Authors’ contributionsAV and TM conceived idea and designed the study protocol. AV, HM, HM,TLMJ and MK conducted a comprehensive literature search, screened theliterature and extracted the data. AV did the statistical analysis. TN, FM, SRand TM provide guidance. The authors read and approved the final versionof the manuscript.
FundingThis research was commissioned by the National Institute for HealthResearch (NIHR) Global Health Research programme (16/136/33) using UKaid from the UK Government. The views expressed in this publication arethose of the author(s) and not necessarily those of the NIHR or theDepartment of Health and Social Care.
Availability of data and materialsThe raw data (data extraction results) will be provided for sharing afterreasonable request.
Declarations
Ethics approval and consent to participateNot applicable
Consent for publicationNot applicable
Competing interestsThe authors declare that they have no competing interests.
Author details1Department of Biochemistry, University of Zimbabwe, P.O. Box MP 167, MtPleasant, Harare, Zimbabwe. 2Optics and Imaging, Doris Duke MedicalResearch Institute, College of Health Sciences, University of KwaZulu-Natal,Durban, KwaZulu-Natal, South Africa. 3College of Health Sciences, Universityof Zimbabwe, Box A178 Mazowe Street Avondale, Harare, Zimbabwe.4Institute for Immunology and Infection Research and Centre for Immunity,
Vengesai et al. Systematic Reviews (2021) 10:155 Page 21 of 23
Infection and Evolution, School of Biological Sciences, Ashworth Laboratories,University of Edinburgh, King’s Buildings, Charlotte Auerbach Rd, EdinburghEH9 3JT, UK.
Received: 10 June 2020 Accepted: 26 April 2021
References1. Ludvigsson JF. Systematic review of COVID-19 in children shows milder
cases and a better prognosis than adults. Acta Paediatr. 2020;109(6):1088–95Available from: https://onlinelibrary.wiley.com/doi/abs/10.1111/apa.15270.Cited 2020 May 27.
2. Ren L-L, Wang Y-M, Wu Z-Q, Xiang Z-C, Guo L, Xu T, et al. Identification of anovel coronavirus causing severe pneumonia in human. Chin Med J. 2020;133(9):1015–24 Available from: http://journals.lww.com/10.1097/CM9.0000000000000722. Cited 2020 May 28.
3. Situation Summary | CDC. Available from: https://www.cdc.gov/coronavirus/2019-ncov/cases-updates/summary.html. Cited 2020 May 27
4. NIH clinical trial of investigational vaccine for COVID-19 begins | NationalInstitutes of Health (NIH). Available from: https://www.nih.gov/news-events/news-releases/nih-clinical-trial-investigational-vaccine-covid-19-begins. Cited2020 May 27
5. COVID-19 situation update worldwide, as of 11 November 2020. Availablefrom: https://www.ecdc.europa.eu/en/geographical-distribution-2019-ncov-cases. Cited 2020 Nov 12
6. Coronavirus. Available from: https://www.who.int/health-topics/coronavirus#tab=tab_1. Cited 2020 Nov 12
7. Coronavirus disease 2019 (COVID-19) Situation Report-63 HIGHLIGHTS.https://www.who.int/emergencies/diseases/novel-coronavirus-2019/situation-reports
8. Guo L, Ren L, Yang S, Xiao M, Chang D, Yang F, et al. Clinical infectiousdiseases Clinical Infectious Diseases ® 2020;XX(XX):1-8. Available from:https://academic.oup.com/cid/advance-article-abstract/doi/10.1093/cid/ciaa310/5810754. Cited 2020 May 28
9. Diagnostic testing for SARS-CoV-2. Available from: https://www.who.int/publications/i/item/diagnostic-testing-for-sars-cov-2. Cited 2020 Nov 18
10. To KKW, Tsang OTY, Leung WS, Tam AR, Wu TC, Lung DC, et al. Temporalprofiles of viral load in posterior oropharyngeal saliva samples and serumantibody responses during infection by SARS-CoV-2: an observationalcohort study. Lancet Infect Dis. 2020;20(5):565–74.
11. Wikramaratna P, Paton RS, Ghafari M, Lourenco J. Estimating false-negative detection rate of SARS-CoV-2 by RT-PCR. medRxiv. 2020:2020.04.05.20053355 Available from: https://doi.org/10.1101/2020.04.05.20053355. Cited 2020 May 28.
12. Li D, Wang D, Dong J, Wang N, Huang H, Xu H, et al. False-negative resultsof real-time reverse-transcriptase polymerase chain reaction for severe acuterespiratory syndrome coronavirus 2: role of deep-learning-based ctdiagnosis and insights from two cases. Korean J Radiol. 2020;21(4):505–8.https://doi.org/10.3348/kjr.2020.0146.
13. Guo L, Ren L, Yang S, Xiao M, Chang D, Yang F, et al. Profiling early humoralresponse to diagnose novel coronavirus disease (COVID-19). Clin Infect Dis.2020; Available from: http://www.ncbi.nlm.nih.gov/pubmed/32198501. Cited2020 Apr 2.
14. Zhang W, Du RH, Li B, Zheng XS, Lou YX, Hu B, et al. Molecular andserological investigation of 2019-nCoV infected patients: implication ofmultiple shedding routes. Emerg Microbes Infect. 2020;9(1):386–9 Availablefrom: https://www.tandfonline.com/doi/full/10.1080/22221751.2020.1729071.Cited 2020 May 28.
15. Qian C, Zhou M, Cheng F, Lin X, Gong Y, Xie X, et al. Development andmulticenter performance evaluation of the first fully automated SARS-CoV-2IgM and IgG immunoassays. medRxiv. 2020:2020.04.16.20067231.
16. The critical role of laboratory medicine during coronavirus disease 2019(COVID-19) and other viral outbreaks in: Clinical Chemistry and LaboratoryMedicine (CCLM) - Ahead of print. Available from: https://www.degruyter.com/view/journals/cclm/ahead-of-print/article-10.1515-cclm-2020-0240/article-10.1515-cclm-2020-0240.xml. Cited 2020 May 28
17. McInnes MDF, Moher D, Thombs BD, McGrath TA, Bossuyt PM, Clifford T,et al. Preferred Reporting Items for a Systematic Review and Meta-analysisof Diagnostic Test Accuracy Studies The PRISMA-DTA Statement. JAMA.2018;319(4):388–96. https://doi.org/10.1001/jama.2017.19163.
18. Macaskill P, Gatsonis C, Deeks J, Harbord R, Takwoingi Y. Cochranehandbook for systematic reviews of diagnostic test accuracy Chapter 10Analysing and presenting results. Available from: http://srdta.cochrane.org/.Cited 2020 May 31
19. Zeller H, Van Bortel W. A systematic literature review on the diagnosisaccuracy of serological tests for Lyme borreliosis; 2016.
20. Steingart KR, Henry M, Laal S, Hopewell PC, Ramsay A, Menzies D, et al. Asystematic review of commercial serological antibody detection tests forthe diagnosis of extrapulmonary tuberculosis. Postgrad Med J. 2007;83:705–12 BMJ Publishing Group Ltd.
21. Volpe Chaves CE, do Valle Leone de Oliveira SM, Venturini J, GrandeAJ, Sylvestre TF, Poncio Mendes R, et al. Accuracy of serological testsfor diagnosis of chronic pulmonary aspergillosis: a systematic reviewand meta-analysis. PLoS One. 2020;15(3):e0222738 Available from:https://dx.plos.org/10.1371/journal.pone.0222738. Agarwal R, editor.Cited 2020 May 31.
22. Abba K, Deeks JJ, Olliaro PL, Naing C-M, Jackson SM, Takwoingi Y, et al.Rapid diagnostic tests for diagnosing uncomplicated P. falciparum malariain endemic countries. Cochrane Database Syst Rev. 2011;(7).
23. Whiting PF, Rutjes AWS, Westwood ME, Mallett S, Deeks JJ, Reitsma JB, et al.Quadas-2: a revised tool for the quality assessment of diagnostic accuracystudies. Ann Intern Med. 2011;155:529–36 American College of Physicians.
24. Takwoingi Y, Riley RD, Deeks JJ. Meta-analysis of diagnostic accuracy studiesin mental health. Evid Based Ment Health. 2015;18(4):103–9. https://doi.org/10.1136/eb-2015-102228.
25. Higgins JPT, Thompson SG, Deeks JJ, Altman DG. Measuring inconsistencyin meta-analyses. Br Med J. 2003;327:557–60 British Medical JournalPublishing Group.
26. Ochodo EA, Gopalakrishna G, Spek B, Reitsma JB, van Lieshout L, Polman K,et al. Circulating antigen tests and urine reagent strips for diagnosis ofactive schistosomiasis in endemic areas. Cochrane Database Syst Rev. 2015;2015 John Wiley and Sons Ltd.
27. Kai-Wang To K, Tak-Yin Tsang O, Leung W-S, Raymond Tam A, Wu T-C,Christopher Lung D, et al. Temporal profiles of viral load in posteriororopharyngeal saliva samples and serum antibody responses duringinfection by SARS-CoV-2: an observational cohort study. 2020; Availablefrom: www.thelancet.com/infection. Cited 2020 May 31
28. Cassaniti I, Novazzi F, Giardina F, Salinaro F, Sachs M, Perlini S, et al.Performance of VivaDiag COVID-19 IgM/IgG rapid test is inadequate fordiagnosis of COVID-19 in acute patients referring to emergency roomdepartment. J Med Virol. 2020:jmv.25800 Available from: https://onlinelibrary.wiley.com/doi/abs/10.1002/jmv.25800. Cited 2020 May 28.
29. Lin D, Liu L, Zhang M, Hu Y, Yang Q, Guo J, et al. Evaluations of serologicaltest in the diagnosis of 2019 novel coronavirus (SARS-CoV-2) infectionsduring the COVID-19 outbreak. medRxiv. 2020:2020.03.27.20045153 Availablefrom: https://www.medrxiv.org/content/10.1101/2020.03.27.20045153v1.Cited 2020 May 31.
30. Xiang J, Yan M, Li H, Liu T, Lin C, Huang S, et al. Evaluation ofenzyme-linked immunoassay and colloidal gold-immunochromatographic assay kit for detection of novel coronavirus(SARS-Cov-2) causing an outbreak of pneumonia (COVID-19). medRxiv.2020:2020.02.27.20028787 Available from: https://doi.org/10.1101/2020.02.27.20028787. Cited 2020 May 31.
31. Liu R, Liu X, Han H, Shereen MA, Niu Z, Li D, et al. The comparativesuperiority of IgM-IgG antibody test to real-time reverse transcriptase PCRdetection for SARS-CoV-2 infection diagnosis. medRxiv. 2020:2020.03.28.20045765.
32. Liu W, Liu L, Kou G, Zheng Y, Ding Y, Ni W, et al. Evaluation of nucleocapsidand Spike protein-based ELISAs for detecting antibodies against SARS-CoV-2. J Clin Microbiol. 2020;58(6).
33. Chen J, Hu J, Long Q, Deng H, Fan K, Liao P, et al. A peptide-basedmagnetic chemiluminescence enzyme immunoassay for 1 Xue-fei. medrxiv.org. 2020:2020.02.22.20026617 Available from: https://doi.org/10.1101/2020.02.22.20026617. Cited 2020 May 31.
34. Pan Y, Li X, Yang G, Fan J, Tang Y, Zhao J, et al. Serologicalimmunochromatographic approach in diagnosis with SARS-CoV-2 infectedCOVID-19 patients. medRxiv. 2020:2020.03.13.20035428.
35. Jin Y, Wang M, Zuo Z, Fan C, Ye F, Cai Z, et al. Diagnostic value anddynamic variance of serum antibody in coronavirus disease 2019. Int J InfectDis. 2020;94:49–52 Available from: https://doi.org/10.1016/j.ijid.2020.03.065.Cited 2020 May 31.
Vengesai et al. Systematic Reviews (2021) 10:155 Page 22 of 23

36. Zhao J, Yuan Q, Wang H, Liu W, Liao X, Su Y, et al. Antibody responses toSARS-CoV-2 in patients of novel coronavirus disease 2019. Clin Infect Dis.2020; Available from: http://www.ncbi.nlm.nih.gov/pubmed/32221519. Cited2020 Apr 2.
37. Li Z, Yi Y, Luo X, Xiong N, Liu Y, Li S, et al. Development and clinicalapplication of a rapid IgM-IgG combined antibody test for SARS-CoV-2infection diagnosis. J Med Virol. 2020; Available from: http://www.ncbi.nlm.nih.gov/pubmed/32104917. Cited 2020 Apr 2.
38. Zhao R, Li M, Song H, Chen J, Ren W, Feng Y, et al. Serological diagnostic kitof SARS-CoV-2 antibodies using CHO-expressed full-length SARS-CoV-2 S1proteins. medRxiv. 2020:2020.03.26.20042184 Available from: https://www.medrxiv.org/content/10.1101/2020.03.26.20042184v1. Cited 2020 May 31.
39. Zhang P, Gao Q, Wang T, Ke Y, Mo F, Jia R, et al. Evaluation of recombinantnucleocapsid and spike proteins for serological diagnosis of novelcoronavirus disease 2019 (COVID-19). medRxiv. 2020:2020.03.17.20036954Available from: https://www.medrxiv.org/content/10.1101/2020.03.17.20036954v1. Cited 2020 May 31.
40. Paradiso AV, De Summa S, Loconsole D, Procacci V, Sallustio A, Centrone F,et al. Clinical meanings of rapid serological assay in patients tested forSARS-Co2 RT-PCR. medRxiv. 2020:2020.04.03.20052183.
41. Ma H, Zeng W, He H, Zhao D, Yang Y, Jiang D, et al. COVID-19 diagnosisand study of serum SARS-CoV-2 specific IgA, IgM and IgG by a quantitativeand sensitive immunoassay. medRxiv. 2020:2020.04.17.20064907.
42. Zhong L, Chuan J, Gong B, Shuai P, Zhou Y, Zhang Y, et al. Detectionof serum IgM and IgG for COVID-19 diagnosis. Sci China Life Sci.2020;63(5):777–80. https://doi.org/10.1007/s11427-020-1688-9 Sciencein China Press.
43. Xie J, Ding C, Li J, Wang Y, Guo H, Lu Z, et al. Characteristics of patientswith coronavirus disease (COVID-19) confirmed using an IgM-IgG antibodytest. J Med Virol. 2020:jmv.25930 Available from: https://onlinelibrary.wiley.com/doi/abs/10.1002/jmv.25930. Cited 2020 May 31.
44. Infantino M, Grossi V, Lari B, Bambi R, Perri A, Manneschi M, et al. Diagnosticaccuracy of an automated chemiluminescent immunoassay for anti-SARS-CoV-2 IgM and IgG antibodies: an Italian experience. J Med Virol. 2020:jmv.25932 Available from: https://onlinelibrary.wiley.com/doi/abs/10.1002/jmv.25932. Cited 2020 May 31.
45. Crook D. Evaluation of antibody testing for SARS-CoV-2 using ELISA andlateral flow immunoassays. Available from: https://doi.org/10.1101/2020.04.15.20066407. Cited 2020 May 31
46. Lassaunière R, Frische A, Harboe ZB, Nielsen AC, Fomsgaard A, Krogfelt KA,et al. Evaluation of nine commercial SARS-CoV-2 immunoassays. medRxiv.2020:2020.04.09.20056325.
47. Wang Q, Du Q, Guo B, Mu D, Lu X, Ma Q, et al. A method to prevent SARS-CoV-2 IgM false positives in gold immunochromatography and enzyme-linked immunosorbent assays. J Clin Microbiol. 2020;58(6).
48. Lou B, Li T, Zheng S, Su Y, Li Z, Liu W, et al. Serology characteristics of SARS-CoV-2 infection since the exposure and post symptoms onset. medRxiv.2020:2020.03.23.20041707.
49. Liu L, Liu W, Wang S, Zheng S. A preliminary study on serological assay forsevere acute respiratory syndrome coronavirus 2 (SARS-CoV-2) in 238admitted hospital patients. medRxiv. 2020:2020.03.06.20031856.
50. Imai K, Tabata S, Ikeda M, Noguchi S, Kitagawa Y, Matuoka M, et al. Clinicalevaluation of an immunochromatographic IgM/IgG antibody assay andchest computed tomography for the diagnosis of COVID-19. medRxiv. 2020:2020.04.22.20075564.
51. Garcia FP, Tanoira RP, Cabrera JPR, Serrano TA, Herruz PG, Gonzalez JC.Rapid diagnosis of SARS-CoV-2 infection by detecting IgG and IgMantibodies with an immunochromatographic device: a prospective single-center study. medRxiv. 2020:2020.04.11.20062158.
52. Chen Z, Zhang Z, Zhai X, Li Y, Lin L, Zhao H, et al. Rapid and sensitivedetection of anti-SARS-CoV-2 IgG, using lanthanide-doped nanoparticles-based lateral flow immunoassay. Anal Chem. 2020.
53. Döhla M, Boesecke C, Schulte B, Diegmann C, Sib E, Richter E, et al. Rapidpoint-of-care testing for SARS-CoV-2 in a community screening settingshows low sensitivity. Public Health. 2020;182:170–2. https://doi.org/10.1016/j.puhe.2020.04.009.
54. Burbelo PD, Riedo FX, Morishima C, Rawlings S, Smith D, Das S, et al.Detection of nucleocapsid antibody to SARS-CoV-2 is more sensitive thanantibody to Spike protein in COVID-19 patients. medRxiv. 2020:2020.04.20.20071423.
55. Jones CM, Athanasiou T. Summary receiver operating characteristic curveanalysis techniques in the evaluation of diagnostic tests. Ann Thorac Surg.2005 Jan 1;79(1):16–20. https://doi.org/10.1016/j.athoracsur.2004.09.040.
56. Deeks JJ, Dinnes J, Takwoingi Y, Davenport C, Spijker R, Taylor-Phillips S,et al. Antibody tests for identification of current and past infection withSARS-CoV-2. Cochrane Database Syst Rev. 2020;2020 Available from: https://www.cochranelibrary.com/cdsr/doi/10.1002/14651858.CD013652/full. JohnWiley and Sons Ltd. Cited 2021 Mar 19.
57. Lisboa Bastos M, Tavaziva G, Abidi SK, Campbell JR, Haraoui LP, Johnston JC,et al. Diagnostic accuracy of serological tests for covid-19: Systematic reviewand meta-analysis. BMJ. 2020;370:2516 Available from: https://connect.medrxiv.org/relate/content/181. Cited 2021 Mar 19.
58. Wang H, Ai J, Loeffelholz MJ, Tang YW, Zhang W. Meta-analysis ofdiagnostic performance of serology tests for COVID-19: impact of assaydesign and post-symptom-onset intervals. Emerg Microbes Infect. 2020;9(1):2200–11 Available from: https://www.tandfonline.com/doi/full/10.1080/22221751.2020.1826362. Cited 2021 Mar 19.
59. Zhang X, Wu X, Wang D, Lu M, Hou X, Wang H, et al. Proteome-wideanalysis of differentially-expressed SARS-CoV-2 antibodies in early COVID-19infection. medRxiv. 2020:2020.04.14.20064535 Available from: https://www.medrxiv.org/content/10.1101/2020.04.14.20064535v2?%253fcollection=.Cited 2020 May 31.
60. Kontou PI, Braliou GG, Dimou NL, Nikolopoulos G, Bagos PG. Antibody testsin detecting SARS-CoV-2 infection: a meta-analysis. medRxiv. 2020:2020.04.22.20074914 Available from: http://medrxiv.org/content/early/2020/04/25/2020.04.22.20074914.abstract. Cited 2020 May 31.
61. Freeman SC, Kerby CR, Patel A, Cooper NJ, Quinn T, Sutton AJ.Development of an interactive web-based tool to conduct and interrogatemeta-analysis of diagnostic test accuracy studies: MetaDTA. BMC Med ResMethodol. 2019;19(1).
62. Tahamtan A, Ardebili A. Real-time RT-PCR in COVID-19 detection: issuesaffecting the results. Expert Rev Mol Diagn. 2020;20:453–4 Available from:https://www.tandfonline.com/doi/abs/10.1080/14737159.2020.1757437.Taylor and Francis Ltd. Cited 2020 Nov 18.
63. Watson J, Whiting PF, Brush JE. Interpreting a covid-19 test result. BMJ.2020;369 Available from: https://calculator.testingwisely.com/playground.BMJ Publishing Group. Cited 2020 Nov 18.
64. Arevalo-Rodriguez I, Buitrago-Garcia D, Simancas-Racines D, Zambrano-Achig P, del Campo R, Ciapponi A, et al. False-negative results of initial RT-PCR assays for COVID-19: a systematic review. medRxiv. 2020:2020.04.16.20066787 Available from: https://doi.org/10.1101/2020.04.16.20066787. Cited2020 Nov 18.
65. Ecdc. A systematic literature review on the diagnostic accuracy ofserological tests for Lyme borreliosis. Available from: www.ecdc.europa.eu.Cited 2020 Nov 19
Publisher’s NoteSpringer Nature remains neutral with regard to jurisdictional claims inpublished maps and institutional affiliations.
Vengesai et al. Systematic Reviews (2021) 10:155 Page 23 of 23