a symposium on continental drift || palaeomagnetic data from the gondwanic continents
TRANSCRIPT

Palaeomagnetic Data from the Gondwanic ContinentsAuthor(s): K. M. CreerSource: Philosophical Transactions of the Royal Society of London. Series A, Mathematical andPhysical Sciences, Vol. 258, No. 1088, A Symposium on Continental Drift (Oct. 28, 1965), pp.27-40Published by: The Royal SocietyStable URL: http://www.jstor.org/stable/73330 .
Accessed: 07/05/2014 19:11
Your use of the JSTOR archive indicates your acceptance of the Terms & Conditions of Use, available at .http://www.jstor.org/page/info/about/policies/terms.jsp
.JSTOR is a not-for-profit service that helps scholars, researchers, and students discover, use, and build upon a wide range ofcontent in a trusted digital archive. We use information technology and tools to increase productivity and facilitate new formsof scholarship. For more information about JSTOR, please contact [email protected].
.
The Royal Society is collaborating with JSTOR to digitize, preserve and extend access to PhilosophicalTransactions of the Royal Society of London. Series A, Mathematical and Physical Sciences.
http://www.jstor.org
This content downloaded from 169.229.32.136 on Wed, 7 May 2014 19:11:37 PMAll use subject to JSTOR Terms and Conditions

L 27 ]
III. Palaeomagnetic data from the Gondwanic continents
BY K. M. CREER
Physics Department, University oJ Newcastle upon Tyne
The considerable palacomagnetic data from the Gondwanic continents, Africa, Antarctica, Australia, India and South America, are critically examined and shown to support the hypothesis of continental drift.
Palaeomagnetic latitudes for Australia, traced by Irving and his colleagues from the late Pre- cambrian to Recent times, indicate that Australia was near the equator in the Devonian and close to the Pole during the Permo-Carboniferous. During the Mesozoic and Tertiary it drifted north- wards to its present position. Gough and his colleagues in Southern Rhodesia have recently concluded that since the middle of the Mesozoic the palaeomagnetic latitude of Africa has remained appreciably unchanged, but they find evidence of a marked drift northwards to its present latitudes from polar latitudes during the Permian and early Mesozoic. From my own studies of South American rocks I have deduced that there has been little movement of South America relative to the pole since the Triassic-Jurassic, but that a sharp change in magnetic latitude took place during the Lower and Middle Permian. Results from Devonian and Silurian rocks indicate that in those times northeast Brazil was closer to the pole than Tierra del Fuego. The movement of South America relative to the pole during the Permian was thus a continuation of an Upper Palaeozoic polar shift.
In the Triassic-Jurassic, basaltic lavas and diabase dykes were extruded and intruded into parts of all the Gondwanic continents. Palaeomagnetic studies have been made on these rocks from all five continents. The palaeolatitudes and palaeoazimuths so deduced are consistent neither with the present positions of these continents, nor with the suggestion that they were then adjacent to one another. A possible reconstruction satisfying the restrictions imposed by the palaeomagnetic data shows these continents occupying positions between those suggested by geologists for the Permo- Carboniferous and their present positions, and it is inferred that the continents as we know them today had separated and had started moving towards their present positions when this igneous activity occurred.
For the Palaeozoic era reliable palaeomagnetic data have, as yet, been obtained only for the Devonian, Silurian and Cambrian of Australia and South America. There is one not very well established Silurian result for South Africa. The consistency of these data with reconstructions of Gondwanaland based on geology is examined. Both du Toit's and J. T. Wilson's reconstructions are considered.
1. THE PALAEOMAGNETIC METHOD
Palaeomagnetic studies of many suites of Quaternary and Tertiary Igneous rocks have indicated that secular variations of the geomagnetic field from a postulated axial and dipolar main field average zero during 'palaeomagnetic instants' of 104 to 105 y (Creer i962 a). These experimental results prove that the geomagnetic field was axial and dipolar, on the average, throughout the Tertiary and Quaternary, and as a working hypothesis the geomagnetic field is supposed to have maintained this character during Phanerozoic time. This hypothesis is fundamental to the application of rock magnetism to geology. It is reasonably well founded theoretically. A palaeomagnetic survey of a suite of rocks repre- senting at least iO4y thus provides information from which may be determined: (1) the palaeomagnetic latitude, L, of the site, and (2) the palaeomeridian direction. The former is related to the average value of the inclination of the fossil remanent magnetization to the ancient horizontal by the formula tan L -- tan l and the latter used to lie parallel to
4-2
This content downloaded from 169.229.32.136 on Wed, 7 May 2014 19:11:37 PMAll use subject to JSTOR Terms and Conditions

28 K. M. CREER
the component of the fossil remanent magnetization in the ancient horizontal plane (e.g. bedding plane). Care must, of course, be taken to ensure that the magnetic vector measured was acquired during one 'palaeomagnetic instant' of geological time, that it is not composite and that it has been stable. The position of the geographical pole correspond- ing to a particular 'palaeomagnetic instant' may be calculated using the axial dipole field hypothesis (Creer, Irving & Runcorn I957). Pole positions have usually been plotted on the present latitude-longitude grid system, and curves connecting poles corresponding to successive intervals of geological time are referred to as polar wandering curves. The supposed axial symmetry of the palaeomagnetic field prohibits the determination of the difference in palaeolongitude of any two continents at a particular geological time. However, if we have data for any two continents for a sequence of geological times, their polar wandering curves can be compared. If the continents have not moved relative to each other, their polar wandering curves will have the same shape, and by fitting them together an unambiguous reconstruction can be made, using palaeomagnetic data alone (see Creer I964a, b and Graham, Helsley & Hales I964).
2. PALAEOMAGNETIC STUDIES OF SOUTH AMERICAN ROCKS
Palaeomagnetic surveys were made in 1956, 1958 and 1963 and the results of the earlier two have been previously reported (Creer I958, i962 b, c). In the last of these publications data computed from first measurements on several rock formations were listed and it was
TABLE 1. SUMMARY OF SOUTH AMERICAN PALAEOMAGNETIC DATA
palaeo- direction of latitude
locality magnetization number of of pole position sites* or Brasilia ---
ref. rock unit lat. long. D I a samples L no. and age (0 S) (0 W) (0) (0) (0) N (0 S) lat. long. (0) polarity treatment 1 Cambrian red beds 23 66 24 +18 47 17 - - - R natural
17 +56 14 44 270 N 500 W 10 R thermal 2 Urucum formation 19 58 60 + 39 19 23 - - - R natural
(Silurian) 37 +41 9 31 340 N 160 W 9 R thermal 3 Devonian red beds 23 66 27 +47 18 22 - - - R natural
56 +51 8 10 52 90 N 220 W 10 R thermal 4 Taiguati formation 17 65 294 - 72-5 5 38 75 280 S 340 W 9 N & R thermal
(Pennsylvanian) 5 Piaui formation 5 43 143 + 60 8 42 - - R natural
(Pennsylvanian) 165 +44 9 20 34 650 S 130 W 10 R thermal 6 Permian red beds 30 68 160 +66 4 53 35 650 S 130 W 6 R thermal 7 SerraGeral (I40My) 22 46 347 -38 5 30* 10 780 S 540 E 4 N & R a.c.
32 56 8 Kimeridgian red 38 71 4 -57 23 7 16 860 S 1720 E 25 N natural
beds 9 Quaternary basalts 39 71 1 -61 5 58 16 830 S 1260 E 6, 7 N & R a.c.
pointed out that many of these had been remagnetized by the recent palaeomagnetic field. Since then thermal and a.c. field experiments have been carried out on some of these rocks and the secondary magnetization has been destroyed. The data so obtained are contained in table 1, and for certain formations the changes produced by thermal de- magnetization are indicated. Data from Peru, reported in Creer (I962c) are now not thought to represent the palaeomagnetic field because it has not yet been possible to correct for the complex geological structure, and so they are not included here.
The changes in palaeolatitude and orientation of South America deduced from these results are illustrated in figure 1. This was constructed by drawing an outline of the
This content downloaded from 169.229.32.136 on Wed, 7 May 2014 19:11:37 PMAll use subject to JSTOR Terms and Conditions

SYMPOSIUM ON CONTINENTAL DRIFT 29
nia
FIGURE 1. Palaeolatitudes and orientations of FIGURE 2. Movement of South Pole relative to South America deduced from the magnetism South America deduced from magnetism of of rocks. South American rocks.
20* (a) (c) 230
10 *5~~~~~~~~~~~~~~~~~~~2 ? 6 2 N 30'
0 203 200 60 200* 5 ~~~~ ~~~~~~~~~~~~~~~~~~19 13
* 1~~~~~~~~~~~~~~~~~- 8 14. 10 02 27
@15 9
-or 0 X og ~~~~~~~~~~~~~~~~~~~~~~1 7. 1 1-
6OC - \ __ _ _ _O__ ._ 8 (e)
~_ 30 - _ __ . C
0 200 400 600 0 200 400 600
age (My)
FIGURE 3. Palaeolatitudes of (a) Bombay, (b) Salisbury, (c) the present South Pole, (d) Canberra, and (e) Brasilia. See text for explanation.
This content downloaded from 169.229.32.136 on Wed, 7 May 2014 19:11:37 PMAll use subject to JSTOR Terms and Conditions

30 K. M. CREER
contirnent on a transparent fibreglass hemispherical shell and placing it in the positions indicated by tlle palaeomagnetic results on a 50 cm globe marked with a latitude-longitude grid system. It is seen that a sequence of longitudes can be chosen such that the palaeo- magnetic results can be explained by a movement of South America across the South Pole.
TABLE 2. SUMMARY OF AFRICAN PALAEOMAGNETIC DATA
direction of locality magnetization pole position
-m - , m palaeolatitude -- lat. long. D I oc of Salisbury lat. oc
no. formation ( S) (0 E) (0) (0) (0) L (0 S) long. (0) ref. 1 Silurian red beds 33 28 342 -3 5 6 100 N 50 110 W 4 a 2 Dwyka varved clays 18 29 360 -81 6 b
(U. Carboniferous) 333 +76 7 (310 +86) - 710 S 17 230 E - mean
3 Ecca red beds (L. Permian) 10 29 141 +65 11 550 S 38 650 E 16 c 4 Shawa Ijolite (209 My) 19 31 5 335 -52 11 310 S 64 850 E 14 d 5 Triassic red beds 16 28 350 -56 5 370 S 68 50? E 6 e 6 Karroo and Stormberg lavas 26-32 339 --55 6 240 S 67 980 E 4 f
(140-190 My) 26-30 7 Lupata volcanics (109 My) 16 34 336 -54 2 340 S 62 790 E 4 g 8 Miocenevolcanics 1 37 8 -5 10 20?S 82 430W 5, 10 h 9 Plio-Pleistocene 1-9 34-37 - 190 S 76 400 W 8 h
References: (a) Graham & Hales (I96I); (b) Irving (I960); (c) Opdyke (i964a); (d) Gough & Brock (I964); (e) Opdyke (i964b); (f) van Zijl, Graham & Hales (I96Z); (g) Gough & Opdyke (I963); (h) Nairn (I964).
TABLE 3. SUMMARY OF AUSTRALIAN PALAEOMAGNETIC DATA
direction of palaeo- locality magnetization latitude of pole position
-- -~ - n -' Canberra r lat. long. D I a L lat. long. a
no. formation (? 8) (? E) (0) (0) (0) (0) (0 S) (0) ref. 1 Antrim Plateau basalts (L. Cambrian) 16 128 53 - 2 12 5 36 260 E 6, 12 a 2 Elder Mt. sandstone (M. Cambrian) 16 128 231 -15 10 2 34 16? E 5, 10 a 3 Mugga porphyry (Silurian) 35 149 26 -30 22 16 60 230 E 14, 24 a 4 Ainslie volcanics (Silurian- 35 149 17 -30 12 16 66 120 E 7, 13 a
Devonian) S Igneous rocks (A.C.T.) (Silurian- 35 149 12 -37 6 21 71 80 E 14, 24 b
Devonian) 6 Murrumbidgee series (M. Devonian) 35 149 40 -29 10 15 58 290 E 5, 11 b 7 Nethercote basalts (U. Devonian) 37 150 5 -23 29 12 65 200 W 8, 15 b 8 Kuttung varvoids 33 151 270 -84 6 78 32 1650 E 12 a 9 Kuttung lavas (U. Carboniferous) 33 151 5 -85 8 80 43 150' E 16 a
10 L. Marine latites (L. Permian) 32 151 230 + 76 2 63 46 1220 E 5 c 11 U. Marine latites (U. Permian) 32 151 232 +81 6 64 44 1320 E 12 c 12 Chocolate shales (L. Triassic) 34 151 338 -82 7 73 49 160? E 14 d 13 Brisbane tuff (M. Triassic) 28 150 11 - 74 6 69 57 143' E 11 e 14 Gingenbullen dolerite (Triassic- 34 150 190 + 80 8 71 53 1440 E 15 f
Jurassic) 15 Gibraltar syenite (L-M. Jurassic) 34 151 27 -86 12 83 41 146f E 24 f 16 Prospect dolerite (168 My) 34 151 359 -81 7 73 51 1510 E 13 f 17 Tasmanian dolerites (170 My) 42 146 318 -84 3 73 51 1600 E 6 d 18 Cygnet complex (102 My) 43 147 314 -85 5 73 50 158? E 10 e 19 Mt. Dromedary complex (93 My) 36 151 19 -79 5 69 56 138? E 9 e 20 Older volcanics 38 145 17 -73 7 61 67 1370 E 11, 12 a 21 Basalts of N.S.W. 42 147 190 + 70 14 54 63 1370 E 20 g 22 Tasmanian basalt (Tertiary) -- - 12 -72 17 54 73 125a E 25, 29 h 23 Newer volcanics 38 143 3 -60 5 37 86 1020 E 6, 7 a
Rqferences: (a) Irving (I960); (b) Irving (I96I); (c) Irving & Parry (I963); (d) Irving (I963); (e) Robertson (I963); (f) Irving (I962b); (g) Irving (I962a); (h) Irving & Stott (I963).
This movement appears to have occurred during the Upper Palaeozoic. Not all the data contained in table 1 have been used in figure 1, because the outlines would have overlapped too much. However all the data are consistent with the movement illustrated. This can be seen in figure 3 (e) where the change in palaeolatitude of Brasilia with geological time is illustrated. Palaeolatitude is plotted along the ordinate in such a way that the single trend of movement indicated in figure 1 is revealed. Going back in time, the palaeolatitude
This content downloaded from 169.229.32.136 on Wed, 7 May 2014 19:11:37 PMAll use subject to JSTOR Terms and Conditions
SYMPOSIUM ON CONTINENTAL DRIFT 31
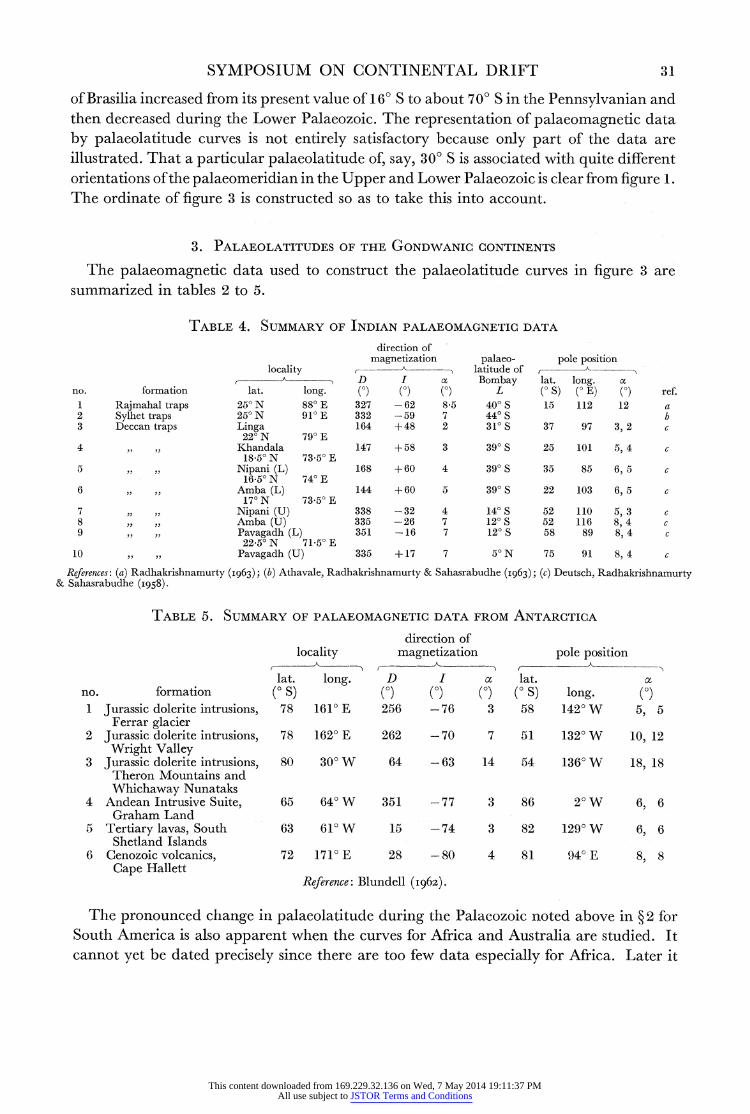
of Brasilia increased from its present value of 160 S to about 70? S in the Pennsylvanian and then decreased during the Lower Palaeozoic. The representation of palaeomagnetic data by palaeolatitude curves is not entirely satisfactory because only part of the data are illustrated. That a particular palaeolatitude of, say, 300 S is associated with quite different orientations of the palaeomeridian in the Upper and Lower Palaeozoic is clear from figure 1. The ordinate of figure 3 is constructed so as to take this into account.
3. PALAEOLATITUDES OF THE GONDWANIC CONTINENTS
The palaeomagnetic data used to construct the palaeolatitude curves in figure 3 are summarized in tables 2 to 5.
TABLE 4. SUMMARY OF INDIAN PALAEOMAGNETIC DATA
direction of magnetization palaeo- pole position
locality , - A latitude of - D I C Bombay lat. long. C
no. formation lat. long. (0) (0) (0) L (0 S) (0 E) (0) ref. 1 Rajmahal traps 250 N 88? E 327 -62 8-5 400 S 15 112 12 a 2 Sylhet traps 250 N 910 E 332 --59 7 440 S b 3 Deccan traps Linga 164 +48 2 310 S 37 97 3, 2 c
220 N 790 E 4 ,, Khandala 147 +58 3 390 S 25 101 5,4 c
18-50 N 73.50 E 5 ,, ,, Nipani (L) 168 +60 4 390 S 35 85 6,5 c
16-50 N 740 E 6 ,, ,, Amba (L) 144 +60 5 390 S 22 103 6,5 c
170 N 73.50 E 7 ,, ,, Nipani (U) 338 -32 4 140 S 52 110 5,3 c 8 ,, ,, Amba (U) 335 -26 7 120 S 52 116 8,4 c 9 ,, ,, Pavagadh (L) 351 -16 7 120 S 58 89 8,4 c
22 50 N 71-50 E 10 ,, ,, Pavagadh (U) 335 +17 7 50N 75 91 8,4 c
References: (a) Radhakrishnamurty (I963); (b) Athavale, Radhakrishnamurty & Sahasrabudhe (I963); (c) Deutsch, Radhakrishnamurty & Sahasrabudhe (I958).
TABLE 5. SUMMARY OF PALAEOMAGNETIC DATA FROM ANTARCTICA
direction of locality magnetization pole position
lat. long. D I ac lat. no. formation (0 S) (0) (0) (0) (? S) long. (0)
1 Jurassic dolerite intrusions, 78 1610 E 256 -76 3 58 1420 W 5, 5 Ferrar glacier
2 Jurassic dolerite intrusions, 78 1620 E 262 -70 7 51 1320 W 10, 12 Wright Valley
3 Jurassic dolerite intrusions, 80 300 W 64 -63 14 54 1360 W 18, 18 Theron Mountains and Whichaway Nunataks
4 Andean Intrusive Suite, 65 640 W 351 -77 3 86 20 W 6, 6 Graham Land
5 Tertiary lavas, South 63 610 W 15 -74 3 82 1290 W 6, 6 Shetland Islands
6 Cenozoic volcanics, 72 1710 E 28 -80 4 81 940 E 8, 8 Cape Hallett
Reference: Blundell (i962).
The pronounced change inl palaeolatitude during the Palaeozoic noted above in ? 2 for South America is also apparent when the curves for Africa and Australia are studied. It cannot yet be dated precisely since there are too few data especially for Africa. Later it
This content downloaded from 169.229.32.136 on Wed, 7 May 2014 19:11:37 PMAll use subject to JSTOR Terms and Conditions

32 K. M. CREER
should be possible to establish whether it occurred at exactly the same time in all three continents. There are no data for Antarctica and India for the Palaeozoic era.
A second pronounced change in palaeolatitude in the Tertiary and Quaternary is exhibited by the curve for Australia. This is also strongly shown by the curves for India and Antarctica. A smaller change occurs in the African curve for these times, while no such change is apparent in the South American curve.
The idea that the second feature might be associated with the drifting apart of these continents following the disintegration of Gondwanaland into separate parts and that the Palaeozoic feature might be associated with wandering of the pole across Gondwanaland is developed in the following paragraphs.
4. COMPARISON OF THE SOUTH AMERICAN AND AFRICAN POLAR WANDERING CURVES
The former is illustrated in figure 2 and the latter in figure 4. The shape and length of the Palaeozoic parts of these two curves are similar and this suggests that there was then no relative movement between the two continents. When the latter are fitted together so
FIGURE 4. Movement of South Pole relative to FIGURE 5. The polar wandering curves relative Africa deduced from magnetism of African to South America and Africa superimposed rocks. when the two continents are placed adjacent
to one another.
that their matching coastlines are adjacent, as in most palaeogeographical reconstructions, the two polar wandering curves coincide. This is illustrated in figure 5 which was drawn with the aid of the transparent hemispherical shells and the 50 cm globe.
Conversely, by matching the polar wandering curves, the relative positions of these two continents could have been deduced. When more palaeomagnetic work has been done it should be possible to use this method to make reconstructions of the positions of continents for intervals of geological time when large polar wandering but no relative continental movement occurred. One important source of error is that the magnetic age of sedi- mentary rocks may differ from their true age, so that there may be some doubt concerning
This content downloaded from 169.229.32.136 on Wed, 7 May 2014 19:11:37 PMAll use subject to JSTOR Terms and Conditions

SYMPOSIUM ON CONTINENTAL DRIFT 33
correlation of palaeomagnetic poles from different continents. Thus, poles 4 and 5 for South America were derived from red beds of Pennsylvanian age. The magnetization from which pole 5 was derived must, however, date from the Permian since it agrees with pole 6 which is derived from Permian rocks (see table 1) and also with pole 3 for Africa which was computed from the magnetization of red beds from Tanganyika of Lower Permian age (see table 2). In spite of these difficulties a purely palaeomagnetic recon- struction would be very similar to that obtained by matching the coastlines or continental shelves, possibly because the polar movement was large and fairly rapid and because both curves have a 'knee', so that they can be more easily matched.
The two polar wandering curves diverge in the Mesozoic indicating that during this era Africa and South America were drifting apart. The poles corresponding to the Stormberg lavas and the Serra Geral formation of Triassic-Jurassic age are about 20? apart whereas the present poles relative to the adjacent Palaeozoic positions of these continents are 35 to 400 apart. Thus if these lavas are of the same age, Africa and South America cannot have been adjacent to one another when they were erupted. Separation appears to have begun during the Permian. The relative positions of the continents when the Mesozoic basalts and dolerites were erupted is discussed in ? 7.
5. COMPARISON OF SOUTH AMERICAN AND AUSTRALIAN PALAEOMAGNETIC DATA
WITH PALAEOGEOGRAPHIC RECONSTRUCTIONS OF GONDWANALAND
The first comparison is made for the Devonian period. The reconstructions of (i) du Toit (I937) and (ii) Wilson (I963) were carefully drawn on transparent hemispherical shells. The former was placed on the 50 cm globe in the position indicated by the Devonian palaeomagnetic data for South America, i.e. the site in the province of Salta, Argentina, was placed at the appropriate palaeolatitude and with the palaeomeridian along a longitude line on the globe, as shown in figure 6 (a). The position of the shell corresponding to Wilson's reconstruction is shown in figure 6 (b). The data can be compared in two ways.
For each reconstruction, the latitude and longitude of the site in Australia where Devonian rocks were collected (the Ainslie volcanics and the Elder Mountain sandstone) were noted and the pole positions on the illustrated latitude-longitude grid were calculated from the Australian palaeomagnetic data. If the South American and Australian rocks are of the same magnetic age and for the correct reconstruction, the poles derived from the latter rocks should not differ significantly from the pole of the projection in figure 6. For both du Toit's and Wilson's reconstructions, the difference is significant, the 9500
errors of each Australian pole and that of the projection being about 150. To inquire in another way how closely the palaeomagnetic data agree with the palaeo-
graphic reconstructions, Australia has been drawn in figure 6 at the palaeolatitude and with the orientation deduced from the palaeomagnetism of the Ainslie volcanic series, the longitude having been chosen so as to bring this position of Australia as close as possible to that -given by the palaeogeographic reconstruction positioned on the grid in accordance with the South American palaeomagnetic data.
In figure 6 (b) the Australian Devonian poles computed from Wilson's reconstruction are about 60? from the South American pole, the pole of the projection. By comparing the two outlines of Australia, it is seen that the discrepancy in the positions of the poles is mainly
5 VOL. 25S8. A.
This content downloaded from 169.229.32.136 on Wed, 7 May 2014 19:11:37 PMAll use subject to JSTOR Terms and Conditions

34 K. M. CREER
due to rotation. The palaeolatitudes deduced from the Australian palaeomagnetic data differ by about 200 from those obtained by combining Wilson's reconstruction with the South American palaeomagnetic data. Local tectonic movement at one of the sites could possibly account for tlle discrepancy in pole position. On the other hand, the Australian poles computed from du Toit's reconstruction are closer to the South American poles (figure 6 (a)) the angular separation being about 40' than are those computed from Wilson's. Here the disagreement is mainly due to a difference in palaeolatitude. However, the main difficulty in deciding which reconstruction agrees better with the palaeo- magnetic data is that of correlation of geological and magnetic age.
FIGURE 6. South American and Australian palaeomagnetic data for the Devonian compared with the palaeogeographic reconstructions of (a) du Toit and (b) Wilson. The pole of the grid is the Devonian palaeomagnetic pole for South America. The Devonian palaeomagnetic poles for Australia are marked x and would not differ significantly from the pole of the grid if the reconstructions were in agreement with the palaeomagnetic data. The 95 00 circles of confidence have radii of approximately 15 to 20?. The unshaded outline of Australia illustrates a possible position deduced from the Australian palaeomagnetic results and should be compared with the other position deduced by combining the South American palaeomagnetic results, with palaeogeography.
A similar comparison for the Cambrian is illustrated in figure 7. The palaeomagnetic data are here seen to agree better with Wilson's reconstruction than with du Toit's, but this conclusion must be viewed with caution because it is by no means certain that the rocks are of the same magnetic age.
The inconsistencies revealed may in future be resolved when more precise and well dated palaeomagnetic data are obtained, and it may be possible to show whether either or neither of the reconstructions is to be preferred. At present, however, there is no doubt that the palaeomagnletic data agree much better with these palaeogeographic recon- structions thanl with the present positions of these continents.
Both of the palaeogeographic reconstructions of Gondwanaland considered above separate South America from Australia by a greater distance than is required by either
This content downloaded from 169.229.32.136 on Wed, 7 May 2014 19:11:37 PMAll use subject to JSTOR Terms and Conditions

SYMPOSIUM ON CONTINENTAL DRIFT 35
FIGURE 7. South American and Australian palaeomagnetic data for the Cambrian compared with the palaeogeographic reconstructions of (a) du Toit and (b) Wilson. The pole of the grid is the Cambrian palaeomagnetic pole for South America. The Cambrian palaeomagnetic poles for Australia are marked x and would not differ significantly from the pole of the grid if the reconstructions were in agreement with the palaeomagnetic data. The 9500 circles of confidence have radii of approximately 15 to 200. The unshaded outline of Australia illustrates a possible position deduced from the Australian palaeomagnetic results and should be compared with the other position deduced by combining the South American palaeomagnetic results, with palaeogeography.
FIGURE 8. Movement of South Pole relative to FIGURE 9. The relative positions of South Australia. America, Africa and Australia for the Palaeo-
zoic obtained by bringing their polar wan- dering curves together.
5-2
This content downloaded from 169.229.32.136 on Wed, 7 May 2014 19:11:37 PMAll use subject to JSTOR Terms and Conditions

36 K. M. CREER
the Devonian or the Cambrian palaeomagnetic data. In this connexion it is interesting to note that the polar wandering curve for Australia, illustrated in figure 8, has a similar shape to those for Africa and South America. When the three curves for the Palaeozoic are superimposed, the three continents occupy the relative positions shown in figure 9 in which the Cambrian and Devonian Australian poles were used to fix the straight portion of the Australian curve to thle South American-African curve. There may be something wrong with this reconstruction, however, because the Australian Pennsylvanian pole 8 lies closer to the South American and African Permian poles 6 and 3 than to their Pennsyl- vanian poles. Possible reasons for this have been considered by Creer (i964a) since the presentation of this paper. The three polar wandering curves diverge in the Mesozoic and Tertiary as illustrated in figure 10.
FIGURE 10. To illustrate the divergence of the FIGURE 11. The extent of the Permo-Carboni- polar wandering curves for the Mesozoic. The ferous glaciation (after du Toit). The probable relative positions of the three continents is position of the coastline of Gondwanaland is that deduced for the Palaeozoic. indicated thus ---, and the maximum exten-
sion of the ice-sheet
6. PALAEOMAGNETISM AND THE PERMO-CARBONIFEROUS GLACIATION
One of the strongest arguments in favour of the theory of continental drift is that it becomes easier to understand the Permo-Carboniferous glaciations of the continents of the southern hemisphere and of India if they were then grouped together and formed one single supercontinent, Gondwanaland.
The palaeomagnetic evidence (? 3 and figure 9) suggests that, during the Upper Palaeozoic, the pole drifted across Gondwanaland from North Africa to Tasmania. The area glaciated is shown in figure 11. Permo-Carboniferous glacial beds are not usually very rich in magnetic minerals and have been found to be non-magnletic as a rule particularly those in South Brazil. However, the Kuttung varvoids from Australia and the Dwyka tillites from Africa possess measurable remanent magnetization. In both cases the palacomagnetic latitude is extremely steep (see figures 12 (a) and 12 (b)), and this suggests that the centre
This content downloaded from 169.229.32.136 on Wed, 7 May 2014 19:11:37 PMAll use subject to JSTOR Terms and Conditions

SYMPOSIUM ON CONTINENTAL DRIFT 37
of glaciation followed the pole. Thus random polar shifts of the order of 300 must have been necessary to account for the successive glaciations in the different parts of Gondwanaland, supposing the du Toit or Wilson reconstructions to be correct. These polar shifts must have been superimposed on the gradual drift of the pole across Gondwanaland. There is some geological support for this general pattern of events because there are indications (see, for example, the U.S.G.S. Handbook of South American geology, David's Geology of the Common- wealth of Australia, Furon's Geology of Africa) that the glaciations started earliest in South America (in the Mississippian) while they persisted latest in Australia (until the Upper Permian).
FIGURE 12. Gondwanaland, as reconstructed by Wilson, drawn on a latitude-longitude grid based on the magnetism of (a) the Dwyka tillites of Africa and (b) the Kuttung varvoids of Australia.
The reconstruction implied by the palaeomagnetic data (figure 9) renders the postula- tion of such large random polar shifts unnecessary, for it brings Australia much closer to Africa and South America, and the glaciated area would have been correspondingly smaller.
It will be interesting to see whether additional palaeomagnetic data agree with the reconstruction in figure 9, or whetlher errors in the present palaeomagnetic data account for the discrepancy with the palaeogeographic reconstructions.
7. PALAEOMAGNETIC DATA FROM THE MESOZOIC DOLERITES
These are summarized in table 6 in which palaeolatitudes and the rotations of the meridian are also listed. In figure 13 it is shown that these data are consistent with the suggestion that Gondwanaland was breaking up when these lavas and dykes were formed.
Of all the Gondwanic continents, South America seems to have moved least relative to the pole since the early Mesozoic. On the basis of Wilson's reconstruction, Gondwanaland is illustrated in a position corresponding to the palaeomagnetic data from the Serra Geral formation from southeast Brazil and Uruguay in figure 13 (a). In figure 13 (b) the Gondwanic continents have palaeolatitudes and orientations as listed in table 6. It is seen
This content downloaded from 169.229.32.136 on Wed, 7 May 2014 19:11:37 PMAll use subject to JSTOR Terms and Conditions

38 K. M. CREER
ON - 4
N __22
r +1 +1 +1 +1 + e I S t_ X o M
Cf
Q0 ~ ~ ~ 1-t ~ ~ ~ ~ ~ ~ t
> ~ z . g o " co 4
y I_
4 Q r t
4 *J 03 I 0 0 0 X
0 U U 9 % ~~~~~+1 +1 -tl
+1 +1 ?1
cr
~~~~~~ ~~~ ~ D
:G C/2 Pl t) s s ~Cs ci cn ?o
U < t N < > < % ? e U m t m *Ct cr
H _ 1~~~~~~~~~~~~~~-. ~ ~ ~ ~ ~ ~ ~~f
This content downloaded from 169.229.32.136 on Wed, 7 May 2014 19:11:37 PMAll use subject to JSTOR Terms and Conditions

SYMPOSIUM ON CONTINENTAL DRIFT 39
that longitudes can be chosen consistent with the suggestion that these continents were drifting apart. According to this picture, India and Australia had farthest to drift and this suggestion is reinforced by the palaeomagnetic data from these two continents, their palaeolatitude curves in figure 2 showing the greatest changes.
(a) (b)
FIGURE 13. The Palaeolatitudes and orientations deduced from the magnetism of the Mesozoic dolerites can be interpreted by supposing that Gondwanaland was breaking up when these rocks cooled. In (a) Gondwanaland (after Wilson) is positioned using the South American data from the Serra Geral formation. In (b) positions consistent with the palaeomagnetic results lie between those of (a) and the present positions marked*.
8. CONCLUSIONS
The palaeomagnetic data available at present lead me tentatively to draw the following conclusions:
(i) Gonwanaland, in one form or another existed during the Palaeozoic era. (ii) During the Palaeozoic, the South Pole wandered across Gondwanaland from North
Africa to South Australia. (iii) There are significant differences between the palaeomagnetic data from the
Cambrian and Devonian from Australia and South America and the reconstructions of du Toit and Wilson. These may be resolved when the magnetic ages of rocks can be correlated better.
(iv) Gondwanaland started to break up in the Permo-Triassic. (v) During the Mesozoic, Australia and India drifted further relative to the pole than
Africa. The position of South America relative to the pole has not changed appreciably since the early Mesozoic.
REFERENCES (Creer)
Athavale, R. N., Radhakrishnamurty, C. & Sahasrabudhe, P. W. i963 Palaeomagnetism of some Indian rocks. Geophys. J. 7, 304-313.
Blundell, D. J. i962 Palaeomagnetic investigations in the Falkland Is. Dependencies. Brit. Antarctic Surv., Sci. Rek. no. 39.
This content downloaded from 169.229.32.136 on Wed, 7 May 2014 19:11:37 PMAll use subject to JSTOR Terms and Conditions

40 K. M. CREER
Creer, K. M. I958 Preliminary palaeomagnetic results from South America. Annis Gdophys. 14, 492-501.
Creer, K. M. I962a The dispersion of the geomagnetic field due to secular variation and its determi- nation for remote times from palaeomagnetic data. J. Geophys. Res. 67, 3461-3476.
Creer, K. M. I962b The palaeomagnetism of the Serra Geral formation. Geophys. J. 7, 1-22. Creer, K. M. I962c Palaeomagnetic data from South America. J. Geomag. & Geoelect. 13, 154-165. Creer, K. M. I964a A reconstruction of the continents for the Upper Palaeozoic based on palaeo-
magnetic data. Nature, Lond., 203, 1115-1120. Creer, K. M. I964 b Palaeomagnetic data and du Toit's reconstruction of Gondwanaland. Nature,
Lond., 204, 369-370. Creer, K. M., Irving, E. & Runcorn, S. K. I957 Geophysical interpretation of palaeomagnetic
directions from Great Britain. Phil. Trans. A 250, 144-156. David, Sir T. W. E. 1950 The geology of the Commonwealth of Australia. London: Arnold. Deutsch, E. R., Radhakrishnamurty, C. & Sahasrabudhe, P. W. 1958 The remanent magnetism of
some lavas in the Deccan traps. Phil. mag. 3, 170-184. du Toit, A. L. I937 Our wandering continents. Edinburgh and London: Oliver and Boyd. Furon, R. I963 The geology of Africa. Edinburgh and London: Oliver and Boyd. Gough, D. I. & Brock, A. I964 The palaeomagnetism of the Shawa Ijolite. J. Geophys. Res. 69, 2489-
2493. Gough, D. I. & Opdyke, N. D. I963 The palaeomagnetism of the Lupata alkaline volcanics.
Geophys. J. 7, 457-468. Graham, K. W. T. & Hales, A. L. I96I Preliminary palaeomagnetic measurements on Silurian
sediments from South Africa. Geophys. J. 5, 318-325. Graham, K. W. T., Helsley, C. E. & Hales, A. L. I964 Determination of the relative positions of
continents from palaeomagnetic data. J. Geophys. Res. 69, 3895-3900. Irving, E. I960 Palaeomagnetic pole positions. Part I. Geophys. J. 3, 96. Irving, E. I96I Palaeomagnetic directions and pole positions. Part III. Geophys. J. 5, 70. Irving, E. i962a Palaeomagnetic directions and pole positions. Part IV. Geophys. J. 6, 263. Irving, E. i962b Palaeomagnetic directions and pole positions. Part V. Geophys. J. 7, 263. Irving, E. I963 Palaeomagnetism of the Narrabeen Chocolate Shales and the Tasmanian Dolerite.
J. Geophys. Res. 68, 2283-2287. Irving, E. & Parry, L. G. I963 The magnetism of some Permian rocks from New South Wales.
Geophys. J. 7, 395-411. Irving, E. & Stott, P. M. I963 Palaeomagnetic directions and pole positions. Part VI. Geophys. J.
8, 249.
Jenks, W. F. (ed.) 1956 Handbook of South American geology, G.S.A. Memoir 65, New York. Nairn, A. E. M. I964 Palaeomagnetic measurements on Karroo and Post-Karroo rocks: a second progress
report. Overseas Geol. Min. Resources 9, 302-320. Opdyke, N. D. i964a The palaeomagnetism of the Permian Red Beds of S.W. Tanganyika.
J. Geophys. Res. 69, 2477-2487. Opdyke, N. D. i964b The palaeomagnetism of some Triassic red beds from Northern Rhodesia.
J. Geophys. Res. 69, 2495-2497. Radhakrishnamurty, C. I963 Remanent magnetism of the igneous rocks in- the Gondwana forma-
tion of India. D.Sc. Thesis, Andra University, India. Robertson, W. A. I963 Palaeomagnetism of some Mesozoic intrusives and tuffs from Eastern
Australia. J. Geophys. Res. 68, 2299-2312. Wilson, J. T. I963 Hypothesis of the Earth's behaviour. Nature, Lond., 198, 925-929. Van Zijl, J. S. V., Graham, K. W. T. & Hales, A. L. I962 The palaeomagnetism of the Stormberg
lavas. II. Geohihus. J. 7- 169-182.
This content downloaded from 169.229.32.136 on Wed, 7 May 2014 19:11:37 PMAll use subject to JSTOR Terms and Conditions