a survey of the attitudes and safety behaviour among ...€¦ · a survey of the attitudes and...
TRANSCRIPT

A Survey of the Attitudes and Safety Behaviour
Among Recreational Vessel Owners in Western
Australia
RR 179
INJURY RESEARCH CENTRE
School of Population Health
The University of Western Australia
35 Stirling Highway
Crawley WA 6009
Terri J Pikora April 2006

ii
INJURY RESEARCH CENTRE DOCUMENT RETRIEVAL INFORMATION
___________________________________________________________________________ Report No. Project No. Date Pages ISBN
RR 179 05-06 April 2006 38 1 876999 93 4 _________________________________________________________________________________________________________________
Title A survey of the attitudes and safety behaviour among recreational vessel owners in Western Australia _________________________________________________________________________________________________________________
Author Pikora TJ _________________________________________________________________________________________________________________
Performing Organisation Injury Research Centre School of Population Health The University of Western Australia 35 Stirling Highway CRAWLEY WA 6009 Tel: (08) 6488 1302 Fax: (08) 6488 1199 _________________________________________________________________________________________________________________
Sponsor Marine Safety Directorate Department for Planning and Infrastructure, Western Australia 1 Essex Street FREMANTLE WA 6160 _________________________________________________________________________________________________________________
Abstract The objective of this study was to determine if attitudes towards safety and safe boater behaviour among recreational boat owners had changed since a similar survey conducted in 2003. It also provided baseline information that will allow the monitoring of safety issues and behaviours for future boater surveys. The telephone survey involved 500 recreational boaters throughout Western Australia. A response rate of 46.6% was achieved. The majority of the recreational boaters surveyed were male, aged 45 years or older and had been boating in the previous 12 months. Safety was an important issue for the majority of boaters, both when asked about overall boating issues and safety issues. Key marine safety issues considered requiring more focus or effort involved boating safety education, the control of boaters under the influence of alcohol or drugs and the control of reckless operation. Few reported that they had an alcoholic drink while on their most recent trip. It was suggested that boaters or skippers themselves were responsible for ensuring safe boater behaviour. The majority reported that they did not log on or tell someone where they were going when going boating, while less than one-quarter reported checking the weather prior to going out boating and among those that did, almost one-half accessed the internet for this information. Few boaters reported checking fuel supplies or conducting a general boat and equipment check prior to using their boat. There was a high level of support for the introduction of the RST. The majority of boating-related injuries were reported as minor, requiring only minor first aid or no treatment. Many of the findings in this survey were similar with those reported in the 2003 survey. It is important to continue to measure and monitor changes in recreational boaters’ attitude and knowledge toward boating safety issues and standards. It is recommended that a focus for education among recreational boaters be in three main areas: checking updated weather forecasts; checking fuel and other general boat and equipment; and logging on. It is important that education strategies be developed to raise awareness of the importance of accessing regularly updated weather forecasts and to increase the number of recreational boaters who do so. It is also essential to remind boaters of the importance of checking the fuel supply as well as conducting a general boat and equipment check. As few recreational boaters are logging on or telling someone where they are going this remains an issue that requires encouragement and reinforcing among this group. _________________________________________________________________________________________________________________
Keywords Marine Safety, Boats and Boating, Attitudes, Behaviour, Recreational Boaters _________________________________________________________________________________________________________________

iii
TABLE OF CONTENTS
LIST OF TABLES ................................................................................................................... iv
LIST OF FIGURES................................................................................................................... iv
EXECUTIVE SUMMARY........................................................................................................ v
ABBREVIATIONS AND GLOSSARY.................................................................................. vii
ACKNOWLEDGEMENTS .................................................................................................... viii
1 INTRODUCTION.................................................................................................................. 1
2 METHODS............................................................................................................................. 2 2.1 Sampling frame................................................................................................................ 2 2.2 Response rate ................................................................................................................... 2 2.3 Survey instrument ............................................................................................................ 3
3 RESULTS............................................................................................................................... 5 3.1 Demographic information................................................................................................ 5 3.2 Recreational boating characteristics ................................................................................ 5 3.3 Recreational boating safety.............................................................................................. 8 3.4 Recreational boating safety behaviours ......................................................................... 10 3.5 Recreational boating safety equipment.......................................................................... 12 3.6 Recreational boating emergency equipment.................................................................. 14 3.7 Recreational boating education...................................................................................... 16
3.7.1 Recreational Skippers Ticket................................................................................ 16 3.8 Recreational boating injuries, incidents and near misses .............................................. 18
4 DISCUSSION ...................................................................................................................... 20 4.1 Findings ......................................................................................................................... 20 4.2 Limitations ..................................................................................................................... 22 4.3 Recommendations.......................................................................................................... 22 REFERENCES..................................................................................................................... 23
APPENDIX 1 .......................................................................................................................... A1

iv
LIST OF TABLES
Table 2.1 Characteristics of the vessels included in the sample quota............................... 2
Table 2.2 Items included in the 2006 questionnaire........................................................... 4
Table 3.1 Demographic characteristics of the sample ........................................................ 5
Table 3.2 Boating characteristics........................................................................................ 6
Table 3.3 Boating experience ............................................................................................. 7
Table 3.4 Which marine safety issues require more effort/focus .......................................9
Table 3.5 Who has authority and is responsible for ensuring safe boater behaviour ......... 9
Table 3.6 Sources of boating safety information.............................................................. 10
Table 3.7 What do you do when preparing to go boating - prompted.............................. 11
Table 3.8 Sources of weather information........................................................................ 11
Table 3.9 Recreational Skippers Ticket............................................................................ 17
Table 3.10 Recreational boating injuries ............................................................................ 18
Table 3.11 Recreational boating incidents or near misses.................................................. 19
LIST OF FIGURES
Figure 3.1 Months when respondents go boating: comparison between 2006 and 2003 survey.................................................................................................................. 7
Figure 3.2 Recreational boating issues and boating safety issues - unprompted responses ……………………………………………………………………………….. .8
Figure 3.3 Types of boating safety equipment carried on board by area go boating most often – unprompted responses ..........................................................................12
Figure 3.4 Types of boating safety equipment carried on board by area go boating most often – prompted responses .............................................................................. 13
Figure 3.5 Types of boating emergency equipment carried on board by area go boating most often – unprompted responses ................................................................. 14
Figure 3.6 Types of boating emergency equipment carried on board by area go boating most often – prompted responses ..................................................................... 15

v
EXECUTIVE SUMMARY
Objective
The objective of this study was to monitor whether safe boater behaviour and attitudes
towards safety among recreational boat owners had changed since a similar survey conducted
in 2003. In addition, this study provided baseline information that will allow the monitoring
of safety issues and behaviours for future boater surveys.
Methods
The telephone survey involved 500 recreational boaters throughout Western Australia. A
response rate of 46.6% was achieved. The majority of items included in the questionnaire
were similar with the 2003 survey to allow for comparison. Additional items included were
those related to alcohol use and the number and type of incidents, injuries and near misses.
Results
The majority of the recreational boaters surveyed were male, aged 45 years or older and had
been boating in the previous 12 months. Many were not a member of any boating association
and less than one-half carried children aged less than 12 years on their most recent trip. The
majority went boating most often on weekends or both during the week and on weekends and
approximately one-third went boating once a week or more frequently. The most common
activity was fishing, almost one-half went boating in protected waters and very few went
boating alone. Almost one-half of the boaters went boating all year and the most common
months for boating were between November and April. The majority of the boaters were
experienced and reported that safety was an important issue, both when asked about overall
boating issues and safety issues. Key marine safety issues that the respondents considered
requiring more focus or effort involved boating safety education, the control of boaters under
the influence of alcohol or drugs and the control of reckless operation. Few reported that they
had an alcoholic drink while on their most recent trip. It was suggested that boaters or
skippers themselves were responsible for ensuring safe boater behaviour. The majority
reported that they did not log on or tell someone where they were going when going boating,
while less than one-quarter reported checking the weather prior to going out boating and
amongst those that did, almost one-half accessed this information on the internet. Few boaters
reported checking fuel supplies or that they conducted a general boat and equipment check.
There was a high level of support for the introduction of the RST. Very few boating-related
injuries were reported and the majority that were, were classed as minor, requiring only minor
first aid or no treatment.

vi
Discussion
Many of the findings in this survey were similar with those reported in the 2003 survey. There
appears to have been little progress made into the promotion of a single authority to be
responsible for safety on the water as recommended in the 2003 report. The reinforcement and
reminding boaters of key safety issues remains important. While a very small number of
boaters reported the use of alcohol this may not reflect the true measure of drinking behaviour
among boaters as many may have felt uncomfortable in reporting any drinking. Further
exploration of alcohol use among this group maybe warranted. That the majority of
respondents reported that they did not log on or tell someone where they were going remains
a concern and this may be a target for an education campaign. Many recreational boaters
continue to access weather information from television and newspaper reports rather than
from sources that are regularly up-dated such as the internet and the radio. It is important for
more boaters to check fuel supplies and to conduct a general boat and equipment check as
many marine sea search and rescue incidents are related to breakdowns. While there were a
low number of injuries and the majority of those that were reported were classed as minor,
there is no data collected related to minor injuries collected in Western Australia. The
limitations to this study were that only registered recreational vessels were included in the
sampling frame and that the data supplied did not include any information on the location of
the respondents.
Recommendations
• It is important to continue to measure and monitor changes in recreational boaters’ attitude
and knowledge toward boating safety issues and standards.
• It is recommended that there is a focus on the education of recreational boaters in three
main areas: checking updated weather forecasts; checking fuel and other general boat and
equipment; and logging on.
o It is important that education strategies be developed to raise awareness of the
importance of accessing regularly updated weather forecasts and to increase the
number of recreational boaters who do so.
o It is also essential to remind boaters of the importance of checking the fuel supply as
well as conducting a general boat and equipment check.
o As few recreational boaters are logging on or telling someone where they are going,
this remains an issue that requires encouragement and reinforcing among this group.

vii
ABBREVIATIONS
DPI: Department for Planning and Infrastructure
nM : nautical miles
PWC: Personal watercraft
RST: Recreation Skippers Ticket

viii
ACKNOWLEDGEMENTS
This report was undertaken as part of the marine safety program of research conducted by the
Injury Research Centre in the School of Population Health at the University of
Western Australia for the Marine Safety Directorate at the Department for Planning and
Infrastructure.
The author would like to acknowledge the contributions of:
• Alison Coates and Laurie Adams from the Marine Safety Directorate at DPI for providing
advice.
• The participants who completed the survey.
The information contained in this report are those of the author and do not necessarily reflect
the views of the funding organization.

1
1 INTRODUCTION
Western Australia's 12,500 kilometre coastline is an extensive and isolated one.
There are more than 73,000 recreational vessels registered with the Department for
Planning and Infrastructure (DPI) (Pikora & Cercarelli, 2004) and an estimated
quarter of a million people using the waterways. A review of boating-related deaths,
injuries and incidents among boaters in Western Australia found that there were 0.96
deaths per 10,000 registered vessels, 1.74 hospital admissions per 1,000 vessels, and
18.55 rescues per 1,000 vessels (Pikora & Cercarelli, 2004).
The Recreational Boating Branch at the Marine Safety Directorate at DPI is
responsible for recreational boating safety through educational and promotional
programs. In November 2003 the Marine Safety Directorate DPI conducted a survey
to assess attitudes towards safety and safe boater behaviour among recreational boat
owners (Department for Planning and Infrastructure, 2003). This current study was
designed to determine if these attitudes and behaviours had changed; to monitor
safety behaviours; and to provide information related to additional safety issues and
behaviours for future boater surveys.
The aims of this study were:
• To measure and monitor changes in recreational boaters’ attitude and
knowledge regarding safety issues;
• To measure and monitor changes in recreational boaters’ beliefs, attitudes and
behaviours towards boating safety issues and standards; and
• To explore the number, type and reporting of incidents and injuries among
recreational boaters in the previous 12 months.

2
2 METHODS
2.1 Sampling frame
The Marine Safety Directorate at DPI maintains a register of all recreational vessels
that are registered in Western Australia. The survey participants were those who
reside in Western Australia and have a current registered recreational vessel with
DPI. Using this database, 1500 registered recreational vessel owners were randomly
selected. The sampling frame was divided into segments based on vessel type (ie,
open boat, runabout, cabin cruiser, yacht, half cabin, PWC, centre console, and
other) and location (ie, metropolitan and regional). This was so that more owners
with common vessel types were included in larger numbers to reflect recreational
boat owners across the State.
A sample of 500 adult boaters in both the metropolitan and regional areas of Western
Australia was recruited to participate in a telephone survey using the quotas as
identified in Table 2.1. An independent market research company were supplied the
telephone numbers and vessel type information. Using a CATI system, the survey
was conducted in March 2006. No names or other identifying information were
supplied.
Table 2.1 Characteristics of the vessels included in the sample quota
Type of vessel Metropolitan Regional TOTAL Open boat 164 41 205 Runabout 112 28 140 Cabin cruiser 48 12 60 Yacht 16 4 20 Half cabin 16 4 20 PWC 12 3 15 Centre console 8 2 10 Other 24 6 30 TOTAL 400 100 500
2.2 Response rate
Participants were invited to participate in the survey. If they did not wish to
participate, their telephone number was withdrawn from the sample. Participants
were free to decline answering any questions that they did not want to answer. The
information related to age was mistakenly not recorded in the first instance by the
3
market research call centre. The respondents were re-contacted to provide this
information and 70 respondents were not able to be re-contacted. Therefore this
information is missing for these respondents. No named data was collected and
individual participants are not identified in the report. Ethics approval was provided
for the study by the UWA Human Ethics Committee.
The response rate for the telephone survey was 46.6% (ie, 500 surveys /1071 calls
(including 380 refused, 20 language barriers, 113 screening, 58 not available)). If the
invalid (276), business (31), mobile (8) and duplicate (1) numbers were included, the
response rate was 36.0% (ie, 500/1387 total calls).
The data were checked, cleaned and some variables recoded prior to data analysis.
SPSS (version 11 for Windows) was used to analyse the data. Comparisons are made
with the results from the 2003 survey where appropriate.
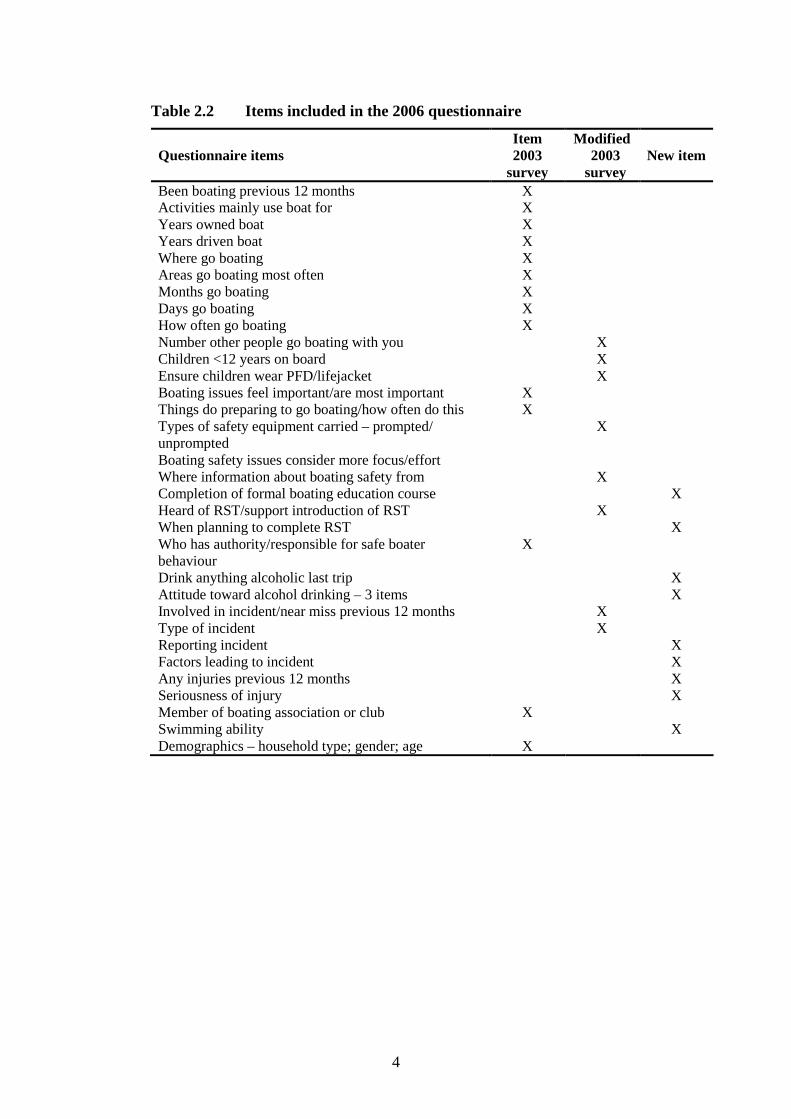
2.3 Survey instrument
The DPI conducted a survey among recreational boat owners in November 2003 and
this current survey was designed to replicate and extend the previous survey. As
shown in Table 2.2, many of the items from the 2003 survey remained the same to
allow for comparison between the surveys while others were modified and several
questions were added. The full questionnaire is provided in Appendix 1.
4
Table 2.2 Items included in the 2006 questionnaire
Questionnaire items
Item 2003
survey
Modified 2003
survey
New item
Been boating previous 12 months X Activities mainly use boat for X Years owned boat X Years driven boat X Where go boating X Areas go boating most often X Months go boating X Days go boating X How often go boating X Number other people go boating with you X Children <12 years on board X Ensure children wear PFD/lifejacket X Boating issues feel important/are most important X Things do preparing to go boating/how often do this X Types of safety equipment carried – prompted/ unprompted
X
Boating safety issues consider more focus/effort Where information about boating safety from X Completion of formal boating education course X Heard of RST/support introduction of RST X When planning to complete RST X Who has authority/responsible for safe boater behaviour
X
Drink anything alcoholic last trip X Attitude toward alcohol drinking – 3 items X Involved in incident/near miss previous 12 months X Type of incident X Reporting incident X Factors leading to incident X Any injuries previous 12 months X Seriousness of injury X Member of boating association or club X Swimming ability X Demographics – household type; gender; age X

5
3 RESULTS
3.1 Demographic information
The majority of recreational boaters sampled were male (79.4%; compared with 91%
in the 2003 survey), were aged 45 years or older (71.6%; 62% in 2003) and described
themselves as families with older children or as older couples with no children at
home (68.2%). In addition, the vast majority were able to swim 100 meters (Table
3.1).
Table 3.1 Demographic characteristics of the sample
Characteristics (n=500) % Gender Male 79.4 Age* 18-24 years 1.9 25-34 years 5.6 35-44 years 20.9 45-54 years 25.1 55-64 years 23.5 65+ years 23.0 Household structure Single living at home or out of home 8.8 Young couple no children 4.8 Family with children aged 12 or under 18.2 Family with older children 25.2 Older couple with no children at home 43.0 Ability to swim 100m Yes 91.4 No 6.2 Don’t know/unsure 2.4
*missing n=70
3.2 Recreational boating characteristics
The majority of the sample had been boating in the previous 12 months (88.4%) and
were not a member of any boating association (74.2%; 74% in 2003) (Table 3.2).
Less than one-half of the boaters (40.4%) carried children aged less than 12 years on
board on their most recent trip. The majority of the boaters went boating most often
on weekends (46.4%) or both during the week and on weekends (38.0%).
Approximately one-third (32.2%) went boating once a week or more frequently,

6
while the most common activity was fishing and almost one-half (42.6%) went
boating in protected waters. Very few respondents reported that they went boating
alone (2.8%).
Table 3.2 Boating characteristics
Characteristics (n=500) % Boating previous 12 months 88.4 Member boating association 25.8 Carry children under 12 years on board 40.4 Days go boating Weekend 46.4 Weekdays 15.6 Both 38.0 Boating frequency More than once a week 14.6 Once a week 17.6 Every couple of weeks 29.6 Once a month 21.0 Less than once a month 17.2 Activities* Fishing 79.0 Cruising/motoring 33.0 Water sports (eg, skiing, wakeboarding) 10.4 Diving 8.2 Racing 2.0 Other 3.6 Number people usually go boating with 0 2.8 1 – 2 58.0 3 – 4 30.2 5+ 9.0 Location go boating most often Protected waters 42.6 Within 2nM from mainland 14.6 Between 2 & 5nM from mainland 16.2 More than 5nM from mainland 26.6
*Multiple responses allowed

7
Almost one-half of the boaters went boating all year (43.8%) and the most common
months for boating were between November and April (Figure 3.1). These results are
similar with those in the 2003 boater survey.
0
10
20
30
40
50
60
70
80
90
100
Janu
ary
Febr
uary
March
April
May
June
July
Augu
st
Septembe
r
Octob
er
Novem
ber
Decem
ber
Month
%
2006 2003
Figure 3.1 Months when respondents go boating: comparison between 2006 and 2003 survey
Table 3.3 presents the boaters’ experience in driving, owning and overall boating
experience. The majority of the boaters had more than ten years overall boating
experience (72.9%), two-thirds had more than ten years experience driving a boat
(65.3%), while one-half had owned a boat for more than ten years (53.2%). These
results may reflect that there was an older group of respondents in the survey.
Table 3.3 Boating experience
Years
Overall Boating Experience*
Driving Boat*
Ownership of Boat*
≤2 years 7.2 11.2 14.5 3 – 5 years 7.0 9.2 15.9 6 – 10 years 12.9 14.3 16.1 11 – 20 years 25.3 26.1 23.1 21+ years 47.6 39.2 30.1
*n=500

8
3.3 Recreational boating safety
When asked “When thinking about boating, which issues do you feel are important?”
safety was the first mentioned response for the majority of respondents (65.8%,
n=315) followed by weather (6.6%), knowledge about boating/education/training
(5.8%), safety equipment (4.3%), safe launching areas/more ramps/lack of ramps
(3.9%), and condition/maintenance of boat and equipment (3.1%). In the 2003
survey, 73% of respondents spontaneously raised issues related to safety.
When asked “When thinking about recreational boating safety, which issues are most
important to you?” safety was again the first mentioned response (18%) followed by
life jackets/flares (17%), weather (9.4%), safety equipment (9.0%), knowledge about
boating/education/training (8.2%), and condition/maintenance of boat and equipment
(5.4%). Figure 3.2 provides the range of the most common responses from the
respondents to both overall issues and safety issues.
0 10 20 30 40 50 60 70 80 90 100
Knowledge/obeying rules & regulat ions
Communicat ion equipment/training
Fuel
Common sense/courtesy
Positive comments re RST/licensing
Inexperienced boaters/young drivers
Negative comments re RST/licensing
Life jacket/flares
Alcohol
Speed
Condition/maintenance of boat & equipment
Safe launching areas/more ramps/lack of facilit ies
Safety equipment
Knowledge about boating/education/training
Weather
Safety
% Overall issues Safety issues
Figure 3.2 Recreational boating issues and boating safety issues - unprompted responses

9
The boaters were asked about which marine safety issues require more effort or
focus. Boating safety education was selected by more than one third (39.0%) of the
boaters as requiring more focus or effort, while fewer suggested that the control of
boaters under the influence of alcohol or drugs (31.6%) and the control of reckless
operation (30.2%). Interestingly, very few respondents (2.2%) thought that there
were no issues that required more effort or focus (Table 3.4).
Table 3.4 Which marine safety issues require more effort/focus?
Marine safety issues* (n=500) % Boating safety education 39.0 Control of boaters under influence of alcohol or drugs 31.6 Control of reckless operation 30.2 Other 3.4 Nothing 2.2 Speeding 0.8
*Multiple responses allowed
The boaters were asked who they believed to have the authority and are responsible
for ensuring that boaters behave safely on the water. Almost one third suggested that
the skipper or the boater themselves had the authority and were responsible for
ensuring safe boater behaviour (31.0%; 0% in 2003 survey). Other authorities
mentioned frequently included the Water Police (29.0%; 35% in 2003), Marine
Safety (16.0%; 2% in 2003) and the Department for Planning and Infrastructure
(8.6%; 22% in 2003). As shown in Table 3.5, there were a range of organisations
mentioned as having authority which is similar to those reported in the 2003 survey.
Table 3.5 Who has authority and is responsible for ensuring safe boater behaviour?
Who has authority & responsibility % Skipper/boaters 31.0 Water Police 29.0 Marine Safety 16.0 DPI 8.6 Fisheries 7.6 Don’t know/unsure 2.6 Harbour and Lights 1.8 Other 1.4 Sea Rescue 1.0 Marine and Harbours 0.6 Nobody 0.4

10
When asked where they had obtained information about boating safety, one third of
the respondents had not sourced any safety information (34.4%; 37% in 2003) while
20.4% had obtained information from the Department for Planning and Infrastructure
and 11.0% from media advertising (Table 3.6). Of note is that none of the
respondents mentioned obtaining information from the Marine Safety Trailer.
Table 3.6 Sources of boating safety information
Safety information sources (n=500) % None 34.4 DPI 20.4 Media advertising (TV/radio/press) 11.0 Yacht or boating club 9.0 BoatSmart provider 8.4 Internet 8.0 BoatSmart handbook 6.8 Friends 5.4 Marine and Harbours 5.2 Marine equipment shop 3.2 Other 3.0 Boat shows 2.4 Boating communities newsletter 2.2 Search & Rescue 1.4 Fisheries 1.0 Public safety demonstrations 0.4 Various 0.4 Marine safety trailer 0
3.4 Recreational boating safety behaviours
Among those who had children aged less than 12 years on board in the previous 12
months (47.2%), the majority (73.3%) ensured that these children always wore a life
jacket. Less than one fifth (18.6%) reported that they had an alcoholic drink while on
their most recent trip.
The respondents were prompted with a range of topics to do when preparing to go
boating (see Table 3.7). Many of the boaters reported that they checked their fuel
supply (60.8%; 64% in 2003 survey) and attended to a general boat and equipment
check (52.4%; 68% in 2003). Fewer boaters reported checking the life jackets or
PFD’s (45.4%; 53% in 2003), the batteries on board (34.8%; 21% in 2003) and flares
(27.2%; 41% in 2003). Of concern is that only approximately one quarter reported

11
that they checked the weather conditions before going boating (22.2%; 16% in
2003). Few respondents reported that they logged on (4.4%) and, although the vast
majority of the boaters went boating with other people, only 12.2% reported that they
told someone where they were going and 6.6% reported showing their passengers
safety equipment.
Table 3.7 What do you do when preparing to go boating - prompted
Preparing to go boating (n=500) % Check fuel supply 60.8 General boat & equipment check 52.4 Check life jackets/PFD’s 45.4 Check batteries 34.8 Check flares 27.2 Check weather conditions 22.2 Regularly service engine 18.4 Check anchor and line 16.6 Check radio 15.8 Check EPIRB 15.0 Check boat stability 13.0 Inform someone of trip details 12.2 Check bucket or bailer 10.6 Show passengers safety equipment 6.6 Log on 4.4
The boaters were asked where they sourced weather information from (Table 3.8).
Among those who reported checking the weather conditions before going boating,
almost one half (46.8%) sourced the weather information on the internet (compared
with 25% in 2003). Other common sources mentioned included television weather
reports (40.5%; 47% in 2003), AM/FM radio reports (27.9%; 23% in 2003) and
newspapers (16.2%; 20% in 2003).
Table 3.8 Sources of weather information
Source of weather information (n=111) % Internet 46.8 Television weather reports 40.5 AM/FM radio reports 27.9 Newspaper 16.2 Marine radio reports 10.0 Phone 7.2 Visual 3.6 Other 1.8 None 0.9
*Multiple responses allowed

12
3.5 Recreational boating safety equipment
The boaters were asked which types of safety equipment that they carry on board.
These responses were analysed separately for the area that they go boating most
often. Figure 3.3 summarises the top of mind (unprompted) responses and Figure 3.4
the prompted responses.
As shown in Figure 3.3, the majority of the boaters reported carrying PFD’s or life
jackets (overall 80.4%) regardless of where they go boating most often. Other safety
equipment carried frequently included an anchor and line (overall 38.8%) with no
difference between the areas go boating most often; a marine radio (overall 34.6%),
although this was more commonly reported among those who went more than 2 nM
from the mainland; and a bilge pump or bail bucket (overall 25.4%).
0 10 20 30 40 50 60 70 80 90
PFD’s or life jackets
Anchor and line
Marine radio
Bilge pump or bail bucket
Cellular phone
Flashlights
Tool kit
GPS
Compass
Navigation lights
General maps
Navigation charts
Boa
ting
safe
ty e
quip
men
t
%
Protected waters <2 nM from mainland >2 & <5 nM from mainland >5 nM from mainland
Figure 3.3 Types of boating safety equipment carried on board by area go boating most often – unprompted responses

13
As shown in Figure 3.4 when the boaters were prompted with a list of safety
equipment the responses altered. Many of the boaters reported carrying a tool kit
(overall 64.6%) and this was similar across the areas boaters used most often. Other
safety equipment reported to be carried frequently with little difference between the
areas going boating most often included an anchor and line (overall 56.6%); a bilge
pump or bail bucket (overall 57.8%); and a cellular phone (overall 53.8%). There
were more differences between the equipment reported to be carried depending on
the areas boaters go boating most often. Not surprising, more boaters who went
boating more than 5nM from the mainland reported carrying a range of safety
equipment when compared with those who stay closer to the mainland (Figure 3.4).
In contrast to the unprompted responses, few boaters reported carrying PFD’s or life
jackets (overall 15.8%) and this was low regardless of the area boaters went boating
most often.
0 10 20 30 40 50 60 70 80
PFD’s or life jackets
Anchor and line
Marine radio
Bilge pump or bail bucket
Cellular phone
Flashlights
Tool kit
GPS
Compass
Navigation lights
General maps
Navigation charts
Boa
ting s
afet
y eq
uipm
ent
%
Protected waters <2 nM from mainland >2 & <5 nM from mainland >5 nM from mainland
Figure 3.4 Types of boating safety equipment carried on board by area go boating most often – prompted responses

14
3.6 Recreational boating emergency equipment
The boaters were asked which types of boating emergency equipment that they carry
on board. These responses were analysed separately for the area that they go boating
most often. Figure 3.5 summarises the top of mind responses and Figure 3.6 the
prompted responses.
As shown in Figure 3.5, the majority of boaters reported carrying visual distress
signals (eg, flares, flags) (overall 70.0%) regardless of where they go boating most
often. Other emergency equipment carried frequently included an EPIRB (overall
41.8%); a fire extinguisher (overall 30.2%); and a first aid kit (overall 21.4%).
Except for carrying an EPIRB on board, there was little or no difference between the
areas go boating most often and whether this equipment were reported to be carried
on board.
0 10 20 30 40 50 60 70 80 90 100
Visual distress signals
EPIRB
Fire ext inguisher
First aid kit
Safety rope
Equipment to reach someone in water
Ring/other flotation device
Sound signals (eg, horns, whistles)
Bo
atin
g e
mer
gen
cy e
qu
ipm
ent
%
Protected waters <2 nM from mainland >2 & <5 nM from mainland >5 nM from mainland
Figure 3.5 Types of boating emergency equipment carried on board by area go boating most often – unprompted responses

15
As shown in Figure 3.6, when the boaters were provided with a list of emergency
equipment these responses altered. Many of the boaters reported carrying a safety
rope (overall 58.8%); equipment for reaching someone in the water (overall 49.2%);
a first aid kit (overall 45.6%); and a fire extinguisher (overall 41.2%) and this was
consistent across the different areas boaters went boating most often. In contrast to
the unprompted responses, few boaters reported carrying visual distress signals
(overall 15.4%) or EPIRB’s (overall 12.2%) and this was low regardless of the areas
boaters went boating most often.
0 10 20 30 40 50 60 70 80 90 100
Visual distress signals
EPIRB
Fire extinguisher
First aid kit
Safety rope
Equipment to reach someone in water
Ring/other flotation device
Sound signals (eg, horns, whistles)
Bo
ati
ng
sa
fety
eq
uip
me
nt
%
Protected waters <2 nM from mainland >2 & <5 nM from mainland >5 nM from mainland
Figure 3.6 Types of boating emergency equipment carried on board by area go boating most often – prompted responses
These results may reflect how the boaters interpreted the terms of “safety equipment”
and “emergency equipment” when asked for their response without prompting with
an example.

16
3.7 Recreational boating education
The majority of respondents had not completed any boating education course
(72.6%) compared with 64% in the 2003 survey. Of those who had, one half (52.6%)
reported that they had completed a BoatSmart course, while 24.1% a National
Powerboat Scheme (TL3), 26.3% a commercial course, and 6.6% reported having
completed another education course.
The characteristics of those who reported attending some boater education course
were those with more years experience (47.8% with 21 or more years experience
compared with only 5.1% with < 2 years), were not members of a boating association
(61.3%), were 35 years or older (95.7%), were older couples with no children at
home (39.4%), and male (86.1%).
3.7.1 Recreational Skippers Ticket
When asked about the Recreational Skippers Ticket (RST) 73.2% had heard of it
compared with 86% having heard of the BoatSmart course in the 2003 survey. There
was support for the introduction of the RST among the boaters with 66.0%
supporting or strongly supporting. This is lower than the support reported in the 2003
survey where 84% supported or strongly supported the introduction of a required
minimum competency for all recreational boaters. More than one half of the
respondents planned to complete the RST within the next 12 months (56.0%), while
10.0% suggested that they already had a qualification and/or were exempt from the
RST and another 8.0% reported that they were not going to do the RST (Table 3.9).

17
Table 3.9 Recreational Skippers Ticket
RST issues (n=500) % Support for RST Strongly support 36.8 Support 29.2 Neither support nor oppose 13.8 Oppose 9.0 Strongly oppose 6.8 Don’t know enough about it 4.4 When plan to complete Within next 6 months 43.2 Within next 12 months 12.8 Did not know about it until now so don’t know 14.6 Have qualification/exempt 10.0 Not going to 8.0 As late a possible 3.2 Unsure 3.2 Within next 2 years 2.4 Other 1.8 As soon as possible 0.8

18
3.8 Recreational boating injuries, incidents and near misses
Only 9.2% (n=46) of the boaters reported having suffered an injury while on board a
boat (compared with 6% in 2003) and 5.4% (n=27) reported experiencing an incident
or near miss. While the current survey asked about specific injuries, incidents and
near misses, the 2003 survey asked respondents about experiencing a scenario that
raised safety concerns. In the 2003 survey, 26% reported experiencing such a
scenario.
The vast majority of the boating injuries reported were cuts and lacerations (84.7%)
and only required minor first aid or no treatment (93.4%) (Table 3.10). This was
similar with the reported boating related incidents and near misses. The majority of
respondents who reported incidents and near misses classing these as minor (74.0%).
Very few had reported the incident or near miss (14.8%) (Table 3.11).
Table 3.10 Recreational boating injuries
Boating injury n Any injury 46 Type of injury: Cuts & lacerations 39 Fractures/broken bones 3 Burns 2 Hypothermia 2 Level of seriousness: Serious with hospital stay 1 Moderate with General Practitioner or Emergency Department visit
2
Minor with first aid 14 No treatment required 29

19
Table 3.11 Recreational boating incidents or near misses
Boating incident or near miss n Experienced incident or near miss 27 Type of incident: High risk 6 Urgent situation 1 Minor incident 20 Reported incident 4 Factors leading to the incident: Reckless or careless operation 9 Operator error 7 Weather or sea conditions 3 Operator inexperience 3 Lack of boating skills 3 Speed 3 Inadequate lookout 2 Alcohol use 0 Mechanical or structural failure 0

20
4 DISCUSSION
4.1 Findings
The purpose of this study was to measure and monitor changes in recreational
boaters’ attitude and knowledge regarding safety issues; to measure and monitor
changes in recreational boaters’ beliefs, attitudes and behaviours toward boating
safety issues and standards; and to explore the number, type and reporting of
incidents and injuries among recreational boaters in the previous 12 months.
Both the demographic and recreational boating characteristics from the 2006 survey
were similar with those in the 2003 survey. The main difference was that more
females were included in the current survey.
Safety was an important issue for the majority of the recreational boaters in the
survey, both when asked about overall boating issues (ie, unprompted) and safety
issues (ie, prompted). Key marine safety issues that the respondents considered
requiring more focus or effort involved boating safety education, the control of
boaters under the influence of alcohol or drugs and the control of reckless operation.
In contrast to the 2003 survey (Department for Planning and Infrastructure, 2003),
the respondents suggested that boaters or skippers themselves were responsible for
ensuring safe boater behaviour. Additional authorities included the Water Police,
Marine Safety and DPI. This indicates that there little progress made into the
promotion of a single authority to be responsible for safety on the water as was
recommended in the 2003 report (Department for Planning and Infrastructure, 2003).
This would assist in the promotion of where boaters can go to access boating safety
information.
The boating safety behaviours reported by the respondents were similar with those
reported in the 2003 survey (Department for Planning and Infrastructure, 2003) and
there is the need to reinforce and remind boaters of the safety issues. While the
respondents reported that boaters under the influence of alcohol or drugs were a
concern, few of those surveyed reported that they had an alcoholic drink while on
their most recent trip. This may not reflect the true measure of drinking behaviour
among recreational boaters as many may have felt uncomfortable in reporting any

21
drinking. The issue of drinking while operating a recreational vessel warrants further
investigation.
That the majority of respondents reported that they did not log on or tell someone
where they were going remains a concern and this may be a target for an education
campaign. This finding is consistent with those among Tasmanian recreational
boaters where 15% did not tell someone where they were going and when they were
expected to return (Marine and Safety Tasmania, 2000).
Less than one-quarter of the recreational boaters reported checking the weather prior
to going out boating and among those that did, almost one-half accessed the internet
for this information. Of concern is that many recreational boaters continue to access
weather information from television and newspaper reports rather than from sources
that are regularly up-dated such as the internet and the radio. The reliance on
television weather reports is similar with that found in the 2003 survey (Department
for Planning and Infrastructure, 2003). It is recommended that recreational boaters
are reminded and encouraged to check the most accurate weather information prior
to going boating. In addition, boaters should be directed to sources that provide more
up-to-date information.
Few boaters reported checking fuel supplies or conducting a general boat and
equipment check. This is of concern as 57% of the marine sea search and rescue
incidents are related to breakdowns (Pikora & Cercarelli, 2004). Among these
breakdown incidents, the most common were due to fuel blockages, electrical failure
and being out of fuel.
There was support for the introduction of the RST, although this was lower than the
support reported in the 2003 survey for the introduction of a required minimum
competency for all recreational boaters (Department for Planning and Infrastructure,
2003). This level of support may be developed further with the monitoring of the
number and severity of boating related incidents and injuries and the uptake of RST.
There were a low number of injuries reported among the boaters and the majority
were classed as minor, requiring only minor first aid or no treatment. There is no data

22
collected related to minor injuries in Western Australia to allow comparison with the
wider recreational boating community to compare these injuries with. It is suggested
that this item be included in future surveys among recreational boaters.
4.2 Limitations
There are some limitations in this study. Only recreational boaters with registered
vessels were included in the sampling frame and the results may have been different
with the inclusion of those with unregistered vessels. The data sent by the market
research company did not include any information on the location (ie, metropolitan
or regional) of the respondents. This should be included in any subsequent surveys
among recreational boaters.
4.3 Recommendations
General recommendations:
• It is important to continue to measure and monitor changes in recreational
boaters’ attitude and knowledge toward boating safety issues and standards.
• It is recommended that one authority be promoted as responsible for boating and
marine safety. This would assist boaters in knowing where to access boating
safety information.
• It is recommended that there is a focus on the education of recreational boaters
in three main areas: checking updated weather forecasts; checking fuel and other
general boat and equipment; and logging on.
o It is important that education strategies be developed to raise awareness of
the importance of accessing regularly updated weather forecasts (such as
using the telephone, radio, or internet) and to increase the number of
recreational boaters who do so.
o It is also essential to remind boaters of the importance of checking the fuel
supply as well as conducting a general boat and equipment check.
o As few recreational boaters are logging on or telling someone where they
are going, this remains an issue that requires reinforcement among this
group.

23
REFERENCES
Department for Planning and Infrastructure (2003). Recreational boating safety research November 2003. Marine and Safety Tasmania (2000). Recreational boating safety review, Marine and Safety Tasmania. Pikora, T. and Cercarelli, L. (2004). Quantifying boating-related fatalities, injuries and incidents in Western Australia. Perth, Western Australia, Injury Research Centre, School of Population Health, the University of Western Australia.

A1
APPENDIX 1

A2
INTRODUCTION Hello, my name is …………….., from ……………….. an independent research firm in Perth. We are contacting people from a list of registered boat owners supplied to us by the Department for Planning and Infrastructure to conduct research on their behalf about recreational boating attitudes and behaviours. Your telephone number was selected at random, we have no other personal details. If you choose to participate the information and opinions you provide will be used for research purposes only. The survey will take approximately 12 minutes. May I speak with the person who owns the registered vessel. Firstly, can I just confirm do you or anyone you know well work or have recently worked: In market research In advertising For the Depart for Planning and Infrastructure – if YES, cancel the interview None of the above INSERT TYPE OF VESSEL FROM DATABASE _________________
INSERT POSTCODE FROM DATABASE ___________________
QUESTIONS FOR TELEPHONE SURVEY 1. Have you been boating in the previous 12 months? Yes, no, unsure 2. What activities do you mainly use your boat for? Fishing Cruising or motoring Watersports (skiing, wake boarding) Diving Racing Other (please specify) None 3. How many years have you owned a boat? _______________ years 4. How many years have you driven a boat? _______________ years 5. How many years of overall boating experience have you had? _______________ years 6. Where do you normally go boating? (can select more than one option) Protected waters (lakes, rivers, inlets, estuaries) Within 2 nautical miles from mainland Between 2 and 5 nautical miles from mainland More than 5 nautical miles from mainland 7. Which areas do you go boating most often? Protected waters (lakes, rivers, inlets, estuaries) Within 2 nautical miles from mainland Between 2 and 5 nautical miles from mainland More than 5 nautical miles from mainland 8. During which months do you normally go boating? _______________ list as many as apply

A3
9. What days would you most often go boating? Weekend Weekdays Both 10. How often would you normally go boating? More than once a week Once a week Once every couple of weeks Once a month Less than once a month 11. How many other people usually go boating with you? ________ people Don’t know/unsure 12a. In the previous 12 months, were there any children <12 years on board? Yes No (skip to Q13) Don’t know/unsure 12b. If yes, do you ensure that these children always wear a PFD/life jacket? Always Sometimes Never Don’t know/unsure Refused 13. When thinking about boating, which issues do you feel are important? (Unprompted, open ended) 14. When thinking about recreational boating safety, which issues are most important to you? (Unprompted, open ended) 15. Thinking about when you are preparing to go boating, can you tell me some of the things that you do? (Unprompted) 16a. Which of the following would you do when
preparing to go boating? 16b. How often do you do this? Every time, most times, occasionally, at least once a year, less than once a year
Check batteries Check bucket or bailer Check boat stability Check EPIRB Check anchor and line Check flares Check fuel supply Check life jackets/PFD’s Check radio General boat and equipment check Inform someone of trip details Log on Regularly service engines Show passengers safety equipment Check weather conditions – if yes, source the weather information [AM/FM radio reports, marine radio reports, television weather reports, newspaper, internet, other]

A4
Which types of safety equipment do you carry on board (Unprompted and prompted] 17a Unprompted 17b Prompted Anchor and line Bilge pump or bail bucket Cellular phone Compass Flashlights General maps GPS Marine radio Navigation charts Navigation lights PFD’s or life jackets Tool kit Emergency equipment: EPIRB Equipment for reaching someone in the water (eg, boat hook)
Fire extinguisher First aid kit Ring or other throwable flotation device Safety rope Sound signals (eg horns, whistles) Visual distress signals (eg flares, flags) Anything else (please specify) 18. What boating safety issues do you consider requires more focus/effort? Control of reckless operation Boating safety education Control of boaters under the influence of alcohol or drugs Anything else? (please specify) 19. In the last 12 months, what sources have you obtained information about boating safety from? (unprompted) The Department for Planning and Infrastructure My yacht or boating club BoatSmart provider Marine Equipment shops Boating Communities newsletter Media advertising (TV/radio/press) BoatSmart Handbook Boat shows The internet Public safety demonstrations Marine Safety trailer Marine and Harbours Friends None Other (please specify)__________________________
20. Have you ever completed any formal boating education course? No Boatsmart National Powerboat Scheme (TL3) Commercial course

A5
Other (please specify) _____________________ 21. Have you heard of the Recreational Skippers Ticket for recreational boaters? Yes No Don’t know/unsure 22. The Recreational Skipper’s Ticket (RST) is a compulsory qualification based on a set of marine safety competencies that all recreational skippers will need to meet. Do you support the introduction of the RST? Strongly support Support Neither support nor oppose Oppose Strongly oppose Don’t know enough about it 23. If the RST is launched by the end of summer 2006, when do plan to complete your ticket? Within next 6 months Within next 12 months Within next 2 years Other (please specify) Did not know enough about it until now so don’ know 24. Who do you believe has the authority and is responsible for ensuring that boaters behave safely on the water? Department for Planning and Infrastructure Fisheries Water Police Marine Safety Other (please specify) 25. On your most recent boating trip did you have anything alcoholic to drink? Yes No Don’t know/unsure Refused 26. It is safe for passengers on recreational boats to drink alcohol as long as the skipper does not drink any alcohol. Do you agree or disagree with this statement? Agree strongly Agree Neither agree not disagree Disagree Disagree strongly 27. If someone fell overboard when they had been drinking, do you think that the alcohol would help them maintain their body temperature? Yes No Unsure 28. Do you think that alcohol affects people less when they are boating because they are in the fresh air? Yes No Unsure

A6
29a. In the previous 12 months, have you ever been involved in an incident or near miss while boating? Yes No - skip to Q30a 29b. If yes, would you describe this as: “High risk” incident – where you felt that a life was threatened “Urgent” situation – where you required help from others Some type of minor incident An incident that led to a death, injury or property damage that made the boat unseaworthy 29c. Did you report this to any authority? Yes No If yes, which authority If no, why not 29d. What do you consider were the factors that led to this incident? Alcohol use Reckless or careless operation Operator error Mechanical or structural failure Weather or sea conditions Inadequate lookout Operator inexperience Lack of boating skills Speed Unsafe vessel or equipment Other (please specify) 30a. In the previous 12 months, have you suffered any of the following injuries while on a boat? Cuts and lacerations Near drowning Burns Hypothermia Fracture/broken bones Concussion Other (please specify) None 30b. For each injury, how serious was this injury? Serious needing a hospital stay Moderate needing visit to GP or emergency department Minor needing first aid treatment No treatment required 31. Are you a member of a boating association or boating club? Yes No Don’t know/unsure 32. Are you able to swim approximately 100 metres in the ocean? (This is the same as two lengths of an Olympic-sized swimming pool) Yes No Don’t Know

A7
33. Which of the following best describes your household? Young single/living out of home Young couple with no children Two or single parent family with youngest child 12 or under Two or single parent family with youngest child teenager/adult at home Older couple without children living at home Older single 34. Gender Male Female 35. Age ______________ years