a survey of student attitudes and...
TRANSCRIPT

Rachael M. Codding, GraduateDr. Sheila L. Steinberg, Associate ProfessorDepartment of SociologyHumboldt State UniversityArcata, CA 95521
ALTRUISM AND FORGIVENESS AT HUMBOLDT STATE UNIVERSITY
A Survey of Student Attitudes and ActionsFall 2004

Altruism and Forgiveness at Humboldt StateUniversity: A Survey of Student Attitudes and
Actions
Fall 2004
By
Rachael M. CoddingGraduate
Department of SociologyHumboldt State University
Dr. Sheila L. SteinbergAssociate Professor
Department of SociologyHumboldt State University
Arcata, CA 95521

Acknowledgements
We would like to thank all of the students who participated in our study. Additionally wewant to thank the Humboldt State University Professors who allowed us to survey theirclasses. We would especially like to thank Dr. Mark Rizzardi for his statistical adviceand support. We would also like to thank Dr. Samuel P. Oliner for his advice on theproject. Special thanks also go out to Ms. Lori Cortez for her assistance with data
collection.
Support for the printing of this report was generously provided by the Department ofSociology, Humboldt State University.

Introduction
Humboldt State University students are known for their commitment to the
environment and to issues of social justice. After September 11, 2001, it appeared that
many members of American society grappled with issues of faith and forgiveness. As
sociologists, we wanted to further explore how local people felt about some of these
topics. As a result, a survey was developed to examine H.S.U. student attitudes on the
topics of forgiveness, altruism, faith and spirituality and the environment. We wanted to
determine if significant differences in attitude and/or actions between social science and
natural science majors might exist at Humboldt State University. The results of the
study are presented in this report.
In Spring 2003, a total of 305 Humboldt State University students completed a
survey that examined student attitudes and experiences regarding faith, spirituality,
forgiveness, terrorism, and altruism. Upper-division classes were randomly selected
from classes taught in the natural and social sciences. We deliberately chose upper
division classes because we thought they would have a greater number of students of a
specific major. Professors were approached through e-mail to see if they would be willing
to allow their classes to be surveyed. In total eleven classes were surveyed, five from the
natural sciences, and six from the social sciences. The specific classes that were
surveyed came from the fields of psychology, philosophy, social work, sociology,
political science, theatre arts, oceanography, wildlife, fisheries, and forestry.
Study Site Background
Humboldt State University (HSU) is part of the 23-campus California State
University (CSU) system. HSU is the California State University’s northernmost
campus, located in Arcata, just 100 miles south of the Oregon border and 270 miles north
of San Francisco. The campus is set between the Pacific Ocean and the towering
redwoods on 144 acres of land.
Humboldt State University was founded during the Progressive Movement (1897-
1917) in United States history-a time when the importance of education was brought to a
national level. Humboldt State began as the Humboldt State Normal School in 1913.
California Governor Hiram Johnson signed the law on June 16, 1913 establishing the
Normal School for the training and education of teachers and others in the art of
instruction and governing the public schools of this state.

2
HSU Student Background
This section provides some basic background information on Humboldt State
students such as geographic origin, age group, ethnicity, class standing, and college
enrollments. Table 1 shows the breakdown of HSU students by geographic origin.
Table 1: Geographic Origin of HSU Students
Geographic Region Frequency Percent
Humboldt County (CA) 1898 24.9
Northern CA 1025 13.5
Bay Area (CA) 1163 15.3
Central CA 859 11.3
Los Angeles (CA) 1010 13.3
San Diego (CA) 360 4.7
Other State 1238 16.3
Foreign 57 0.7
Unknown 1 0.0
Total 7611 100.0 Source: Humboldt State University Analytic Study, Office of Enrollment Management & Academic Affairs,Fall 2002.
Almost a quarter of the total HSU student population originates from Humboldt
County (24.9%) while 16.3% of students come from another state besides California.
Only 0.7% of students come from somewhere outside of the United States. Overall the
majority of students that attend Humboldt State are from California (83.0%).
Table 2 presents the HSU student population by various groups age. The majority
of students are between the age of 20 and 24 (3,608), while 1,631 students are 20 years
old or younger and 1,229 students are between the age of 25 and 29. The remaining
students (1,143) are 30 years or older.

3
Table 2: Age Group of HSU Students
Age Group Frequency Percent
<20 1631 21.4
20-24 3608 47.4
25-29 1229 16.2
30-34 415 5.5
35-39 199 2.6
40-44 150 2.0
45-49 130 1.7
50-59 110 1.4
>60 139 1.8Total 7611 100.0 Source: Humboldt State University Analytic Study, Office of Enrollment Management & Academic Affairs, Fall2002.
The following table shows the breakdown of the HSU student population by
ethnicity. Most students reported their ethnicity as White (63.0%). The second most
common answer was Unknown at 17.4% followed by Hispanic at 7.9%.
Table 3: Student Ethnicity
Ethnicity Frequency Percent
Asian 222 2.9
Black 191 2.5
Hispanic 603 7.9
Native American 199 2.6
Pacific Islander 28 0.4
White 4796 63.0
Other 250 3.3
Unknown 1322 17.4
Total 7611 100.0 Source: Humboldt State University Analytic Study, Office of Enrollment Management & Academic Affairs,Fall 2002.
Table 4 illustrates the student population of HSU by class standing. Seniors are
the highest populated class with 2,467 students and sophomores are the least populated
class with only 946 students. The majority of students who attend HSU are
undergraduates.

4
Table 4: HSU Enrollment by Class Standing
Class Standing Male Female Part-time Full-time TotalsFreshman 596 824 160 1260 1420Sophomore 415 531 76 870 946Junior 814 919 163 1570 1733Senior 1143 1351 358 2109 2467TotalUndergrads 2968 3598 757 5809 6566Graduate 442 603 371 674 1045Totals 3410 4201 1128 6483 7611Source: Humboldt State University Analytic Study, Office of Enrollment Management & Academic Affairs
HSU offers a variety of major choices for students. Each major is part of one of
three colleges. These colleges include the College of Arts, Humanities and Social
Sciences (CAHSS), the College of Natural Resources and Sciences (CNRS), and the
College of Professional Studies (CPS). Table 5 shows the average annual student
enrollment by college.
Table 5: HSU Average Annual Student Headcount by College
College 98/99 99/00 00/01 01/02
CAHSS 1982 2028 2014 2068
CNRS 3186 3093 3006 2907
CPS 1420 1444 1423 1375
All University 821 875 871 928
Total 7409 7440 7314 7278 Source: Humboldt State University Analytic Study, Office of Enrollment Management & AcademicAffairs, Fall 2002.
The following sections of this report feature data collected from a study
conducted at Humboldt State University that examines student attitudes regarding
spirituality, forgiveness, terrorism, and altruism.

5
Sample Description
Table 6 provides a description of our sample on the following characteristics: sex,
ethnicity, age and class standing.
Table 6: Sociodemographic Characteristics of the Sample
Characteristics Frequency PercentSEXFemale 135 44.6Male 167 55.1Other 1 0.3Total 303 100.0
ETHINICITYWhite/Anglo 250 82.5Latino/Latina 15 5.0African American 1 0.3Other 37 12.2Total 303 100.0
CLASS STANDINGFreshman 6 2.0Sophomore 24 7.9Junior 94 31.0Senior 157 51.8Graduate Student 16 5.3Other 6 2.0Total 303 100.0
AGE<20 3 1.020-24 174 58.625-29 80 26.930-34 17 5.735-39 12 4.040-44 5 1.745-49 2 0.750-59 3 1.0>60 1 0.3Total 297 100.0
As Table 6 summarizes, a greater number of males (55.1%) than females (44.6%).
completed our survey. The majority of respondents (82.5%) reported their ethnicity as
White/Anglo. This number follows the pattern indicated in the Humboldt State

6University Statistical Profile on student’s ethnicity (see Table 3), which reports the
majority of HSU students (63.0%) identify as White. In terms of class standing, Table 6
shows that most respondents characterized themselves as being in their Junior (31.0%) or
Senior (51.8%) year, which is not surprising due to the fact that the classes we selected to
survey were upper division courses.
To gain a better understanding about students’ backgrounds we asked respondents
to identify their parent’s level of education as well as their parent’s occupation. Table 7,
on the following page, summarizes responses to these questions.

7
Table 7: Education and Occupation of Parents
Characteristics Frequency PercentMOTHER'S HIGHEST LEVEL OF EDUCATIONLess than High School 13 4.3High School Graduate 73 24.1Some College 86 28.4College Graduate 92 30.4Master's Degree 33 10.9More than a Master's Degree 6 2.0Total 303 100.0
FATHER'S HIGHEST LEVEL OF EDUCATIONLess than High School 13 4.4High School Graduate 58 19.8Some College 82 28.0College Graduate 87 29.7Master's Degree 34 11.6More than a Master's Degree 19 6.5Total 293 100.0
MOTHER'S OCCUPATIONTeacher/Professor 35 12.0Homemaker 67 23.0Clerical 29 10.0Sales 16 5.5Professional 67 23.0Self-Employed/Business Owner 11 3.8Service Industry 42 14.4Construction/Labor 6 2.1Transportation 2 0.7No Work 6 2.1Retired 2 0.7Other 8 2.7Total 291 100.0
FATHER'S OCCUPATIONTeacher/Professor 24 8.7Homemaker 1 0.4Sales 17 6.1Professional 93 33.6Self-Employed/Business Owner 20 7.2Service Industry 46 16.6Construction/Labor 50 18.1Transportation 11 4.0No Work 4 1.4Retired 1 0.4Other 10 3.6Total 277 100.0

8
We asked respondents their state of origin as well as the type of geographic
location they grew up in (e.g. rural, urban). Table 8 presents these results.
Table 8: Student Birthplace and Residence N=303
Characteristics Frequency PercentBIRTHPLACECalifornia 204 67.3U.S. (Excluding CA) 86 28.4Other 13 4.3Total 303 100.0
TYPE OF AREARural Area 116 38.8Suburban Area 116 38.8Urban Area 61 20.1Other 10 3.3Total 303 100.0

9Respondents were also asked to classify their major as Natural Science, Social
Science, Undeclared, or Other. We have listed this information in Table 9 under Area of
Study. Additionally Table 9 also indicates students’ individual majors.
Table 9: Area of Study and Major of Students
Characteristics Frequency PercentGENERAL AREA OF STUDYNatural Sciences 155 51.5Social Sciences 100 33.0Undeclared 6 2.0Other 40 13.3Total 301 100.0
MAJORWildlife 69 23.1Political Science 26 8.7Forestry 22 7.4Psychology 22 7.4Fisheries 22 7.4Art/Film/Theater 16 5.4Sociology 16 5.4Philosophy 15 5.0Social Work 12 4.0Biology/Zoology 10 3.3Environmental Science 9 3.0English/Journalism/Comm. 9 3.0Natural Resources Planning 8 2.7Oceanography 7 2.3Rangeland Resource Science 6 2.0Business/Economics 5 1.7Kinesiology 3 1.0Other 22 7.4Total 299 100.0
Most (82.5%) of our sample reported their ethnicity as White/Anglo and over
two-thirds (70.4%) of our sample claimed to be between the ages of 18 and 25. More
than half (51.8%) of our sample reported their class standing as Senior and 70.4% stated
that they are from California. The large percentage of seniors is not surprising since we
sample upper division classes. The same percentage of respondents reported growing up
in a rural area (38.8%) as growing up in a suburban area (38.8%). More than one-half
(51.5%) of respondents majored in the natural sciences while one-third (33.0%) reported
being in the social sciences.
The next section of this report features data provided by students on the subject
matter of spirituality, religion, harmony, belief, and faith. Respondents were asked

10questions on these topics in order to get an idea of how students think, believe, and feel
about these topics.
Spirituality and Faith
Respondents were asked several questions regarding spirituality, faith, and
religion. These questions attempted to measure respondent’s personal experiences and
convictions with these topics. The following tables summarize the results of these
questions.
Table 10 shows the results to three questions regarding spirituality and harmony.
Students were asked if they consider themselves a spiritual person and then they were
asked “Why or why not?” Respondents were also asked the frequency at which they feel
deep inner peace or harmony.
Table 10: Spirituality
Characteristics Frequency PercentSPIRITUAL?Yes 221 74.9No 74 25.1Total 295 100.0
EXPLANATION FOR SPIRITUALITYBelief in a Higher Power 34 19.2Belief in God and/or Afterlife 31 17.5Feel Connection to all things 9 5.1Feel Connection to the Environment 11 6.2Other 92 52.0Total 177 100.0
EXPLANATION FOR NO SPIRITUALITYRational Being 8 14.3Believe Only in Physical Reality 6 10.7Conflicting Beliefs 2 3.6Never Thought About it Before 2 3.6Other 38 67.9Total 56 100.0
HARMONY AND PEACE IN LIFENever or almost never 11 3.7Once in a while 90 30.0Most days 132 44.0Everyday 42 14.0Many times a day 25 8.3Total 300 100.0

11Table 11 summarizes the responses from questions regarding faith. Students
were asked if they “believe in a God who watches over them” and whether or not “the
events of September 11, 2001 renewed their faith in some way.” Finally, respondents
were asked if they have ever had a significant gain in their faith. Students were given a
five point Likert-scale set of response categories for the first two questions that ranged
from strongly disagree, disagree, neither agree nor disagree, agree, and strongly agree.
The remaining question was asked in yes or no form. Table 11 summarizes the answers to
these questions.
Table 11: Faith
Responses Frequency PercentBELIEF IN GODStrongly Disagree 66 22.0Disagree 31 10.3Neither Agree nor Disagree 90 30.0Agree 59 19.7Strongly Agree 54 18.0Total 300 100.0
EXPERIENCE WITH GAINS IN FAITHYes 141 48.5No 150 51.5Total 291 100.0
SEPT 11, 2001 RENEWED FAITHStrongly Disagree 99 33.2Disagree 64 21.5Neither Agree nor Disagree 115 38.6Agree 18 6.0Strongly Agree 2 0.7Total 298 100.0
In order to gain a better understanding of respondent’s experiences with
spirituality and faith, we asked respondents two questions regarding the role of religion in
their life. The first question asked students to specify their religion. Table 12 indicates
the religious preferences of respondents in our sample.

12
Table 12: Religious Faith N=283
Responses Frequency PercentRELIGION
No Religion 146 51.6
Protestant 22 7.8
Catholic 33 11.7
Jewish 4 1.4
Islamic 1 0.4
Buddhist 5 1.8
Mormon 5 1.8
New Age 2 0.7
Other 65 23.0
Total 283 100.0
Table 12 shows that an overwhelming 51.6% of respondents reported having “no
religion.” Many respondents (23.0%) chose “other” as their religion. We realized, as
researchers, that the percentage for “other” is so high because we failed to include the
response category of Christian on our list of choices. Many respondents that chose
“other” wrote-in that they are Christian.
Next, students were asked what their religion is and then asked to rate the strength
of their religious belief on a four-point scale ranging from very, somewhat, not very, and
not at all.
Table 13: Strength of Religious Belief N=285
Responses Frequency PercentSTRENGTH OFRELIGIOUS BELIEFNot at all 112 39.3Not very 69 24.2Somewhat 75 26.3Very 29 10.2Total 285 100.0
About three-quarter (74.9%) of respondents reported being spiritual. One-fifth
(19.7%) of respondents “agreed” that there is a God who watches over them while
another one-fifth (22.0%) “strongly disagreed” that there is a God who watches over
them. Almost half (44.0%) reported feeling peace and harmony “most days” while
another one-third (30.0%) reported feeling peace and harmony only “once in a while.”

13Over one-half (51.6%) of respondents reported having no religious affiliation. About
one-fourth (26.3%) of respondents reported being “somewhat” religious, another one-
fourth (24.2%) reported being “not very” religious, and 39.3% reported being “not at all”
religious.
Personal Forgiveness
Respondents were asked many questions regarding their personal experiences
with forgiving others. These questions attempted to measure the general reasons why
people choose to forgive or not to forgive someone. Additionally, respondents were
asked a question regarding their own potentially “hurtful” behavior towards others. The
following four tables present the results to these questions.
Table 14 is the first of two tables that reports the results to questions regarding
forgiving behavior. Students were asked about their ability to forgive people who have
hurt them and the ease of making up with people who have hurt them. Additionally,
respondents were asked whether or not they think that apology and forgiveness could
help to resolve or heal the relationship between a victim (hurt person) and a victimizer
(person that caused the hurt).
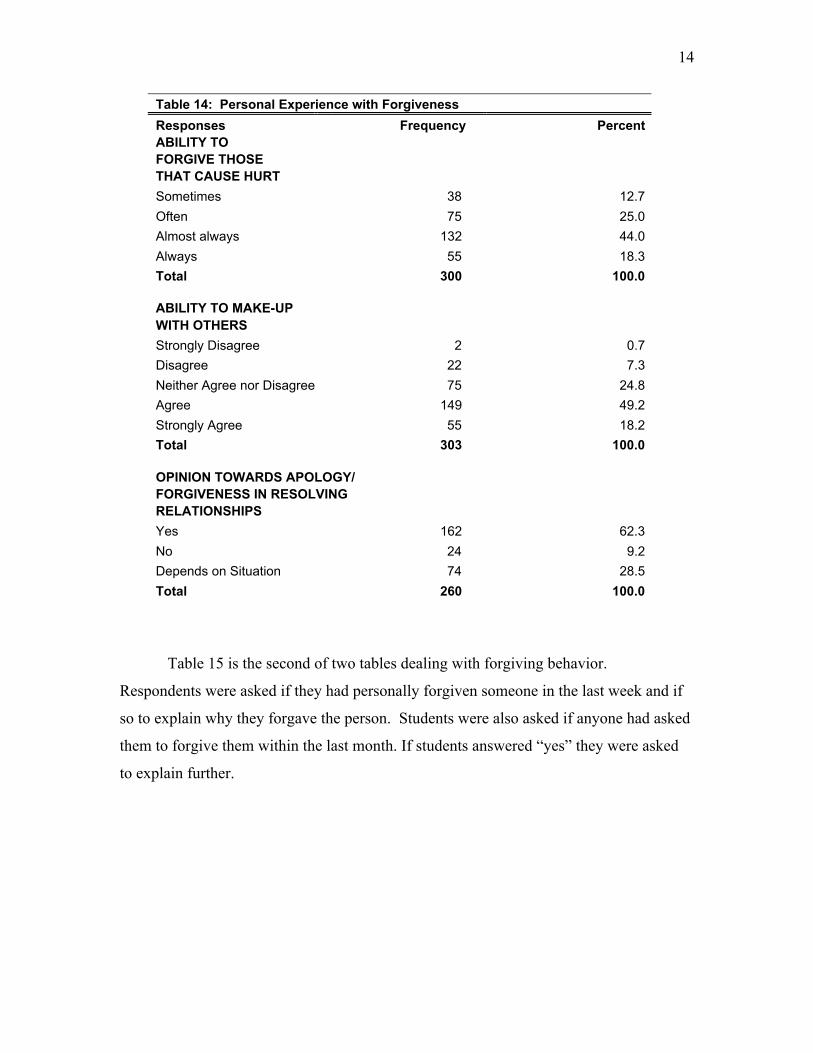
Table 14 shows that the largest number of respondents “almost always” (44.0%)
forgive those that hurt them. One-fourth (25.0%) of students reported that they “often”
forgive and 18.3% “always” forgive those that have hurt them.
14
Table 14: Personal Experience with Forgiveness
Responses Frequency PercentABILITY TOFORGIVE THOSETHAT CAUSE HURT
Sometimes 38 12.7
Often 75 25.0
Almost always 132 44.0
Always 55 18.3
Total 300 100.0
ABILITY TO MAKE-UPWITH OTHERS
Strongly Disagree 2 0.7
Disagree 22 7.3
Neither Agree nor Disagree 75 24.8
Agree 149 49.2
Strongly Agree 55 18.2
Total 303 100.0
OPINION TOWARDS APOLOGY/FORGIVENESS IN RESOLVINGRELATIONSHIPS
Yes 162 62.3
No 24 9.2
Depends on Situation 74 28.5
Total 260 100.0
Table 15 is the second of two tables dealing with forgiving behavior.
Respondents were asked if they had personally forgiven someone in the last week and if
so to explain why they forgave the person. Students were also asked if anyone had asked
them to forgive them within the last month. If students answered “yes” they were asked
to explain further.

15
Table 15: Personal Experiences with Forgiveness
Responses Frequency PercentFORGAVE SOMEONEWITHIN LAST WEEK
Yes, forgave someone 197 65.7
No, did not forgive someone 103 34.3
Total 300 100.0
WHY THEYFORGAVE THEM
Small things are forgivable 21 11.9
They care/love them 38 21.5
They wanted to move past 28 15.8
the issue
People make mistakes 21 11.9
Miscommunication 3 1.7
Other 66 37.3
Total 177 100.0
SOMEONE ASKED FORFORGIVENESS WITHINLAST MONTH
No 181 59.7
Yes 122 40.3
Total 303 100.0
DID THEY FORGIVETHIS PERSONNo 8 6.6Yes 114 93.4Total 122 100.0
Table 15 shows that 65.7% of respondents reported forgiving someone within the
last week. Respondents gave several reasons as to why they forgave this person. Some
respondents (21.5%) reported forgiving someone within the last week because they “care
about and/or love them.” One-tenth (11.9%) of respondents reported forgiving someone
because “small things are forgivable” and another one-tenth (11.9%) reported that they
forgave someone because “people make mistakes (See Table 15). Respondents also
answered questions regarding whether or not anyone had asked them to forgive within
the last month. Table 15 presents the answers to these questions.
Respondents were asked about their experiences with not being able to forgive.
Students were asked if they had ever not been able to forgive someone for some action

16that they had done. If they answered “yes” students were asked to explain why they
were unable to forgive this person. The following Table 16 summarizes the results to
these questions.
Table 16: Unforgiving Behavior
Responses Frequency PercentNOT ABLE TO FORGIVESOMEONENo 137 46.0Yes 161 54.0Total 298 100.0
WHY UNABLE TOFORGIVE PERSONSome things unforgivable 37 26.6Treated too badly 45 32.4Broke trust 11 7.9They are mean 4 2.9Other 42 30.2Total 139 100.0
Since respondents had been asked about their experiences with forgiving others,
we thought it would be interesting to examine respondents’ experiences regarding their
own hurtful behavior. Students were asked if they had done or said anything in the last
month that could have hurt someone and if they answered “yes” they were asked to
explain further. The following Table 17 presents the results to this inquiry.
Table 17: Hurting Behavior within Last Month
Responses Frequency PercentHURT SOMEONEWITHIN LASTMONTHYes, hurt someone 228 77.0No, did not hurt someone 68 23.0Total 296 100.0
IF YES, HOW DIDTHEY HURT THISPERSONHurtful remark/behavior 88 47.8Having an argument 15 8.2Wasn't thinking clearly 14 7.6Honesty is the best policy 11 6.0Other 56 30.4Total 184 100

17Almost one-half (44.0%) of respondents reported “almost always” forgiving
those that have caused hurt and another one-fourth (25%) reported “often” forgiving
those that have caused hurt. About one-half (49.2%) of respondents reported “agreeing”
that they have the ability to make-up with others easily. Another one-fifth (18.2%)
reported “strongly agreeing” that they have the ability to make-up with others easily.
Almost two-thirds (62.3%) of students sampled reported that forgiveness and apology can
help to resolve or heal a relationship while 28.5% reported that it would “depend on the
situation.” Two-thirds (65.7%) of students sampled reported that they forgave someone
within the last week and out of that 65.7% one-fifth (21.5%) reported that they did so
because they care or love the person they forgave. Two-fifths (40.3%) of the sample
reported that they were asked to forgive someone within the last month. Of that group
almost all (93.4%) of them chose to forgive the person. Over three-quarters (77.0%) of
the sample reported that they hurt someone within the last month. Almost one-half
(47.8%) of that group reported that they hurt them by saying a hurtful remark or by
engaging in a hurtful behavior.
Public Forgiveness
This section on public forgiveness highlights student’s responses to several non-
personal questions regarding forgiveness. Students were asked many questions related to
public issues and forgiveness. Respondents were asked questions surrounding the issue
of when forgiveness should be asked for and when it should be granted. The two areas of
public forgiveness that this study focused on are environmental issues and terrorism.
Environmental Issues and Forgiveness
Respondents were asked questions about issues related to environment and
forgiveness because such issues have been known to generate conflict in the local
community. Respondents were asked three questions regarding different environmental
issues and forgiveness. These questions attempted to measure how respondents feel
about the environment. The following table is a summary of these three questions.

18
Table 18: Opinion Towards Environmental Issues and Forgiveness
Responses Frequency PercentENVIRONMENTAL ACTIVISTSSHOULD ASK FORFORGIVENESSStrongly DisagreeDisagree 112 37.5Neither Agree nor Disagree 58 19.4Agree 101 33.8Strongly Agree 23 7.7Total 5 1.7
299 100.0TIMBER INDUSTRYSHOULD ASKFOR FORGIVENESSStrongly DisagreeDisagree 67 22.3Neither Agree nor Disagree 85 28.2Agree 108 35.9Strongly Agree 25 8.3Total 16 5.3
301 100.0TIMBER MILLS SHUTDOWNFOR DESTROYING NATUREStrongly DisagreeDisagree 46 15.4Neither Agree nor Disagree 99 33.2Agree 99 33.2Strongly Agree 38 12.8Total 16 5.4
298 100.0
Terrorism and Forgiveness
Since the events of September 11, 2001 had such a major impact on American
society we asked HSU students about their attitudes on forgiveness and responsibility
relative to the events of September 11, 2001. A main goal of this study was to examine
student attitudes on forgiveness in a post-September 11, 2001 environment. Therefore a
series of questions were developed to measure both general and specific attitudes towards
forgiveness. Respondents were asked many questions regarding their opinion towards
who should ask for forgiveness for 9/11 as well as whether or not they could personally
forgive the actual September 11th attackers. The following two tables summarize the
results to these questions.

19
Table 19: Sept.11, 2001 Terrorist Attacks and Forgiveness
Responses Frequency PercentTERRORISTS NEED TOASK FOR FORGIVENESSStrongly Disagree 27 9.1Disagree 52 17.4Neither Agree nor Disagree 89 29.9Agree 73 24.5Strongly Agree 57 19.1Total 298 100.0
AMERICANS NEED TOASK FOR FORGIVENESSStrongly Disagree 24 8.0Disagree 27 9.0Neither Agree nor Disagree 92 30.7Agree 88 29.3Strongly Agree 69 23.0Total 300 100.0
PERSONALLY FORGIVING9/11 ATTACKERSStrongly Disagree 37 12.3Disagree 43 14.3Neither Agree nor Disagree 96 32.0Agree 92 30.7Strongly Agree 32 10.7Total 300 100.0
SOMEONE NEEDS TO BEFORGIVEN FOR 9/11Strongly Disagree 31 10.5Disagree 41 13.9Neither Agree nor Disagree 131 44.6Agree 62 21.1Strongly Agree 29 9.9Total 294 100.0
Respondents were asked, “based on Sept.11, who needs to ask for forgiveness?”
and then they were asked “why?” and to “explain.” Table 20 presents the results to these
questions.

20
Table 20: Forgiveness Regarding Sept. 11, 2001: Who and Why?
Responses Frequency PercentWHO SHOULD ASKFOR FORGIVENESS
No one 44 18.6
Everyone 42 17.7
The United States 38 16.0
Osama bin Laden/The Terrorists 10 4.2
The U.S. and the Terrorists 50 21.1
Those Responsible 15 6.3
Not Sure 6 2.5
Other 32 13.5
Total 237 100.0
WHY SHOULD THEYASK FORGIVENESS
The United States 25 12.4deserved the attacks
The Terrorists killed 17 8.5innocent people
Both sides have 43 21.4committed wrongs
Can't blame just 3 1.5one entity
Other 113 56.2
Total 85 100.0
The largest number of respondents reported either “strongly disagreeing” (37.5%)
or “disagreeing” (19.4%) with the statement that “environmental activists need to ask for
forgiveness because their protest actions have put many people out of business” (Table
18). Slightly over one-fifth (22.3%) of respondents reported “strongly disagreeing” and
another 28.2% reported “disagreeing” that “people who work in the timber industry need
to ask the public for forgiveness because they participate in an industry that involves
cutting down trees” (Table 18).
About one-fourth (24.5%) of respondents “agreed” that “the terrorists who
attacked the United States need to ask for forgiveness because their actions against
America resulted in the death of many people” (Table 19). Almost one-third (29.3%) of

21respondents reported “agreeing” with the statement “Americans need to ask for
forgiveness because we bombed Afghanistan and killed innocent people” while another
23.0% reported “strongly agreeing” with this statement (Table 19). Almost one-third
(30.7%) of respondents reported that they could “forgive those who attacked the United
States on September 11, 2001,” while another 10.7% “strongly agreed” that they could
forgive (Table 19). When asked about who should ask for forgiveness for the events of
September 11, 2001 the largest amount (21.1%) of respondents reported that both the
“United States and the terrorists involved in 9/11” need to ask for forgiveness (Table 20).
Altruism
Altruism refers to the notion that people may act selflessly on behalf of others. In
our current globalized world acts of altruism seem to be declining while acts of self-
interest seem to be on the rise. A goal of this study was to measure the frequency of
altruistic behavior among respondents. Therefore, respondents were asked questions
about the frequency of altruistic behavior practiced in their lives as well as whether they
feel a sense of responsibility for reducing pain and suffering in the world. Tables 21 and
22 present the results to these inquiries.
Table 21 on the previous page illustrates that the largest amount (40.6%) of
respondents reported that they “neither agree nor disagree” that they “feel a deep sense of
responsibility for reducing pain and suffering in the world.” Almost one-third (29.9%)
reported “agreeing” that they “feel a deep sense of responsibility for reducing pain and
suffering in the world” and 14.4% “strongly agreed” with this statement.
Table 21: Responsibility for Reducing N=298 Pain and Suffering in the World
Responses Frequency Percent
Strongly Disagree 12 4.0
Disagree 33 11.1
Neither Agree nor Disagree 121 40.6
Agree 89 29.9
Strongly Agree 43 14.4
Total 298 100.0

22Next, respondents were asked how frequently they participated in each of ten
altruistic situations using a five point Likert-scale set of response categories that ranged
from never (1), once (2), more than once (3), often (4), and very often (5).
Table 22 on the following page shows that the largest amount (40.6%) of
respondents reported that they “neither agree nor disagree” that they “feel a deep sense of
responsibility for reducing pain and suffering in the world.” Almost one-third (29.9%)
reported “agreeing” that they “feel a deep sense of responsibility for reducing pain and
suffering in the world” and 14.4% “strongly agreed” with this statement. More than one-
half (58.7%) of students sampled reported that they have “given money to a charity more
than once” and one-half (55.1%) of respondents also reported that they have “given
money to a stranger who needed it (or asked for it) more than once.”
Almost half (44.9%) of respondents reported that they have “often” allowed
someone to go ahead of them in line and another 36.4% reported that they have allowed
someone to go ahead of them “more than once.” One-third (35.6%) of respondents
reported helping an elderly person across the street “more than once” while another one-
third (31.1%) reported having “never” helped someone across the street. Over one-half
(51.2%) of students reported they have bought something unnecessary “more than once”
because they knew it was for a good cause.

23
Tab
le 22: Freq
uen
cy of A
ltruistic
Beh
avior A
mo
ng
Resp
on
den
ts
NE
VE
RN
EV
ER
ON
CE
ON
CE
MO
RE
MO
RE
OF
TE
NO
FT
EN
A L
OT
AL
OT
TO
TA
LT
OT
AL
TH
AN
ON
CE
TH
AN
ON
CE
Altru
istic Situ
ation
Frequency
Percent
Frequency
Percent
Frequency
Percent
Frequency
Percent
Frequency
Percent
Freq
uen
cyP
ercent
#1 %G
iven Money to C
harity29
10.121
7.3169
58.754
18.815
5.2288
100.0
#2 %G
iven Money to
Stranger
175.7
217.1
16355.1
7525.3
206.8
296100.0
#3 %V
olunteered for Charity
3411.8
4615.9
12844.3
5117.6
3010.4
289100.0
#4 %A
llowed S
tranger to Go
31.0
3.01.0
10736.4
13244.9
4916.7
294100.0
Ahead of them
in Line
#5 %O
ffered Their S
eat to a36
13.025.0
9.0114
41.270
25.332
11.6277
100.0
Stranger that w
as Standing
#6 %T
old Clerk that they
were
4215.3
579.9
12947.1
5720.8
196.9
274100.0
Undercharged for an item
#7 %H
elped Som
eone Move
113.8
206.9
12744.1
8930.9
4114.2
288100.0
#8 %H
elped Classm
ate with
155.1
124.1
13245.2
9632.9
3712.7
292100.0
Hom
ework A
ssignment
#9 %O
ffered Help to E
lderlyor
8431.1
3111.5
9635.6
3914.4
207.4
270100.0
Disabled P
erson Crossing
the Street
#10 %B
ought Unnecessary
3612.8
3311.7
14451.2
4817.1
207.1
281100.0
Product to B
enefit a
Good C
ause

24
Results
Student’s general area of educational study (natural science or social science) was
correlated with independent variables from our survey. We correlated student’s general
area of educational study with the following concepts: altruism, spirituality and faith,
personal forgiveness, public forgiveness (which includes issues related to the
environment and terrorism). Statistical analysis of the results was conducted using t-
tests and chi-square.
Spirituality and Faith
Students were asked two questions about their spirituality and faith. Responses
were measured by a simple “yes” or “no.” The following Table 23 shows a chi-square
for social science and natural science students on these two spiritual and faith variables.
No significant difference was observed between these two groups. A relatively equal
percentage of social science (78.1%) and natural science (73.5%) students consider
themselves to be spiritual. Additionally, a relatively equal percentage of social science
(44.3%) and natural science (48.6%) students reported having had a significant gain in
their faith at some point in their lives.
Table 23: Spirituality and Faith by General Area of Educational Study
Question Response General Area of Chi-Square Level ofEducational Study Significance
NaturalScience
SocialScience (two-sided)
N=151 N=96Do you consider Yes 111 (73.5%) 75 (78.1%)yourself to be a 0.672 0.412spiritualperson? No 40 (26.5%) 21 (21.9%)
N=148 N=97Have you everhad Yes 72 (48.6%) 43 (44.3%)a significantgain 0.439 0.508in your faith? No 76 (51.4%) 54 (55.7%)
Respondents were asked three questions about their religious and spiritual
attitudes. Responses were measured on a five-point scale, with 1 representing strongly
disagreeing and 5 representing strongly agreeing with the statement. For all three

25
variables a two-sample t-test was used. Table 24 compares the means for natural science
and social students. As the two-sample t-test indicates, the means of natural science
students did not differ significantly from the means of social science in regards to the
three variables listed below.
Table 24: A Comparison of Means of Religious and Spiritual Attitudes By General Area of Educational Study
QuestionMeans
(Range 1-5) t Level ofNatural Science Social Science Significance
N=150 N=100 (two-tailed)Mean SD Mean SD
Do you consider 3.06 1.015 3.04 1.026 0.131 0.896yourself to be religious?
I believe in a God who 3.01 1.307 3.12 1.465 0.591 0.555watches over me
I feel deep inner peace 2.92 0.966 3.01 0.953 0.769 0.443or harmony
Personal Forgiveness
Respondents were asked many questions relating to forgiveness that involves
interpersonal interactions. These questions attempted to measure whether students have
chosen to forgive or not to forgiven someone. Additionally, students were asked a
question regarding their own potentially “hurtful” behavior towards others.
Table 25 on the following page indicates that natural science and social science
students significantly differed in personal forgiveness on one variable; whether or not
they had personally hurt someone within the last month. A significantly higher
percentage of social science students (85.7%) reported in the last month that they have
done something that could have hurt someone compared to the percentage of natural
science students (70.7%) that reported the same experience (p-value=.006). As Tables 25
shows, natural science and social science students did not differ on any other variables
dealing with personal forgiveness.

26
Table 25: Personal Experiences with Forgiveness by General Area of Educational Study
Question Response General Area Chi-Square Level ofof Educational Study Significance
Natural Science Social Science (two-sided)N=150 N=98
In the last month Yes 106 (70.7%) 84 (85.7%)have you doneanything 7.491 0.006that could have hurt No 44 (29.3%) 14 (14.3%)someone?
N=153 N=98In the last week have Yes 99 (64.7%) 67 (68.4%)you forgiven someone 0.358 0.55for something that No 54 (35.3%) 31 (31.6%)they have done?
N=154 N=100In the last month Yes 58 (37.7%) 46 (46.0%)has anyone asked 1.743 0.117you to forgive them? No 96 (62.3%) 54 (54.0%)
N=58 N=46If someone did ask you Yes 56 (96.6%) 42 (91.3%)to forgive them withinthe 1.299 0.236last month, did you No 2 (3.4%) 4 (8.7%)forgive them?
N=151 N=98Have you ever not Yes 80 (53.0%) 52 (53.1%)been able to forgive 1.551 0.461someone for something No 71 (47.0%) 46 (46.9%)they have done?
N=132 N=86Do you think thatapology Yes 82 (62.1%) 55 (64.0%)and forgiveness canhelpto resolve or heal a No 10 (7.6%) 11 (12.8%) 2.438 0.296relationship between avictim and victimizer? Depends 40 (30.3%) 20 (23.3%)
N=154 N=100I am able to Agree/ 101 (65.6%) 68 (68.0%)make-up pretty Strongly Agreeeasily with peoplewho have hurt me Neither Agree 39 (25.3%) 25 (25.0%) 0.376 0.828in some way Nor Disagree
Disagree/ 14 (9.1%) 7 (7.0%) Strongly Disagree
N=153 N=98Always 28 (18.3%) 18 (18.4%)
I have forgiventhose who have Almost Always 66 (43.1%) 42 (42.9%)hurt me 1.626 0.653
Often 43 (28.1%) 23 (23.5%)
Sometimes 16 (10.5%) 15 (15.3%)

27
Public Forgiveness
The area of public forgiveness includes issues that are relevant to all of society
and are larger than the individual. In our study the area of public forgiveness included
questions on the environment and terrorism.
Environmental Issues and Forgiveness
Environmental issues are very charged in Humboldt County. In our survey we
asked students a variety of questions related to the timber industry and environmental
activism. These two topics were chosen because they often generate local controversy.
Table 26 indicates students’ general area of educational study (natural science or social
science) had a significant relationship with two environmental variables. The majority of
natural science majors (65.4%) disagree or strongly disagree with the notion that the
timber mills should be closed down because they involve the destruction of nature, while
only 36.7% of social science students felt this same way.
This difference between natural science and social science students was found to
be statistically significant. The second question that was examined also revealed a
significant difference between natural science and social science students. A majority of
natural science students (58.8 %) disagree or strongly disagree that people in the timber
industry need to ask for forgiveness because their industry involves the destruction of
trees, while only 44.0% of social science students felt this same way. A majority of both
social science (53.5%) and natural science students (57.5%) disagree or strongly disagree
that environmental activists need to ask for forgiveness because their protest actions put
many people out of business.

28
Table 26: Environmental Issues and Forgiveness by General Area of Educational Study
Question Response General Area Chi-Square Level of of Educational Study Significance
NaturalScience
SocialScience (two-sided)
N=153 N=98
Agree/ 21 (13.7%) 19 (19.4%)The timber mills Strongly Agreeshould be closeddown becausethey Neither Agree 32 (20.9%) 43 (43.9%) 20.777 0.001involve the Nor Disagreedestruction ofnature
Disagree/ 100 (65.4%) 36 (36.7%)
StronglyDisagree
N=153 N=100People in thetimber Agree/ 13 (8.5%) 18 18.0%)industry need to Strongly Agreeask the public for 7.458 0.024forgivenessbecause Neither Agree 50 (32.7%) 38 (38.0%)they participate inan Nor Disagreeindustry thatinvolvescutting down trees Disagree/ 90 (58.8%) 44 (44.0%)
StronglyDisagree
N=153 N=99Environmental Agree/ 15 (9.8%) 9 (9.1%)activists need toask Strongly Agreefor forgiveness 0.586 0.746because theirprotest Neither Agree 50 (32.7%) 37 (37.4%)actions have put Nor Disagreepeople out ofbusiness Disagree/ 88 (57.5%) 53 (53.5%)
StronglyDisagree
Terrorism and Forgiveness
The following Table 27 presents natural science and social science mean scores
on a variety of questions relating to terrorism and forgiveness. Responses were measured
on a five-point scale, with 1 representing strongly disagreeing and 5 representing strongly

29
agreeing with the statement. For all three variables a two-sample t-test was used. As
Tables 27 shows, natural science and social science students did not differ on any
variables dealing with terrorism and forgiveness.
Table 27: A Comparison of Means of Attitudes on Terrorism and Forgiveness By General Area of Educational Study
Question Means (Range 1-5) t Level ofNatural Science Social Science Significance
N=152 N=100 (two-tailed)Mean SD Mean SD
Terrorists need toask for forgivenessbecause they attacked 3.36 1.195 3.24 1.231 0.774 0.44America and killedmany people
Americans need to askfor forgiveness because 3.50 1.215 5.54 1.146 0.255 0.799we bombed Afghanistanand killed people
I can forgive those whoattacked the U.S. on 3.06 1.169 3.16 1.204 0.658 0.511Sept. 11, 2001
Based on the events ofSept. 11, 2001 2.99 1.067 3.09 1.063 0.775 0.439someone needs to beforgiven
Altruism
Table 28 presents natural science and social science mean scores on a variety of
questions related to altruism. Responses were measured using a five point Likert-scale
set of response categories that ranged from never (1), once (2), more than once (3), often
(4), and very often (5). Table 28 indicates that social and natural science students
differed in altruistic behavior for three variables: volunteer work, giving money to a
stranger, and buying a product for a good cause. Table 28 indicates that social science
students (mean=3.27) have done volunteer work for charity significantly more than
natural science students (mean=2.83), (t=3.038, p=0.003). Social science students
(mean=3.40) have also given money to a stranger who needed it or asked for it
significantly more than natural science students (mean=3.05), (t=3.081, p=0.002) and
social science students (mean=3.12) have also bought a product that they didn’t need

30
because it was for a good cause significantly more than natural science students
(mean=2.83), (t=2.008, p=0.046).
Table 28: A Comparison of Means of Altruistic Behavior by General Area of Educational Study
Question Means (Range 1-5) t Level ofNaturalScience Social Science Significance
N=145 N=90 (two-tailed)Mean SD Mean SD
I have done volunteer 2.83 1.143 3.27 1.049 3.038 0.003work for charity
I have given money to 3.05 0.885 3.40 0.886 3.081 0.002a stranger who neededit or asked for it
I have bought a product 2.83 0.922 3.12 1.163 2.008 0.046that I didn't needbecause it was fora good cause
I have given money to 3.01 0.860 3.09 1.028 0.565 0.573charity
I have allowed someone 3.78 0.682 3.69 0.916 0.821 0.413to go ahead of mein line
I have offered my seat 3.12 1.151 3.14 1.123 0.142 0.888on a bus or train toa stranger who wasstanding
I have helped a class- 3.54 0.850 3.37 1.016 1.361 0.175mate with a home-work assignment
Discussion
In regards to spirituality, religion, and faith, social science and natural science
students did not differ significantly in their attitudes or experiences. An explanation for
this could be because these topics are not controversial amongst social or natural science
students and therefore no difference would be expected between these groups.
Next, social science and natural science students differed significantly on the
personal forgiveness variable that asks whether respondents have hurt someone within

31
the last month. Almost two-thirds (70.7%) of natural science students reported hurting
someone while 85.7% of social science respondents reported hurting someone within the
last month.
Social science and natural science students differed significantly on two
environment and forgiveness variables. The first question that came up significant asked
respondents if they think that the timber mills should be shut down because they involve
the destruction of nature. A majority of natural science majors (65.4%) disagreed or
strongly disagreed with this statement, while only 36.7% of social science majors felt this
same way. The second question that came up significant asked students if they think that
people in the timber industry need to ask for forgiveness because they are involved in an
industry that involves cutting down trees. Once again a majority of natural science
majors (58.8%) disagreed or strongly disagreed with this statement, while only 44.0% of
social science majors felt this same way. These significant differences between social
science and natural science majors in regards to the environment and forgiveness can best
be explained by the fact that natural science majors have a more direct relationship with
the environment than social science students. Due to this closer relationship with the
environment, natural science majors have a better understanding of the timber industries
function in society. Most natural science students felt that the timber mills should not
shut down and the people who work in them should not have to ask for forgiveness.
In regards to terrorism and forgiveness, social science and natural science students
did not differ significantly in their attitudes. The terrorism and forgiveness variables used
asked students about September 11th, the U.S. invasion of Afghanistan, and terrorists
attacking our country without reference to 9/11.
Finally, social science and natural science students differed significantly in
regards to three altruism variables. The first question that was found to be significant
asked students how frequently they had done volunteer work. It was found that social
science students volunteer more frequently than natural science students at the p=0.001
level. The second question that was found to be significant asked students how
frequently they had given money to a stranger. Our independent-sample t-test found that
social science students give money to strangers significantly more than natural science
students at the p=0.002 level. The third question that was found to be significant asked
students how frequently they had bought a product they didn’t need because they knew it
was for a good cause. The t-test showed that social science students bought a product

32
they didn’t need significantly more frequently than natural science students at the
p=0.046 level.
These differences between natural science and social science majors in regards to
altruism can perhaps be explained by the fact that many social science majors study
concepts such as social inequality and social change. Perhaps social science majors
volunteer more and give more of their money to strangers than natural science majors
because they see it as a small form of social change being used to help combat social
injustice.