a survey of soil attributes in north dakota by landscape ... · pdf filea survey of soil...
TRANSCRIPT

A Survey of Soil Attributes in North Dakota by Landscape Position
D. W. Franzen,* T. Nanna, and W. A. Norvell
ABSTRACTLand surveys of soil attributes can provide valuable information on
the geographic distribution of important soil attributes and summarizethe levels found. Landscape position can have a major influence onsoil attributes. Consideration of field landscape variables in selectingsampling locations and interpreting results, even in large-scale surveys,should help to reduce unexplained variability in many soil attributes.We report the results of a survey of selected soil attributes in agricul-tural fields across North Dakota at sites selected within each field bylandscape position. Our objective was to determine if this samplingdesign might contribute to a better understanding of the distributionof soil attributes. Soils from two or three fields within each of the53 counties of North Dakota were sampled in 1996. Within each field,three samples of surface soil (0–15 cm) were obtained. One sample wascollected from an upland position, one from a slope, and one froma depression. Each field was georeferenced using a differentially cor-rected GPS receiver. The samples were analyzed for DTPA (diethyl-enetriaminepentaacetic acid)-extractable Cu, Zn, and Cd; watersoluble B and Se; and soil pH. Mapping and analysis showed distinctregional patterns of all soil factors. Some soil attributes, including pHand extractable Zn, Cu, and Cd, exhibited a strong relationship to fieldlandscape position, while soluble B and Se were less related. The re-sults suggest that separating field sampling locations into upland,sloping, and depressional areas will reduce the confounding effects offield landscape position on larger-scale spatial trends in soil attributes.
MAPPING IS A POWERFUL TOOL for understanding thegeographic distribution of soil attributes at any
scale. National maps help delineate regions that tendto have higher or lower levels of certain properties(Holmgren et al., 1993; White et al., 1997; Gustavssonet al., 2001). Within regions, states, or counties, smallerareas with specific characteristics can be more accuratelydelineated at an appropriate scale (Holmgren et al., 1993;Wu et al., 2000).Within agricultural fields, relatively smallareas can be identified as having differing soil attributesor differingmanagement needs (Franzen et al., 1998a;Wuet al., 2000). Whatever the geographic scale, there isalways a smaller scale at which variability exists (Franzenand Berglund, 1998; Pierce and Nowak, 1999; Webster,2000). Failure to understand sources of small-scale geo-graphic variability simply increases the unexplained vari-ability in data collected over larger geographic areas.Within-field variability in soil characteristics is com-
mon. Soil P and K levels (Peck and Melsted, 1973;Wollenhaupt et al., 1994; Franzen and Peck, 1995a), soilpH (Franzen and Peck, 1995b), soil organic C (Bhatti
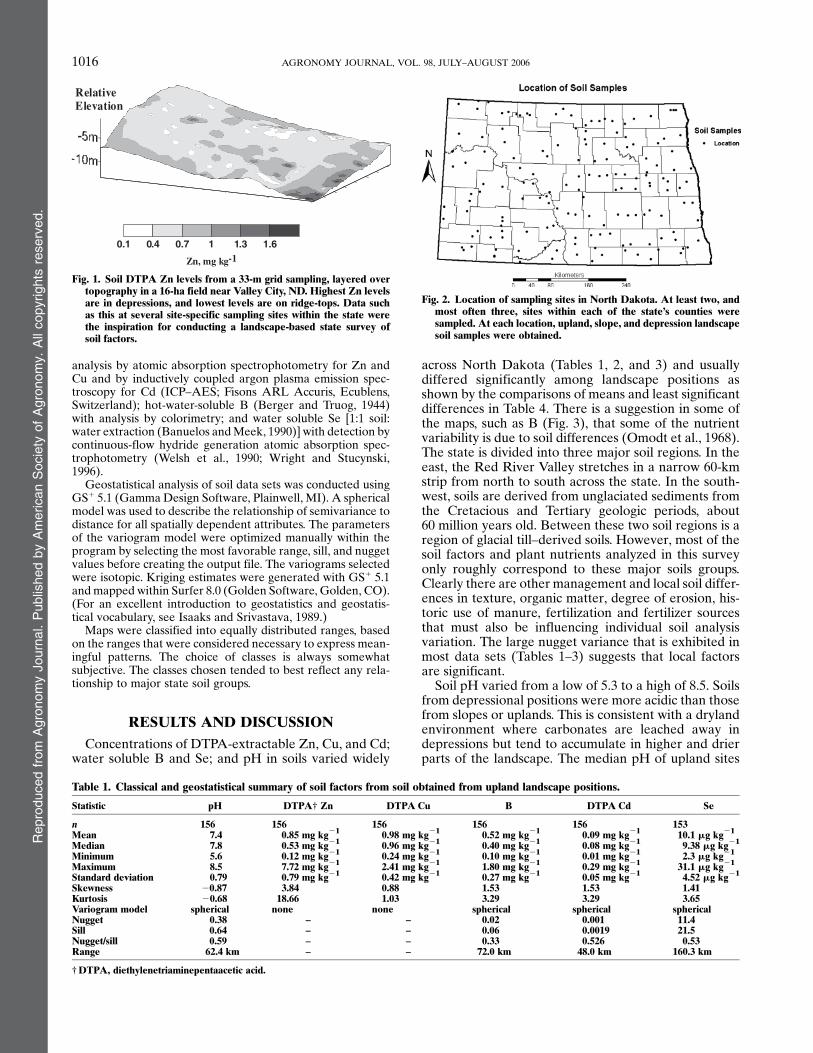
et al., 1991), chloride and Zn (Franzen et al., 1998b), andsoil nitrate (Franzen et al., 1998a) have all been found tovary spatially within farm fields. Knowledge of within-field variability in attributes contributes to more effec-tive agricultural soil management and assists also withthe design of efficient strategies for studying the dis-tribution of soil properties over larger areas. There issubstantial evidence that within agricultural fields, theplant nutrients and soil factors of interest in a generalsoil survey of North Dakota might be related to land-scape position. Copper, Zn, B, and Cd accumulate inorganic matter (Stevenson, 1991), while soil pH of theregion (Knuteson et al., 1989) and Se and Cd availabil-ity are related to some degree by hydrology, which inturn is related often to landscape position (Ruhe, 1960;Mikkelsen et al., 1989; Seiler, 1998; Wu et al., 2002).Previous site-specific soil sampling for plant nutrientsrevealed a tendency for several nutrients, including NO3,Zn (Fig. 1), and chloride to be related to landscape posi-tion (Franzen et al., 1998a, 1998b).
The first objective of our survey was to measure andmap the distribution of DTPA-extractable Zn, Cu, andCd; water soluble B and Se; and pH in soils at threedifferent landscape positions in fields across the state ofNorthDakota. Extractable forms of these trace elementsmeasured by soil-testing methods were chosen becausethese measures are much better related to plant re-sponses than are total concentrations of elements. Sec-ond, we wished to determine if the differences in thesemeasured soil characteristics in samples from upland,sloping, and depressional locations within the field land-scape were significant and sufficiently large to justify in-cluding landscape-based sampling in statewide surveysof soil characteristics.
MATERIALS AND METHODS
Soil samples were collected from each of the 53 counties inNorth Dakota during the summer of 1996. Samples wereobtained from two to three cropped fields within each county(Fig. 2) Pasture and range fields were not included in thesurvey. Each field was georeferenced using a differentiallycorrected GPS receiver (Omnistar 7000 with satellite differen-tial, Omnistar, Houston, TX), which recorded in latitude andlongitude using the coordinate system WGS-84. Within eachfield, separate samples were collected from a typical upland,sloping, and depressional location. Each sample consisted ofat least eight soil cores taken from a 0- to 15-cm depth with a2.5 cm-diam. sample tube and was composited together in thefield. No lubricant was used to obtain the samples. The sub-sample cores for each sample were obtained from an area ofabout 100m2 within each landscape position. The samples werethen air-dried and ground to pass a 2-mm sieve. The sampleswere analyzed for soil pH (1:1 soil:water paste); DTPA-extractable Zn, Cu, and Cd (Lindsay and Norvell, 1978) with
D.W. Franzen and T. Nanna, Dep. of Soil Sci., North Dakota StateUniv., Fargo, ND 58105-5758; and W.A. Norvell, USDA-ARS, U.S.Plant, Soil, and Nutrition Lab., Ithaca, NY 14853. Received 10 Oct.2005. *Corresponding author ([email protected]).
Published in Agron. J. 98:1015–1022 (2006).Spatial Variabilitydoi:10.2134/agronj2005.0283ª American Society of Agronomy677 S. Segoe Rd., Madison, WI 53711 USA Abbreviations: DTPA, diethylenetriaminepentaacetic acid.
Repro
duced
from
Agro
nom
yJourn
al.
Publis
hed
by
Am
erican
Socie
tyof
Agro
nom
y.
All
copyrights
reserv
ed.
1015
analysis by atomic absorption spectrophotometry for Zn andCu and by inductively coupled argon plasma emission spec-troscopy for Cd (ICP–AES; Fisons ARL Accuris, Ecublens,Switzerland); hot-water-soluble B (Berger and Truog, 1944)with analysis by colorimetry; and water soluble Se [1:1 soil:water extraction (Banuelos andMeek, 1990)] with detection bycontinuous-flow hydride generation atomic absorption spec-trophotometry (Welsh et al., 1990; Wright and Stucynski,1996).
Geostatistical analysis of soil data sets was conducted usingGS1 5.1 (GammaDesign Software, Plainwell, MI). A sphericalmodel was used to describe the relationship of semivariance todistance for all spatially dependent attributes. The parametersof the variogram model were optimized manually within theprogram by selecting the most favorable range, sill, and nuggetvalues before creating the output file. The variograms selectedwere isotopic. Kriging estimates were generated with GS1 5.1andmapped within Surfer 8.0 (Golden Software, Golden, CO).(For an excellent introduction to geostatistics and geostatis-tical vocabulary, see Isaaks and Srivastava, 1989.)
Maps were classified into equally distributed ranges, basedon the ranges that were considered necessary to express mean-ingful patterns. The choice of classes is always somewhatsubjective. The classes chosen tended to best reflect any rela-tionship to major state soil groups.
RESULTS AND DISCUSSIONConcentrations of DTPA-extractable Zn, Cu, and Cd;
water soluble B and Se; and pH in soils varied widely
across North Dakota (Tables 1, 2, and 3) and usuallydiffered significantly among landscape positions asshown by the comparisons of means and least significantdifferences in Table 4. There is a suggestion in some ofthe maps, such as B (Fig. 3), that some of the nutrientvariability is due to soil differences (Omodt et al., 1968).The state is divided into three major soil regions. In theeast, the Red River Valley stretches in a narrow 60-kmstrip from north to south across the state. In the south-west, soils are derived from unglaciated sediments fromthe Cretacious and Tertiary geologic periods, about60 million years old. Between these two soil regions is aregion of glacial till–derived soils. However, most of thesoil factors and plant nutrients analyzed in this surveyonly roughly correspond to these major soils groups.Clearly there are other management and local soil differ-ences in texture, organic matter, degree of erosion, his-toric use of manure, fertilization and fertilizer sourcesthat must also be influencing individual soil analysisvariation. The large nugget variance that is exhibited inmost data sets (Tables 1–3) suggests that local factorsare significant.
Soil pH varied from a low of 5.3 to a high of 8.5. Soilsfrom depressional positions were more acidic than thosefrom slopes or uplands. This is consistent with a drylandenvironment where carbonates are leached away indepressions but tend to accumulate in higher and drierparts of the landscape. The median pH of upland sites
0.1 0.4 0.7 1 1.3 1.6
Zn, mg kg-1
RelativeElevation
Fig. 1. Soil DTPA Zn levels from a 33-m grid sampling, layered overtopography in a 16-ha field near Valley City, ND. Highest Zn levelsare in depressions, and lowest levels are on ridge-tops. Data suchas this at several site-specific sampling sites within the state werethe inspiration for conducting a landscape-based state survey ofsoil factors.
Fig. 2. Location of sampling sites in North Dakota. At least two, andmost often three, sites within each of the state’s counties weresampled. At each location, upland, slope, and depression landscapesoil samples were obtained.
Table 1. Classical and geostatistical summary of soil factors from soil obtained from upland landscape positions.
Statistic pH DTPA† Zn DTPA Cu B DTPA Cd Se
n 156 156 156 156 156 153Mean 7.4 0.85 mg kg21 0.98 mg kg21 0.52 mg kg21 0.09 mg kg21 10.1 mg kg21
Median 7.8 0.53 mg kg21 0.96 mg kg21 0.40 mg kg21 0.08 mg kg21 9.38 mg kg21
Minimum 5.6 0.12 mg kg21 0.24 mg kg21 0.10 mg kg21 0.01 mg kg21 2.3 mg kg21
Maximum 8.5 7.72 mg kg21 2.41 mg kg21 1.80 mg kg21 0.29 mg kg21 31.1 mg kg21
Standard deviation 0.79 0.79 mg kg21 0.42 mg kg21 0.27 mg kg21 0.05 mg kg21 4.52 mg kg21
Skewness 20.87 3.84 0.88 1.53 1.53 1.41Kurtosis 20.68 18.66 1.03 3.29 3.29 3.65Variogram model spherical none none spherical spherical sphericalNugget 0.38 – – 0.02 0.001 11.4Sill 0.64 – – 0.06 0.0019 21.5Nugget/sill 0.59 – – 0.33 0.526 0.53Range 62.4 km – – 72.0 km 48.0 km 160.3 km
†DTPA, diethylenetriaminepentaacetic acid.
Repro
duced
from
Agro
nom
yJourn
al.
Publis
hed
by
Am
erican
Socie
tyof
Agro
nom
y.
All
copyrights
reserv
ed.
1016 AGRONOMY JOURNAL, VOL. 98, JULY–AUGUST 2006
was 7.8 whereas the median of depressional sites was7.0. The results illustrate the wide distribution of acidicsoils in the state, and the differences among landscapepositions suggest that compositing samples within a fieldcould easily obscure the presence of smaller areas ofmore acidic soils in depressional positions. This oversightcould easily have undesirable consequences related tothe efficacy, phytotoxicity, and carryover potential ofpH-dependent herbicides (Franzen and Zollinger, 1997)or overestimation of nutrient stresses. Soil pH at eachlandscape position was spatially variable across the state.The range distances for semivariograms of pH variedfrom 19 to 62 km, but the spatial relationships were notstrong as suggested by the relatively large nugget-to-sill ratios.Extractable Zn varied between 0.1 and 9.76 mg kg21
and was significantly higher in soils from depressionalpositions. Depressions generally contain higher organicmatter than other landscape positions and so would beexpected to be higher in Zn. In uplands and slopes, themean and median concentrations of Zn were below thecritical level of 1 mg kg21, used in North Dakota as abasis for recommending Zn fertilizer for sensitive crops,including corn (Zea mays L.), dry edible bean (Phase-olus vulgaris L.), flax (Linum usitatissimum L.), andpotato (Solanum tuberosum L.) (Franzen, 2003). Zincconcentrations were spatially related in soils from slopesor depressional positions but not evidently so in soilsfrom uplands for which the nugget was indistinguishablefrom the sill in the variogram model.Extractable Cu varied from 0.24 to 4.5 mg kg21. As
noted for Zn, concentrations of Cu in soils from de-pressional positions were significantly higher than from
locations higher in the landscape, probably due to higherorganic matter content. Some spring wheat (Triticumaestivum L.) responses to Cu fertilizer have been foundin the state at DTPA Cu levels below 0.40 mg kg21
(Franzen and McMullen, 1999). Concentrations of Cuwere spatially related in soils from sloping and depres-sional positions but not in samples from uplands forwhich the nugget was indistinguishable from the sill.
Cadmium levels varied from 0.01 to 0.31 mg kg21. Aswith Zn and Cu, soils from depressional positions weresignificantly higher in extractable Cd. The increased Cdlevels of depressions compared with other landscapepositions might be the result of higher organic matterlevels but may also be related to possible higher chloridelevels due to internal water movement (Franzen et al.,1998b). Comparing these values to the relationship be-tweendurumwheat grain (a grain used formanufacture ofpasta) and Cd found by Garrett et al. (2001) and Norvellet al. (2000) in a range of North Dakota soils suggeststhat some, perhapsmuch, of the durum grain produced onsoil in depressional positions could exceed the concen-tration of 0.2 mg kg21 being considered as a limit by theFAO/WHO Food Standards Program (CODEXAlimen-tarius Commission, 1999). On the other hand, durumgrain from themore extensive areas of uplands and slopeswould seem much less likely to exceed this level. Furtherstudy of the effects of landscape position on Cd levels incrops is needed to clarify these relationships. Our resultsfor Cd showed spatial dependency for soils from all land-scape positions.
Boron levels varied from 0.1 to 1.8 mg kg21. Con-centrations were spatially dependent at all landscapepositions. Differences among landscape positions were
Table 2. Classical and geostatistical summary of soil factors from soil obtained from slope landscape positions.
Statistic pH DTPA† Zn DTPA Cu B DTPA Cd Se
n 156 156 156 156 156 153Mean 7.3 0.90 mg kg21 0.98 mg kg21 0.52 mg kg21 0.11 mg kg21 9.9 mg kg21
Median 7.6 0.72 mg kg21 0.89 mg kg21 0.40 mg kg21 0.11 mg kg21 9.76 mg kg21
Minimum 5.4 0.11 mg kg21 0.27 mg kg21 0.10 mg kg21 0.01 mg kg21 2.8 mg kg21
Maximum 8.5 4.8 mg kg21 2.67 mg kg21 1.80 mg kg21 0.30 mg kg21 22.6 mg kg21
Standard deviation 0.88 0.75 mg kg21 0.46 mg kg21 0.32 mg kg21 0.05 mg kg21 3.5 mg kg21
Skewness 20.60 2.22 1.26 1.62 0.86 0.56Kurtosis 21.06 6.46 1.84 3.15 1.26 0.78Variogram model spherical spherical spherical spherical spherical sphericalNugget 0.30 0.17 0.13 0.058 0.0011 5.0Sill 0.65 0.52 0.18 0.128 0.00215 12.7Nugget/sill 0.46 0.33 0.72 0.45 0.512 0.394Range 36.5 km 46.1 km 134.4 km 480 km 24.0 km 43.2 km
†DTPA, diethylenetriaminepentaacetic acid.
Table 3. Classical and geostatistical summary of soil factors from soil obtained from depressional landscape positions.
Statistic pH DTPA Zn DTPA Cu B DTPA Cd Se
n 156 156 156 156 156 153Mean 7.0 1.77 mg kg21 1.30 mg kg21 0.62 mg kg21 0.18 mg kg21 11.4 mg kg21
Median 7.0 1.49 mg kg21 1.11 mg kg21 0.50 mg kg21 0.17 mg kg21 11.2 mg kg21
Minimum 5.3 0.21 mg kg21 0.45 mg kg21 0.10 mg kg21 0.04 mg kg21 4.2 mg kg21
Maximum 8.4 9.76 mg kg21 4.50 mg kg21 1.80 mg kg21 0.31 mg kg21 17.6 mg kg21
Standard deviation 0.86 1.21 mg kg21 0.65 mg kg21 0.33 mg kg21 0.06 mg kg21 4.2 mg kg21
Skewness 20.14 2.45 1.93 1.08 0.27 1.05Kurtosis 21.34 11.37 5.07 0.69 20.31 2.02Variogram model spherical spherical spherical spherical spherical sphericalNugget 0.36 0.60 0.01 0.035 0.0027 2.0Sill 0.61 1.38 0.34 0.077 0.0032 17.5Nugget/sill 0.59 0.44 0.03 0.45 0.84 0.11Range 19.2 km 28.8 km 9.6 km 28.8 km 28.8 km 30.7 km
Repro
duced
from
Agro
nom
yJourn
al.
Publis
hed
by
Am
erican
Socie
tyof
Agro
nom
y.
All
copyrights
reserv
ed.
1017FRANZEN ET AL.: SURVEY OF SOIL ATTRIBUTES IN NORTH DAKOTA BY LANDSCAPE POSITION

relatively small, with highest levels in depressions, prob-ably because of higher organic matter content. Cropresponses to B are uncommon in North Dakota, and B isnot usually recommended. However, this practice mayneed to be reviewed because the wide range of soil Bconcentrations from this survey includes many low val-ues that would trigger recommendations in other states.For example, in Wisconsin, critical levels of B rangefrom 0.5 mg kg21 for sands to 1.1 mg kg21 in clay soils(Kelling et al., 1998). The pattern of B levels in the stateis similar to the general soils map (Omodt et al., 1968).On the eastern edge of the state is the Red River Valley,characterized by deep, glacial-lake-bed-derived sedi-ments. This area is highest in B. In the southwest areresidual sediments from the Cretaceous and Tertiarygeologic periods. This area of the state’s oldest sedi-ments tends to be lowest in B. The glacial till area inbetween contains a wide range of values, reflective ofthe variable nature of the often water-worked sedimentsthat are the product of glacial melt.Water extractable Se levels varied from 2.3 to 31.1 mg
kg21. Little effect of landscape position was evident,although depressions tended to be higher than slopes.This might be due to more shallow water tables indepression where soluble Se might accumulate. None ofthe levels found in soils from this survey approach thosethat would cause Se in crops to reach levels toxic tohumans or livestock (Jump and Sabey, 1989). However,some of the soils may contain enough available Se toresult in a beneficial increase in the Se in food cropsgrown for human consumption (Hintze et al., 2001).The spatial relationships exhibited by our soil data were
often weak as shown by the relatively large nugget/sillratios for variograms and by the absence of a detectablerange distance for Zn or Cu in upland soils (Tables 1–3).The weakness in these spatial relations suggests that agreat deal of variability existed at smaller spatial scalesthan could be detected at the low sampling density used inthis survey. The range distances varied from a low of9.6 km forCu in depressional positions to a high of 480 kmfor B in sloping positions, but most range distances wereless than 160 km.Figures 3 through 8 show maps of soil pH, Zn, Cu, B,
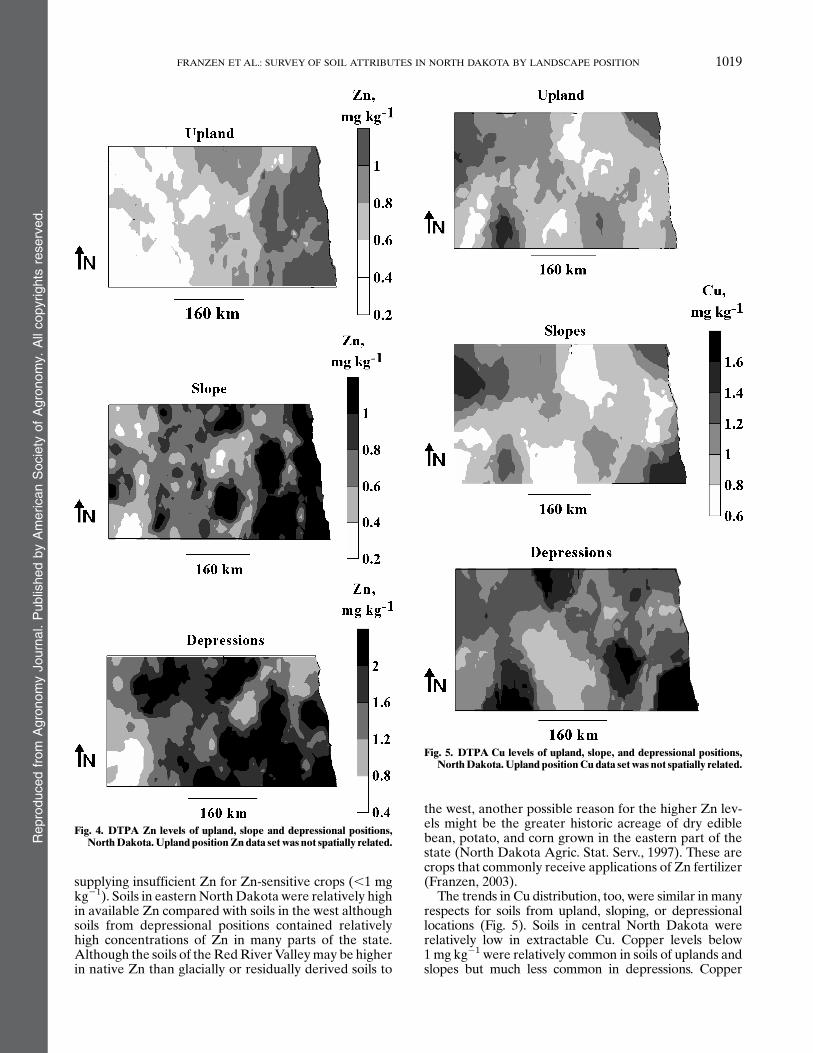
Cd, and Se levels in North Dakota. The trends in soil pHacross the state were similar for all landscape positions.The highest pH levels were found in the east, north-central, and far west (Fig. 6) where large areas within therange of 7.5 to 8 are common. In depressions, soils wereless alkaline, but high-pH values from 7.5 to 8 were stillcommon in the east. Acidic soils were found commonly
from the south-central part of the state north to theCanadian border. Lowest pH levels were found in south-central North Dakota, in unglaciated residual sedimentscommon to that area. While Fig. 6 displays major pHtrends across the state, it is important to remember thatis always necessary to test soils locally to determine thepH within individual fields or across a field landscape.
The trends in extractable soil Zn across the state werein many respects similar among uplands, slopes, and de-pressions even though the amounts generally increasedfrom upper to lower landscape positions. The lowestconcentrations for soils from each landscape positionwere found in the northwest and southwest, with exten-sive areas of upland and sloping land characterized as
Table 4. Mean levels of Cu, Zn, Cd, soil pH, B, and Se by land-scape position from the North Dakota survey.
Soil nutritional property
Landscape position pH Zn Cu B Cd Se
mg kg21mg kg21
Upland 7.4 0.85 0.98 0.52 0.094 10.1Slopes 7.3 0.90 0.98 0.52 0.110 9.9Depressions 7.0 1.77 1.30 0.62 0.175 11.4LSD 0.05 0.19 0.22 0.11 0.07 0.012 0.9
Fig. 3. Hot-water-soluble B levels in upland, slope, and depressionalpositions, North Dakota.
Repro
duced
from
Agro
nom
yJourn
al.
Publis
hed
by
Am
erican
Socie
tyof
Agro
nom
y.
All
copyrights
reserv
ed.
1018 AGRONOMY JOURNAL, VOL. 98, JULY–AUGUST 2006
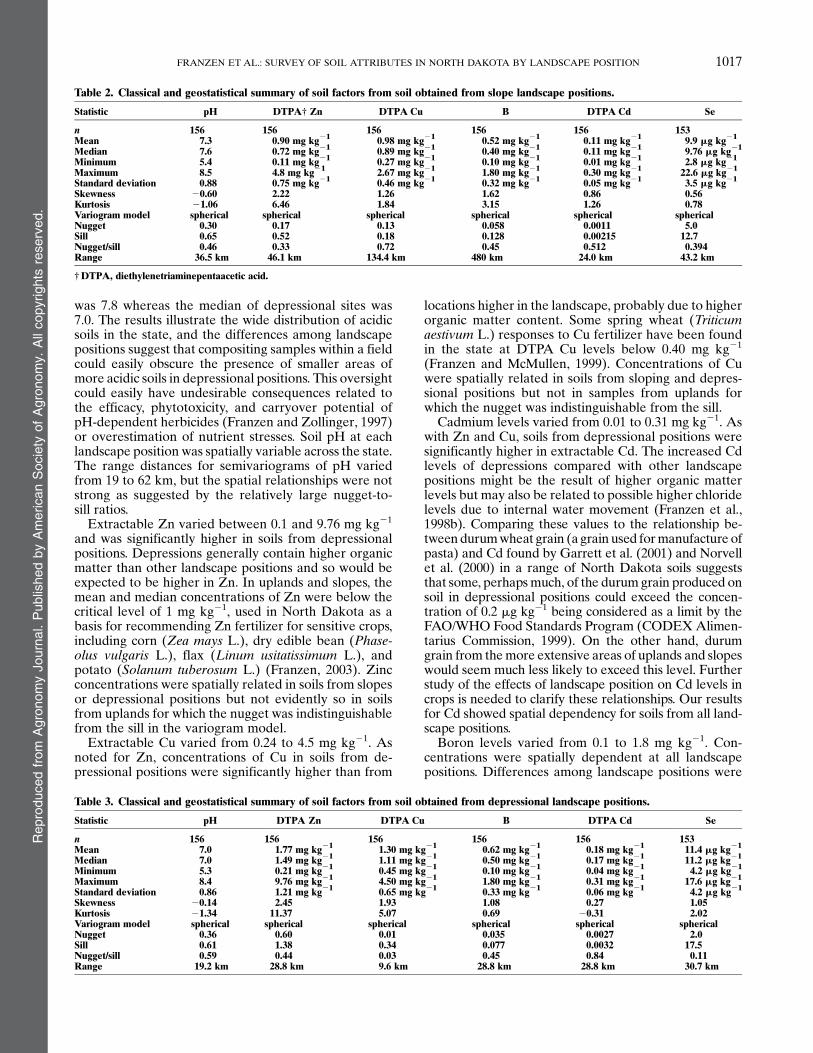
supplying insufficient Zn for Zn-sensitive crops (,1 mgkg21). Soils in eastern NorthDakota were relatively highin available Zn compared with soils in the west althoughsoils from depressional positions contained relativelyhigh concentrations of Zn in many parts of the state.Although the soils of theRedRiverValleymay be higherin native Zn than glacially or residually derived soils to
the west, another possible reason for the higher Zn lev-els might be the greater historic acreage of dry ediblebean, potato, and corn grown in the eastern part of thestate (North Dakota Agric. Stat. Serv., 1997). These arecrops that commonly receive applications of Zn fertilizer(Franzen, 2003).
The trends in Cu distribution, too, were similar in manyrespects for soils from upland, sloping, or depressionallocations (Fig. 5). Soils in central North Dakota wererelatively low in extractable Cu. Copper levels below1 mg kg21 were relatively common in soils of uplands andslopes but much less common in depressions. Copper
Fig. 4. DTPA Zn levels of upland, slope and depressional positions,NorthDakota.Upland positionZndata set was not spatially related.
Fig. 5. DTPA Cu levels of upland, slope, and depressional positions,NorthDakota.Upland positionCu data set was not spatially related.
Repro
duced
from
Agro
nom
yJourn
al.
Publis
hed
by
Am
erican
Socie
tyof
Agro
nom
y.
All
copyrights
reserv
ed.
1019FRANZEN ET AL.: SURVEY OF SOIL ATTRIBUTES IN NORTH DAKOTA BY LANDSCAPE POSITION
levels below 0.5 mg kg21, where deficiency in crops mightbe considered as a possibility (Franzen and McMullen,1999), were not common. Copper is only rarely applied asa fertilizer in the state. Variability within a region wouldmore likely be due to native differences.In upland samples, neither extractable Zn nor Cu
was demonstrably spatially dependent even though thetrends in Fig. 4 and 5 appear strong. This suggests thatthe range distance was less than could be detected at thelow sampling density of this survey.The distribution pattern for B in upland, sloping, and
depressional soils was similar (Fig. 3). The highest levelsof hot-water-soluble B were found in the eastern andnorth-central parts of the state. The lowest levels werefound in the west, especially the southwest in the areas
of Cretateous and Tertiary sediments. The highest levelsof soluble B were usually found in depressional areas,suggesting that within-field assessments for B shouldseparate depressions from uplands and slopes, especiallyin the eastern and northeastern parts of the state.
Extractable Cd concentrations in upland and slopingsites were notably lower than those in depressionalpositions (Fig. 7). Higher Cd levels were found in theeast and north-central regions. The north-central por-tion of the state has previously been identified as havinghigher Cd levels than other regions, particularly due toglacial till that is relatively shallow in depth to Cd richshale bedrock (Norvell et al., 2000). Lowest Cd levelswere found in the southwest in the Cretaceous and Ter-tiary geologic period sediments. Previous research has
Fig. 6. Soil pH of upland, slope, and depressional positions in NorthDakota. Fig. 7. DTPA Cd levels in upland, slope, and depressional positions,
North Dakota.
Repro
duced
from
Agro
nom
yJourn
al.
Publis
hed
by
Am
erican
Socie
tyof
Agro
nom
y.
All
copyrights
reserv
ed.
1020 AGRONOMY JOURNAL, VOL. 98, JULY–AUGUST 2006

documented that Cd levels tend to be higher in areaswith shallow depth to bedrock shale, particularly Pierreshale (Holmgren et al., 1993). That may explain thetendency for Cd levels to be higher in the north-centralregion and some areas of the northwest where theglacial till is sometimes shallow over shale.No quantitative relationship between DTPA-extract-
able Cd in soil and Cd in crops has been established inNorth Dakota, but our results suggest that the potentialfor uptake of Cd from upland and sloping sites is greaterin the eastern and north-central counties of the state.Greater potential for Cd uptake appears to exist in soils
from depressional locations in all parts of the state, butless so for some of the soils in southwestern and centralareas. In areas of elevated Cd-uptake potential, our re-sults suggest that segregating and excluding grain har-vested from depressional locations in the landscapewould help to meet limits for Cd in grain exported torestrictive overseas markets. Other options to reduceCd concentrations in seeds and grains include applyingZn fertilizers to soils with low available Zn and avoidingapplication of chloride-containing fertilizers (Li et al.,1994). In addition, avoiding fields with a history of ma-nure applications, choosing fertilizer sources with lowlevels of Cd, and adding lime to acidic soils have alsobeen suggested as means to reduce grain Cd in sensitivesoil areas (Grant et al., 1999).
The distribution of water-soluble Se in soils from alllandscape positions was generally similar (Fig. 8). Thehighest Se levels were found in the south-central, north-central, southeastern, and part of the northwest. Rel-atively low levels were found in the southwest andnortheast. Soil from depressional locations tended tobe higher in soluble Se than soil from higher in thelandscape in all areas of the state except the southwestwhere little difference was found. Plant available Se isrelatively mobile in soil and accumulates in water dis-charge zones in semiarid and arid regions (Parkin et al.,1990). With higher-than-normal rainfall, upland andsloped landscape positions would be expected to leachsoluble constituents, such as Se, and levels would bereduced. Soil Se levels might also fluctuate betweenyears depending on precipitation and Se leaching or ac-cumulation due to internal water movement.
The Se maps in Fig. 8 are unlike those produced inother studies that specifically sought locations whereplantsmight accumulate high levels of Se toxic to animals(Trelease and Beath, 1949; Boon, 1989). Maps of thesepotentially toxic areas may give the incorrect impressionthat much of the land within these zones is subject to ahigh levels of Se accumulation in plants. In reality, thelocations in North Dakota with severe problems fromSe accumulation are very limited in extent and are bestdescribed as localized sites with unusual characteristics,such as outcroppings of Se-rich shale or contamina-tion from past U-mining activities. Our maps of water-soluble Se levels do not suggest the presence of Se levelsthat would result in any concern over high Se concentra-tions in cropped soils.
The results of this study suggest that future surveys ofsoil attributes should consider the landscapes fromwhichsamples will be obtained, perhaps by sampling and sep-arately evaluating soils from differing major landscapeunits or by specifying a consistent landscape for sam-pling purposes. In this study, separating the sample loca-tions into upland, slopes, and depressions helped toavoid confounding the large-scale trends in attributesacross North Dakota with field-scale spatial variationsthat are related to landscape positions. Our results showthat soils from depressional positions are generally lowerin pH and higher in extractable forms of Cd, Cu, Zn, B,and Se than are soils from upland or sloping positionswithin the landscape.
Fig. 8. Plant available Se levels in upland, slope, and depressional po-sitions, North Dakota.
Repro
duced
from
Agro
nom
yJourn
al.
Publis
hed
by
Am
erican
Socie
tyof
Agro
nom
y.
All
copyrights
reserv
ed.
1021FRANZEN ET AL.: SURVEY OF SOIL ATTRIBUTES IN NORTH DAKOTA BY LANDSCAPE POSITION
ACKNOWLEDGMENTS
This project was partially funded by the North Dakota StateUniversity College of Agriculture and Cenex Land of Lakes.
REFERENCESBanuelos, G.S., and D.W. Meek. 1990. Accumulation of selenium in
plants grown on selenium-treated soil. J. Environ. Qual. 19:772–777.Berger, K.C., and E. Truog. 1944. Boron tests and determinations for
soils and plants. Soil Sci. 57:25–36.Bhatti, A.U., D.J. Mulla, and B.E. Frasier. 1991. Estimation of soil
properties and wheat yields on complex eroded hills using geo-statistics and thematic mapping images. Remote Sens. Environ. 37:181–191.
Boon, D.Y. 1989. Potential selenium problems in Great Plains soils.p. 107–121. In L.W. Jacobs (ed.) Selenium in agriculture and theenvironment. SSSA Spec. Publ. 23. SSSA, Madison, WI.
CODEX Alimentarius Commission. 1999. Report of the 33rd sessionof the Codex committee on food additives and contaminants.ALINORM 99/12A. Joint FAO/WHO Food Standards Programme,FAO, the Hague, and WHO, Rome.
Franzen, D.W. 2003. North Dakota fertilizer tables and equations.Circ. SF-882 (revised). North Dakota State Univ. Ext., Fargo.
Franzen, D.W., and D. Berglund. 1998. Small-scale spatial variability ofsoil N and P and implications with regard to sample core number[Online]. p. 143–153. In 1997 Sugarbeet research and extensionreports. Vol. 28. Available at www.sbreb.org/research/soil/soil97/97p143.htm (verified 20 Feb. 2006). SugarbeetRes. andEduc.Boardof Minnesota and North Dakota, Fargo, ND.
Franzen, D.W., L.J. Cihacek, V.L. Hofman, and L.J. Swenson. 1998a.Topography-based sampling compared with grid sampling in thenorthern Great Plains. J. Prod. Agric. 11:364–370.
Franzen, D.W., A.D. Halvorson, V.L. Hofman, and L.J. Cihacek.1998b. Variability of soil pH, chloride and zinc in the NorthernPlains. p. 28–33. In A.J. Schlegel (ed.) Proc. 1998 Great Plains SoilFertil. Conf., Denver, CO. 2–4 Mar. 1998. Potash & Phosphate Inst.,Brookings, SD.
Franzen, D.W., and M. McMullen. 1999. Spring wheat response tocopper fertilization in North Dakota. Rep. 50. North Dakota StateUniv. Ext., Fargo.
Franzen, D.W., and T.R. Peck. 1995a. Field soil sampling density forvariable rate fertilization. J. Prod. Agric. 8:568–574.
Franzen, D.W., and T.R. Peck. 1995b. Spatial variability of plant anal-ysis calcium and magnesium levels before and after liming. Com-mun. Soil Sci. Plant Anal. 26:2263–2277.
Franzen, D.W., and R.K. Zollinger. 1997. Interaction of soil appliedherbicides with soil pH. p. 14–23. In G. Hergert (ed.) Proc. NorthCentral Ext.–Industry Soil Fertil. Conf., St. Louis, MO. 19–20 Nov.1997. Potash & Phosphate Inst., Brookings, SD.
Garrett, R.G., C.E. Green, W.A. Norvell, and R.L. Chaney. 2001.Effect of soil properties on cadmium in durum wheat. p. 84. In Proc.6th Int. Conf. on Biogeochem. of Trace Elements, Guelph, ON,Canada. 28 July–2 Aug. 2006. Paper GO150. Univ. of Guelph,Guelph, ON, Canada.
Grant, C.G., L.D. Bailey, M.J. McLaughlin, and B.R. Singh. 1999.Management factors which influence cadmium concentrations incrops. p. 151–198. In M.J. McLaughlin and B.R. Singh (ed.) Cad-mium in soils and plants. Kluwer Academic Publ., Dordrecht, theNetherlands.
Gustavsson, N., B. Bolviken, D.B. Smith, and R.C. Severson. 2001.Geochemical landscape of the conterminous United States: Newmap presentations for 22 elements. Professional Paper P1648.USGS, Reston, VA.
Hintze, K.J., G.P. Lardy, M.J. Marchello, and J.W. Finely. 2001. Areaswith high concentrations of selenium in the soil and forage producebeef with enhanced concentrations of selenium. J. Agric. FoodChem. 49:1062–1067.
Holmgren, G.G.S., M.W. Meyer, R.L. Chaney, and R.B. Daniels. 1993.Cadmium, lead, zinc, copper, and nickel in agricultural soils of theUnited States of America. J. Environ. Qual. 22:335–348.
Isaaks, E.H., and R.M. Srivastava. 1989. An introduction to appliedgeostatistics. Oxford Univ. Press, New York.
Jump, R.K., and B.R. Sabey. 1989. Soil test extractants for predict-ing selenium in plants. p. 95–105. In L.W. Jacobs (ed.) Selenium inagriculture and the environment. SSSA Spec. Publ. 23. SSSA,Madison, WI.
Kelling, K.A., L.G. Bundy, S.M. Combs, and J.B. Peters. 1998. Soil testrecommendations for field, vegetable, and fruit crops. WisconsinExt. Circ. A2809. Univ. of Wisconsin, Madison.
Knuteson, J.A., J.L. Richardson, D.D. Patterson, and L. Prunty. 1989.Pedogenic carbonates in a calciaquolls associated with a rechargewetland. Soil Sci. Soc. Am. J. 53:495–499.
Li, Y., R.L. Chaney, and A.A. Schneiter. 1994. Effect of soil chloridelevel on cadmium concentration in sunflower kernels. Plant Soil167:275–280.
Lindsay, W.L., and W.A. Norvell. 1978. Development of a DTPAtest for zinc, iron, manganese, and copper. Soil Sci. Soc. Am. J. 42:421–428.
Mikkelsen, R.L., A.L. Page, and F.T. Bingham. 1989. Factors affectingselenium accumulation in agricultural crops. p. 65–94. In L.W.Jacobs (ed.) Selenium in agriculture and the environment. SSSASpec. Publ. 23. SSSA, Madison, WI.
North Dakota Agricultural Statistics Service. 1997. North Dakota ag-ricultural statistics. North Dakota Agric. Stat. Serv., Fargo.
Norvell, W.A., J. Wu, D.G. Hopkins, and R.M.Welch. 2000. Associationof cadmium in durum wheat grain with soil chloride and chelate-extractable soil cadmium. Soil Sci. Soc. Am. J. 64:2162–2168.
Omodt, H.M., G.A. Johnsgard, D.D. Patterson, and O.P. Olson. 1968.The major soils of North Dakota. Agric. Exp. Stn. Bull. 472. NorthDakota State Univ., Fargo.
Parkin, H.S., S.C. Komor, J.L. Arndt, and J.L. Richardson. 1990.Selenium in discharge zones of drained and undrained wetlands.North Dakota State Univ. Dep. of Soil Sci., Fargo.
Peck, T.R., and S.W. Melsted. 1973. Field sampling for soil testing.p. 67–75. In L.M. Walsh and J.D. Beacon (ed.) Soil testing and plantanalysis. SSSA, Madison, WI.
Pierce, F.J., and P. Nowak. 1999. Aspects of precision agriculture. Adv.Agron. 67:1–85.
Ruhe, R.V. 1960. Elements of the soil landscape. p. 165–170. InTrans. 7th Int. Congr. of Soil Sci., Vol. 4., Madison, WI. Int. Soc. ofSoil Sci.
Seiler, R.L. 1998. Prediction of lands susceptible to irrigation-inducedselenium contamination of water. p. 397–418. In W.T. Frankenber-ger, Jr., and R.A. Engberg (ed.) Environmental chemistry of sele-nium. Marcel Dekker, Inc., New York.
Stevenson, F.J. 1991. Organic matter-micronutrient reactions in soil.p. 145–186. In J.J. Mortvedt, F.R. Cox, L.M. Shuman, and R.M.Welch (ed.) Micronutrients in agriculture (2nd ed.) SSSABook Ser.4. SSSA, Madison, WI.
Trelease, S.F., and O.F. Beath. 1949. Selenium: Its geological occurrenceand its biological effects in relation to botany, chemistry, agriculture,nutrition, and medicine. The Champion Printers, Burlington, VT.
Webster, R. 2000. Is soil variation random? Geoderma 97:149–163.Welsh, E.P., J.G. Crock, and R. Sanzolone. 1990. Trace-level deter-
mination of arsenic and selenium using continuous-flow hydridegeneration atomic absorption spectrophotometry (HG-AAS).p. 38–45. In B.F. Arbogast (ed.) Quality assurance manual for theBranch of Geochemistry, U.S. Geological Survey. USGS Open-FileRep. 90–668. USGS, Denver, CO.
White, J.G., R.M. Welch, and W.A. Norvell. 1997. Soil zinc map of theUSA using geostatistics and geographic information systems. SoilSci. Soc. Am. J. 61:185–194.
Wollenhaupt, N.C., R.P. Wolkowski, andM.K. Clayton. 1994. Mappingsoil test phosphorus and potassium for variable-rate fertilizer appli-cation. J. Prod. Agric. 7:441–448.
Wright, R.J., and T. Stucynski. 1996. Atomic absorption and flameemission spectrometry. p. 65–90. InD.L. Sparks et al (ed.) Methodsof soil analysis. Part 3. Chemical methods. SSSA Book Ser. 5. SSSAand ASA, Madison, WI.
Wu, J., W.A. Norvell, D.G. Hopkins, D.B. Smith, M.G. Ulmer, and R.M.Welch. 2000. Spatial variability of grain cadmium and soil character-istics in a durum wheat field. Soil Sci. Soc. Am. J. 66:268–275.
Wu, J., W.A. Norvell, D.G. Hopkins, and R.M. Welch. 2002. Spatialvariability of grain cadmium and soil characteristics in a durumwheat field. Soil Sci. Soc. Am. J. 66:268–275.
Repro
duced
from
Agro
nom
yJourn
al.
Publis
hed
by
Am
erican
Socie
tyof
Agro
nom
y.
All
copyrights
reserv
ed.
1022 AGRONOMY JOURNAL, VOL. 98, JULY–AUGUST 2006