a survey of rates of water loss from leaves
TRANSCRIPT

A SURVEY OF RATES OF WATER LOSS FROM LEAVES.*
GLENN W. BLAYDES,Department of Botany, The Ohio Wesleyan University.
INTRODUCTION.
This paper is a record of data collected showing water lossfrom leaves from a number of plants growing in several habitats.As many different species as possible were tested in the time atthe writer's disposal. At first a mere list of water loss datawas intended, but a number of new phases have arisen duringthe course of the tests. It is probable that, as the work pro-gresses and more is known about the general field, still otherswill arise.
Representatives of three of the four great groups of plantshave been studied, namely from the Spermatophytes (includingboth Angiosperms and Gymnosperms), Pteridophytes andBryophytes. The greatest number is from the Spermatophytessince they make up such a large proportion of our vegetation.The method used in collecting data was not applicable to theThallophytes and submerged aquatics.
In collecting these data, representatives were selected fromseveral different habitats so that comparisons of their waterloss might be made. An attempt has also been made to studythe diurnal rates of water loss from a small number of plants.
The water loss from plants has an extremely importantbearing on their distribution and their survival. Heretofore,largely because of their economic importance, much more hasbeen done with agricultural plants in this relation than withother types. And too, in nearly all cases potted plants, plantsgrowing in the laboratory, in the greenhouse, or otherwiseunder abnormal conditions, have been used. This work is anattempt to measure the loss of moisture under as nearly normalconditions as is possible with present day methods. The losshas not been considered as a "power of the leaf", but rather asa phenomenon over which it has no control. Water loss isdue to external and internal environmental factors rather thana specific "ability" of the leaf "to give off water."
As far as the writer has been able to discover, very littlework has been done in the way of a general survey of water
"Papers from the Department of Botany, Ohio State University, No. 215.
99

100 GLENN W. BLAYDES Vol. X X V I I I
loss from leaves.* This is likely due to a lack of a practicalquantitative method of determination, which can be carriedinto the field and used readily under natural conditions of themany different habitats.
METHOD USED.
The cobalt chloride paper test was used, as devised byStahl (19), improved by Livingston (9), Livingston and Shreve(10), and more recently by Say re (12). Livingston's and Shreve'smethod was quite an improvement over that of Stahl, and hasbeen used successfully by a number of workers. However, itshould be noted, that the results obtained by this method areentirely qualitative and relative.
To secure quantitative results Sayre (12) standardized cobaltchloride paper by the following method. Filter paper (What-man No. 1) was saturated in a 3% solution of cobalt chloride,dried in an oven until the blue color appeared, and then con-tinued in a desiccator containing anhydrous calcium chloride.Dry weight was then obtained, after which they were placedin a moist chamber and left until they attained a full pinkcolor, and reweighed. The difference in weight representedthe amount of water vapor necessary to change the blue paperto a full pink color.
From these data it is seen that if the cobalt paper is properlyapplied to a leaf surface the actual water loss can be obtained.A number of investigators have used small glass plates tocover the cobalt papers in protecting from atmospheric moisture,and to hold the papers in place on the leaf to be tested. Sayre(12) used celluloid instead of glass. The cobalt paper wascut in circular areas with a punch %" in diameter. Thecelluloid was cut in strips %" x l}f. The cobalt paper wasthen fastened at each end and on the same surface of thestrips by means of gummed reenforcements for notebook paper.These were of greater diameter than the width of the strips, soextended over the sides and end. A reinforcement was moist-ened and applied near one end of the strip, the perforationbeing covered by the celluloid. While still moist the strip
*The following workers have contributed to our knowledge of water loss fromvarious species: Livingston (9), Shreve (17), Trelease (20), Meyer (12 and 13),Shive and Martin (16), Cribbs (4 and 5), McGinnis and McDougall (11), Bakke(1 and 3), Delf (6), Kiesselbach (8), Rosenberg (15), and others. With the excep-tion of Kiesselbach, these workers used Stahl's (19) Cobalt Chloride Method, thesame as improved by Livingston (9), Livingston and Shreve (10) and by Sayre (12).

No. 2 RATES OF WATER LOSS FROM LEAVES 101
was inverted, cobalt paper placed opposite the perforation inreenforcement and a dry reenforcement placed over the paperso that the dry gummed surface was in contact with themoist gummed surface projecting over the edges. The gummedsurfaces were pressed tightly together. These held the cobaltpaper in position with only the one surface exposed, whichwas to be placed next to the leaf, and the other surface couldbe seen through the celluloid. After cobalt paper was attachedto both ends of strip in the above manner, the strip was foldedalong the short axis through the center. This then made aclip which could be readily clamped on a leaf with a hygrometricpaper exposed to each surface. In this work the clips wereattached to a leaf surface by means of small clamps (DenisonCard Holder, No. 42). The hook at the end was convenientfor attaching a slip of paper with number of the leaf and timeat which the clip was applied. Fifty or sixty clips were madeso that time would not be lost in waiting for them to dry in adesiccator. The clips were kept in desiccators made of wide-mouthed bottles, of convenient size for carrying, with anhydrouscalcium chloride. These clips were used until they becamesoiled or wet. The desiccating process can be greatly speededup by placing the bottles in bright sunlight or near a fire.As color standards, a paper may be kept in a small desiccatorfor the blue color. For the pink standard a clip which hasbeen in contact with a leaf surface until a full pink color hasappeared, may be carried about on a leaf, or in a bottle.
The paper used in collecting the data given below wasstandardized to .05981 gram of water per 100 square centi-meters. That is, it took .05981 gram of water to change theblue (dry) cobalt chloride paper to a full pink color. So, if ittakes 1 minute to change the blue to pink, the grams of watervapor absorbed per 100 square centimeters in one hour wouldbe 60 times .05981 gram. Meyer's (12) formula was used inmaking the calculations. It is as follows:
.05981 x 3600 (Sec. in one hour): = G (Grams of water vapor).
T (Time of color change)
In each case the wet and dry bulb temperatures weretaken in order that the relative humidity might be determined.The thermometers were kept in a shaded place as near theleaves being tested as was possible. Shreve (17) showed thattemperature of the air immediately surrounding the leaf may

102 GLENN W. BLAYDES Vol. X X V I I I
be safely used instead of the temperature of the clip itself.Leaves in good condition as far as could be determined wereselected in every case except where indicated. In practicallyall cases five readings were taken at a single time, each ondifferent leaves, and the time of color change averaged foreach surface. So that in the following lists and graphs thetime of color change indicated is an average for a given surface,and not for a single leaf or a single reading. The time ofchange has also been standardized for a temperature of 20degrees C. In doing this Livingston's and Shreve's (10) tablewas used.
Bakke (1) pointed out the fact that the only externalenvironmental factor directly affecting water loss from a leafsurface by cobalt chloride paper is temperature. This can bestandardized to a given degree by Livingston's and Shreve's (10)table.
The relative humidity may have an effect through the layerof air imprisoned between the leaf surface and the cobalt paper.This effect must be very small since the moisture in this layeris absorbed almost instantly and the relative humidity is 0 in avery short time after the clip is applied.
The direct effect of light is small since but little light canpass through the cobalt paper. The relative humidity andlight intensity may have a far reaching indirect effect. Thedirect effect of air currents is also removed. Some of theother factors which may have effect upon water loss have beenpointed out by Kiesselbach (8) and Cribbs (4 and 5).
The cobalt chloride method of measuring water loss measuresthe water vapor given off at a particular instant, and is notmeasuring accumulative quantities, as does the potometermethod. For this reason it is not safe to compare the twomeans of determination. In the potometer method light,relative humidity and wind have a direct effect on the amountof water lost. Because of these differences Dr. E. N. Transeausuggested-to the writer the term "Standard Water Loss" fromthe leaf surface, as being the water loss measured by the cobaltchloride method.
The chief sources of error in the cobalt chloride method are:1. The hygrometric paper absorbs some moisture from the
atmosphere during transfer from the desiccator to the leaf.In every case this transfer was accomplished as quickly aspossible, and took but a few seconds.
No. 2 RATES OF WATER LOSS FROM LEAVES 103
2. There may be a source of error in determining when totake the reading. This difficulty may be, at least partly,removed by having color standards as suggested.
3. Lateral leakage from surrounding air may also be asource of error. This error seems to be quite small, for in anumber of instances, usually on upper surfaces, the test papersremained unchanged for two hours.
4. Pressure of the clip on the leaf surfaces may causesome change in size of the opening of the stomata.
5. Average leaves may not be selected for the tests. How-ever, as tests were made on five leaves each time and an averagetaken for the standard water loss, it is believed that most ofthis source of error is removed.
MEASUREMENTS OF WATER LOSS.
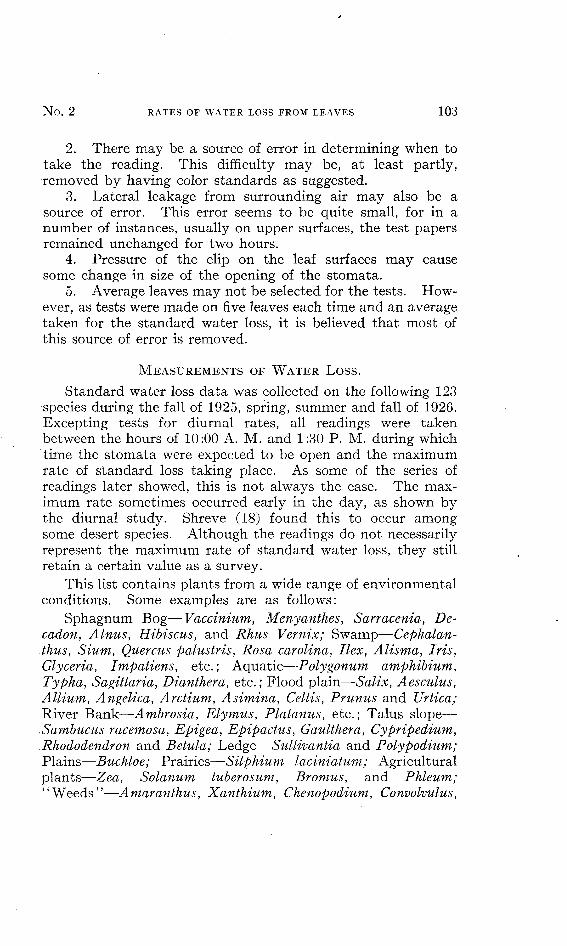
Standard water loss data was collected on the following 123species during the fall of 1925, spring, summer and fall of 1926.Excepting tests for diurnal rates, all readings were takenbetween the hours of 10:00 A. M. and 1:30 P. M. during whichtime the stomata were expected to be open and the maximumrate of standard loss taking place. As some of the series ofreadings later showed, this is not always the case. The max-imum rate sometimes occurred early in the day, as shown bythe diurnal study. Shreve (18) found this to occur amongsome desert species. Although the readings do not necessarilyrepresent the maximum rate of standard water loss, they stillretain a certain value as a survey.
This list contains plants from a wide range of environmentalconditions. Some examples are as follows:
Sphagnum Bog—Vaccinium, Menyanthes, Sarracenia, De-cadon, Alnus, Hibiscus, and Rhus Vernix; Swamp—Cephalan-thus, Slum, Quercus palustris, Rosa Carolina, Ilex, Alisma, Iris,Glyceria, Impatiens, etc.; Aquatic—Polygonum amphibium,Typha, Sagittaria, Dianthera, etc.; Flood plain—Salix, Aesculus,Allium, Angelica, Arctium, Asimina, Celtis, Prunus and Urtica;River Bank—Ambrosia, Elymus, Platanus, etc.; Talus slope—.Sambucus racemosa, Epigea, Epipactus, Gaulthera, Cypripedium,Rhododendron and Betula; Ledge—Sullivantia and Poly podium;Plains—Buchloe; Prairies—Silphium laciniatum; Agriculturalplants—Zea, Solanum tuberosum, Bromus, and Phleum;''Weeds"—Amaranthus, Xanthium, Chenopodium, Convolvulus,
104 GLENN W. BLAYDES Vol. XXVIII
Abutilon, Lactuca, Arctium, Setaria, Digitaria, Taraxacum,Polygonum virginianum, Leonurus, Erigeron, Cirsium, andAmbrosia.
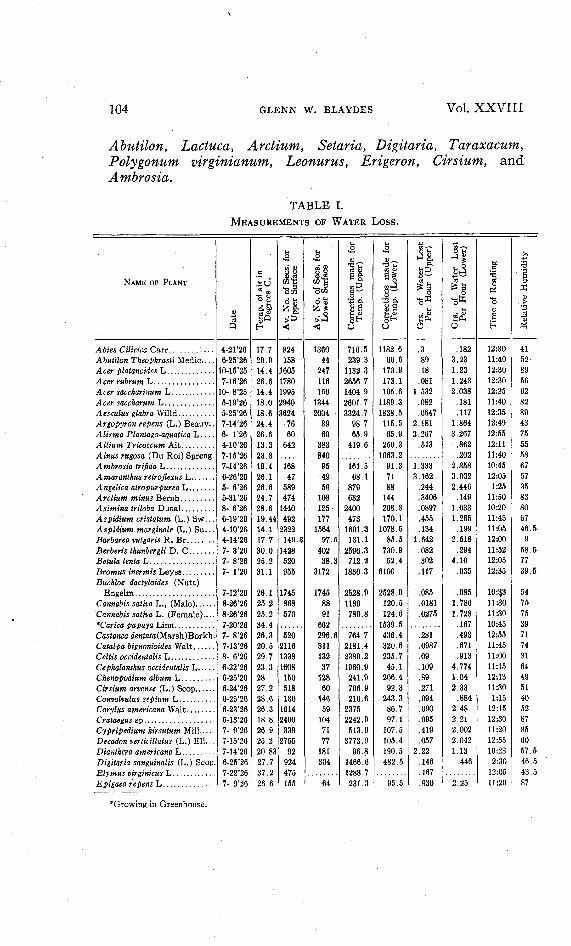
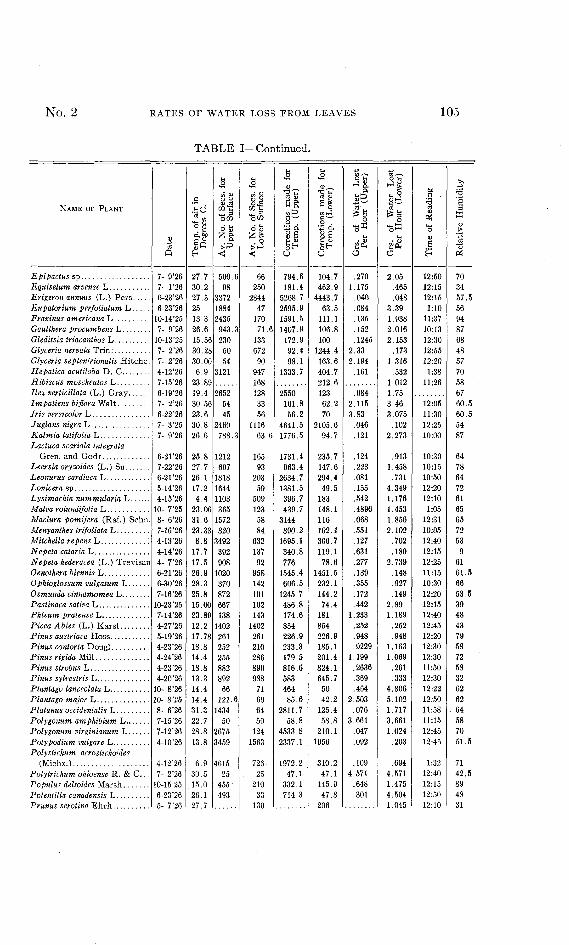
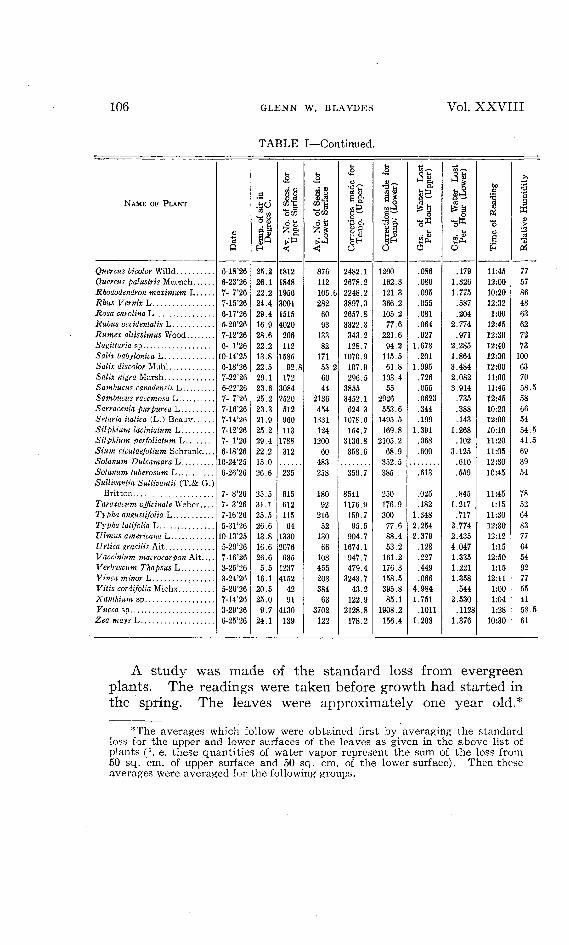
TABLE I.MEASUREMENTS OF WATER LOSS.
NAME OF PLANT
Dat
e
Tem
p, o
f ai
r in
Deg
rees
C.
Av.
No.
of
Secs
. fo
rU
pper
Sur
face
Av.
No.
of
Sec
s. f
orL
ower
Su
rfac
e
Cor
rect
ions
mad
e fo
rT
emp.
(U
pper
)
Cor
rect
ions
mad
e fo
rT
emp.
(L
ower
)
Grs
. of
W
ater
L
ost
Per
Hou
r (U
pper
)
Grs
. of
W
ater
L
ost
Per
Hou
r (L
ower
)
Tim
e of
Rea
ding
Rel
ativ
e H
umid
ity
Abies Cilicica Carr 4-21'26 17.7 824 1360 716.5 1182.6 .3 .182 12:30 41Abutilon Theophrasti Medic.... 6-25'26 26.9 158 44 239.3 66.6 .89 3.23 11:40 52Acer platanoides L .10-15'25 14.4 1605 247 1132.3 173.9 .18 1.23 12:30 89Acer rubrum L 7-16'26 26.6 1780 116 2656.7 173.1 .081 1.243 12:30 56Acer saccharinum L 10- 8'25 14.4 1995 150 1404.9 105.6 1.532 2.038 12:25 62Acer saccharum L 5-19'26 18.0 2940 ' 1344 2601.7 1189.3 .082 .181 11:40 82Aesculus glabra Wilid 5-25'26 18.6 3624 2004 3324.7 1838.5 .0647 .117 12:35 89Argopyron repens (L.)Beauv.. 7-14'26 24.4 76 89 98.7 115.5 2.181 1.864 12:49 43AlismaPlantago-aquaticaL.... 6- 1'26 26.6 60 60 65.9 65.9 3.267 3.267 12:55 75Allium Tricoccum Ait 4-10*26 13.3 642 383 419.6 250.3 .513 .862 12:11 55Alms rugosa (Du Roi) Spreng. 7-15*26 23.8 840 1063.2 .202 11:40 58Ambrosia trifidaL 7-14'26 19.4 168 95 161.5 91.3 1.333 2.358 10:45 67Amaronthus relroflexus L 6-26'26 26.1 47 49 68.1 71 3.162 3.032 12:05 57Angelica atropurpurea L 5-6'26 26.6 589 59 879 88 .244 2.446 1:25 35Arclium minus Bernh 5-31'26 24.7 474 108 632 144 .3406 .149 11:50 83A si mina iriloba Dunal 8-6'26 28.6 1440 125 2400 208.3 .0897 1.033 10:20 80Aspidiumcristatum(L.)Svf... 6-19'26 19.44 492 177 473 170.1 .455 1.265 11:45 67Aspidium marginale (L.)Su.. . 4-10*26 14.1 2322 1564 1601.3 1078.5 .134 .199 11:05 46.5-Barbarea vulgaris R. Br 4-14'26 17.7 149.3 97.5 131.1 85.5 1.642 2.518 12:00 9Berberis thunbergii D. C 7-3'26 30.0 1428 402 2596.3 730.9 .082 .294 11:52 58.5-BelulalentaL 7-8'26 25.2 520 38.3 712.2 52.4 .302 4.10 12:05 77Bromus inermis Leyss 7-1'26 31.1 955 3172 1836.3 6100 .117 .035 12:35 39.5-Buchloe dactyloides (Nutt)
Engelm... 7-12*26 26.1 1745 1745 2528.9 2528.9 .085 .085 10:3,3 54Cannabis sativa!,., (Male) 8-26*26 25.2 868 88 1189 120.5 .0181 1.786 11:30 75Cannabis sativa L. (Female).... 8-26'26 25.2 570 91 780.8 124.6 .0275 1.728 11:30 75*Carka papaya Linn 7-20'26 34.4 662 1539.5 167 10:45 39Castaneadentata(Marsh)Botkh. 7-8*26 26.3 520 296.6 764.7 436.4 .281 .493 12:55 71Catalpa bignonioides Walt 7-13*26 20.5 2116 311 2181.4 320.6 .0987 .671 11:45 74Celtis occidentalis L 8-6'26 29.7 1338 132 2389.2 235.7 .09 .913 11:00 81Cephalanthus occidentalis L 6-22*26 23.3 1608 37 1960.9 45.1 .109 4.774 11:15 64Chenopodium album L 6-25*26 28 150 128 241.9 206.4 .89 1.04 12:13 49Cirsium arvense (L.) Scop 6-24*26 27.2 518 60 796.fr 92.3 .271 2.33 11:30 51Convolvulus sepium L 6-25*26 28.6 130 146 216.6 243.3 .994 .884 1:15 40Corylus americana Walt 6-23*26 26.3 1614 59 2375 86.7 .090 2.48 12:15 52Crataegussp 5-13*26 18.8 2400 104 2242.9 97.1 .095 2.21 12:30 87Cypripedium hirsutum Mill 7-9*26 26.9 339 71 513.6 107.5 .419 2.002 11:20 85Decadon verticillatus (L.) Ell... 7-15*26 25.2 2755 77 3773.9 105.4 .057 2.042 12:55 60Dianlhera americana L 7-14*26 20.83 92 181 96.8 190.5 2.22 1.13 10:23 57.5-Digitaria sanguinalis (L.) Scop. 6-25*26 27.7 924 304 1466.6 482.5 .146 .446 2:30 46.5Elymus virginicus I. 7-22*26 3 7 . 2 475 . . . . . . . . 1283.7 167 12:05 43.&Epigaea repens L 7-9*26 26.6 155 64 231.3 95.5 .930 2.25 11:20 87
* Growing in Greenhouse.
No. 2 RATES OF WATER LOSS FROM LEAVES 105
TABLE I—Continued.
NAME OF PLANT
7- 9*267- 1'266-23'266-23'26
10-14'257- 9'26
10-13'257- 2'267- 2'264-12'267-15'266-19*267- 2'266-22'267- 3'257- 9'26
6-21'267-22'266-21'265-14'264-15'26
10- 7'258- 6'267-16'264-13'264-14'264- 7'266-21'266-30'267-16'26
10-23'257-14'264-27'265-19'264-23'264-24'264-23*264-20'26
10- 8'2610- 8'258- 6'267-15'267-12*264-10'26
4-12'267- 2'26
10-15'256-23'265- 7'26
27.730.227.52513.326.615.5630.2830.006.9
23.8919.430.5623.630.826.6
25.827.726.117.24.4
23.0631.623.338.8
17.717.526.928.325.815.0023.8912.217.7818.814.418.813.314.414.431.322.728.813.8
6.930.515.026.127.7
500.698
337218842435943.3230
5054
3121
26525445
2460788.3
1212607
181816441103365
1572320
3492392908
1020370872667138
1402261252255882892
66121.6
143450
26753459
461525
455493
66250
284447
17071.6
13367290
9471681283356
111663.6
16593
20359
5091235884
63213792
958142101102143
1402261210286890988
71606450
1241563
72625
21033
130
794.6181.4
5268.72595.91591.5
1407.9172.992.498.1
1333.7
2550101.856.2
4641.51776.5
1731.4963.4
2634.71381.5396.7439.7
3144390.2
1695.1340.8776
1545.4606.5
1245.7486.8174.6854226.9233.3179.5816.6583464
85.62811.7
58.84533.8
2337.1
1972.247.1
332.1714.3
104.7462.9
4443.763.5
111.1106.8100
1244.4163.6404.7212.612362.270
2105.694.7
235.7147.6294.449.5
183148.1116102.4306.7119.178.6
1451.5232.1144.274.4
181854226.9185.1201.4824.1645.75042.2
125.458.8
210.11056
310.247.1
145.947.8
206
.2701.175
.040
.084
.135
.152
.12452.332.194
.161
.0842.1153.83
.046
.121
.124
.223
.081
.155
.542
.4896
.068
.551
.127
.631
.277
.139
.355
.172
.4421.233
.252
.948
.92291.199
.2636
.369
.4642.503
.0763.661
.047
.092
.1094.571
.648
.301
2.05.465.048
3.391.9382.0162.153
.1731.316
.5321.0121.753.463.075
.1022.273
.9131.458
.7314.3491.1761.4531.8562.102
.702
.1802.739
.148
.927
.1492.891.189
.252
.9481.1631.069
.261
.3334.3065.1021.7173.6611.024
.203
.6944.5711.4754.5041.045
12:50 7012:15 3412:15 57.51:10 56
11:37 9410:13 8712:30 6812:55 4812:20 571:38 70
11:26 5867
12:05 60.511:30 60.512:25 5410:00 87
10:30 6410:15 7810:50 6412:20 7212:10 611:05 65
12:31 6510:05 7212:40 5312:15 912:25 6111:15 61.510:30 6612:20 53.512:15 3912:40 4812:45 4312:20 7912:30 5812:30 7211:50 5812:30 3212:22 6212:50 6211:58 . 6411:15 5812:45 7012:45 51.5
1:32 7112:40 42.512:15 8912:50 4812:10 31
Epipactus spEquisetum arvense LErigeron annuus (L.) PersEupatorium perfolialum LFraxinus americana LGaulthera procumbens LGleditsia triacanthos LGlyceria nervata TrinGlyceria septentrionalis Hitchc.Hepatica acutiloba D. CHibiscus moscheutos LIlex verticillala (L.) GrayImpatiens biflora WaltIris versicolor LJuglans nigra LKalmia latifolia LLactuca scariola integrata
Gren. and GodrLeersia oryzoides (L.) SuLeonurus cardiaca LLonicera spLysimachia numtnularia LMalva rotundifolia LMadura pomifera (Raf.) SchnMenyanthes Irifoliata LMitchella repens L :Nepeta cataria LNepeta hederacea (L.) TrevisanOenothera biennis LOphioglossum vulgatum LOsmunda cinnamomea LPastinaca sativa LPhleum pratense LPicea Abies (L.) KarstPinus austriaca HossPinus contorta DouglPinus rigida MillPinus strobus LPinus sylvestris LPlantago lanceolata LPlantago major LPlatanus occidentalis LPolygonum amphibium LPolygonum virginianum LPoly podium vulgare LPolystichum acroslichoides
(Michx.)Polytrichum ohioense R. & C.. .Populus deltoides MarshPotentilla canadensis LPrunus serotina Ehrh
Dat
e
Tem
p, o
f ai
r in
Deg
rees
C.
Av.
No.
of
See
s, f
or
Upp
er S
urfa
ce
Av.
No.
of
See
s, f
orL
ower
Sur
face
Cor
rect
ions
m
ade
for
Tem
p.
(Upp
er)
Cor
rect
ions
m
ade
for
Tem
p.
(Low
er)
Grs
. of
W
ater
L
ost
Per
H
our
(Upp
er)
Grs
. of
W
ater
L
ost
Per
H
our
(Low
er)
Tim
e of
Rea
ding
Rel
ativ
e H
um
idit
y
106 GLENN W. BLAYDES Vol. XXVIII
TABLE I—Continued.
NAME OF PLANT
Quercus bicolor WilldQuercus palustris MuenchRhododendron maximum LRhus Vernix LRosa Carolina LRubus occidentalis LRumex altissimus WoodSagittaria spSafe babylonica L6'afe discolor MuhlSaWx m'gra MarshSambucus canadensis LSambucus racemosa LSarracenia purpurea LSetaria italica (L.) BeauvSilphium laciniatum LSilphium perfoliatum L5 w cicutaejolium SchrankSolatium Dulcamara LSolatium tuberosum LSullivantia Sullivantii (T.& G.)
BrittonTaraxacum officinale Weber, . . .Typha angustifolia LTypha latifolia LUlmus americana LUrtica gracilis AitVaccinium macrocarpon AitVerbascum Thapsus LFJMca minor LVita's cordifolia MichxXanthium spFttcca spZea mays L
6-18'266-23'267- 7'267-15'266-17'265-20'267-12'26
6- 1'2610-14'256-18*267-22'266-22'267- 7'267-16'267-14'267-12'267- 1'266-18'26
10-24'2S6-26'26
7- 8'267- 3'267-16'265-31'26
10-13'255-20'267-16'263-25'263-24'265-26'267-14*263-29'266-25'26
25.226.122.224.429.416.928.622.213.822.529.123.625.223.321.925.229.422.215.026.6
25.531.125.526.613.816.626.65.5
16.120.525.09.7
24.1
1812
1848
1956
3001
1515
4020
206
112
1585
92.8
172
3084
2520
512
960
113
178.8
312
235
615
612
115
64
1330
2076
635
1237
4152
42
91
4130
139
876
112
105.6
282
60
93
133
82
171
53.2
60
44
2136
454
1331
124
1200
60
483
258
180
92
216
52
130
66
108
455
203
384
63
3702
122
2482.1
2678.2
2248.2
3897.3
2657.8
3322.3
343.2
128.7
1070.9
107.9
296.5
3855
3452.1
624.3
1078.6
154.7
3136.8
358.6
350.7
8541
1176.9
159.7
95.5
904.7
1674.1
947.7
479.4
3243.7
43.2
122.9
2128.8
178.2
1200
162.3
121.3
366.2
105.2
77.6
221.6
94.2
115.5
61.8
103.4
55
2926
553.6
1495.5
169.8
2105.2
68.9
352.5
385
250
176.9
300
77.6
88.4
53.2
161.2
176.3
158.5
395.8
85.1
1908.2
156.4
.086
.080
.095
.055
.081
.064
.627
1.673
.201
1.995
.726
.055
.0623
.344
.199
1.391
.068
.600
.613
.025
.182
1.348
2.254
2.379
.128
.227
.449
.066
4.984
1.751
.1011
1.208
.179
1.326
1.775
.587
.204
2.774
.971
2.285
1.864
3.484
2.082
3.914
.735
.388
.143
1.268
.102
3.125
.610
.559
.845
1.217
.7172.7742.4354.0471.3351.2211.358
.5442.530
.112!1.376
11:4512:0010:2012:321:00
12:4512:3012:4012:3012:0011:0011:4512:4510:2012:0010:1011:2011:0512:3010:45
11:451:15
11:3012:3012:121:15
12:501:15
12:111:001:041:28
10:30
77
57
86
48
63
62
72
73
100
63
70
58.5
58
66
54
54.5
41.5
69
39
54
78
52
64
83
77
64
54
92
77
55
41
58.5
61
A study was made of the standard loss from evergreenplants. The readings were taken before growth had started inthe spring. The leaves were approximately one year old.*
*The averages which follow were obtained first by averaging the standardloss for the upper and lower surfaces of the leaves as given in the above list ofplants (i. e. these quantities of water vapor represent the sum of the loss from50 sq. cm. of upper surface and 50 sq. cm. of the lower surface). Then theseaverages were averaged for the following groups.
Date
Tem
p,
of
air
inD
egre
es
C.
Av.
No.
of
Sec
s. f
or
Upper
S
urf
ace
Av.
No.
of
Sec
s. f
or
Low
er S
urf
ace
Corr
ecti
ons
made f
or
Tem
p.
(Up
per
)
Corr
ecti
ons
made f
or
Tem
p.
(Low
er)
Grs
. of
Wat
er
Lost
Per
H
our
(Upper
)
Grs
. of
W
ater
L
ost
Per
H
our
(Low
er)
Tim
e o
f R
eadin
g
Rela
tive H
um
idit
y

No. 2 RATES OF WATER LOSS FROM LEAVES 107
The average standard loss for thisgroup was .5481 gm. The great-est loss was from P. rigida—1.134 gm. The smallest was fromA. Cilicica—.241 gm.
I. SPERMATOPHYTES.
A. Gymnosperms.1. Abies Cilicica2. Picea abies3. Pinus austriaca4. " contorta5. " rigida6. " strobus7. " sylvestris
B. Angiosperms—(Leaves had passed through the winter. Exactage was not known.)
1. Barbarea vulgaris2. Lysimachia numularia3. Mitchella repens4. Nepeta Cataria5. Nepeta hederacea6. Verbascum Thapsus7. Vinca minor8. Yucca sp.
The average for the group was.8523 gm. Barbarea was highest—2.08 grams, and Yucca waslowest—.1065 gm.
Some readings were taken on a sugar maple and two pinesgrowing near one another. The readings were taken withinone hour and on the same day. The maple leaves were approxi-mately 20 days old and the pine leaves about 1 year old. Theresults are as follows:
Acer saccharum 104 gm.Pinus sylvestris 110 "Pinus austriaca 948 "
In order to get a comparison between the standard loss forcorn, the potato and some common "weeds," growing alongbeside the corn and potato, the following data were collected:
1. Abutilon Theophrasti 2.065 grams2. Amaranthus retroflexus 1.848 "3. Chenopodium album 2.889 "4. Convolvulus septum 2.132 "5. Digitaria sanguinalis 295 "6. Setaria italica 171 "7. Xanthium sp 2.14 "8. Solanum tuberosum 1.361 *9. Zea mays 1.786 "
II. PTEEIDOPHYTES.
1. Aspidium marginale2. Poly podium vulgare3. Polystichum acrostichoides
The average for the group was.2401 gm. Polystichum was high-est—.4015 gm. Polypodium low-est—.1525 gm.

108 GLENN W. BLAYDES Vol. XXVIII
McGinnis and McDougal (11) made a number of similarcomparisons of several "weeds" with corn, using the cobaltchloride method as developed by Livingston and Shreve (10).Their plants were of necessity grown in the greenhouse anddata were obtained during the months of February, March andApril. The writer took a series of readings in August on asingle Zea plant and a similar series simultaneously on anAmaranihus plant, growing near the corn. Fig. 1 shows theresults graphically.
Fig. l .p I. Graph showing the standard water loss for the upper (U) and lower (L)surfaces of Amaranihus retroflexus leaves. II. Graph showing the standardwater loss for the upper (U) and lower (L) surfaces of Zea mays leaves. Read-ings on both plantSjwere taken simultaneously.
An effort was made to test out the difference in standardloss of rolled and non-rolled leaves of the same species. Thetwo bunches of Elymus virginicus selected were growing withina few feet of each other on a river bank. One bunch showedrolled leaves and the other did not. The leaves tested werenot on the same plant but on different plants in each cluster.The results are as follows:
Rolled leaves were losing 167 gramUnrolled leaves were losing 1.696 grams
No. 2 RATES OF WATER LOSS FROM LEAVES 109
Bakke and Livingston (3) pointed out the fact that waterloss is different for leaves occupying different positions on thesame plant. This has been confirmed in the case of a largespecimen of Ulmus americana. Readings were taken at analtitude of approximately 40 feet, and others on leaves whichcould be reached while standing on the ground. The lowerreadings were started at 11:45 and the upper at 12:00. Theleaves were more or less shaded in both positions. The testswere made in August. The tree apparently had an abundantwater supply as it was growing on a river bank. No satis-factory color change was obtained in either upper surface.In the upper position only one paper changed color on the lowersurface after an exposure of 50 minutes. The other paperswere left on for 1 hour and 20 minutes without change. Inthe lower position, papers on the lower surfaces changed inthe average time of 38 minutes 24 seconds. The standardwater loss was .0401 gm. per 100 square centimeters in one hourat a temperature of 20 degrees C. Calculations for the upperposition were not made because of unsatisfactory color change.The rate for the leaves in the higher position was evidentlymuch lower.
A number of readings were taken simultaneously on youngand mature leaves in order to get a comparison. The resultswere as follows:
YOUNG MATURE
1. Silphium perfoliatum .2085 gm. .788 gm.2. Corylus americana 285 " 1.2865 "3. Arctium minus 5235 " 3.5955 "4. Cephalanthus occidentalis 193 " 1.239 "5. Chenopodium album 9665 " 2.8895 "6. Convolvulus sepium 939 " 2.1325 "7. Sarracenia purpurea 118 " .732 "8. Typha latifolia 4.816 " 2.51 "
It is interesting to note that Typha latifolia is the onlyspecies examined in which the young leaves were simultaneouslylosing more water than the mature leaves. Meyer (13) hasbeen able to express more juice from mature leaves than fromyoung.
A series of readings were made on Acer saccharum, RosaCarolina and on Catalpa bignonioides, at certain intervals duringthe summer. The leaves were marked when the first readingwas made. The same leaves were tested each time, exceptingin the last reading on the Acer all the marked leaves had dis-
110 GLENN W. BLAYDES Vol. XXVIII
appeared except two. Others were selected which were approxi-mately in the same position. Also all but one of the taggedleaves of Rosa had disappeared by the time of the secondreading.
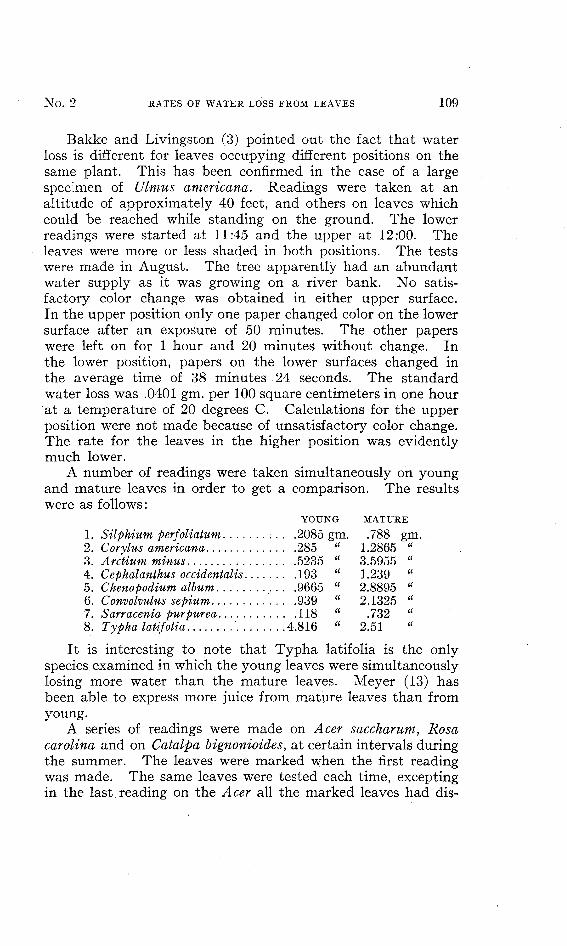
The readings on Rosa were made first on May 17, and showeda standard loss of .933 gm. One month later, at the same timeof day, readings were again taken. The loss then was .141 gm.,showing a decrease of .792 gm. per unit area for the more matureleaves.
Fig. 2. Graph showing standard water loss from leaves of Acer sacchamm fromthe time they were unrolling from the buds until they were approximately 150days old. L, lower surface. U, upper surface. R. H., relative humidity.
On July 13 the first readings were taken on Catalpa. Theloss was found to be .4475 gm. On August 31 readings wereagain taken on the same leaves at the same time of day. Theresult obtained this time was .2559 gm., or .1916 gm. decreasefor the older leaves.
On May 4 readings were started on Acer saccharum. Theleaves were just unrolling at this time. Three other readingswere taken during the summer and autumn. The graph,Fig. 2, shows the results.
While working with very young leaves it was found thatseveral, notably Convolvulus, P seder a quinquefolia (L) Greene

No. 2 RATES OF WATER LOSS FROM LEAVES 111
and Vitis cordifolia Michx. lost water more rapidly along themidrib than on the remainder of the leaf. This was determinedby the fact that a pink streak appeared in the cobalt paperwhich was directly over the midrib or a large vein. Theremainder of the paper continued blue for some time.
Starting at 12:45 P. M., on July 7, a series of tests weremade extending through 24 hours on Sambucus racemosa.The plant was growing on a talus slope, east exposure, verysandy soil, and protected by a high, cave-like cliff. Therewas a large spring a few feet away, so it likely had a plentiful
Pig. 3. Graph showing standard water loss for Sambucus racemosa during 24hours. R. H., relative humidity. U, upper leaf surface. L, lower leafsurface.
water supply. The leaves were tagged and an area carefullymarked on which the readings were taken each time. Thereadings were taken at two hour intervals. The results aregraphically shown in Fig. 3.
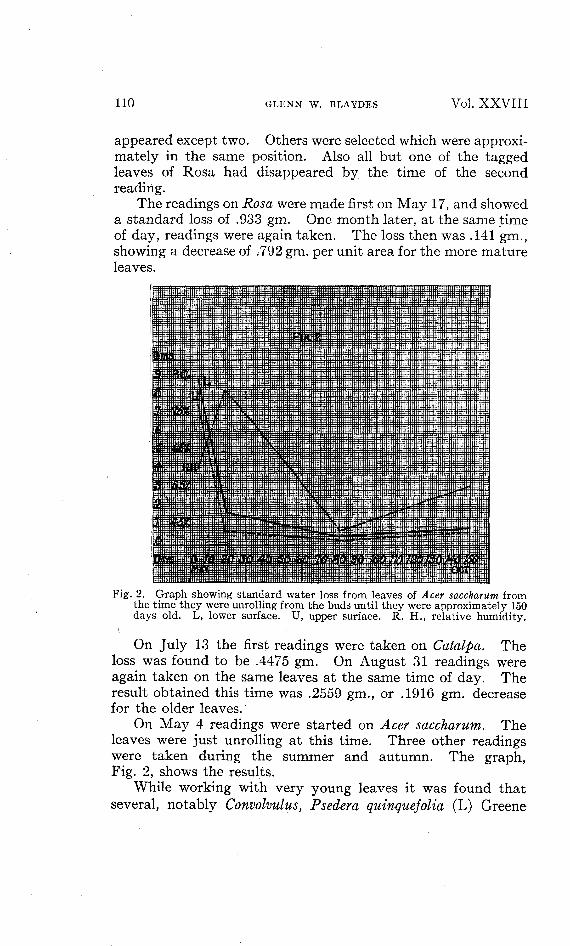
Another series through 24 hours was obtained for Catalpabignonioides. Readings were taken at intervals of 2 hoursexcepting from 7:45 A. M. to 3:45 P. M., during which timethey were taken every hour. Five leaves, in apparently goodcondition, were selected and tagged as for Sambucus. Fig. 4 isa graph of the results obtained.
112 GLENN W. BLAYDES Vol. XXVIII
Peirce (14) states that many plants living in swamps andswampy places have constantly open stomata, and cites willowsas a note-worthy example. Haberlandt (7) says '' In many
Fig. 4. Catalpa bignonioides standard water loss for 24 hours. R. H., relativehumidity. U., upper leaf surface. L., lower leaf surface.
Fig. 5. Polygonum amphibium standard water loss. R. H., relative humidity.U., upper leaf surface. L., lower leaf surface.
plants the stomata lose their power of adjustment more orless completely, or at any rate become incapable of closingtightly after a certain age. This physiological degeneration of
No. 2 RATES OF WATER LOSS FROM LEAVES 113
the stomata takes place at a comparatively early age in floatingand other aquatic plants, and also in a number of shade-lovinghygrophytes." Delf (6) refers to such instances when con-sidering Rosenberg's (15) work on the halophytes.
In order to investigate some of these aquatic and moistsoil forms a series of readings were made, beginning first withPolygonum amphibium. The time of the readings range from7:45 A. M. to 5:30 P. M., and were taken at two hour intervals.
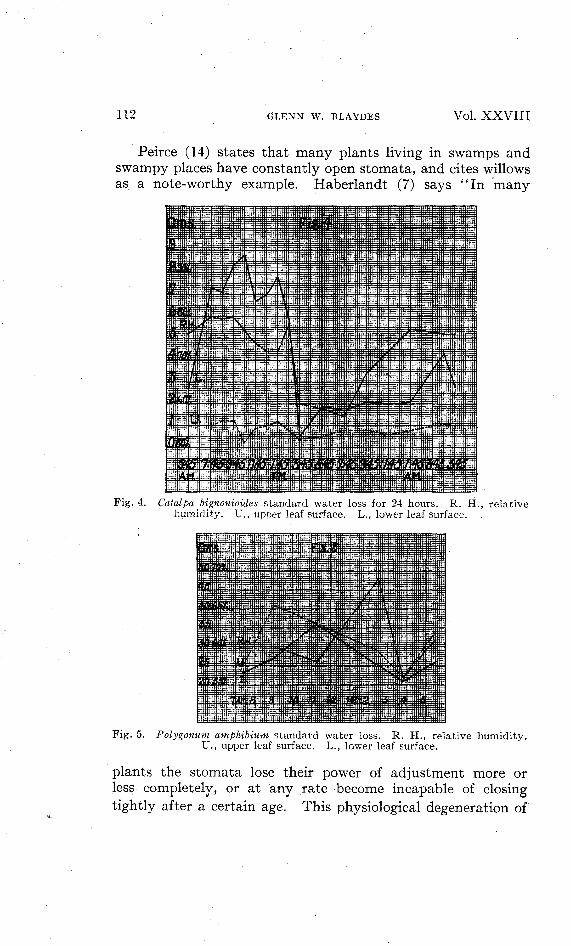
Fig. 6. Salix nigra standard water loss. R.leaf surface. L., lower
H., relative humidity. U., upperleaf surface.
Fig. 5 shows the results. Series were taken on Salix nigra,Dianthera americana, Hibiscus Moscheutos and Typha angusti-folia. The Salix and Dianthera were growing in water alongthe edge of a river; and the Polygonum Hibiscus and Typhawere growing in water along the edge of a Sphagnum bog.Figs. 6, 7, and 8 respectively show the results.
SUMMARY AND CONCLUSION.
1. The data collected on the list of plants holds good onlyfor the time and conditions listed. The time of day, age ofplant, position of leaves, and habitat have a great deal to dowith the standard loss. Other unknown factors may also causea variation.

114 GLENN W. BLAYDES Vol. XXVIII
2. The average standard water loss for the whole list of 123species, on which data was collected, is 1.15012 grams of watervapor in 1 hour for a leaf surface of 100 square centimeters.This and the following amounts are averages for both leafsurfaces.
Fig. 7. Dianthera americana standardU., upper leaf surface.
water loss. R. H., relative humidity.L., lower leaf surface.
Fig. 8. I. Hibiscus Moscheutos standard water loss. Graph shows loss for lowersurface only. II. Typha angustifolia standard water loss. C , curved surface.P., flat surface of leaves.

No. 2 RATES OF WATER LOSS FROM LEAVES 115
3. The average standard water loss, per hour for 100square centimeters, for each group tested is as follows:
No. TestedI. Spermatophytes 1.2146 gms 114
A. Gymnosperms 605 gm 7B. Angiosperms 1.2545 gms 107
1. Grasses* 8256 gm 11II. Pteridophytes 4564 gm 7
III. Bryophytesf 4.571 gms 1
4. The average rate of standard water loss for each of 8associations is as follows:
No. TestedSwamp 1.9644 gms 10Bog (acid) 6413 gm 9Pond and Lake Margin. . . . 2.2965 gms 4River Margin 1.9395 gm 3River Bank 9413 gm 3Flood Plain (mature) 7549 gm 8Ledge association 293 gm 2Talus slope 1.2218 gms 8
5. The following plants showed the greatest standard loss:
Polytrichum ohioense 4.571 gms.Plantago major 3.802 "Polygonum amphibium 3.661 "Iris versicolor 3.452 "Alisma Plantago-aquatica 3.267 "
6. The following is a list of plants showing lowest water loss:Erigeron annuus% 04 gm.Juglans nigra 074 "Bromus inermis 076 "Elymus virginicus 083 "Buchloe dactyloides 085 "Silphium perfoliatum 085 "Aesculus glabra 09 "
7. Tests on evergreen leaves, before growth had startedin the spring, showed the following results:
Angiosperms 8523 gm.Gymnosperms 5481 "Pteridophytes . .2401 "
*This includes swamp as well as plain form).^Polytrichum ohioense, growing in a very moist location.JThis plant was growing in a very dry location. Tests were made on another
plant growing at the edge of a swamp. The soil was very wet. The standardloss in this instance was .37805 gm. per 100 sq. cm.
116 GLENN W. BLAYDES Vol. X X V I I I
8. Tests for comparison between Acer saccharum, Pinusaustriaca and P. sylvestris, under apparently the same externalenvironmental conditions, showed that the year old pine needleswere losing more water than the leaves of the maple whichwere about 20 days old.
9. Tests on Abutilon, Amaranthus, Chenopodium, Convol-vulus, Digitaria, Setaria, Xanthium, Solanum and Zea, allgrowing near one another in the same field, showed an averagestandard loss of 1.631 gms. The average for the weeds alonewas 1.6485 gms. This includes Digitaria and Setaria which arevery slow water losers. The average for the corn and potatowas 1.5735 gms.
10. Graphic results of a series of readings on Amaranthusand Zea, growing side by side, shows that the pigweed losesnearly 6 times as much water as the corn per 100 square centi-meters. This is just considering the maximum loss for each.The graph also shows that the time of maximum loss mayvary for different species.
11. The following common "weeds," selected at random,showed an average standard' loss of 1.1425 gms.: Amaranthus,Xanthium, Chenopodium, Convolvulus, Abutilon, Lactuca,Arctium, Setaria, Digitaria, Taraxicum, Polygonum virginianum,Leonurus, Erigeron, Cirsium and Ambrosia. Four agriculturalplants showed a standard loss of 1.1085 gms. They were asfollows: Zea, Solanum tuberosum, Bromus and Phleum.
12. Tests on rolled and unrolled leaves of Elymus showedthat the unrolled leaves were losing over 10 times as muchwater as the leaves which were rolled.
13. Leaves of Ulmus, at an approximate altitude of 40feet, were losing less water than those near the ground.
14. Very young leaves of Silphium perfoliatum, Corylus,Arctium, Cephalanthus, Chenopodium, Convolvulus, and Sar-racenia, lose less water than mature leaves on which tests weremade simultaneously. Typha showed a greater loss for theyoung leaves. The average standard loss for the group,including Typha, was 1.5735 grams for the young leaves and1.8966 grams for the mature ones. In the instance of Typhathe amount lost for the young leaves was 1.5825 grams per100 square centimeters more than the total amount lost by theother seven species. Leaving Typha out of consideration, themature leaves on the first seven species lost on an average of3.916 times that of the young leaves.

No. 2 RATES OF WATER LOSS FROM LEAVES 117
15. A series of readings taken at different times duringthe spring, summer and autumn, on Rosa, Catalpa, and Acer,showed a decrease in the standard loss as the leaves grew older.At present the writer is unable to correlate these results withthose obtained by simultaneous readings on young and matureleaves.
16. Young leaves of Convolvulus, Pseder a and Vitis, showeda more rapid loss of water along the midrib and large veins thanon other parts of the leaves. More mature leaves did not showthis.
17. Series of readings running through 24 hours in theinstances of Catalpa and Sambucus, and from 3 to 7 readings onPolygonum amphibium, Salix nigra, Hibiscus, Dianthera, Typhaangustifolia, Amaranthus and Zea, showed that the maximumrate of water loss may occur at different times of day in differentspecies. The series on Polygonum, Salix, Hibiscus, Diantheraand Typha, show that these water forms have a very decidedrhythm in their water loss as do other forms tested, and thattheir rates of standard water loss varies within a wide rangeduring the day.
18. More data, from many representatives of variousgroups and associations of plants, are needed before accurategeneralizations can be made.
The writer wishes to express his very great appreciationand gratitude to Dr. E. N. Transeau, Dr. A. E. Waller, andDr. J. D. Sayre of the Ohio State University, Department ofBotany, for their help, advice, criticism and continued interestin this work. The same is expressed to Dr. C. E. O'Neal ofthe Ohio Wesleyan University, Department of Botany, and toothers who have so kindly lent their services from time to time.
LITERATURE CITED.1. BAKKE, A. L.
Studies on the Transpiring Power of Plants. Jour, of Ecology, 2:145-173,1914.
2.Determination of Wilting. Bot. Gaz. 66:81-116, 1918.
3. and LIVINGSTON, B. E.Further Studies on the Foliar Transpiring Power in Plants. Physiol.
Res. 2:51-71, 1916.4. CRIBBS, JAMES E.
Ecology of Tilia americana. I. Comparative Studies of the FoliarTranspiring Power. Bot. Gaz. 48:262-282, 1919.
5.Ecologv of Tilia americana. II. Comparative Studies of the Foliar
Transpiring Power. Bot. Gaz. 49:289-313, 1921.
118 GLENN W. BLAYDES Vol. X X V I I I
6. DELF, E. M.Transpiration and Behavior of Stomata in the Halophytes. Ann. Bot.
25:485-505, 1911.7. HABERLANDT, DR. E.
Physiological Plant Anatomy, pp. 474-475. Translated by Drummond,Montagu, from fourth German edition. Macmillan and Co., NewYork, 1914.
8. KlESSELBACH, T. A.Transpiration as a Factor in Crop Production. Res. Bull. No. 6,
Nebraska Agr. Exp. Sta., 1916.9. LIVINGSTON, B. E.
The Resistance Offered by Leaves to Transpirational Water Loss. ThePlant World, 16:1-35, 1913.
10. AND SHREVE, EDITH B.Improvements in the Method for Determining the Transpiring Power of
Plant Surfaces by Hygrometric Paper. The Plant World, 19:287-307,1916.
11. MCGINNIS, HELEN A. AND MCDOUGAL, W. B.A Comparison of the Transpiration Rates of Corn and Certain Common
Weeds. Illinois State Academy of Science, 16:82-88.12. MEYER, BERNARD S.
The Measurement of the Rate of Water-Vapor Loss from Leaves underStandard Conditions. Amer. J. Bot. 14:582-591, 1927.
13.Studies on Physical Properties of Leaves and Leaf Saps. The Ohio Jr.
Sci., 27:263-288, 1927.14. PEIRCE, GEORGE JAMES.
The Physiology of Plants, p. 143. Henry Holt and Company, New York,1926.
15. ROSENBERG, O.Uber die Transpiration der Halophyten. Ofvers af Kongl. Vetenskap—
Akad. Forhandlingar, Stockholm, 1897. (Reviewed by Delf, E. F.,Ann. Bot. 25:485-505, 1911.
16. SHIVE, J. W. AND MARTIN, W. H.The Effect of Surface Films of Bordeaux Mixture on the Transpiring
Power in Tomato Plants. Plant World, 20:67-86, 1917.17. SHREVE, EDITH BELLAMY.
The Role of Temperature in the Determination of the Transpiring Powerof Leaves by Hygrometric Paper. The Plant World, 22:172-179, 1919.
18. SHREVE, FORREST.The Transpiration Power of Plants as Influenced by Differences of
Altitude and Habitat. (Abstract) Science, N. S. 43:363, 1916.19. STAHL, E.
Einige Versuche uber Transpiration und Assimilation. Bot. Zeit.52:117-146, 1894. (Reviewed by Livingston, B. E., Plant World,19:287-309, 1916.
20. TRELEASE, S. F.Foliar Transpiring Power of the Cocoanut. The Philippine Journal of
Science, 20:167-176, 1922.
NEW BOOKS.
A COMPREHENSIVE MEMORANDUM ON
SCIENTIFIC MANAGEMENT IN EUROPE
Has been issued as part of the documentation of the InternationalEconomic Conference, which began its sessions at Geneva on May 4.The document was prepared by the Economic and Financial Sectionof the League of Nations from information furnished to it by govern-ments, by members of the Preparatory Committee for the Conferenceand by industrial organizations, which prepared memoranda at therequest of members of the committee.
The salient phases of the subject and its international aspects areexamined from this mass of information, and the statistical tables andsummaries, as a consequence, are the most comprehensive, authenticand up-to-date available.
The memorandum is obtainable from the American agent for pub-lications of the League of Nations, World Peace Foundation, 40 Mt.Vernon Street, Boston, Massachusetts. Price, $ .15.
119