a survey of energy efficiency metrics - kth/kth cesc may 2016 b.pdfa survey of energy efficiency...
TRANSCRIPT

A Survey of Energy Efficiency Metrics
Kerry Hinton, Fatemeh Jalali
Centre for Energy-Efficient Telecommunications (CEET)University of Melbourne
Australia

2
• Centre for Energy Efficient Telecommunications
• Equipment and network power
• Service power: Photo sharing– Constructing use phase energy models
– Unshared and shared equipment models
– Single user and total service energy
– Consequential & attributional energy
• Metrics– What is the purpose of a metric?
– Standardised metrics
• Energy efficiency of a service– Network synchronisation and energy efficiency
• Conclusions
Agenda

The future energy efficiency gaps• Current data growth rate >> traditional energy efficiency
improvement rate
• Technology is not keeping up with traffic growth– May suffer an “energy bottleneck”
0
2
4
6
8
10
12
14
16
2014 2015 2016 2017 2018 2019 2020
Nor
mal
ised
incr
ease
Year
Global mobile data 57% pa
Global IP data 23% paTrend mobile efficiency 20%
Trend core efficiency 15%
Efficiency gaps
Cisco, 2015GreenTouch, 2015

4
Centre for Energy-Efficient Telecommunications• Research centre located in the University of Melbourne
• Launched in March 2011
• Partnership between Alcatel-Lucent, the University of Melbourne and Victorian State Government
– $10 million for 2011 to 2015
– Additional funding of $2 million has extended CEET to 1st July 2016
• World’s first research centre focusing on energy-efficient telecommunication technologies
• Focus on collaboration between business and academia
• Major contributor to GreenTouch international consortium
Service power
• “Consequential” and “attributional” power– “Consequential”
• Additional network power to support a service
– Current power is “sunk”
• How much extra power does e-banking require?
• Focus is on increase in power consumption
• Estimates only additional network power for additional services
– “Attributional”
• Share of network power / carbon footprint of Internet service
– Includes current power
• What is the carbon footprint of e-banking?
• Distributes total network power / carbon footprint across all services
6
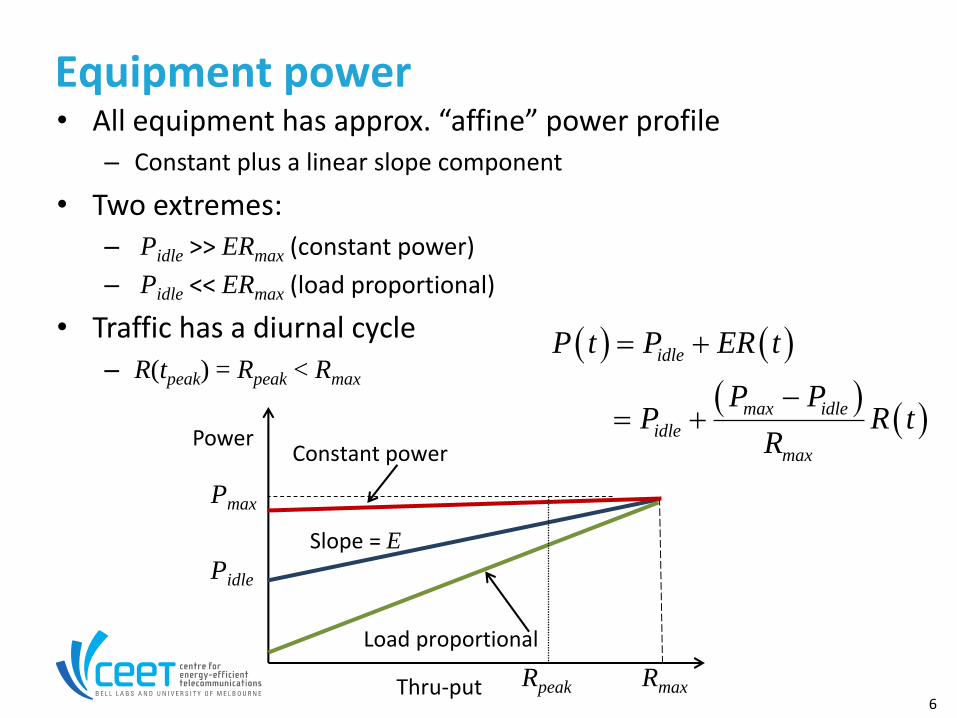
• All equipment has approx. “affine” power profile– Constant plus a linear slope component
• Two extremes:– Pidle >> ERmax (constant power)
– Pidle << ERmax (load proportional)
• Traffic has a diurnal cycle
– R(tpeak) = Rpeak < Rmax
Equipment power
idle
max idle
idle
max
P t P ER t
P PP R t
R
Rmax
Pmax
Pidle
Power
Thru-put
Slope = E
Load proportional
Constant power
Rpeak
7
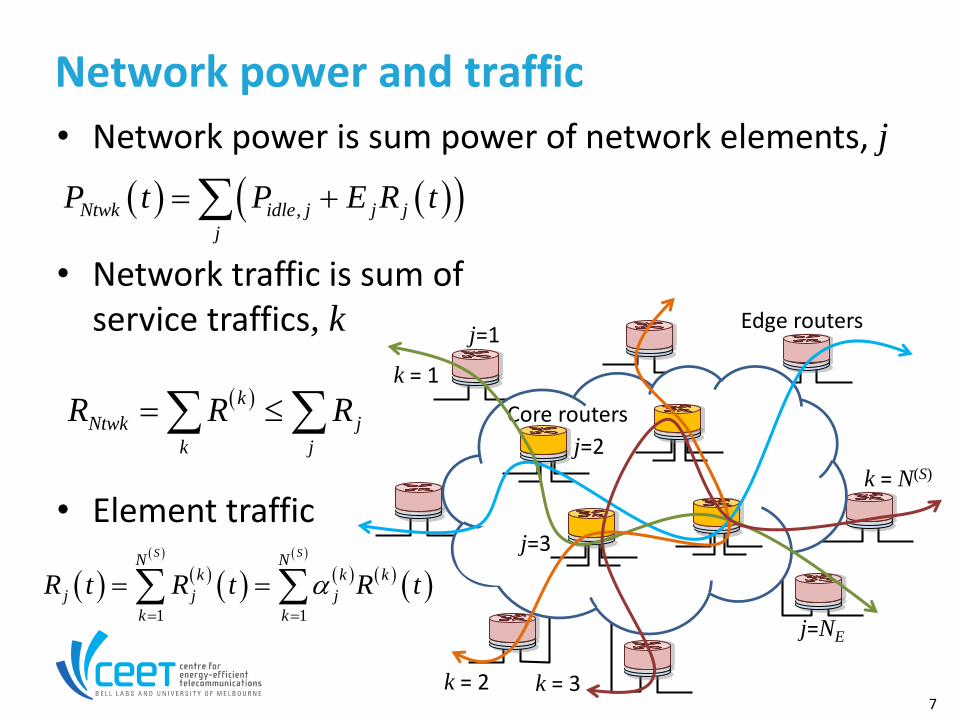
• Network power is sum power of network elements, j
• Network traffic is sum of service traffics, k
• Element traffic
Network power and traffic
,Ntwk idle j j j
j
P t P E R t
k
Ntwk j
k j
R R R
Edge routers
Core routers
j=1
j=3
j=2
j=NE
k = N(S)
k = 3k = 2
k = 1
1 1
S SN N
k k k
j j j
k k
R t R t R t
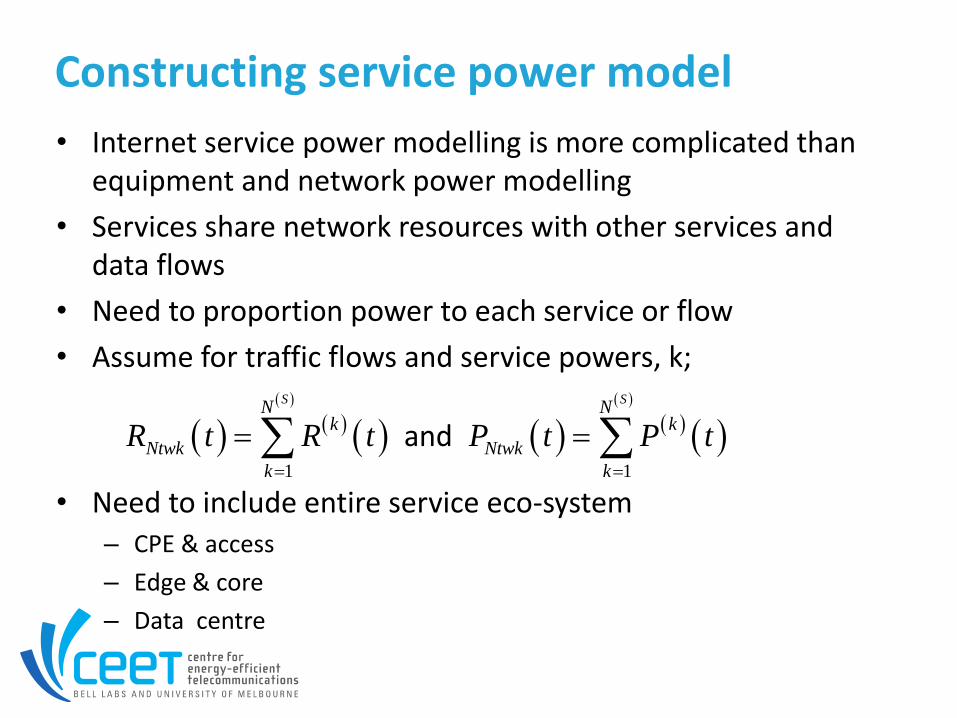
Constructing service power model
• Internet service power modelling is more complicated than equipment and network power modelling
• Services share network resources with other services and data flows
• Need to proportion power to each service or flow
• Assume for traffic flows and service powers, k;
• Need to include entire service eco-system– CPE & access
– Edge & core
– Data centre
1 1
S SN N
k k
Ntwk Ntwk
k k
R t R t P t P t
and
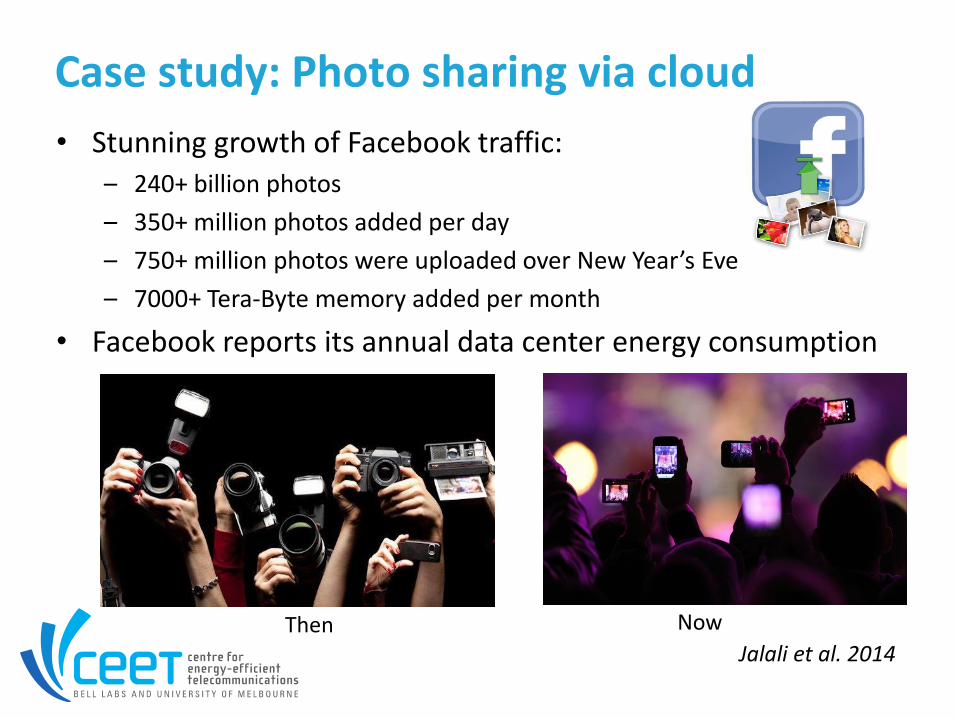
Case study: Photo sharing via cloud
• Stunning growth of Facebook traffic: – 240+ billion photos
– 350+ million photos added per day
– 750+ million photos were uploaded over New Year’s Eve
– 7000+ Tera-Byte memory added per month
• Facebook reports its annual data center energy consumption
Then Now
Jalali et al. 2014
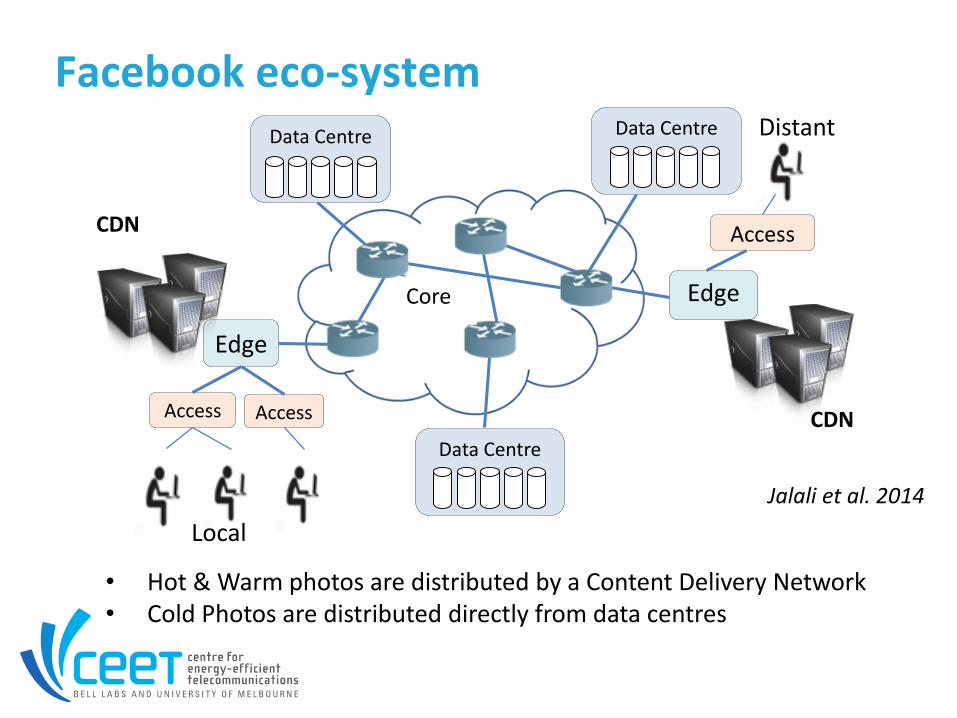
Facebook eco-system
• Hot & Warm photos are distributed by a Content Delivery Network• Cold Photos are distributed directly from data centres
Data Centre
CDN
CDNAccess
Edge
Data CentreData Centre
Edge
Access
Access
Distant
Local
Core
Jalali et al. 2014
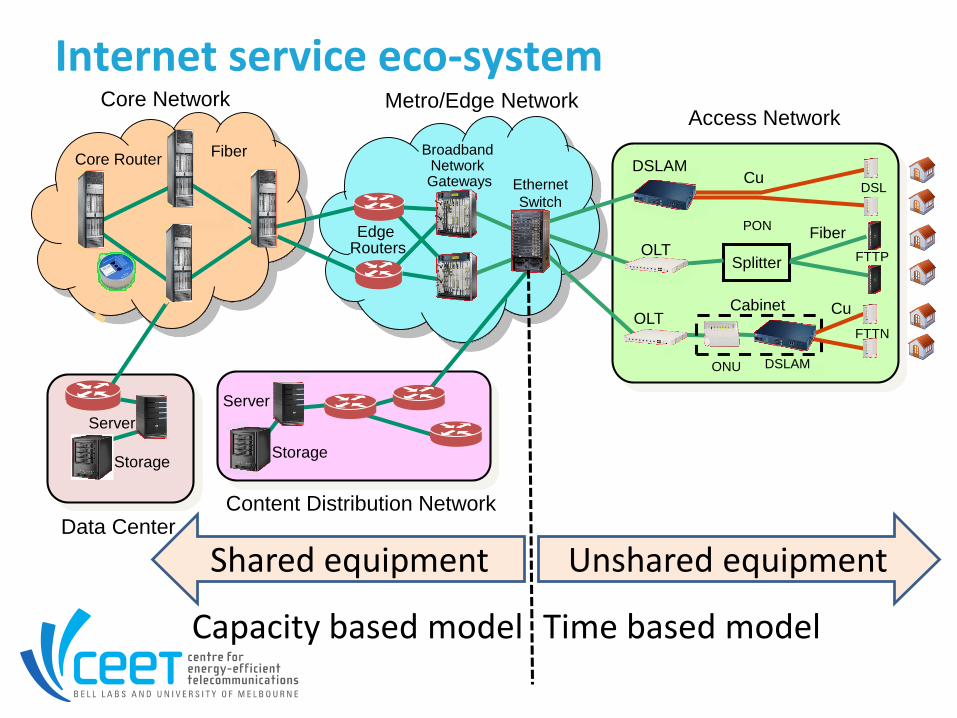
Internet service eco-system
Ethernet
Switch
OLTSplitter
Metro/Edge NetworkCore Network
Edge Routers
FTTP
FiberCore Router
Content Distribution Network
Storage
Server
Server
Storage
Fiber
Access Network
DSL
DSLAMCu
OLT
ONU
Cabinet
FTTN
DSLAM
Cu
Broadband Network Gateways
PON
Data Center
Unshared equipmentShared equipment
Capacity based model Time based model
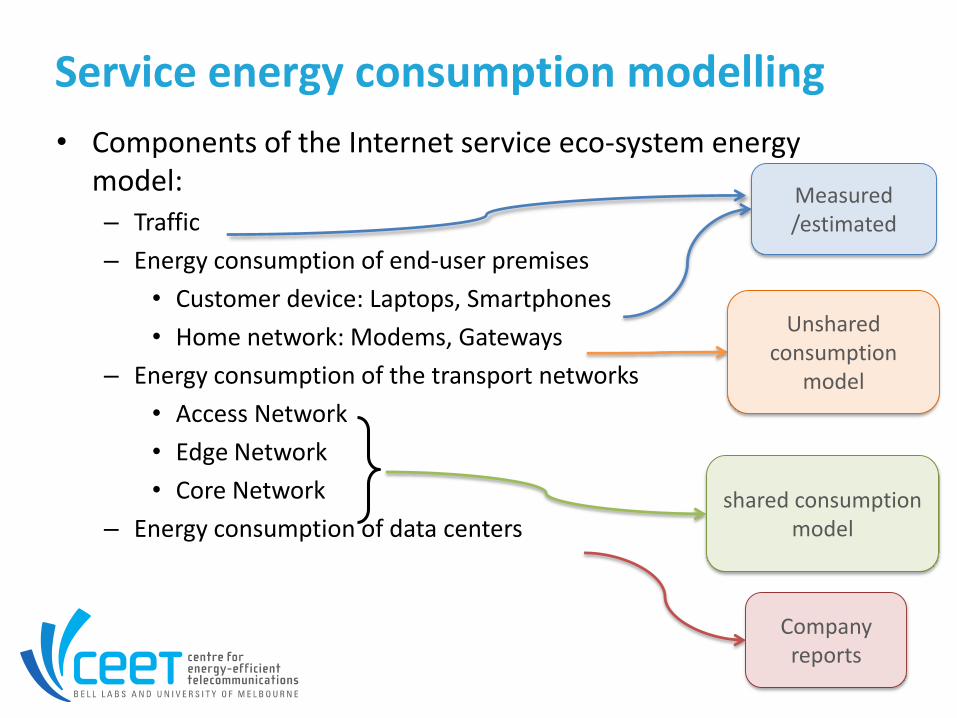
Service energy consumption modelling
• Components of the Internet service eco-system energy model:– Traffic
– Energy consumption of end-user premises
• Customer device: Laptops, Smartphones
• Home network: Modems, Gateways
– Energy consumption of the transport networks
• Access Network
• Edge Network
• Core Network
– Energy consumption of data centers
Measured /estimated
Unshared consumption
model
shared consumption model
Company reports
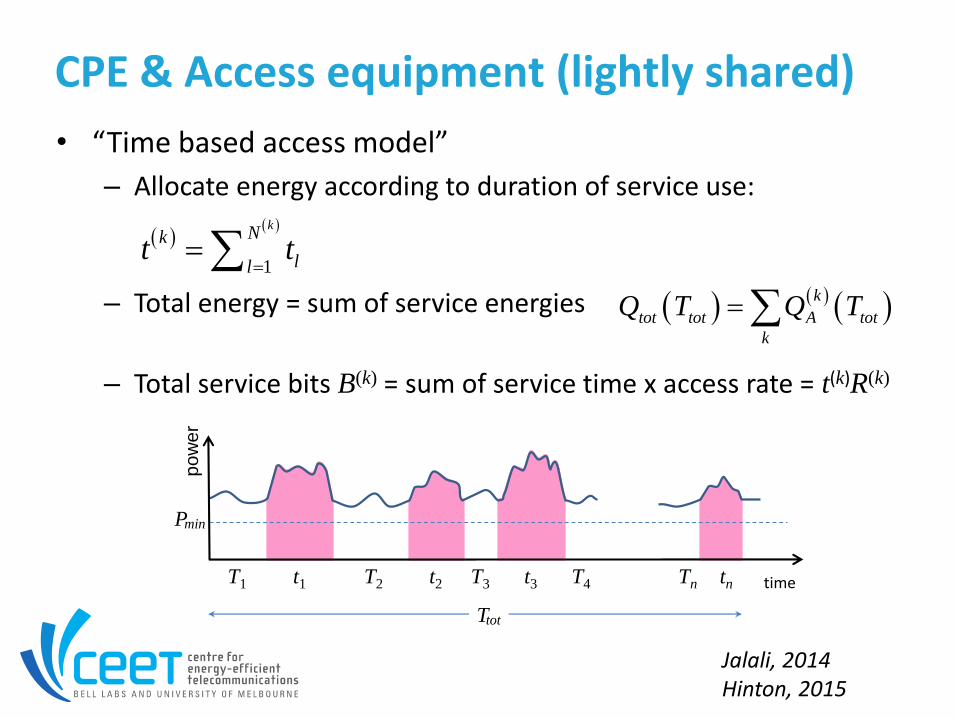
CPE & Access equipment (lightly shared)
• “Time based access model”
– Allocate energy according to duration of service use:
– Total energy = sum of service energies
– Total service bits B(k) = sum of service time x access rate = t(k)R(k)
timeT1 T2 T3 TnT4t1 t2 t3 tn
Ttot
Pmin
po
we
r
1
kNk
llt t
Jalali, 2014Hinton, 2015
k
tot tot A tot
k
Q T Q T
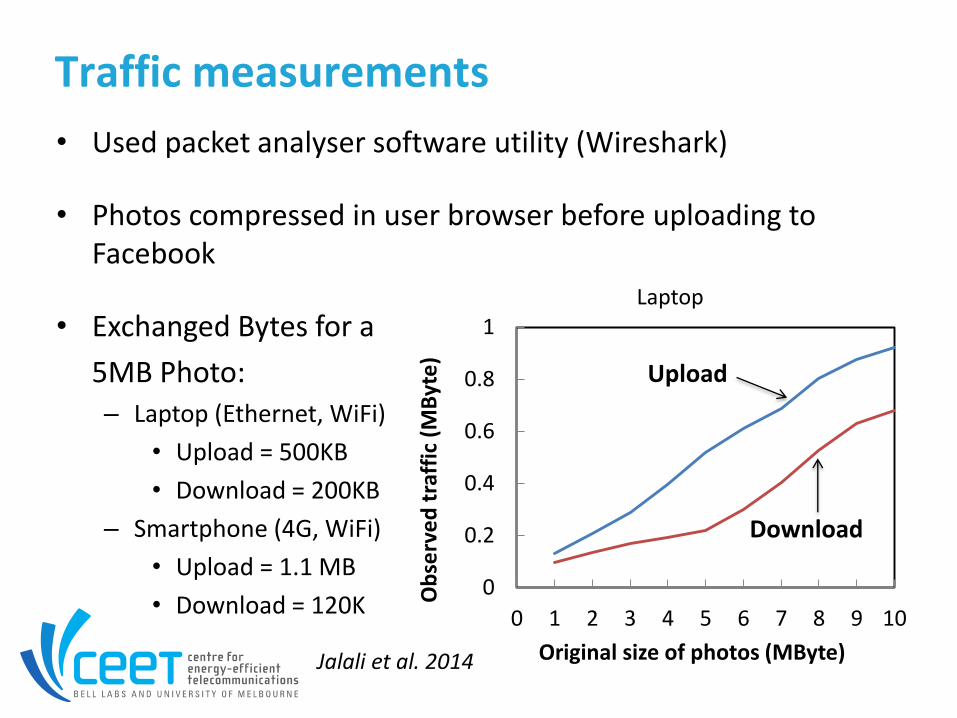
Traffic measurements
• Used packet analyser software utility (Wireshark)
• Photos compressed in user browser before uploading to Facebook
• Exchanged Bytes for a
5MB Photo: – Laptop (Ethernet, WiFi)
• Upload = 500KB
• Download = 200KB
– Smartphone (4G, WiFi)
• Upload = 1.1 MB
• Download = 120K
Jalali et al. 2014
0
0.2
0.4
0.6
0.8
1
0 1 2 3 4 5 6 7 8 9 10
Ob
serv
ed
tra
ffic
(M
Byt
e)
Original size of photos (MByte)
Download
Upload
Laptop

User device measurements• Direct measurement : Power-mate (resolution of 10 mW)
– Plots below are for laptop connected via Ethernet
• Uploading and downloading same 5 Mbyte photo
5MB photo Laptop Mobile Phone
Ethernet WiFi 4G WiFi
Upload 106 J 114 J 40 J 23 J
Download 23 J 33 J 18 J 8 J
9
10
11
12
13
14
15
16
0 20 40 60
Po
we
r (W
att)
Time (sec)
Pidle
Start End
9
10
11
12
13
14
15
16
0 5 10 15 20
Po
we
r (W
att)
Time (Sec)
Pidle
Start End
Upload Download
Jalali et al. 2014
16
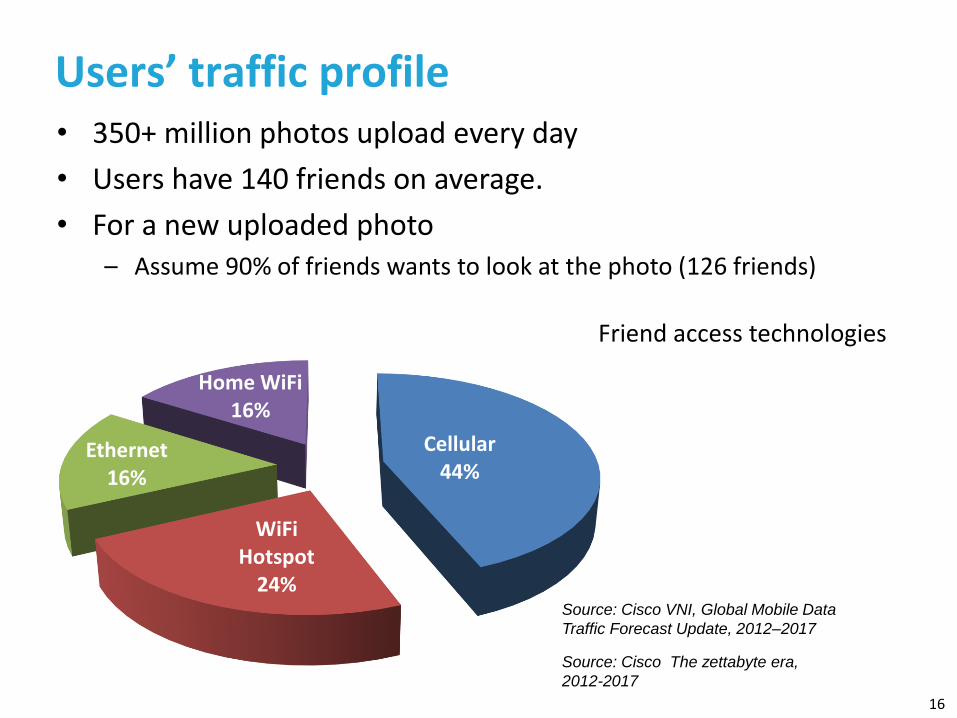
Cellular44%
WiFi Hotspot
24%
Ethernet16%
Home WiFi16%
Users’ traffic profile• 350+ million photos upload every day
• Users have 140 friends on average.
• For a new uploaded photo– Assume 90% of friends wants to look at the photo (126 friends)
Source: Cisco VNI, Global Mobile Data
Traffic Forecast Update, 2012–2017
Source: Cisco The zettabyte era,
2012-2017
Friend access technologies
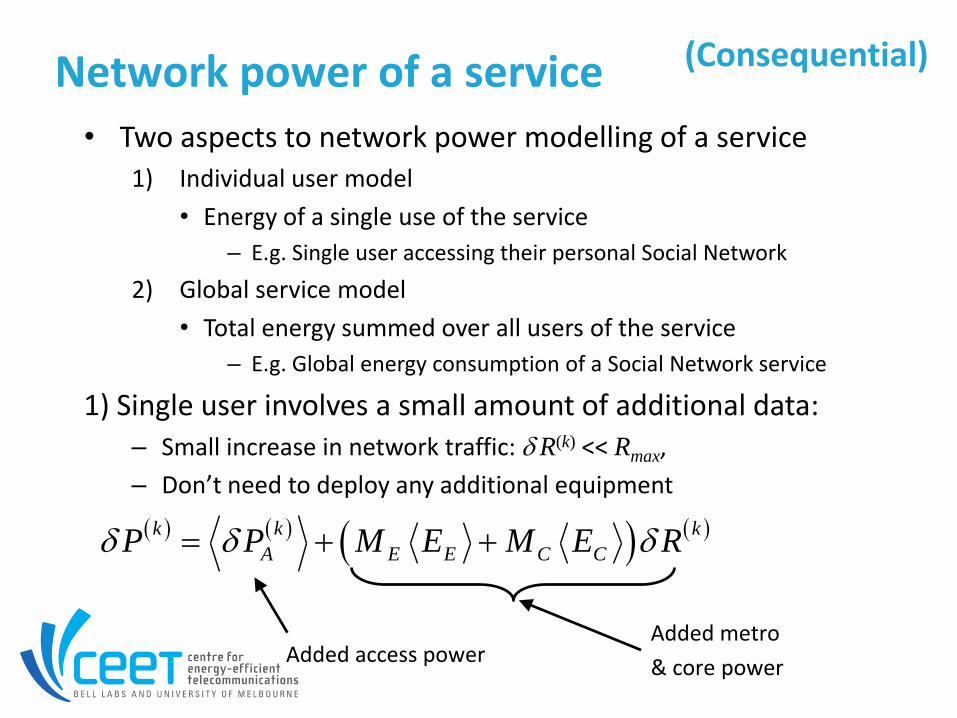
Network power of a service
• Two aspects to network power modelling of a service1) Individual user model
• Energy of a single use of the service
– E.g. Single user accessing their personal Social Network
2) Global service model
• Total energy summed over all users of the service
– E.g. Global energy consumption of a Social Network service
1) Single user involves a small amount of additional data:
– Small increase in network traffic: dR(k) << Rmax,
– Don’t need to deploy any additional equipment
(Consequential)
k k k
A E E C CP P M E M E Rd d d
Added access powerAdded metro
& core power
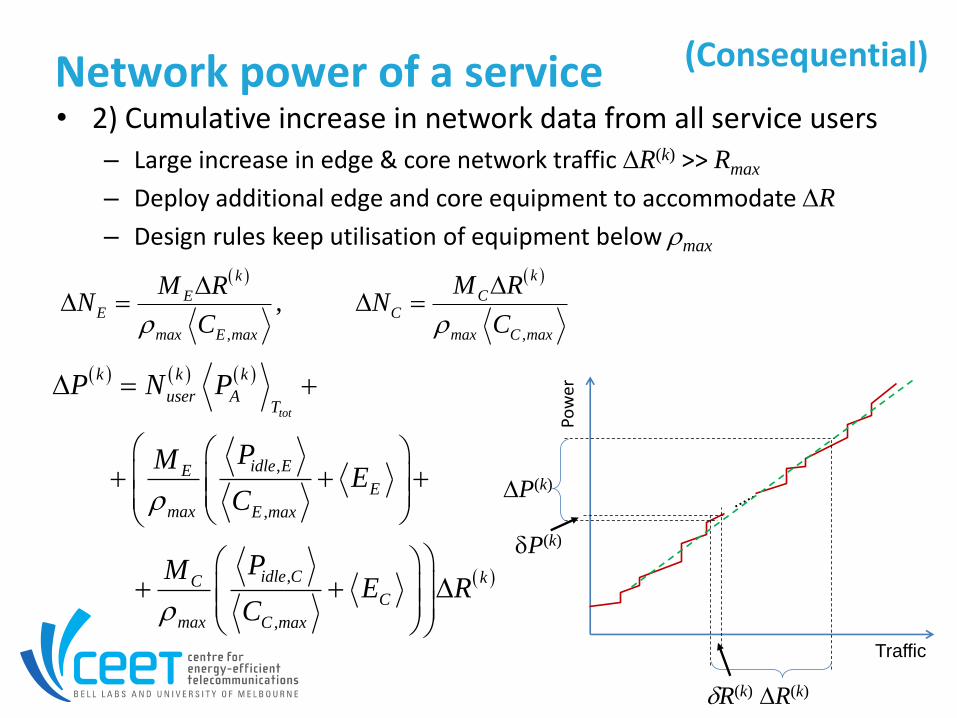
Network power of a service• 2) Cumulative increase in network data from all service users
– Large increase in edge & core network traffic DR(k) >> Rmax
– Deploy additional edge and core equipment to accommodate DR
– Design rules keep utilisation of equipment below rmax
, ,
,
kk
CEE C
max E max max C max
M RM RN N
C Cr r
DDD D
,
,
,
,
tot
k k k
user AT
idle EEE
max E max
idle C kCC
max C max
P N P
PME
C
PME R
C
r
r
D
D
Pow
er
DR(k)
DP(k)
dP(k)
dR(k)
Traffic
(Consequential)
Energy consumption of a service
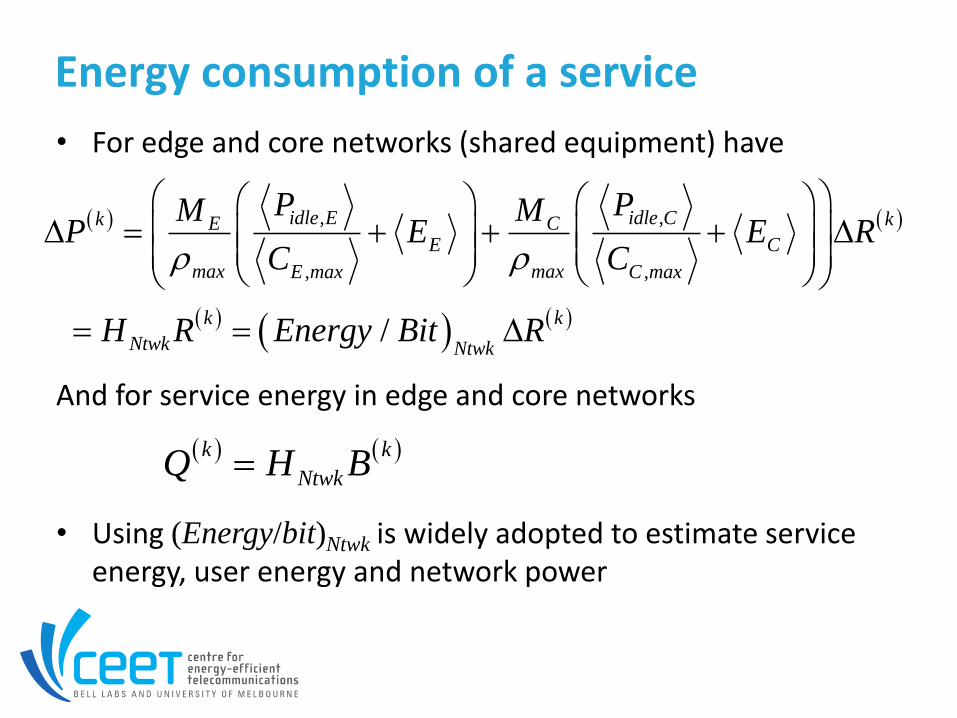
• For edge and core networks (shared equipment) have
And for service energy in edge and core networks
• Using (Energy/bit)Ntwk is widely adopted to estimate service energy, user energy and network power
, ,
, ,
/
idle E idle Ck kE CE C
max maxE max C max
k k
Ntwk Ntwk
P PM MP E E R
C C
H R Energy Bit R
r r
D D
D
k k
NtwkQ H B
20
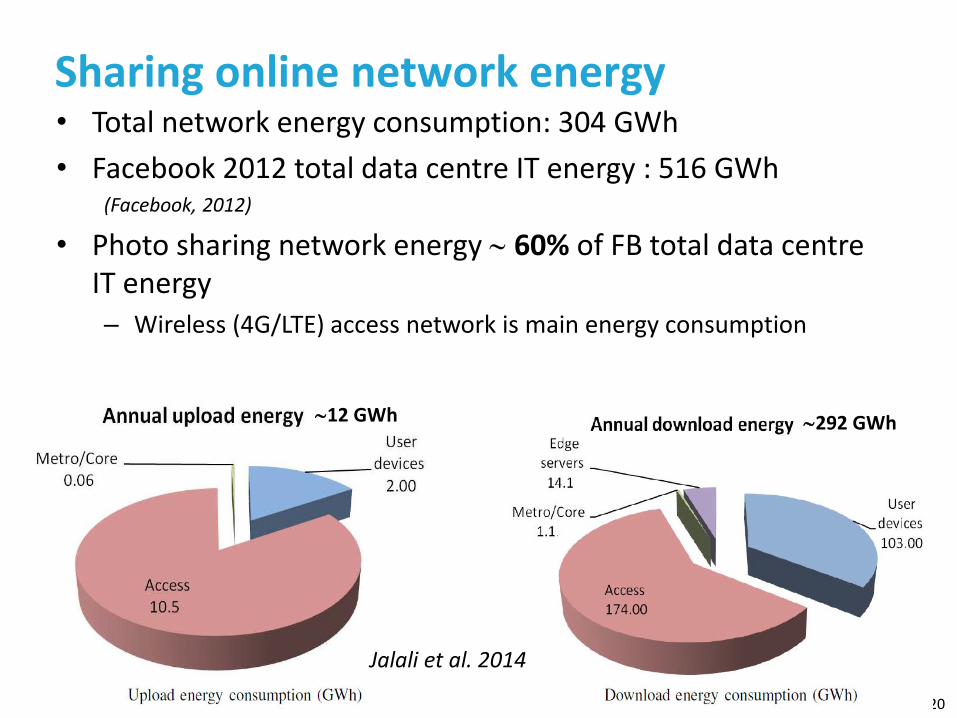
12 GWh 292 GWh
• Total network energy consumption: 304 GWh
• Facebook 2012 total data centre IT energy : 516 GWh(Facebook, 2012)
• Photo sharing network energy 60% of FB total data centre IT energy– Wireless (4G/LTE) access network is main energy consumption
Sharing online network energy
Jalali et al. 2014
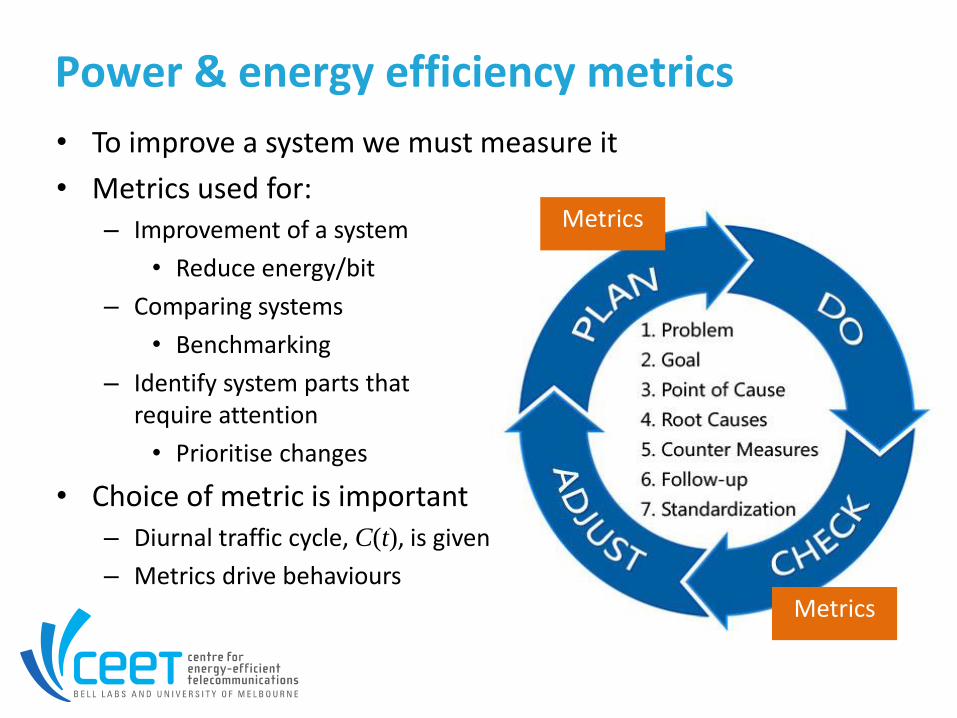
• To improve a system we must measure it
• Metrics used for:– Improvement of a system
• Reduce energy/bit
– Comparing systems
• Benchmarking
– Identify system parts that require attention
• Prioritise changes
• Choice of metric is important– Diurnal traffic cycle, C(t), is given
– Metrics drive behaviours
Metrics
Metrics
Power & energy efficiency metrics
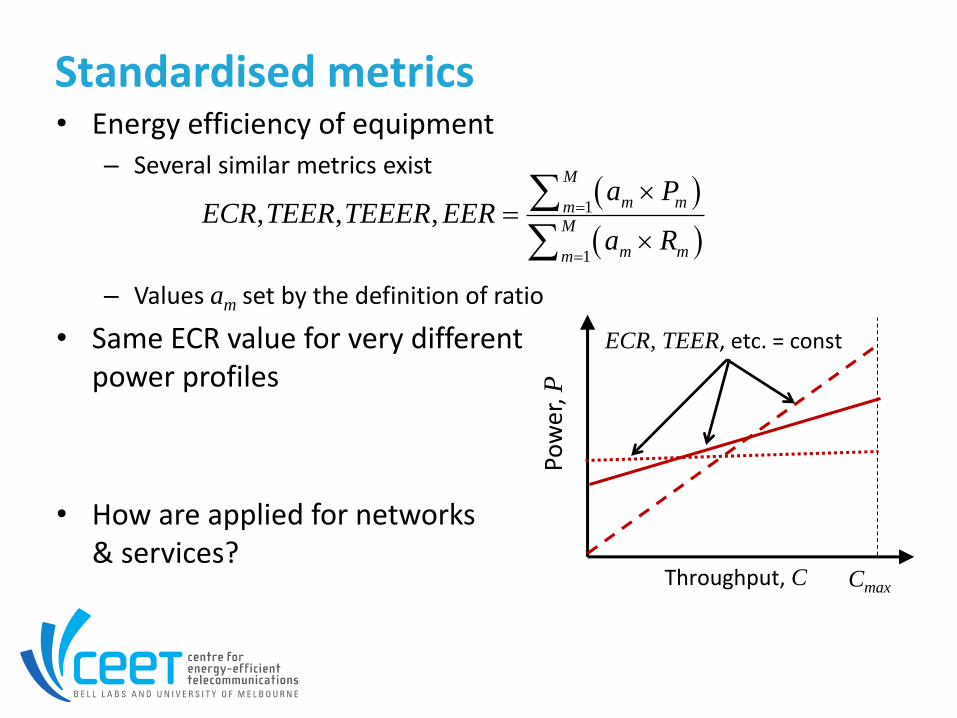
Standardised metrics• Energy efficiency of equipment
– Several similar metrics exist
– Values am set by the definition of ratio
• Same ECR value for very different power profiles
• How are applied for networks& services?
1
1
, , ,
M
m mmM
m mm
a PECR TEER TEEER EER
a R
Pow
er, P
Throughput, C Cmax
ECR, TEER, etc. = const

Energy efficiency: Network operator
• Instantaneous power/bit/sec: (Baliga J. et al. JLT Vol.27, 2009)
• Mean energy/bit: (GreenTouch, 2013, 2015)
• Mean instantaneous power/bit/sec (ITU-T Y.3022, 2013)
Ntwk Peak
Ntwk Peak
P t
R t
0
1.
T
NtwkNtwk Ntwk
Ntwk Ntwk NtwkT
P tP PowerAve dt
R Thruput T R t
( )
NtwkNtwk NtwkT T
Ntwk Ntwk NtwkT T
P t dtP Total Energy T
R Total Bits T R t dt
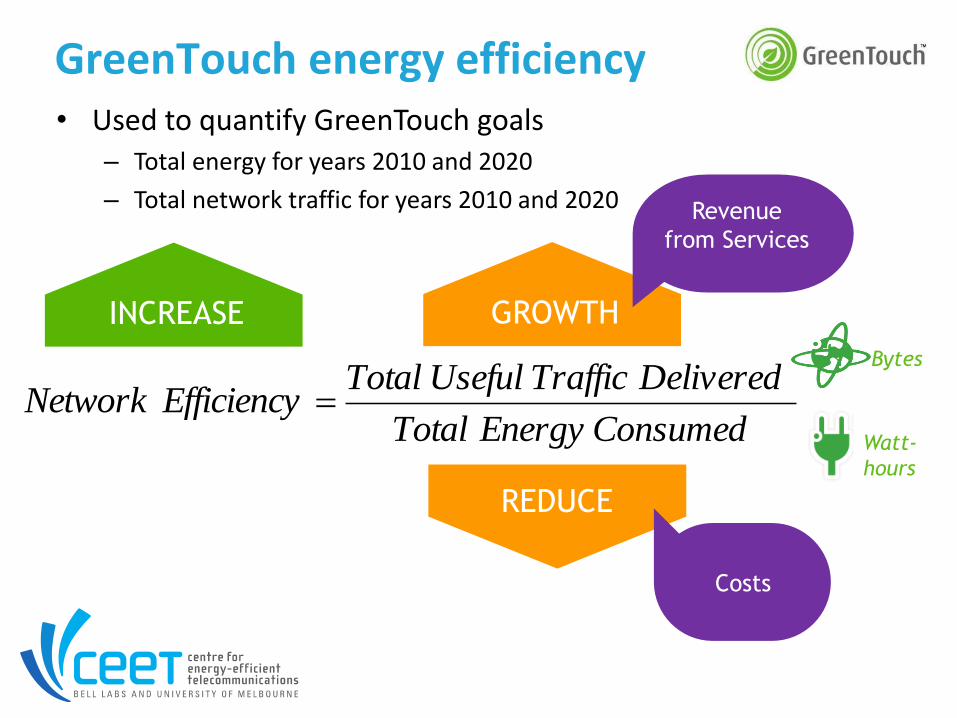
GreenTouch energy efficiency• Used to quantify GreenTouch goals
– Total energy for years 2010 and 2020
– Total network traffic for years 2010 and 2020
GROWTHINCREASE
REDUCE
Revenue
from Services
Costs
Bytes
Watt-
hours
ConsumedEnergyTotal
DeliveredTrafficUsefulTotalEfficiencyNetwork
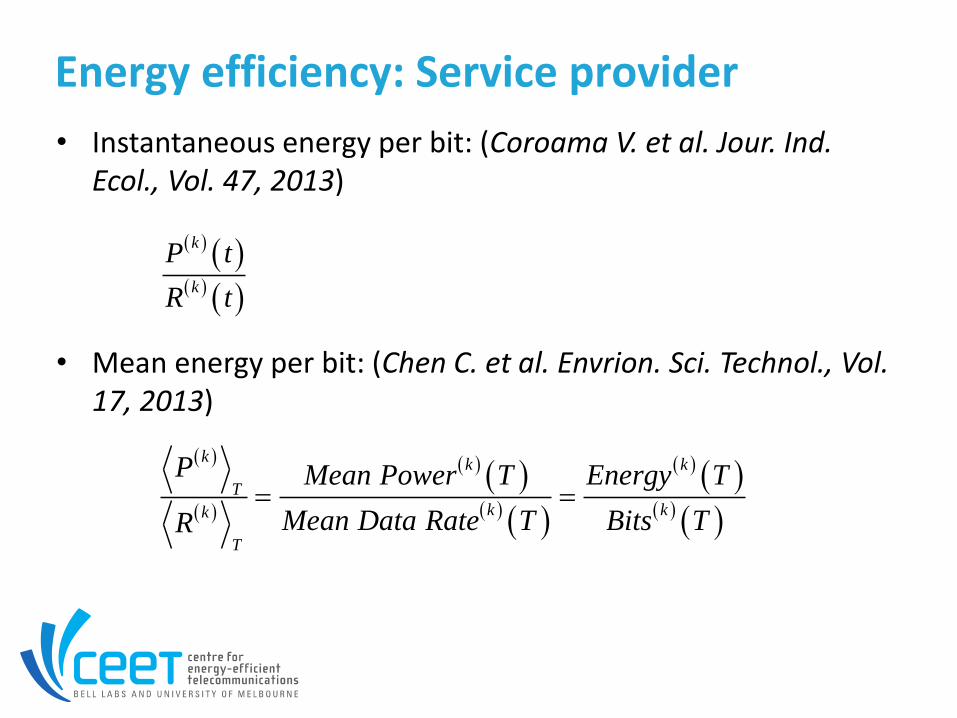
Energy efficiency: Service provider
• Instantaneous energy per bit: (Coroama V. et al. Jour. Ind. Ecol., Vol. 47, 2013)
• Mean energy per bit: (Chen C. et al. Envrion. Sci. Technol., Vol. 17, 2013)
kk k
T
k kk
T
P Mean Power T Energy T
Mean Data Rate T Bits TR
k
k
P t
R t
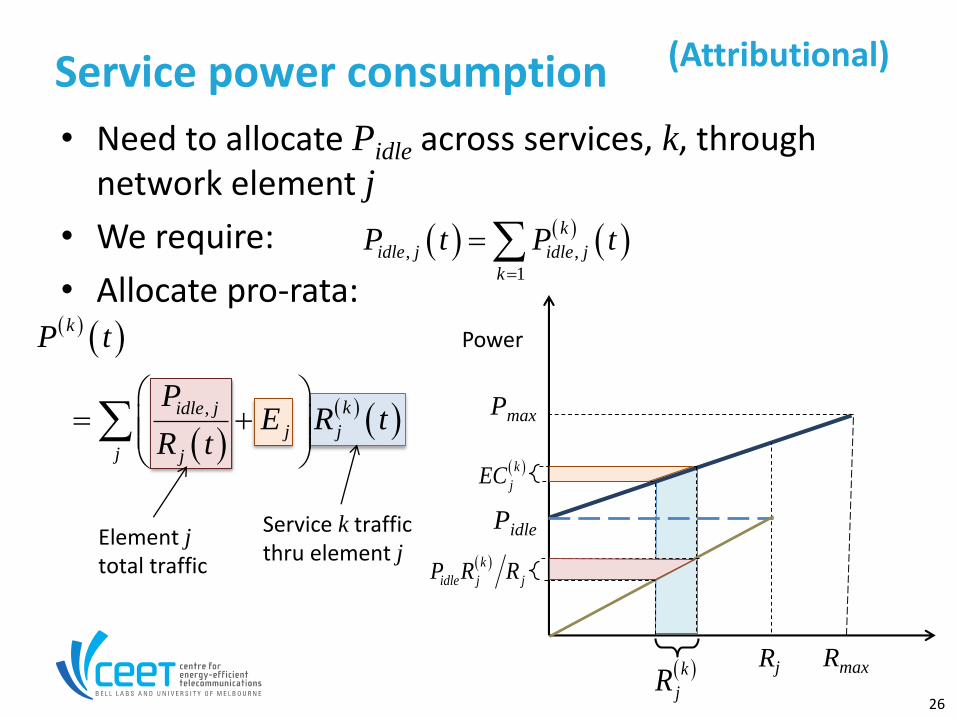
26
• Need to allocate Pidle across services, k, through network element j
• We require:
• Allocate pro-rata:
Service power consumption
, ,
1
k
idle j idle j
k
P t P t
Element jtotal traffic
Service k traffic thru element j
,
k
kidle j
j j
j j
P t
PE R t
R t
Rmax
Pmax
Pidle
Power
k
jRRj
k
jEC
k
idle j jP R R
(Attributional)
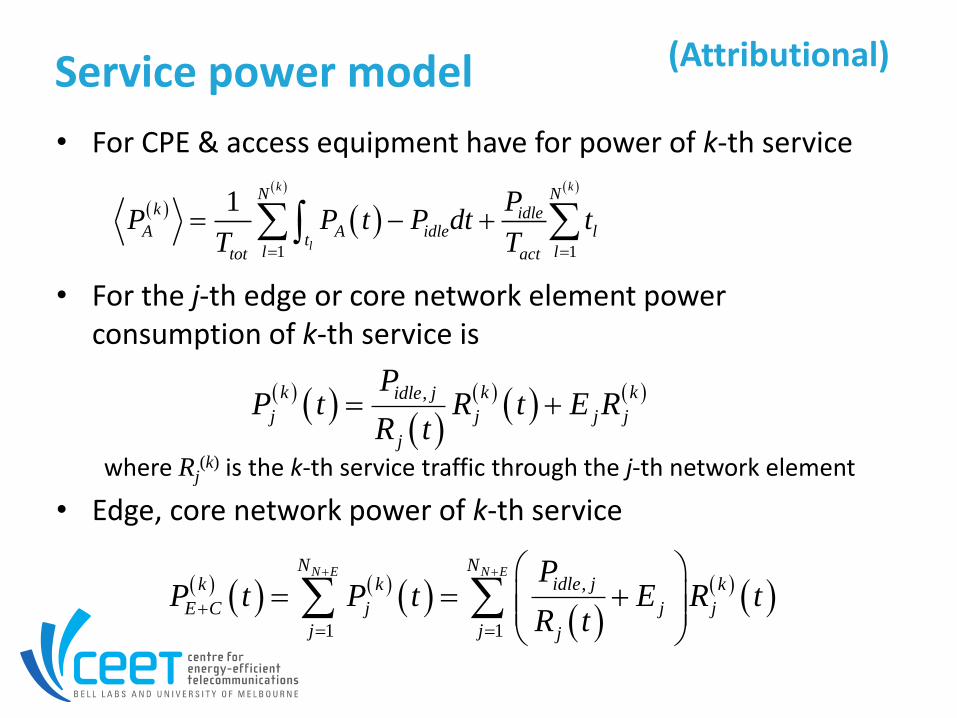
Service power model
• For CPE & access equipment have for power of k-th service
• For the j-th edge or core network element power consumption of k-th service is
where Rj(k) is the k-th service traffic through the j-th network element
• Edge, core network power of k-th service
,
1 1
N E N EN Nidle jk k k
E C j j j
j j j
PP t P t E R t
R t
,k k kidle j
j j j j
j
PP t R t E R
R t
1 1
1k k
l
N Nk idle
A A idle lt
l ltot act
PP P t P dt t
T T
(Attributional)
28
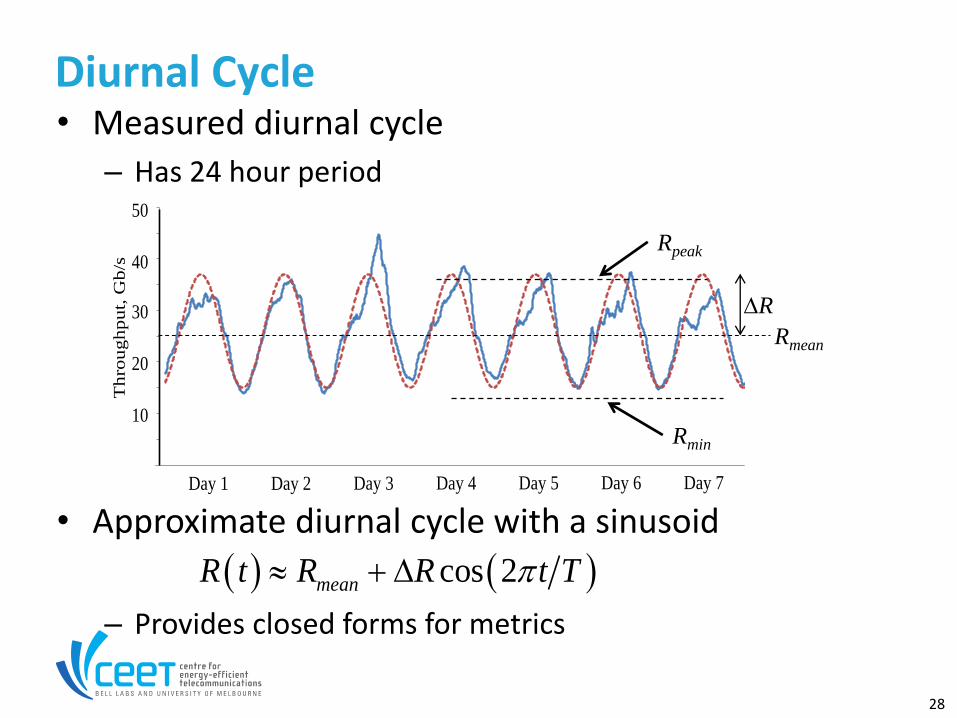
• Measured diurnal cycle
– Has 24 hour period
• Approximate diurnal cycle with a sinusoid
– Provides closed forms for metrics
Diurnal Cycle
cos 2meanR t R R t T D
0.00E+00
5.00E+07
1.00E+08
1.50E+08
2.00E+08
2.50E+08
3.00E+08
3.50E+08
4.00E+08
4.50E+08
5.00E+08
24/03/2012 4:48 25/03/2012 4:48 26/03/2012 4:48 27/03/2012 4:48 28/03/2012 4:48 29/03/2012 4:48 30/03/2012 4:48 31/03/2012 4:48
Day 1 Day 2 Day 3 Day 4 Day 5 Day 6 Day 7
50
40
30
20
10
Th
rou
gh
pu
t, G
b/s
Rmean
DR
Rpeak
Rmin
29
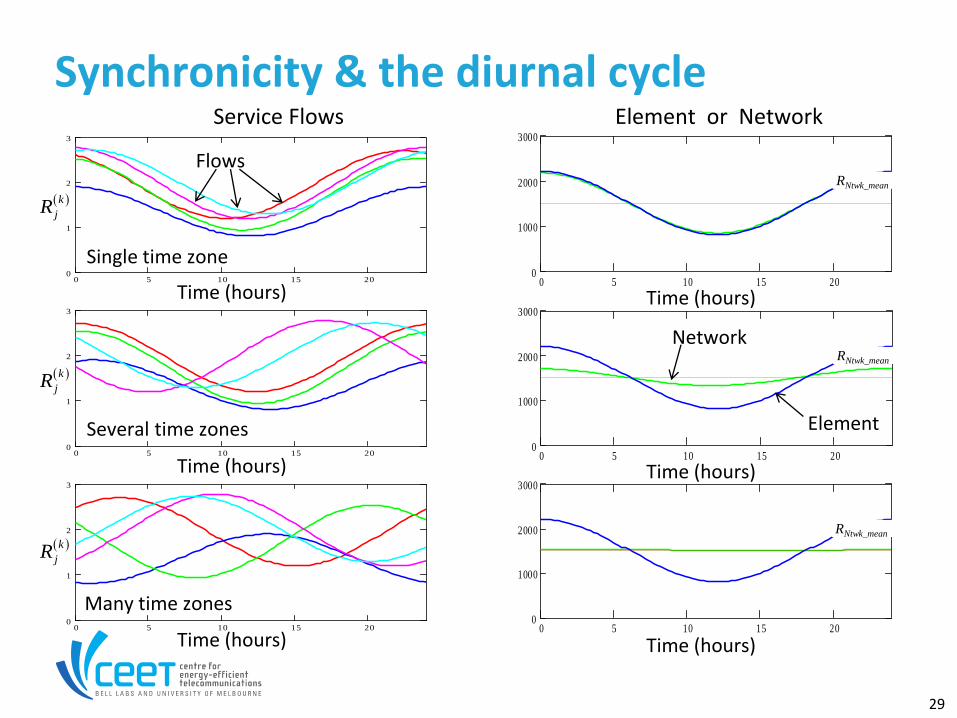
Synchronicity & the diurnal cycle
0 5 10 15 200
1000
2000
3000
CNtwk_mean
0 5 10 15 200
1
2
3
0 5 10 15 200
1000
2000
3000
CNtwk_mean
0 5 10 15 200
1
2
3
0 5 10 15 200
1000
2000
3000
CNtwk_mean
0 5 10 15 200
1
2
3
k
jR
k
jR
k
jR
Time (hours)
Time (hours)
Time (hours)
Time (hours)
Time (hours)
Time (hours)
Single time zone
Several time zones
Many time zones
Service Flows
Flows
Element or Network
Element
Network
RNtwk_mean
RNtwk_mean
RNtwk_mean
30
0.1
0.3
0.5
0.7
0
20
40
60
80
100
120
0.2 0.4 0.6 0.8 1.0 1.2 1.4 1.6 1.8 2.0
0.1 0.2 0.3 0.4 0.5 0.6 0.7 0.8 0.9 1.0Synchronicity (b)
PN
twk T
/R
Ntw
rk T
J/bit
0.1
0.3
0.5
0.7
0
50
100
150
200
250
0.2 0.4 0.6 0.8 1.0 1.2 1.4 1.6 1.8 2.0
0.1 0.2 0.3 0.4 0.5 0.6 0.7 0.8 0.9 1.0Synchronicity (b)
PN
twkr/R
Ntw
k T
nJ/
bit
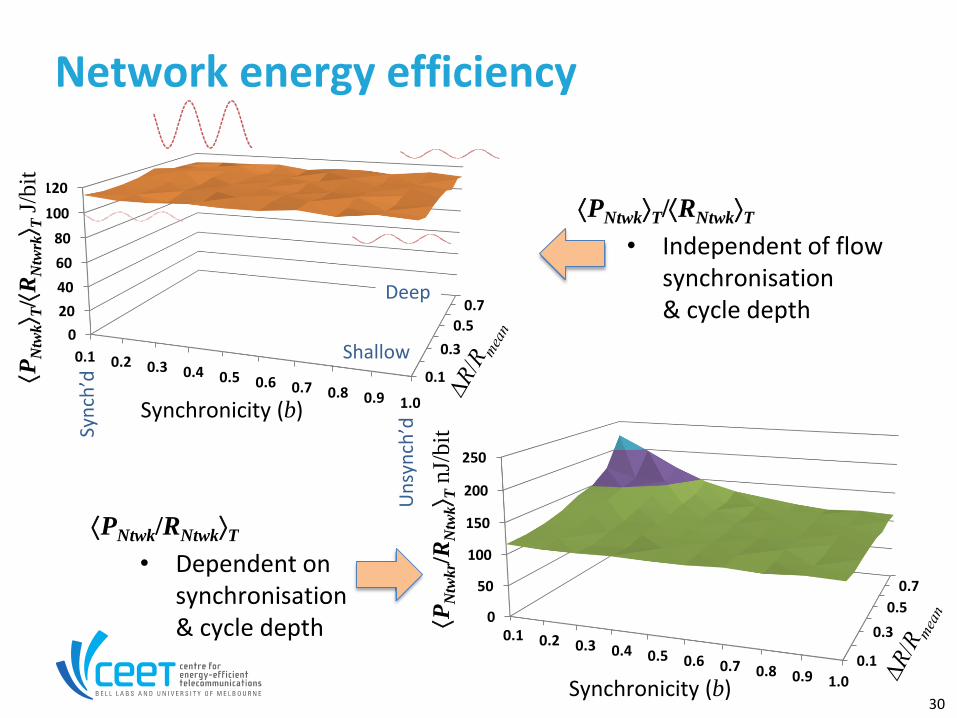
Network energy efficiency
PNtwkT/RNtwkT
• Independent of flow synchronisation & cycle depth
PNtwk/RNtwkT
• Dependent onsynchronisation & cycle depth
Syn
ch’d
Un
syn
ch’d
Shallow
Deep
31
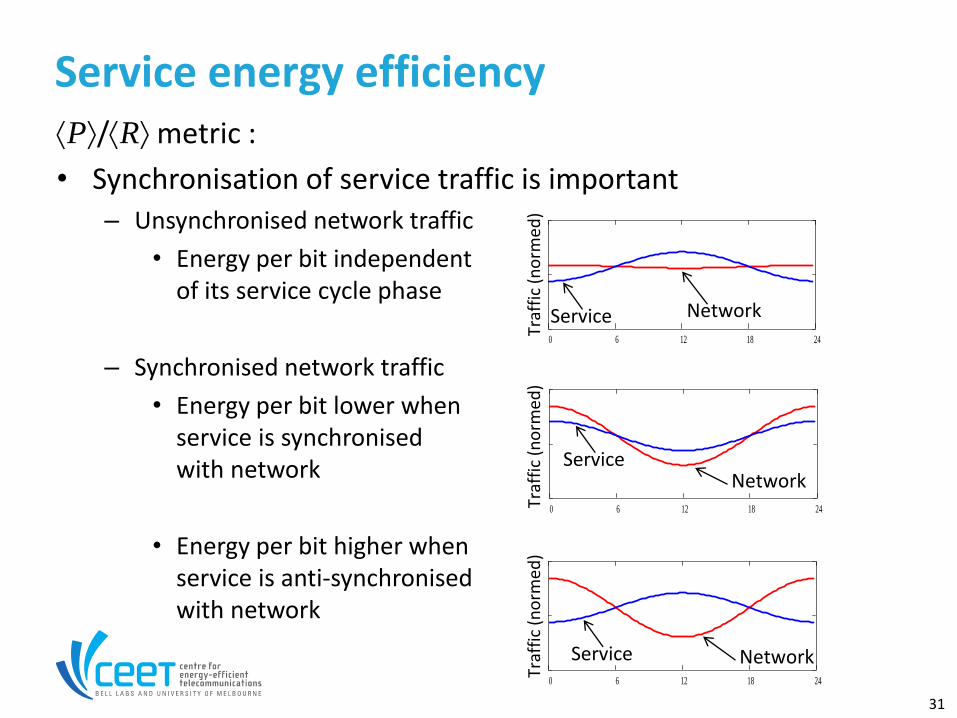
P/R metric :
• Synchronisation of service traffic is important– Unsynchronised network traffic
• Energy per bit independent of its service cycle phase
– Synchronised network traffic
• Energy per bit lower whenservice is synchronisedwith network
• Energy per bit higher whenservice is anti-synchronisedwith network
Service energy efficiency
0 6 12 18 24
NetworkService
Traf
fic
(no
rmed
)
0 6 12 18 24
ServiceNetwork
Traf
fic
(no
rmed
)
0 6 12 18 24
Service Network
Traf
fic
(no
rmed
)

32
• Service with fixed out-of-synch cycle (f(k) = )
• Energy per bit for out-of-synch service– Lowest when network has shallow diurnal cycle
– Highest for anti-synch with deep network diurnal cycle
Synchronisation: Service energy efficiency
0.1
0.3
0.5
0.7
0
50
100
150
200
250
300
350
0.1 0.2 0.3 0.4 0.5 0.6 0.7 0.8 0.9 1.0
P(k
) T/
C(k
) T
nJ/
bit
Synchronicity (b)

33
Must be careful on how metrics are used
The P/R metric:
• Estimating service energy
– This requires k-th service is not “out-of-synch” with network traffic
• When used by Network Operators– Metric not impacted by diurnal cycle shape
• Metric PNtwk/RNtwk can show impact of shape
• When used by Service Providers – Energy per bit reduced by synchronising traffic with diurnal cycle
• This increases Rpeak requiring more network equipment
• A metric can give different players conflicting strategies
Outcomes
k k k
Ntwk Ntwk NtwkT TQ H B P R B

Thank you