a survey of claimants for unemployment compensation in ... · a survey of claimants for...
TRANSCRIPT

A Survey of Claimants for Unemployment Compensation in February-March 1943
ARNOLD STEINBACH AND PHILIP BOOTH*
* Bureau of Employment Security, Program Division. The survey was made possible as the result of the cooperation of the War Manpower Commission and State employment security agencies. The Bureau of Employment Security wishes to express its appreciation to the State agencies for their cooperation in conducting the study and to the staff members of the War Manpower Commission, and to the members of the special subcommittee of the Interstate Conference of Employment Security Agencies for their assistance and suggestions during the course of the study and the preparation of the analysis.
T H E N U M B E R O F U N E M P L O Y E D W O R K E R S drawing benefits under State unemployment compensation laws, which had exceeded an average of 1.2 million per week during July 1940, declined to 600,000 in the middle of 1942 as employment levels rose under the impetus of war production; the number had fallen to 200,000 by February 1943 and to 60,000 in October. At the same time, the level of all unemployment, as estimated by the Bureau of the Census, dropped from 8.8 million in April 1940 to 1.4 million in February 1943 and 700,000 in October. The total volume of initial and continued claims had declined more than 70 percent between February 1942 and February 1943; in Michigan, New Mexico, and Wyoming, continued claims decreased during this period more than 90 percent.
This decline in unemployment and the growing manpower shortages focused attention upon the need for effective referral of claimants to available jobs. The public was increasingly interested in the question why workers were unemployed and receiving benefits in the face of increasing labor shortages. During pre-war days, the employment potentialities of claimants were not always closely scrutinized because the labor supply was relatively adequate. The growth of wartime labor stringencies, however, led to the need for determining the capability of each claimant to fill a necessary job and for getting him into such a job as quickly as possible
Scattered studies conducted during 1942 indicated that payment of benefits to unemployed workers was affected by three major types of factors: existing labor-market conditions, which were generally outside the claimant's control; the claimant's qualifications for work, physical
condition, and initiative in seeking work; and the extent to which the U . S. Employment Service was able to and did offer work to applicants. These studies also indicated that the current claimant group was principally composed of workers out of work as a result of changes in war-production schedules, shifts in type of production, and material shortages; contraction of civilian goods and service industries; regular seasonal and frictional unemployment; and migration to centers of war production or, in the case of women, to areas adjacent to military establishments. "While workers in the first group were usually out of work for only brief periods, the duration of unemployment of workers in the three other groups was greater.
This information was inadequate for any analysis of the importance of the claimant group as a source of labor supply, nor did it indicate the effectiveness of the job being done in referring claimants to job opportunities. The Employment Service was giving priority to employers in essential industries, in order to staff war industry and to assist essential employers to the utmost in meeting their manpower problems. I t was felt that these priorities in service might result in limiting the employment opportunities of claimants normally attached to nonessential activities.
All the interested governmental agencies believed it necessary to obtain information which would throw light on the following questions: (1) Who were the claimants? were they principally men or women? old or young? skilled or unskilled? with or without physical disability? (2) Where were they located? in areas which contained labor shortages or in areas of labor surplus? (3) What had caused their unemployment and for how long had they been out of work? and (4) What had the Employment Service done to find work for them? had it full and complete information as to their past skills and experience? had it referred them to jobs? had it placed them in jobs?
Accordingly, a survey of the personal and

occupational characteristics of claimants and the activities of the Employment Service with respect to such claimants was undertaken. Forty-seven States participated in the survey,1 which covered 394 local offices and included 42,757 persons who had filed claims for total or part-total benefits during the week ending February 13, 1943.2 Some
290,000 claimants had filed initial or continued claims throughout the country during that week. For each State, a few local offices, representative of the labor market in the given State, were selected for the sample, usually not more than 8; when there were both shortage and nonshortage areas within a State, both types of areas were represented.3 In general, the sample was confined to 10 percent of the claim load of the State. However, since States with relatively small claim loads used a sample larger than 10 percent and in a few instances included all local offices and all claimants, the sample comprised about 15 percent of all claimants (table 1)4
Schedules were filled out for each claimant in the sample by local-office claims takers and placement interviewers. Information on claims and benefit status and personal characteristics was recorded at the time of the filing or renewal of the claim during the survey week; the information on occupation and on referral and placement experience was supplied by Employment Service interviewers from the applicants' records in the Employment Service files.
The picture which emerged from the survey was that of a group of claimants which included disproportionately large numbers of older workers, women, and workers with permanent physical handicaps. In even this period of labor shortages, many of these claimants had experienced relatively prolonged unemployment. Almost half the group had been unemployed 5 weeks or longer at the time of the survey, one-tenth for at least 27 weeks. Only about one-seventh of the group drew no benefits—that is, presumably found a job before their waiting period had expired.
Both the duration of unemployment and the efforts of the Employment Service to place the claimants should be considered with regard for the characteristics of the group. Because of the stringency of the labor market, a group of persons out of work at the time of the survey was likely to be heavily weighted with seasonally unemployed workers, whose jobs customarily exist in only certain periods of a year; with individuals who, though laid off, retained an attachment to their
1 Alaska, District of Columbia, Hawaii, and Utah did not participate. 2 Mai l claimants were excluded; many States also excluded claims filed at
itinerant points.
3 Shortage areas are those with a current acute labor shortage or labor stringency and those anticipating a labor shortage within 6 months. All other areas are classified as nonshortage.
4 Had i t been possible for the sample to be drawn exactly in accordance with the instructions, it would have included approximately 39,000 claimants, or about 10 percent fewer claimants than were actually included.
Table 1.—Number of claims filed during survey week, and number of class A and B 1 claimants in sample, by State2
State
Claims filed during survey week
i n -Claimants in sample
State
Al l local offices
Sample local offices
Total Class A1 Class B1
Total 293,787 173,027 3 43,151 22,896 20,255 Alabama 7,305 3,525 803 280 523
Arizona 522 522 519 320 199 Arkansas 2,317 695 695 407 288 California 22,590 12,565 3,893 2,311 1,582 Colorado 2,819 587 364 159 205 Connecticut 1,567 1,008 376 211 165
Delaware 569 569 462 271 191 Florida 4,464 3,350 418 239 179 Georgia 5,207 3,400 854 413 441
Hawaii 1,248 1,248 724 495 229 Illinois 25,260 9.836 2,761 1,427 1,334 Indiana 9,200 3,656 783 314 469
Iowa 3,681 1,930 665 421 244 Kansas 2,915 2,329 1,907 1,226 681 Kentucky 4,055 2,984 856 415 441 Louisiana 6,871 6.477 1,019 660 359
Maine 2,030 619 246 105 141 Maryland 2,190 542 370 230 110 Massachusetts 7,111 3,617 654 457 197 Michigan 11,940 4,940 731 345 386
Minnesota 8,741 4,025 928 546 382 Mississippi 1,738 781 619 400 219 Missouri 12,643 7,978 759 383 376
Montana 721 300 300 126 174 Nebraska 1,463 1,181 531 303 228 Nevada (4) (4) 122 58 64 New Hampshire 905 707 514 306 208 New Jersey 14,183 7,820 1,489 1,007 482 New Mexico 317 317 207 65 142 New York 61,355 51,224 6,356 2,312 4,044 North Carolina 4,569 1,833 916 437 479 North Dakota 387 387 214 126 88 Ohio 9,317 4,272 3,402 1,769 1,633
Oklahoma 2,982 1,211 375 251 121 Oregon 3,193 3,193 1,397 1,011 386 Pennsylvania 12,992 4,330 747 381 366 Rhode Island 2,257 1,628 429 263 166 South Carolina 4,016 2,042 436 193 243 South Dakota 302 302 145 64 81 Tennessee 8,703 5,021 932 437 495 Texas 6,531 2,851 670 332 338 Vermont 482 482 319 130 189 Virginia 1,562 609 365 198 167 Washington 4,620 2,014 809 672 137 West Virginia 1,586 1,321 585 153 432 Wisconsin 4,262 2,695 430 224 206 Wyoming 99 99 55 40 15
1 Class A claimants had been continuously unemployed for less than 5 weeks prior to the survey week; class B claimants for 5 weeks or more.
2 Alaska, District of Columbia, Hawaii, and Utah did not participate in survey which was made during week ending Feb. 13, 1943. Sample included all local offices in Arizona, Delaware, Idaho, New Mexico, North Dakota, Oregon, South Dakota, Vermont, and Wyoming.
3 Includes 394 claimants whose records were incomplete. The text discussion and other tables do not include these claimants.
4 Not available.

former employer and expected to return to their old job; and with persons whose employability was more or less limited by their personal characteristics or lack of currently needed skills. The effect of all these factors is apparent in the findings of the study.
Table 2.—Distribution of men and women, and of white and nonwhite claimants, by occupation 1
Major and selected occupational group
Al l claimants Men Women
Major and selected occupational group Number
Percentage distribution by occupation
Number Percent of total
Percentage dis
tribution Number Percent
of total Percentage distribution
Major and selected occupational group Number
Al l | claimants
White claimants Nonwhite claimants
Number Percent of total
Percentage dis
tribution Number Percent
of total Percentage distribution
All occupations 42,757 100.0 100.0 100.0 26,391 61.7 100.0 16,366 38.3 100.0 Professional and managerial 2,529 5.9 6.2 6.4 1,485 58.7 5.6 1,044 41.3 6.4 Clerical and sales 5,795 13.6 14.5 25.8 1,814 31.3 9.9 3,981 68.7 24.3 Service 3,078 7.2 6.5 8.8 1,444 46.9 5.5 1,634 53.1 10.0 Agriculture, fishery, forestry, and kindred 1,340 3.1 3.0 2.8 904 67.5 3.4 436 32.5 2.7 Skilled 12,122 28.3 29.7 7.9 10,893 89.9 41.3 1,229 10.1 7.5
Production of fabricated textile products 983 2.3 (2) (2) 223 22.7 .8 760 77.3 4,6 Metalworking 689 1.6 (2) (2) 654 94.9 2.5 35 5.1 .2 Construction 7,284 17.0 (2) (2) 7,271 99.8 27.5 13 .2 . 1
Semiskilled 8,378 19.6 19.9 24.5 4,425 52.8 16.8 3,953 47.2 24.2 Textile 915 2.1 (2) (2) 113 12.3 .4 802 87.7 4.9 Production of fabricated textile products 2,002 4.7 (2) (2) 231 11.5 .9 1,771 88.5 10.8 Metalworking 720 1.7 (2) (2) 484 67.2 1.8 236 32.8 1.4 Construction 674 1.6 (2) (2) 673 99.9 2.5 1 , 1 (3)
Transportation 1,002 2.3 (2) (2) 1,000 99.8 3.8 2 .2 (3)
Trade and service 542 1.3 (2) (2) 229 42.3 .9 313 57.7 1.9 Unskilled 8,579 20.1 17.9 21.7 4,813 56.1 18.2 3,766 43.9 23.0 Production of food products 2,459 5.8 (2) (2) 209 8.5 .8 2,250 91.5 18,7 Construction 2,513 5.9 (2) (2) 2,503 99.6 9.5 10 .4 .1 Unassigned 4 936 2.2 2.3 2.1 613 65.5 2.3 323 34.5 1.9
1 See table 1, footnote 2. 2 Information not available.
3 Not computed: less than 40 claimants. 4 Entry occupations and unknown.
Occupational and Personal Characteristics
Occupation.—Twenty-eight percent of the claimants in the sample had been in skilled occupations, 40 percent in semiskilled and unskilled, 14 percent in clerical and sales, and the remainder in professional and managerial, service, and agricultural occupations (table 2). About 41 percent of the men, as compared with 7.5 percent of the women, were in skilled occupations, but relatively many more women than men were in the clerical and sales group. The skilled claimants were concentrated in three occupational groups—apparel, metalworking, and construction. The great majority of the semiskilled women claimants came from the textile and apparel industries. In the unskilled occupations, more than half of the men were construction workers and more than half of the women were cannery workers.
The seasonal slack in construction activity during the survey period, combined with the completion of construction projects in a number of States and the reluctance of construction workers to accept employment outside of their industry and
from sources other than their unions, accounts for the fact that nearly one-fourth of the claimants were construction workers; almost three-fourths of these were in the skilled groups. Skilled construction workers accounted for 17 percent of all claimants and 28 percent of all men claimants.
Less than 6 percent of the claimants were found to be in nationally or locally critical occupations; 5 the States with the largest percentage of claimants in critical occupations were Idaho, with 20 percent, and Illinois, with 14 percent. In most instances these claimants were in locally, rather than nationally, critical occupations. The percentage of claimants in critical occupations did not differ greatly as between shortage and non-shortage areas, except in a few States.
Age and sex.—While men comprised 62 percent of the sample and women 38 percent, there was considerable variation among the States. California, Delaware, and North Carolina reported that at least 60 percent of their claimants were women, while Idaho and Connecticut reported only 11 and 17 percent, respectively. Men showed a greater concentration than women in the older age groups. Sixty-three percent of the men and 27 percent of the women were 45 years of age or older; in the employed labor force, on the other hand, only 41 percent of the men and 23 percent of the women were in this age group in
5 See table 6, footnote 2.

Table 3.—Percentage distribution of men and women claimants by age group, by occupation 1
Major and selected occupational group
age group Major and selected occupational
group Total Under
22 22-44 45-64 65 and over
Men
All occupations 100.0 4.1 33.2 49.7 13.0
Professional and managerial 100.0 2.6 31.9 52.0 13.5 Clerical and sales 100.0 6.2 34.3 44.1 15.4 Service 100.0 3.7 21.6 45.5 29.2 Agriculture, fishery, forestry, and kindred
100.0 4.9 37.4 41.3 16.4 Skilled 100.0 1.1 26.9 59.2 12.8
Production of fabricated textile products 100.0 .4 13.5 56.5 29.6
Metalworking 100.0 5.7 31.5 50.3 12.5 Construction 100.0 .4 25.9 62.1 11.6
Semiskilled 100.0 6.6 45.7 37.8 9.9 Textile 100.0 8.0 49.5 30.1 12.4 Production of fabricated textile products
100.0 1.3 36.4 48.9 13.4 Metalworking 100.0 13.4 48.8 29.1 8.7 Construction 100.0 1.6 43.6 48.1 6.7 Transportation 100.0 6.9 66.0 23.8 3.3
Trade and service 100.0 10.9 30.1 43.7 15.3 Unskilled 100.0 6.3 38.1 45.2 10.4
Production of food products 100.0 10.0 39.3 31.6 19.1 Consturction 100.0 4.7 36.6 51.0 7.7 Unassigned 2 100.0 17.3 35.2 37.5 10.0
Women
All occupations 100.0 7.1 65.7 25.3 1.9
Professional and Managerial 100.0 4.7 66.1 26.0 3.2 Clerical and sales 100.0 11.2 70.9 16.6 1.3 Service 100.0 4.4 54.7 37.3 3.6 Agriculture, fishery, forestry, and
kindred 100.0 2.8 63.7 31.4 2.1 Skilled 100.0 2.6 50.9 41.9 4.6
Production of fabricated textile products 100.0 .9 42.9 50.7 5.5
Metalworking 100.0 20.0 68.6 11.4 0 Construction ( 3 ) (3) (3) (3) (3)
Semiskilled 100.0 6.4 71.1 21.5 1.0 Textile 100.0 6.7 76.1 16.5 .7 Production of fabricated textile
products 100.0 6.0 64.9 27.8 1.3 Metalworklng 100.0 8.9 78.4 12.3 .4
Construction (3) (3) (3)
(3) (3)
Transportation (3) (3) (3) (3) (3)
Trade and service 100.0 2.9 71.2 24.9 1.0 Unskilled 100.0 7.1 64.3 27.0 1.6
Production of food products 100.0 5.8 59.4 33.0 1.8 Construction (3) (3) (3) (3) (3)
Unassigned 2 100.0 11.2 64.4 22.6 1.8
1 See table 1, footnote 2. 2 Entry occupations and unknown. 3 Not computed; less than 40 claimants.
February 1943, according to Bureau of the Census estimates.6 There was no evidence that the older claimants were found principally in war-production areas, for the States in which more than 70 percent of the claimants were 45 years of age or older included Iowa, Montana, Nevada, and Wyoming, where there was little concentration of war production, as well as such war-production centers as California, Connecticut, Massachusetts, Ohio, and Pennsylvania.
The age distribution of the claimants varied 6 The estimates indicate that 57 percent of the persons unemployed in
February 1943 were men and 43 percent women. Only 43 percent of the unemployed were 45 years of age or over as compared with 49 percent of all claimants who were in this age group at the time of the survey.
considerably among the several occupational groups (table 3). Thus, male claimants who had been in service occupations and the skilled male claimants in apparel industries and in construction showed a higher concentration at the older ages than did the semiskilled and unskilled groups. Skilled and service occupations had the highest proportions of women aged 45 and over.
Shortage areas reported a somewhat higher proportion of older claimants than nonshortage areas, probably because the reservoir of younger claimants had been depleted much faster. The proportion of men above age 45 was greater in noncritical than in critical occupations; this difference remained whether the claimants had one or more than one occupational classification. However, men claimants with additional classifications, especially those with critical skills, were a younger group than those with only primary classifications. I t is likely that workers in the higher age groups are not at as great a handicap in obtaining work if they possess more than one skill, especially if such additional skills are in critical occupations.
Workers over age 65 apparently had considerable difficulty in obtaining jobs. Only 7 percent of the men who were recorded as employed at the completion of the survey were aged 65 or over, although claimants in this age group comprised 13 percent of the whole sample and 16 percent of those remaining unemployed. In contrast, while men aged 22-44 comprised 33 percent of the sample, 40 percent of those employed at the completion of the survey were in this group.
Race.—Only 9 percent of the claimants were nonwhite—10 percent of the men and 7 percent of the women. Colorado, Louisiana, Mississippi, North Carolina, and South Carolina had the highest percentage of nonwhite claimants.
The nonwhite claimants were a considerably younger group than the white claimants—among both the men and the women.
Age
Al l claimants Labor force (1940)
Age Men Women Men Women Age
White Nonwhite White Non
white White Nonwhite White Non
white
Total 100.0 100.0 100.0 100.0 100.0 100.0 100.0 100.0
Undor 22 4.1 3.8 7.3 4.8 65.3 71.3 78.6 79.0 22-44 31.3 49.0 65.0 74.9 65.3 71.3 78.6 79.0 45-64 50.8 40.9 25.7 19.1 30.1 24.5 19.4 19.0 65 and over 13.8 6.3 2.0 1.2 4.6 4.2 2.0 2.0
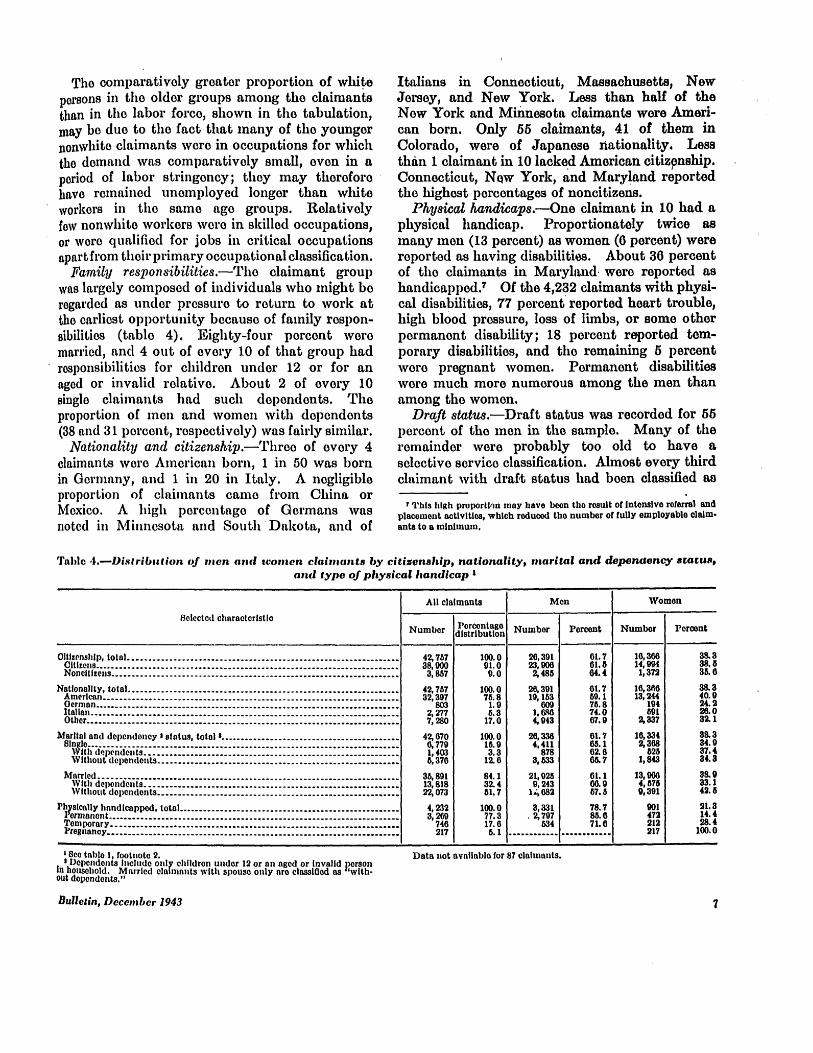
Table 4.—Distribution of men and women claimants by citizenship, nationality, marital and dependency status, and type of physical handicap 1
Selected characteristic Al l claimants Men Women
Selected characteristic Number Percentage
distribution Number Percent Number Percent
Citizenship, total 42,757 100.0 26,391 61.7 16,366 38.3
Citizens 38,900 91.0 23,906 61.5 14,994 38.5 Noncitizens 3,857 9.0 2,485 64.4 1,372 35.6 Nationality, total 42,757 100.0 26,391 61.7 16,366 38.3 American 32,397 75.8 19,153 59.1 13,244 40.9 German 803 1.9 609 75.8 194 24.2
Italian 2,277 5.3 1,686 74.0 591 26.0 Other 7,280 17.0 4,943 67.9 2,337 32.1 Marital and dependency 2 status, total 3 42,670 100.0 26,336 61.7 16,334 38.3
Single 6,779 15.9 4,411 65.1 2,368 34.9 With dependents 1,403 3.3 878 62.6 525 37.4 Without dependents 5,376 12.6 3,533 65.7 1,843 34.3 Married 35,891 84.1 21,925 61.1 13,966 38.9 With dependents 13,818 32.4 9,243 66.9 4,575 33.1
Without dependents 22,073 51.7 14,682 57.5 9,391 42.5 Physically handicapped, total 4,232 100.0 3,331 78.7 901 21.3
Permanent 3,269 77.3 2,797 85.6 472 14.4 Temporary 746 17.6 534 71.6 212 28.4 Pregnancy 217 5.1 217 100.0
1 See table 1, footnote 2. 2 Dependents include only children under 12 or an aged or invalid person
in household. Married claimants with spouse only are classified as ' 'without dependents."
3 Data not available for 87 claimants.
The comparatively greater proportion of white persons in the older groups among the claimants than in the labor force, shown in the tabulation, may be due to the fact that many of the younger nonwhite claimants were in occupations for which the demand was comparatively small, even in a period of labor stringency; they may therefore have remained unemployed longer than white workers in the same age groups. Relatively few nonwhite workers were in skilled occupations, or were qualified for jobs in critical occupations apart from their primary occupational classification.
Family responsibilities.—The claimant group was largely composed of individuals who might be regarded as under pressure to return to work at the earliest opportunity because of family responsibilities (table 4). Eighty-four percent were married, and 4 out of every 10 of that group had responsibilities for children under 12 or for an aged or invalid relative. About 2 of every 10 single claimants had such dependents. The proportion of men and women with dependents (38 and 31 percent, respectively) was fairly similar.
Nationality and citizenship.—Three of every 4 claimants were American born, 1 in 50 was born in Germany, and 1 in 20 in Italy. A negligible proportion of claimants came from China or Mexico. A high percentage of Germans was noted in Minnesota and South Dakota, and of
Italians in Connecticut, Massachusetts, New Jersey, and New York. Less than half of the New York and Minnesota claimants were American born. Only 55 claimants, 41 of them in Colorado, were of Japanese nationality. Less than 1 claimant in 10 lacked American citizenship. Connecticut, New York, and Maryland reported the highest percentages of noncitizens.
Physical handicaps.—One claimant in 10 had a physical handicap. Proportionately twice as many men (13 percent) as women (6 percent) were reported as having disabilities. About 36 percent of the claimants in Maryland were reported as handicapped.7 Of the 4,232 claimants with physical disabilities, 77 percent reported heart trouble, high blood pressure, less of limbs, or some other permanent disability; 18 percent reported temporary disabilities, and the remaining 5 percent were pregnant women. Permanent disabilities were much more numerous among the men than among the women.
Draft status.—Draft status was recorded for 55 percent of the men in the sample. Many of the remainder were probably too old to have a selective service classification. Almost every third claimant with draft status had been classified as
7 This high proportion may have been the result of intensive referral and placement activities, which reduced the number of fully employable claimants to a minimum.

3A, every tenth claimant as 4F, and 1 in 14 as 1A.8 Less than 1 in 20 had been deferred on occupational grounds, and 1 in 200 because they were normally engaged in agricultural work.
Interstate claimants.—About 12 percent of the claimants had filed claims on the basis of wage credits accumulated in other States. Interstate claimants comprised 50 percent or more of all claimants in Arizona, Colorado, Nevada, and New Mexico, and more than 30 percent of those in Arkansas, Georgia, Kentucky, Mississippi, Oklahoma, South Dakota, and Wyoming. More women than men filed interstate claims, and women accounted for more than 85 percent of all interstate claimants in Florida, Georgia, and South Dakota. Though no information is available as to the reasons for migration, individual State analyses indicate that there were at least two large groups of interstate claimants: those returning to their former residence after employ
ment in another State (primarily construction workers), and women who followed members of their family either to another job or to the vicinity of military establishments. The referability of the former group is obviously much greater than that of the latter.
8 See classification in table 9 for definitions.
Table 5.—Cumulative percentage distribution 1 of claimants by number of weeks of unemployment and number of weeks compensated, by age, citizenship, nationality, marital and dependency status, and type of physical handicap 2
Selected characteristic
Cumulative percentage distribution of claimants by specified number of weeks of unemployment and weeks compensated
Selected characteristic
All claimants Men Women
Selected characteristic Weeks of unemployment 3 Weeks compensated 4 Weeks compensated 4 Weeks compensated 4 Selected characteristic
Less than
5
Less than
14
Less than
27 Al l None
Less than
5
Less than
14 Al l None
Less than
5
Less than 14
Al l None Less than
5
Less than
14 All
Age, total 13.8 69.3 90.4 100.0 15.0 50.8 93.8 100.0 15.0 53.2 95.3 100.0 15.0 46.9 91.4 100.0
Under 22 16.6 70.1 88.4 100.0 24.8 62.8 96.3 100.0 24.8 64.2 96.7 100.0 24.8 61.5 95.9 100.0 22-44 14.4 66.6 87.8 100.0 16.9 51.5 93.4 100.0 18.9 58.8 96.5 100.0 15.3 45.6 90.9 100.0
45-64 14.3 74.0 93.9 100.0 12.9 51.0 95.4 100.0 13.0 52.0 96.4 100.0 12.4 47.6 92.3 100.0 65 and over 7.3 61.8 88.2 100.0 9.2 39.4 87.0 100.0 9.6 40.1 87.5 100.0 4.7 32.6 82.0 100.0 Citizenship, total
13.8 69.3 90.4 100.0 15.0 50.8 93.8 100.0 15.0 53.2 95.3 100.0 15.0 46.9 91.4 100.0 Citizens 13.8 69.0 90.1 100.0 15.4 51.5 93.9 100.0 15.3 53.9 95.4 100.0 15.4 47.7 91.5 100.0 Noncitizens 14.4 72.5 92.7 100.0 11.5 43.9 93.1 100.0 11.8 46.2 94.4 100.0 10.9 39.7 90.9 100.0 Nationality, total
13.8 69.3 90.4 100.0 15.0 50.8 93.8 100.0 15.0 53.2 95.3 100.0 15.0 46.9 91.4 100.0 American 13.6 67.7 89.3 100.0 16.2 52.3 93.9 100.0 16.0 55.6 95.5 100.0 15.8 47.9 91.7 100.0 German 11.6 76.1 95.0 100.0 10.3 51.1 94.0 100.0 9.9 52.6 95.1 100.0 12.4 47.5 91.2 100.0
Italian 11.6 77.6 95.2 100.0 7.2 38.5 95.0 100.0 6.0 38.3 95.3 100.0 10.5 38.8 94.4 100.0 Other 15.6 72.9 92.7 100.0 12.5 47.5 92.9 100.0 12.6 49.3 94.5 100.0 12.4 43.8 89.7 100.0
Marital and dependency status, total 13.8 69.3 90.4 100.0 15.0 50.8 93.8 100.0 15.0 53.2 95.3 100.0 15.0 46.9 91.4 100.0 Single 15.3 72.2 92.6 100.0 17.0 53.4 94.5 100.0 16.7 54.1 95.6 100.0 17.7 52.3 92.5 100.0
With dependents 13.0 72.2 92.7 100.0 14.6 48.6 93.4 100.0 14.5 49.6 94.4 100.0 14.9 47.1 91.9 100.0 Without dependents 15.9 72.3 92.6 100.0 17.7 54.7 94.8 100.0 17.2 55.2 95.8 100.0 18.4 53.7 92.7 100.0
Married 13.5 68.8 89.9 100.0 14.6 50.2 93.7 100.0 14.6 52.9 95.2 100.0 14.6 46.0 91.2 100.0 With dependents 14.9 69.7 89.0 100.0 15.8 51.6 94.6 100.0 16.9 56.3 96.1 100.0 13.8 42.2 91.4 100.0 Without dependents 12.7 68.2 90.5 100.0 13.8 49.4 93.2 100.0 13.0 50.5 94.6 100.0 14.9 47.9 91.2 100.0
Physically handicapped, total 11.0 65.1 88.7 100.0 14.9 49.5 92.7 100.0 13.4 49.8 93.2 100.0 20.1 48.3 90.8 100.0 Permanent 10.6 65.6 89.9 100.0 12.6 47.3 92.2 100.0 12.2 47.6 92.7 100.0 15.0 45.5 89.0 100.0 Temporary 13.3 65.2 86.8 100.0 21.6 58.6 94.8 100.0 20.2 61.4 95.7 100.0 25.0 51.4 92.5 100.0 Pregnancy 8.3 56.2 77.4 100.0 26.2 51.6 93.1 100 0 26.5 51.5 93.1
1 Distribution based on number of claimants shown in table 9. 2 See table 1, footnote 2, and table 4, footnote 2. 3 Length of unemployment was measured from date of separation from last
employment to week in which last claim in current claims series was made, or to cut-off date—whichever was earlier.
4 Duration of benefit payments was measured from the beginning of the first compensated week to the end of the most recent compensated week within the current claims series prior to cut-off date.
Duration of Unemployment and Benefits
At the time of the survey, more than half of the claimants had been unemployed from 2 to 3 months while one-third had drawn benefits continuously for 5-8 weeks, and about one-fourth for 3-4 weeks. About 30 percent of all claimants had been unemployed for more than 3 months at that time (February 1943). About 10 percent of the claimants had been unemployed for at least 6 months (table 5); relatively large numbers of such claimants were found in Alabama, Colorado, North Carolina, and Virginia. Unpublished estimates of the Bureau of the Census, by contrast, indicate that in January 1943 about 17 percent of all un

employed persons had been seeking work for more than 3 months.
More than 80 percent of the claimants drew benefits for less than 9 weeks. Only 15 percent drew no benefits; in Colorado and Washington, however, more than half received no benefits. Six percent of all claimants drew benefits for 14 weeks or more; the proportion of beneficiaries with these long periods of benefits ranged among the States from 12 percent in Alabama and New York to less than 1 percent in Idaho and Washington and none in North Dakota. In Colorado, Delaware, Idaho, Iowa, Oregon, and Washington, less than 5 percent of the claimants drew benefits for more than 8 weeks.
Duration of unemployment and additional occupational classification.—Claimants with additional occupational classifications tended to have a relatively short duration of unemployment; only 6 percent of the claimants with three or more additional classifications, compared with 10 percent of all claimants, were unemployed for more than 6 months. Only 3 percent of the claimants with three or more additional classifications drew benefits for as much as 14 weeks. Of the claimants in noncritical occupations who had additional classifications, 19 percent had drawn no benefits and 5 percent had drawn benefits for 14 weeks or more, as compared with 15 and 6 percent, respectively, for all claimants in noncritical occupations.
Duration of unemployment and critical occupation.—As might have been expected, claimants in nationally critical occupations reported the shortest period of unemployment; 20 percent of the claimants in such occupations, but 15 percent in noncritical occupations, drew no benefits. While 14 percent of all claimants were unemployed less than 5 weeks, 21 percent of those in nationally critical occupations in shortage areas, and 18 percent in nonshortage areas, had been unemployed for so brief a period.
Duration of unemployment and type of separation.—Half of the claimants were unemployed as the result of a lay-off expected to last 30 days or more, while only 8 percent had been laid off for less than 30 days. About 18 percent had left their former jobs voluntarily, and 9 percent were reported as discharged. As might have been expected, the cause of separation was directly related to duration of unemployment.
Fifty percent of the claimants whose lay-off was expected to last less than 30 days were unemployed less than 5 weeks, and 96 percent were unemployed for not more than 3 months. More than 22 percent received no benefits, and more than 97 percent drew benefits for less than 9 weeks.
Three-fourths of the claimants who were laid off for 30 days or more were unemployed for not more than 3 months. Their duration of benefit payments was similar to that of all claimants, though a much smaller percentage drew no benefits.
The longer duration of unemployment of those who quit their last jobs was marked; 20 percent of this group, as compared with 10 percent of all claimants, remained unemployed for more than 6 months. I t is likely that some of these claimants had withdrawn from the labor market temporarily. The unemployment and benefit experience of discharged claimants did not differ greatly from that of all claimants.
Duration of unemployment and employment status.—Claimants who were reported to have found jobs through sources other than the E m ployment Service had considerably briefer unemployment than those placed by the Employment Service. Of the former group, 58-65 percent drew less than 3 weeks of benefits, but about 52 percent of those placed by the Employment Service and 28 percent of all claimants had such short duration.
Duration of unemployment and personal characteristics,—The percent of claimants who drew no benefits declined as age increased—further evidence of the greater reforabdity of younger claimants (table 5).
Age Percent
Under 22 24.8 22-44 16.9 45-64 12.9 65 and over 9.2
Women were unemployed longer and drew benefits for more weeks than men. Fifteen percent of the women as compared with 7 percent of the men were unemployed for 27 or more weeks, and 9 and 5 percent, respectively, drew benefits for at least 14 weeks. These differences may result from the fact that women were mostly in service, semi-skilled, and unskilled occupations while a greater proportion of the men were in skilled occupations in which job opportunities were better. In a com

parison of the group of claimants with physical handicaps, however, it was found that women returned to work sooner than men.
Single claimants had shorter periods of unemployment than married claimants. The greater mobility of single persons gave them a distinct advantage in accepting jobs in war-production areas which might be at a distance from their former work.
Married women with dependents experienced longer intervals of unemployment than those without dependents. About 20 percent of the former were unemployed for more than 26 weeks, in contrast to 13 percent of the latter. Family responsibilities undoubtedly interfered with placements, thus lengthening the period of unemployment. The presence of dependents made no such difference to male claimants.
Lack of citizenship did not materially influence the length of unemployment or duration of benefit payments, though what differences there were indicated that noncitizens required more time to find a job. Nationality, also, had little effect on these two variables.
While claimants with permanent physical handicaps drew benefits longer than those temporarily handicapped, the duration of unemployment and of benefit payments for all handicapped claimants was only slightly greater than for those without physical disabilities. Pregnant women had the longest duration of unemployment among all handicapped claimants; since they are frequently disqualified from benefits, however, their benefit duration is not an indicator of the length of their unemployment.
Men deferred for occupational reasons were unemployed for a shorter time than those with 1A status:
Draft status
Al l claimants Percent of claimants—
Draft status Num
ber Percent
Unemployed
less than 5 weeks
Unemployed
lrss than 14 weeks
Drawing no benefit
Less than 9 weeks compensated
Al l claimants 14,721 100.0 17.7 77.1 17.7 88.1 1A 1,030 7.0 13.9 75.9 16.9 88.7 Deferred for:
Essential activities 142 1.0 21.8 73.3 24.6 87.4 War production 451 3.1 25.1 84.3 26.3 93.5 Agriculture 68 .5 14.7 70.6 26.5 86.8 Family responsibility 4,508 30.5 21.2 80.6 27.3 86.4
4F 1,554 10.6 16.5 73.7 19.6 85.9 Others 6,968 47.3 15.8 75.3 16.0 87.7
Those classified 4 F had relatively long benefit duration as did the 68 claimants who were deferred because of their agricultural attachment. In the absence of detailed information on the reasons for their unemployment, the deferred claimants appeared to have been unemployed for rather long periods, in view of the shortage of workers in essential or critical occupations.
Employment Status
While the data analyzed here concern the relationship of personal and occupational characteristics of claimants to referral and placement activities, it should be borne in mind that such factors as the industrial composition of the area, employment conditions, the specific period during which the study was conducted, and the provisions of the unemployment compensation laws themselves, all of which are not amenable to quantitative analysis, may affect the data. Heavy seasonal lay-offs, such as occur during the winter in Northern States, may release workers who cannot be referred satisfactorily to openings in other types of work. On the other hand, industrial expansion in a given area may increase sharply the number of referrals and placements and deplete the files of workers most readily referable to jobs.
A large number of referrals reported in a given area may mean, in one case, due consideration of employer specifications and the qualifications of the claimant, and, in another case, referrals without such consideration. The value of the former referrals is obviously much greater to both employers and workers. Since factors such as those could not be measured in the present study and, more important, since comparable information is not available for nonclaimants, conclusions regarding the relative efficiency of the Employment Service in given States or areas cannot be drawn.
The claimants were divided into two groups. For those (class B) who had been unemployed continuously for 5 or more weeks at the time of the survey (47 percent of the total), information on referral, placement, and employment status was filled out at once. But for those (class A) who had been unemployed less than 5 weeks (53 percent of all claimants) this information was not filled out until the week ending March 13, 1943. The purpose of the 4-week follow-up period for this group was to ensure that information on Employment Service activities would cover a period

roughly comparable to that for class B claimants. The placement and referral activity of the E m
ployment Service was somewhat understated. During a period of full employment such as prevailed at the time of the survey, the great majority of claimants tend to be reemployed rapidly, while many of those who, because of personal or occupational handicaps, fail to get jobs at once may remain unemployed for some weeks or months. Within the first quarter of 1943, only two-thirds of the 424,142 first determinations9
were followed by payment of benefits, an indication that a considerable number of claimants who had filed initial claims were reemployed before benefits became payable to them. The claimants who had been unemployed for 5 or more weeks at the time of the survey, therefore, constituted the residue of the entire group of claimants who had become unemployed in January 1943 or before. The experience of the claimants who had been successfully placed or whose placements were pending at the time of the survey could not be studied. Consequently, virtually all recorded placements relate to the 23,000 claimants in class A, while only unsuccessful referrals for the most part were recorded for the 20,000 claimants in class B.
More useful information as to the referral and placement activity of the Employment Service with respect to claimants would have been yielded by a similar analysis confined to all claimants becoming unemployed during a given week. Since data were not tabulated separately for the two groups of claimants, it is not possible to state what proportion of the claimants unemployed less than 5 weeks at the time of the survey were placed or referred during the survey week. However, since this group comprised only slightly more than 50 percent of the entire sample, it would not be unreasonable to believe that, if the study had been related to a given week, the proportion of claimants reported as placed might have been about double the figure obtained from the current study.
Moreover, since data on referral and placement were drawn exclusively from local employment office records, any failure on the part of local office personnel to record referrals and placements resulted in an understatement of such
activity. While exact information is not available, it was generally conceded by Employment Service and State agency personnel that, in many local offices, failure to follow normal procedures because of inadequate and inexperienced staff at a time of increased responsibilities resulted in an understatement of referral and placement activities.
Employment status and registration.—About 98 percent of the claimants were registered by the U. S. Employment Service.10 Some of these had registered before their current spell of unemployment, but 87 percent were interviewed during their current unemployment. The Employment Service had complete registrations for four-fifths of the claimants, and self-applications had been prepared by most of the others (table 6). Skeleton registrations 1 1 were reported for not more than 3 percent of the claimants, and only 2 percent had no registration.12 The reasons for nonregistration were given as follows:
Reasons for nonregistration A l l claimants
Reasons for nonregistration Number Percent
Total 1,011 100.0
Itinerant service 192 19.0 Temporary lay-off 185 18.3 Registration scheduled 73 7.2 Union hiring 46 4.5 Other 12 515 51.0
9 The decision made by the initial authority of a State employment security agency with respect to a claim.
10 Every claimant registers for work when he files a claim, although a complete registration based upon an interview may be deferred in certain circumstances. Had the survey not excluded mail claims, the proportion of claimants not registered would have been somewhat greater, since many mail claimants do not register at the time of filing.
11 A skeleton registration which contains only the basic occupational information concerning the applicant is used in cases in which complete information is not needed for proper referral and placement.
12 Includes 115 claimants for whom no information on type of registration was available.
About 34 percent of the claimants with complete registrations were referred to jobs, in contrast to 24 percent of those with skeleton registrations. Some 52 percent of all claimants refused to accept referrals. The relatively scanty information for claimants with skeleton registrations may have been responsible for the fact that refusals were reported for 57 percent of this group. Furthermore, only 11 percent of the referrals of such workers resulted in placements, as compared with an over-all percentage of 14. I t is of interest that 11 percent of the claimants who had not registered were reported as reemployed at the close of the survey, most of them with their former employer. Since only 10 percent of all claimants were recorded

as reemployed, the absence of registrations for these claimants did not appear to have handicapped their reemployment.13
13 Almost 13 percent of the claimants with skeleton registrations were unemployed for more than 6 months as compared with 10 percent of all claimants, and 10 percent drew benefits for 14 weeks or more as compared with 6 percent of all claimants. Since many unregistered claimants were expecting reemployment very shortly, i t is not surprising that 23 percent drew no benefits, almost double the proportion of all claimants who drew no benefits.
Table 6.—Claimants referred, placed, or reported employed, by type of registration, occupational and area classification, type of separation, and employment status 1
Type of registration, occupational 2 and area 3 classification, typ3 of separation, and employment status 4
Claimants referred 5
Claimants refusing job or
job offer
Claimants placed or reported employed 6
Type of registration, occupational 2 and area 3 classification, typ3 of separation, and employment status 4
Claimants referred 5
Claimants refusing job or
job offer Total Placed Reported employed
Type of registration, occupational 2 and area 3 classification, typ3 of separation, and employment status 4
Number
Percent of all
claimants
Number
Percent of claim
ants referred
Number
Percent of all claimants
Number
Percent of all claimants
Percent of claim
ants referred
Percent placed with—
Number
Percent employed w i t h -
Type of registration, occupational 2 and area 3 classification, typ3 of separation, and employment status 4
Number
Percent of all
claimants
Number
Percent of claim
ants referred
Number
Percent of all claimants
Number
Percent of all claimants
Percent of claim
ants referred Former
employer
Other em
ployer
Number Former
employer
Other em
ployer
Al l registrations 13,886 32.5 7,177 51.7 4,190 9.8 1,981 4.6 14.3 5.9 94.1 2,209 51.7 48.3 Complete 11,508 34.2 6,031 52.4 3,442 9.4 1,652 4.5 14.4 6.0 94.0 1,790 50.3 49.7 Skeleton 296 23.9 168 56.8 89 7.2 33 2.7 11.1 12.1 87.9 56 42.9 57,1 Self-application 2,033 29.8 950 46.7 555 8.1 289 1.2 14.2 4.5 95.5 266 51.9 48.1 No registration 95 11.1 95 83.2 16.8 Unknown 49 29.9 28 57.1 9 5.5 7 4.3 14.3 0 100.0 2 0 100.0
Assignment of additional occupational classification:
A l l claimants 13,886 32.5 7,177 51.7 4,190 9.8 1,981 4.0 14.3 5.9 94.1 2,209 51.7 48.3 No additional classification 9,640 30.0 5,056 52.4 2,927 9.1 1,319 4.1 13.7 6.9 93.1 1,608 53.3 46.7 1 additional classification 3,322 38.3 1,672 50.3 1,004 11.6 503 5.8 15.1 3.8 96.2 501 48.9 51.1 2 additional classifications 696 47.3 339 48.7 192 13.1 118 8.0 17.0 3 4 96.6 74 36.5 63.5 3 or more additional classifications 189 49.4 91 48.2 56 14.6 37 9.7 19.6 5.4 91.6 19 42.1 57.9 Unknown 39 34.8 19 48.7 11 9.8 4 3.6 10.3 0 100.0 7 57.1 42.9
Al l separations, total 13,886 32.5 7,177 51.7 4,190 9.8 1,981 4.6 14.3 5.9 94.1 2,209 51.7 48.3 Lay-off of less than 30 days 807 24.5 468 58.0 699 21.3 134 4.1 16.6 7.5 92.5 565 79.8 20.2 Lay-off of 30 days or more 6,656 31.1 3,608 54.2 1,945 9.1 884 4.1 13.3 6.0 94.0 1,061 52.0 48.0 Discharge 1,432 35.6 732 51.1 307 7.6 193 4.8 13.5 4.7 95.3 114 16.7 83.3 Quit 2,899 37.3 1,301 44.9 705 9.1 460 5.9 15.9 5.4 94.6 245 15.9 84.1 Labor dispute 15 24.2 11 73.3 5 8.1 2 3.2 13.3 0 100.0 3 33.3 66.7 Other 2,077 33.5 1,057 50.9 529 8.5 308 5.0 14.8 6.2 93.8 221 35.7 64.3
Claimants in all occupations, total 13,886 32.5 7,177 51.7 4,190 9.8 1,981 4.6 14.3 5.9 94.1 2,209 51.7 48.3 Claimants in shortage areas, total 3,203 36.8 1,407 43.9 973 11.2 514 5.9 16.0 3.7 96.3 459 48.4 51.6
Nationally critical 195 48.0 75 38.5 85 20.9 40 9.9 20.5 7.5 92.5 45 48.9 51.1 Locally critical 120 47.1 39 32.5 41 16.1 28 11.0 23.3 3.6 96.4 13 76.9 23.1 Noncritical 2,888 35.9 1,293 44.8 847 10.5 446 5.5 15.4 3.4 96.6 401 47.4 52.6
Claimants in nonshortage areas, total 10,683 31.4 5,770 54.0 3,217 9.4 1,467 4.3 13.7 6.6 93.4 1,750 52.5 47.5 Nationally critical 393 44.7 200 50.9 135 15.4 66 7.5 16.8 4.5 95.5 69 39.1 60.9 Locally critical 380 43.4 241 63.4 135 15.4 63 6.1 13.9 13.2 86.8 82 59.8 40.2 N o n c r i t i c a l 9,910 30.7 5,329 53.8 2,947 9.1 1,348 4.2 13.6 6.5 93.5 1,599 52.7 47.3
Claimants employed at the completion of survey, total 3,037 51.9 895 29.5 4,190 71.6 1,981 33.9 65.2 5.9 94.1 2,209 51.7 48.3
Claimants in shortage areas, total 783 57.0 212 27.1 973 70.8 514 37.4 65.6 3.7 96.3 459 48.4 51.6 Nationally critical 65 65.0 14 21.5 85 85.0 40 40.0 61.5 7.5 92.5 45 48.9 51.1 Locally critical 33 68.8 5 15.2 41 85.4 28 58.3 84.8 3.6 96.4 13 76.9 23.1 Noncritical 685 55.9 193 28.2 847 69.1 446 36.4 65.1 3.4 96.6 401 47.4 52.6
Claimants in nonshortage areas, total 2,254 50.4 683 30.3 3,217 71.9 1,467 32.8 65.1 6.6 93.4 1,750 52.5 47.5 Nationally critical 107 60.5 36 33.6 135 76.3 66 37.3 61.7 4.5 95.5 69 39.1 60.9 Locally critical 92 52.9 38 41.3 135 77.6 53 30.5 57.6 13.2 86.8 82 59.8 40.2 Noncritical 2,055 49.8 609 29.6 2,947 71.4 1,348 32.7 65.6 6.5 93.5 1,599 52.7 47.3
Claimants not employed at the completion of survey, total 7,028 28.0 3,847 54.7
Claimants in shortage areas, total 1,461 32.3 629 43.1 Nationally critical 79 44.9 37 46.8 Locally critical 51 37.8 13 25.5
Noncritical 1,331 31.6 579 43.5 Claimants in nonshortage areas, total 5,567 27.1 3,218 57.8
Nationally critical 172 38.3 95 55.2 Locally critical 168 39.3 117 69.6 Noncritical 5,227 26.5 3,006 57.5
1 See table 1, footnote 2. 2 A critical occupation is an essential occupation in which existing or antic
ipated demand exceeds available supply. A nationally critical occupation is one listed as such in releases of the War Manpower Commission. A locally critical occupation is a critical occupation not included in the national list.
3 Shortage areas are those with a current acute labor shortage or labor stringency and those anticipating a labor shortage within 6 months. Al l other areas are classified as nonshortage.
4 Employment status determined as of cut-off date, which was Feb. 13, 1943. for claimants who had filed claims for less than 5 weeks of unemployment during the present claims series, and was March 13 for all other claimants.
5 Includes all referrals made prior to survey week. 6 Includes only placements made or employment reported during or after
survey week prior to cut-off date.
Employment status and additional occupational classification.—More than one occupational classification was assigned to 25 percent of the claimants, thus permitting them to be considered for a job in more than one type of work. The greater the number of additional classifications, the higher was the percentage of referrals which re

sulted in placements. This latter percentage was nearly half again as great for claimants with three or more additional classifications as for claimants with only one classification.
Employment status and type of separation.— The type of separation is directly related to duration of unemployment, as pointed out above, and also to opportunities for referral. More than one-third of the claimants who quit or were discharged from their last employment or were laid off for 30 days or more were offered referral, in contrast to one-fourth of those laid off for less than 30 days. The claimants in the latter group were relatively unsuitable for referral by the Employment Service because they retained an attachment to a former employer. Claimants who had quit or been discharged from their last jobs—the group with the highest percentage of referrals—had a relatively low percentage of refusals, possibly because their manner of separation disqualified many of them from benefits; they may therefore have been more willing to accept any offered work. Claimants who are laid off tend to return to their former employers more often than any other group. Four of every five reemployed claimants who were laid off for less than 30 days and every second claimant laid off for 30 days or more returned to their former employer, as compared with one out of six who were discharged or quit their former jobs.
Employment status and occupation.—Although 87 percent of the claimants were seen by an Employment Service interviewer during their current spell of unemployment, only 33 percent
were referred to job openings. However, the proportion of referrals ranged from about 16 percent in Georgia, Idaho, and Louisiana to 60 percent in Oklahoma and 66 percent in Montana; it was considerably greater in shortage than in non-shortage areas and in critical than in noncritical occupations (table 6).
More than half of those referred to jobs refused one or more of the referrals offered them. Furthermore, 38 percent of the claimants referred were rejected by the employer.14 The percentage of refusals to accept referral was smaller in shortage than in nonshortage areas (44 as against 54 percent), and was only about 30 percent for claimants employed at the end of the survey.
More than 20 percent of the claimants in critical occupations in shortage areas who were referred to jobs were placed, compared with the overall figure of 14 percent. In connection with the latter figure, however, the understatement of the data on the volume of placements must be kept in mind; the automatic elimination of all successful referrals within the period preceding the survey resulted in an overrepresentation of unsuccessful referrals, which is shown in the unrealistic ratio of one placement for every seven referrals.
14 A report by the Illinois Employment Security Agency as of August 26, 1943, on the results of the spot placement program for Apri l 25-July 24 indicates that 34 percent of the 118,816 claimants were offered referral to jobs, and that half of those referrals were believed to have resulted in employment. Of those offered referrals, 33 percent refused to accept them; 73 percent of the refusals were found to have been for "good cause"; and in 5 percent of the cases the claimant was found to be unavailable for work, either temporarily or indefinitely. The remaining 22 percent of the cases resulted in contests to determine whether the claimant had good cause for refusal.
Table 7.—Number and percent of claimants referred in usual or other than usual occupation, by occupational and area classification 1
Occupational and area classification Number of claimants referred 2
Number of claimants re
ferred 3 in usual, other than
usual, or either occupation
Referred in usual occupation
Referred in other than usual occupation
Occupational and area classification Number of claimants referred 2
Number of claimants re
ferred 3 in usual, other than
usual, or either occupation Number Percent Number Percent
Claimants in all occupations, total 13,886 15,092 6,076 40.8 9,016 59.7
Claimants in shortage areas, total 3,203 3,551 1,503 42.8 2,048 57.7 Nationally critical 195 226 115 50.9 111 49.1 Locally critical 120 135 64 47.4 71 52.6 Noncritical 2,888 3,190 1,824 41.5 1,866 58.5 Claimants in nonshortage areas, total
10,683 11,541 4,573 39.6 6,968 60.4 Nationally critical 393 447 210 47.0 237 53.0 Locally critical 380 434 202 46.5 232 53.5 Noncritical 9,910 10,660 4,161 89.0 6,499 61,0
1 See footnotes to tables 1 and 0 for definitions of terms used in this table. 2 Includes all referrals made prior to survey week.
3 This figure is greater than the number of claimants referred because claimants referred in both usual and other than usual occupation were counted twice.

Table 8.—Frequency of referrals 1 and refusals, by occupational and area classification 2
Occupational and area classification
Percentage distribution of claimants by—
Occupational and area classification Number of referrals in usual occupation
Number of referrals in other than usual occupation Number of refusals of jobs Occupational and area classification
Al l 1 2 3 or more A l l 1 2 3 or more Number Al l 1 2 3 or more
Claimants in all occupations, total 100.0 76.1 16.5 7.4 100.0 72.5 18.1 9.4 7,177 100.0 72.6 18.5 8.9 Shortage areas, total 100.0 74.4 17.2 8.4 100.0 70.7 17.5 11.8 1,407 100.0 71.5 16.7 11.8
Nationally critical 100.0 67.9 19.1 13.0 100.0 70.3 18.0 11.7 76 100.0 61.3 24.0 14.7 Locally critical 100.0 73.4 21.9 4.7 100.0 70.4 15.5 14.1 39 100.0 76.9 12.8 10.3 Noncritical 100.0 75.0 16.8 8.2 100.0 70.8 17.5 11.7 1.293 100.0 71.9 16.4 11.7
Nonshortage areas, total 100.0 76.6 16.3 7.1 100.0 72.9 18.3 8.8 5,770 100.0 73.0 18.8 8.2 Nationally critical 100.0 71.9 20.5 7.6 100.0 74.6 16.5 8.9 200 100.0 75.5 15.5 9.0 Locally critical 100.0 71.3 22.3 6.4 100.0 68.6 19.8 11.6 241 100.0 63.9 22.8 13.3
Noncritical 100.0 77.1 15.8 7.1 100.0 73.0 18.3 8.7 5,329 100.0 73.4 18.6 8.0
1 Includes all referrals made prior to survey week. 2 See footnotes to tables 1 and 6 for definitions of terms used in this table.
Altogether, 10 percent of the claimant group were reported reemployed during the period studied. Of the 4,190 claimants reported placed or employed, 47 percent were placed by the Employment Service and 53 percent employed through their own efforts. In shortage areas the percentage of claimants placed exceeded the proportion employed through their own efforts, an indication of greater success or greater efforts of the Employment Service in those areas.
Only 6 percent of all claimants reported as placed went back to their former employers, but this figure varied with the type of occupation and area. The highest percentage (13) was found for claimants in locally critical occupations in nonshortage areas. I t is reasonable to assume that most employers who reemploy their former workers would not normally do so through the Employment Service, and that they would use the Service most frequently in hiring workers in critical occupations.
Of the claimants reported as employed at the close of the survey, about half had gone back to their former employers. This fact clearly reflects the large representation of seasonal workers (in construction, apparel, canning) who tend to return to their former employers as soon as the busy season begins and for whom placement efforts by the Employment Service are of minor importance. I n locally critical occupations, three of every four claimants returned to their former employers.
Of the 13,886 claimants referred, about 9 percent were referred in both their usual and in other than their usual occupations (table 7). The percent referred in both types of occupations was greatest for claimants whose primary classification was in a critical occupation.
Six of every 10 claimants and about half of those in critical occupations offered referral were referred to other than their usual occupations. About 1 of 4 claimants was referred more than once in his usual occupation and 7 of every 100 claimants had 3 or more referrals. Claimants in critical occupations, for whom the demand was greatest, had a much higher record of referrals; twice as many as the average were referred 3 times or more in their usual occupations.
Twenty-seven percent of the claimants who refused to accept referral refused more than once, 9 percent three times or more; a higher percentage of claimants in nationally critical occupations—15 percent in shortage areas—refused referrals 3 times or more.
Employment status and training.—Few of the claimants had been enrolled in vocational training courses. While many claimants may have found it necessary to change their occupations in order to find jobs, apparently few were ready to take the necessary training at the time they filed claims for unemployment compensation. Of the 42,757 claimants in the sample, 1,219 had refused referral to training courses, and only 1,335 had accepted such referrals. In the latter group, 455 had completed training, 554 were attending courses, and 326 were awaiting assignment to a class. The small use of the vocational training facilities by claimants may have been due not only to the larger concentration of seasonal and older workers among the claimant group but also to a preference for training on the job, with the expectation of continued employment, instead of noncompensated training in vocational courses with uncertain opportunities for employment.
Training courses had little effect on referral

and placement activities. While no detailed analysis of the available figures is presented in this article, it may be noted that the percent of claimants who completed training courses was far greater for those in nationally critical occupations than those in noncritical occupations, and greater in nonshortage than in shortage areas. Three-fifths of those who had completed training courses were assigned additional classifications. Most claimants who completed or were attending training courses had been laid off for 30 days or more or quit their jobs, and they probably felt the need for obtaining or improving occupational skills.
Employment status and personal characteristics of claimants.—Young workers were found to be more readily referable to jobs than those in the older age groups; about half as many claimants
who were 65 and over returned to work as in the other age groups (table 9). Placement efforts were 50 percent more successful for claimants under age 22 than for the average claimant.
Proportionately more single than married claimants were reemployed. In general, single claimants without dependents showed a higher rate of reemployment than those with dependents; married claimants, on the other hand, were reemployed more rapidly if they had dependents.
Relatively, only half as many noncitizens as citizens were placed by the Employment Service; however, the chances of reemployment through other sources appeared to be almost equal for both groups. Claimants of American birth had a better placement and reemployment record than those of foreign birth.
Physical handicaps had little effect on reem-
Table 9.—Distribution of claimants placed or reported employed, by age, citizenship, nationality, marital and dependency status, type of physical handicap, and draft status 1
Selected characteristic Total claimants
Placed or reported employed
Selected characteristic Total claimants Total
number Percentage dis
tribution
Percent of total claimants
Percent placed with— Percent, reported employed with— Selected characteristic
Total claimants Total
number Percentage dis
tribution
Percent of total claimants Former
employer Other em
ployer Former
employer Other em
ployer
Age, total 2
42,753 4,190 100.0 9.9 0.3 4.4 2.7 2.5 Under 22 2,240 240 5.7 10.7 .3 6.1 1.8 2.5 22-44 19,501 2,072 49.4 10.7 .3 4.9 2.8 2.7 45-64 17,258 1,687 40.3 9.8 .3 4.1 2.9 2.5 65 and over 3,754 191 4.6 5.2 .2 2.0 1.6 1.4
Citizenship, total 42,757 4,190 100.0 9.9 .3 4.4 2.7 2.5 Citizens 38,900 3,927 93.7 10.1 .3 4.6 2.6 2.6 Noncitizens 3,857 263 6.3 7.3 .2 2.2 3.4 1.5 Nationality, total 42,757 4,190 100.0 9.9 .3 4.4 2.7 2.5
American 32,397 3,361 80.2 10.4 .3 4.8 2.6 2.7 German 803 77 1.8 9.6 .3 3.7 2.1 3.5 Italian 2,277 128 3.1 5.6 0 2.2 2.1 1.3 Other 7,280 624 14.9 8.6 .2 3.2 3.4 1.8
Marital and dependency status, total 3 42,670 4,181 100.0 9.9 .3 4.4 2.7 2.5 Single 6,779 736 17.6 11.0 .3 5.3 2.8 2.6 With dependents 1,403 142 3.4 10.2 . l 5.5 2 2 2.4 Without dependents 5,376 594 14.2 11.2 .3 5.3 3.0 2.6 Married 35,891 3,446 82.4 9.7 .3 4.2 2.7 2.5 With dependents 13,818 1,441 34.5 10.5 .3 4.6 2.8 2.8
Without dependents 22,073 2,004 47.9 9.2 .3 4.0 2.6 2.3 Physical handicap, total 42,757 4,190 100.0 9.9 .3 4.4 2.7 2,5 No physical handicaps, total 38,525 3,843 91.7 10.1 .3 4.4 2.8 2.6
Physically handicapped, total 4,232 347 8.3 8.2 .2 4.5 1.3 2.2 Permanent 3,269 272 6.5 8.4 .2 4.7 1.5 2.0 Temporary 746 72 1.7 9.8 .3 4.9 1.1 3.5
Pregnancy 217 3 .1 1.6 0 .5 .5 .5 Draft status: 4
All claimants with draft status 14,721 1,821 100.0 12.4 .2 5.7 3.0 3.5 1A fit for general military service 1,030 94 5.2 9.2 .1 5.3 1.3 2.5 2A deferred (essential activities) 142 20 1.1 14.0 .7 5.6 4.2 3.5 2B and 3B deferred (war production) 451 94 5.2 21.0 .4 6.7 8.3 5.6 2C and 3C deferred (agricultural occupation) 68 4 . 2 6.0 0 3.0 1.5 1.5 3A deferred (family responsibility) 4,508 626 34.3 14.0 .3 6.0 3.7 4.0 4F rejected 1,554 204 11.2 13.4 .5 8.1 1.8 3.0 Other 6,968 779 42.8 11.3 .2 5.0 2.7 3.4
1 See footnotes to tables 1, 4, and 6 for definitions of terms used in this table. 2 Excludes 4 claimants; data not available
3 Excludes 87 claimants; data not available. 4 Status as of February 1943.

ployment. The percent of temporarily and permanently handicapped claimants who were reemployed was about the same as the average for all claimants.
Claimants classified as 1A encountered more difficulties in obtaining reemployment than those with other draft classifications who had any
appreciable representation in the sample. Thus, 21 percent of those deferred because of their attachment to war production and 14 percent of those with family responsibilities were placed or found employment, as compared with 9 percent of those with 1A classifications. About 13 percent of claimants in 4F returned to employment.