a support vector machine-based prediction model for
TRANSCRIPT

Volume 6 Issue 2 Article 8
A Support Vector Machine-based Prediction Model for Electrochemical A Support Vector Machine-based Prediction Model for Electrochemical Machining Process Machining Process
Subham Agarwal Mr. Jadavpur University, [email protected]
Shruti Sudhakar Dandge Ms. Government Polytechnic, Murtizapur, Maharashtra, [email protected]
Shankar Chakraborty Prof. Jadavpur University, [email protected]
Follow this and additional works at: https://kijoms.uokerbala.edu.iq/home
Part of the Biology Commons, Chemistry Commons, Computer Sciences Commons, and the Physics Commons
Recommended Citation Recommended Citation Agarwal, Subham Mr.; Dandge, Shruti Sudhakar Ms.; and Chakraborty, Shankar Prof. (2020) "A Support Vector Machine-based Prediction Model for Electrochemical Machining Process," Karbala International Journal of Modern Science: Vol. 6 : Iss. 2 , Article 8. Available at: https://doi.org/10.33640/2405-609X.1508
This Research Paper is brought to you for free and open access by Karbala International Journal of Modern Science. It has been accepted for inclusion in Karbala International Journal of Modern Science by an authorized editor of Karbala International Journal of Modern Science.

A Support Vector Machine-based Prediction Model for Electrochemical A Support Vector Machine-based Prediction Model for Electrochemical Machining Process Machining Process
Abstract Abstract Manufacturing of quality products is one of the core measures to address competitiveness in industries. Hence, it is always necessary to accomplish quality prediction at early stages of a manufacturing process to attain high quality products at the minimum possible cost. To achieve this goal, the past researchers have developed and investigated the applications of different intelligent techniques for their effective deployment at various stages of manufacturing processes. In this paper, support vector machine (SVM), a supervised learning system based on a novel artificial intelligence paradigm, is employed for prediction of three responses, like material removal rate, surface roughness and radial overcut during an electrochemical machining (ECM) operation. Gaussian radial basis kernel function is adopted in this algorithm to provide higher prediction accuracy. Regression analyses are also carried out to validate the effectiveness of these prediction models. The SVM-based results show good agreement between the experimental and predicted response values as compared to linear and quadratic models. Among the four ECM process parameters, i.e. applied voltage, tool feed rate, electrolyte concentration and percentage of reinforcement of B4C particles in the metal matrix, tool feed rate is identified having the maximum influence on the considered responses.
Keywords Keywords ECM process; SVM; Kernel function; Prediction; Response
Creative Commons License Creative Commons License
This work is licensed under a Creative Commons Attribution-Noncommercial-No Derivative Works 4.0 License.
This research paper is available in Karbala International Journal of Modern Science: https://kijoms.uokerbala.edu.iq/home/vol6/iss2/8
1. Introduction
Electrochemical machining (ECM) is one of themost potential and useful non-traditional machiningprocesses which possesses the capability to generatecomplex and intricate shapes on diverse hard, toughand high strength materials. Nowadays, varieties ofmachining operations, like grinding, turning, drilling,deburring etc. can be effectively carried out usingECM process. This process works on the principle ofthe Faraday's law of electrolysis in which material isremoved from the workpiece by anodic dissolution ofthe electrolyte. It consists of two electrodes, connectedto high voltage power supply, and a very small gap ismaintained between them separated by an electrolytefor efficient exchange of ions, causing removal ofmaterial from the workpiece. In this process, the ma-terial removal mechanism is based on electrolysiswhere metals are released from the workpiece atom byatom. Controlled anodic electrochemical dissolutiontakes place in the electrolyte in which tool acts as acathode and workpiece as an anode while applying avoltage between the tool and the workpiece. Theelectrolyte is forced to pass at a high velocity throughthe gap between the electrodes and material is removedduring this continuous dissolution process [1,2]. TheECM process can machine components with no burrformation and no residual stress generation. It haslonger tool life with almost no tool wear, higher ma-terial removal rate (MRR), and achievement of goodsurface quality and higher dimensional accuracy of themachined components. Thus, it provides an effectiveand economical solution for machining of highstrength materials having complex geometries whichare not possible to be machined by the conventionalmachining processes [3]. As in this process, themachining performance does not depend on the hard-ness of the workpiece materials, it can thus be effec-tively applied for machining of any hard material. Onthe contrary, it has higher machining cost and lack ofeco-friendliness, and it causes corrosion to themachining set-up. The performance of an ECM processis often characterized by its various outputs (re-sponses), like MRR, surface roughness (SR), radialovercut (ROC) etc. which are usually influenced by itsdifferent control parameters, such as applied voltage,electrolyte concentration and flow rate, inter-electrodegap, tool feed rate etc. In recent years, it has also
received significant attention in machining of micro-components [4].
Like all other machining processes, in an ECMprocess, its varied input parameters also interact be-tween themselves and influence its outputs. These in-terrelations between the ECM process parameters andresponses can be efficiently studied with the develop-ment of a suitable model based on the experimentalobservations. Models usually involve a set of inde-pendent parameters and fitting a model helps indetermining the values of other dependant parameters.Due to complex stochastic material removal mecha-nism of the ECM process and possible interactionsbetween the considered process parameters and re-sponses, it has now become an essential task to developan accurate and reliable model based on which theresponses of an ECM process can be efficiently pre-dicted so as to enhance quality of the machined com-ponents. It would finally help the concerned processengineers to envisage the responses for a given set ofECM process parameters.
2. Literature review
The past researchers have already proposed diversemethodologies for predicting the performance of theECM processes, and investigating the complex in-terrelationships between the input parameters and re-sponses. Ashokan et al. [5] applied artificial neuralnetwork (ANN) and grey relation analysis (GRA) formodeling and multi-objective optimization of an ECMprocess, while considering applied voltage, current,electrolyte flow rate and inter-electrode gap as themachining parameters, and MRR and SR as the re-sponses. It was concluded that ANN would result inbetter prediction of the responses with respect to per-centage deviation between the training and testingdatasets. Senthilkumar et al. [6] studied the effects ofelectrolyte concentration, applied voltage, tool feedrate and electrolyte flow rate on MRR and SR, anddeveloped a mathematical model for prediction ofMRR and SR during ECM operation on LM25 Al/10%SiCp composites. Based on Taguchi's L27 experimentaldesign plan, Senthil Kumar and Sivasubramanian [7]examined the influences of applied voltage, electrolyteconcentration, electrode feed rate and amount ofreinforcement on MRR while performing ECM oper-ation on aluminum A356/SiCp metal matrix
https://doi.org/10.33640/2405-609X.1508
2405-609X/© 2020 University of Kerbala. This is an open access article under the CC BY-NC-ND license (http://creativecommons.org/licenses/
by-nc-nd/4.0/).

composites. A back propagation-based ANN modelwas also proposed to predict the values of MRR.Acharya et al. [8] developed response surface meth-odology (RSM)-based regression models for predictionof MRR and SR values during ECM operation of superalloys. Non-dominated sorting genetic algorithm-II(NSGA-II) was later employed to optimize themachining performance of the said process. Abuziedet al. [9] presented an ANN-based model for predictionof SR and MRR in an ECM process. During controlledECM operation, Senthilkumar et al. [10] analyzed theinfluences of electrolyte flow rate and concentration,applied voltage and tool feed rate on MRR and SRusing RSM-based models. Later, NSGA-II techniquewas implemented to maximize MRR and minimize SRfor the considered process. Rao and Padmanabhan [11]developed RSM-based models to study the relation-ships between electrode feed rate, applied voltage,electrolyte concentration and percentage of reinforce-ment, and SR and ROC during ECM operation ofAleSi/B4C composites. Teimouri and Sohrabpoor [12]adopted a neuro-fuzzy inference system to develop thecorresponding predictive models for MRR and SR inan ECM operation. The cuckoo search algorithm waslater utilized to optimize the considered process. Kas-dekar and Parashar [13] employed Box-Behnken andANN-based prediction models for MRR during ECMoperation of AA6061/CueSiC/graphite T6 compositematerials. The prediction performance of those twomodels was subsequently compared. Taking into ac-count applied voltage, feed rate, electrolyte flow rateand electrolyte concentration, Mehrvar et al. [14]endeavored to explore their effects on MRR and SR inan ECM process. Differential evolution algorithm waslater employed to optimize the considered responses.Kasdekar et al. [15] developed a multilayer perceptronmodel with back propagation algorithm using voltage,feed rate, electrolyte concentration and type of theelectrode material as the input parameters for predic-tion of MRR during ECM operation on AA6061 T6aluminum alloys.
In ECM processes, the literature has mainly beenflooded with the development of RSM-based regres-sion models correlating various input parameters withthe responses. Those models were optimized usingdifferent evolutionary algorithms to determine theoptimal combinations of various process parametersfor enhanced machining performance with betterresponse values. On the other hand, applications ofANN (mostly back propagation feed forward type)have also been proposed by the past researchers topredict the responses for the ECM processes. Few
applications of support vector machine (SVM) forprediction of the operational performance of differentmachining/manufacturing processes have been foundin the literature. Zhang et al. [16] developed hybridmodels for predicting processing time and electrodewear rate in a micro-electrical discharge machiningprocess based on SVM using the Gaussian kernelfunction. Chou et al. [17] proposed the applications ofSVM and radial basis function neural network(RBFNN) techniques for wafer quality prediction in asemiconductor manufacturing process. It was reportedthat SVM approach would result in better predictionaccuracy than RBFNN technique. Xu et al. [18]developed a least square SVM (LSSVM) model withRBF to investigate the effects of electrochemical me-chanical polishing parameters on SR properties ofbearing rollers. It was concluded that the adoptedmodel would be suitable for prediction of differentsurface characteristics with minimum mean absolutepercentage error (MAPE). Nayak and Tripathy [19]applied multi-layer feed forward neural network(MFNN) and LSSVM techniques to predict MRR andSR values in an ECM process. Based on mean squareerror (MSE) values, it was propounded that LSSVMwith RBF kernel function would outperform MFNNapproach with respect to prediction accuracy. In anelectrical discharge machining process, Aich andBanerjee [20] applied SVM algorithm to predict MRRand SR while attaining the minimum MAPE values ofthe training dataset at different combinations of theSVM parameters. Particle swarm optimization tech-nique was finally employed to determine the optimalSVM parameter combinations for achieving betterprediction performance. While conducting experi-mental runs in an abrasive water jet machining processusing borosilicate glass as the work material, Aichet al. [21] presented the application of a SVM-basedlearning model for effective prediction of various re-sponses of the considered process. Using SVM, Luet al. [22] developed prediction models for envisagingSR characteristics in different machining processes.Artificial bee colony algorithm was further utilized toincrease prediction accuracy and decrease parameteradjustment time of the adopted model. The derivedresults were finally compared with those as obtainedfrom the other popular evolutionary algorithms.
Thus, it can be observed that statistical methods andartificial intelligence techniques are the suitable ap-proaches for development of predictive models forenvisaging the complex material removal behavior ofvaried machining processes. Among different artificialintelligence techniques, ANNs with different
165S. Agarwal et al. / Karbala International Journal of Modern Science 6 (2020) 164e174
architectures and complexities have become popularamongst the researchers for studying the inherent re-lationships between input parameters and responses indiverse machining processes. But, ANNs usually sufferfrom several disadvantages, like hardware dependency,problem in determining the appropriate network ar-chitecture, unexplained behavior of the network, longlearning time, over-fitting of data etc. While over-coming these disadvantages of ANNs, it may beworthwhile to explore the feasibility of SVM in un-derstanding the relationships between the input pa-rameters and outputs, and predicting the responsevalues for different machining processes. It has alsobeen noticed from the literature review that there isimmense scarcity of the applications of SVM as aneffective prediction tool in the domain of ECM pro-cesses. In an ECM process, random fluctuations in theresponses are quite obvious due to its stochasticbehavior. These random variations in the experimentalresults can be effectively absorbed with particulartolerance value for intelligent prediction. The appli-cation of SVM can be a smart solution for dealing withthe complex behavior of ECM process while predictingthe corresponding response values. Thus, in this paper,an attempt is put forward to efficiently predict threeresponses of an ECM process, i.e. MRR, SR and ROCwhile taking into account applied voltage, tool feedrate, electrolyte concentration and percentage of rein-forcement of B4C particles in the metal matrix as theinput parameters of the said process. The predictionperformance of SVM is later validated with that ofregression method-based analyses. The anticipatedresponse values are also compared with the actualexperimental results which proves high prediction ac-curacy of the adopted SVM algorithm.
3. Support vector machine
The SVM is a useful soft computing tool based onstatistical learning theory which has been extensivelyutilized for classification, regression, pattern recogni-tion, dependency estimation, forecasting and con-structing intelligent machines [23]. The concept ofSVM was proposed by Vapnik [24] mainly for classi-fication tasks, but later, it was also adopted to deal withregression problems (support vector regression (SVR))with the inclusion of a loss function with a specificdistance measure [25]. The application of SVM isbased on construction of a separating hyperplane tomaximize the margin between two datasets accordingto their classes which have been previously mapped to
a high dimensional space [24]. To determine themargin, two parallel hyperplanes are established oneach side of the separating hyperplane. An optimalseparation is achieved by the hyperplane which has thelargest distance to the neighboring data points of theboth classes as larger margin leads to better general-ization error of the classifier. The SVM can be estab-lished while assigning a few numbers of parameters,like kernel function, loss function, regularizationparameter etc., which makes it more suitable foradoption in manufacturing environment. Moderate setsof training data are sufficient to effectively train thisalgorithm. This feature of SVM is highly useful for itsdeployment in real time machining operations wherecollection of huge set of experimental data is practi-cally impossible due to involvement of highermachining time and related cost. It has excellentgeneralization property, minimal adjusting parameters,no requirement to search out the best architecture andless chance of producing over-fitted model.
The SVR develops a linear model when all therelated input variables have been mapped into a higherdimensional feature space while applying some non-linear mapping (based on reproduction of kernels). Let,a set of training data {(x1,y1) (x2,y2), … (xN,yN)} isemployed for model development in a d-dimensionalinput space (x VRd). It is supposed that both thetraining and testing datasets are independent, disjointand identically distributed. The basic objective is toidentify a model from the hypothesis space whichwould be closest to the underlying target function. Thelinear target function in the feature space can beexpressed as:
f ðxÞ ¼ w$x þ b ð1Þ
where ($) is the dot product in the vector space, and wand b are the parameter vectors of the function. If theinput parameters do not have any linear relation to theoutput (non-linear model), they can then be mapped tothe feature space F(xi) from high dimensional inputspace through kernel functions. In most of the modeldevelopment techniques, data are fitted based on theleast training error calculation to determine the unknownweight vectors related with the training data. Hence,there is always an attempt to fit all the data as close as theexpected model. In SVR, an insensitive zone around theestimated function is implemented. This zone usuallytakes into consideration the variations within theallowable tolerances mentioned with the outputs. UsingVapnik's e-insensitive approach, a flexible tube with aspecific radius is symmetrically formed around the
166 S. Agarwal et al. / Karbala International Journal of Modern Science 6 (2020) 164e174

estimated function so that the absolute values of errorsless than a certain threshold e are ignored for both aboveand below the estimate. The radius of this hypertube thuscontrols the complexity of the learning process. With theincrement of this radius, the model would tend to bemore flat being incapable to unfold the unseen variationsin the outputs. On the contrary, lower radius would makethe model more complicated. The outliers around thishypertube are known as the support vectors. In order toutilize SVR for model fitting, a regularization parameteris introduced to penalize those support vectors and thepoints inside the insensitive zone are considered havingzero loss (penalty). In SVR, the learning task is trans-formed to the minimization of the error function definedthrough e-insensitive loss function which controls theaccuracy of the regressor. Thus, for effective modelfitting, selection of the appropriate values of regulari-zation parameter (C), radius of the insensitive tube (e)and kernel function is most important. The computa-tional complexity of SVR does not depend on thedimensionality of the input space. Additionally, it hasexcellent generalization capability with high predictionaccuracy.
Let L(y) be the loss function introduced to penalizeover-fitting of the model based on a set of training datapoints. Amongst various types of loss functions, e-insensitive loss function is mostly preferred for per-forming the process modeling.
Lðyi; f ðxiÞÞ¼��yi;experimental� f ðxiÞ
��� e; if��yi;experimental
� f ðxiÞ��� e¼0; if
��yi;experimental� f ðxiÞ��< e
ð2Þ
The concept of kernel function K (xi,x) provides away to deal with the problem of dimensionality,enabling the operations to be performed in the featurespace instead of potentially high dimensional inputspace. Gaussian radial basis function (GRBF) with s
standard deviation has better potentiality in solvingproblems in the higher dimensional input space.
Kðxi;xÞ¼ exp�� ��xi�x
��2.2s2
�ð3Þ
This problem can be efficiently solved using stan-dard dualization principle based on the Lagrangemultipliers (ai, ai*). The appropriate support vectorscan be easily identified from the difference between theLagrange multipliers (ai, ai*). Smaller values (close tozero) highlight the points inside the insensitive hyper-tube and the non-zero values indicate the elements insupport vector group. Thus, the weight vector w can beestimated as follows [26,27]:
w¼X
i¼1ð1ÞN
�ai�a*
i
�4ðxiÞ ð4Þ
Thus, the final model with the optimal combinationof C, e and s can be presented as below:
f ðxÞ¼X
i¼1ð1ÞN
�ai�a*
i
�Kðxi;xÞ þ b
������Coptimal
eoptimal
soptimal
ð5Þ
4. SVM for an ECM process
Rao and Padmanabhan [28] conducted 27 experi-ments on LM6 Al/B4C metal matrix composites usingan ECM set-up (Metatech make). A copper tool havingcircular cross section and 12 mm diameter with acentral hole was utilized during the experiments. Theflow rate of NaCl electrolyte was kept as 10 l/min and asteady inter-electrode gap of 0.5 mm was maintainedduring the experiment runs. While performing all theexperimental runs, values of the four ECM processparameters, i.e. applied voltage (AV) (in V), tool feedrate (FR) (in mm/min), concentration of the electrolyte(EC) (in g/l) and percentage of reinforcement of B4Cparticles in the metal matrix (PC) (in Wt%) werevaried at three different levels and the correspondingresponses, i.e. MRR (in g/min), SR (mm) and ROC (inmm) were measured. Table 1 shows the detailedexperimental plan along with the response values.These ECM process parameters are treated here as theinputs to the SVM algorithm for effective prediction ofthe corresponding response values. The MRR is theamount of material removed from the workpiece sur-face at unit machining time during the ECM operation,and it is the most important response characterizing theproductivity and efficiency of an ECM process. On theother hand, SR basically symbolizes the surface qualityof a machined component. It is quantified by the de-viations in the direction of the normal of a machinedsurface from its ideal form. If there are large de-viations, the surface is rough; otherwise, it is smooth.The ROC is the absolute deviation between the di-ameters of the machined hole and initial tool. Amongthese responses, MRR is the only beneficial qualitycharacteristic requiring its higher value. On the con-trary, lower values are always required for SR andROC (non-beneficial quality characteristics). Theinitial dataset containing 27 experimental runs of theECM process is adopted here to test the performance ofthe SVM algorithm. On the other hand, another 500experimental trials are simulated for training this
167S. Agarwal et al. / Karbala International Journal of Modern Science 6 (2020) 164e174

algorithm. These additional runs are simulated in suchway that all the process parameter settings and re-sponses must range within their extreme (minimumand maximum) values.
As already mentioned, this paper deals with thedevelopment of SVM-based models for effective pre-diction of three responses, i.e. MRR, SR and ROC inan ECM process using R-Studio (Version 1.1463)software. Based on the training data sets, three modelsare fitted through the learning process of SVM for thethree responses. The effectiveness and prediction ac-curacy of the SVM would mainly depend on theoptimal values of three free parameters, i.e. general-ization constant (C), insensitive parameter (e) andstandard deviation for GRBF (s). When applying theSVM for the considered ECM process, it is the firsttask to identify the most effective kernel function. TheSVM algorithm can construct varieties of learningmachines while adopting different kernel functions.Each of these kernel functions has its own specializedapplicability. The GRBF is employed here due to itsglobal acceptability and better potentiality to deal withhigher dimensional input space. It has minimum
hypermeters that greatly reduce the complexity of theprediction model than the other polynomial kernelfunctions. Grid search plots are the simplest ap-proaches to determine the optimal values of these threeparameters. The lower and upper limits in the searchspace are set by the user to find out the correspondingvalues of the considered parameters with maximumaccuracy. Here, the search intervals for parameters e
and C are set as [0 1] and [1 1000] respectively. Thegrid search with 10 k-fold validation with the trainingdataset is performed to optimize these parameters. Theoptimal values of e, C and s are provided in Table 2.
Now, using the optimal values of e, C and s, thecorresponding SVM-based prediction models aredeveloped so that the performance of these models
Table 2
Optimal values of SVM parameters.
Response e C s
MRR 0.0625 16 0.14057
SR 0.2500 8 0.15355
ROC 0.1250 32 0.14057
Table 1
Experimental plan and measured responses [28].
Exp. No. Applied
voltage
Tool feed rate Electrolyte
concentration
Percentage of
reinforcement
MRR SR ROC
1 12 0.2 10 2.5 0.268 4.948 0.96
2 12 0.2 20 5 0.335 5.002 0.94
3 12 0.2 30 7.5 0.227 4.591 0.79
4 12 0.6 10 2.5 0.353 4.92 0.75
5 12 0.6 20 5 0.448 4.498 0.65
6 12 0.6 30 7.5 0.42 4.725 0.8
7 12 1.0 10 2.5 0.689 4.555 0.67
8 12 1.0 20 5 0.545 4.356 0.64
9 12 1.0 30 7.5 0.703 4.232 0.65
10 16 0.2 10 5 0.321 4.882 0.91
11 16 0.2 20 7.5 0.329 4.823 0.94
12 16 0.2 30 2.5 0.488 4.254 1.05
13 16 0.6 10 5 0.379 4.54 0.76
14 16 0.6 20 7.5 0.302 4.431 0.69
15 16 0.6 30 2.5 0.583 3.998 0.99
16 16 1.0 10 5 0.615 4.274 0.75
17 16 1.0 20 7.5 0.619 4.346 0.7
18 16 1.0 30 2.5 0.812 3.598 0.93
19 20 0.2 10 7.5 0.282 5.472 0.91
20 20 0.2 20 2.5 0.599 4.797 1.1
21 20 0.2 30 5 0.603 4.64 1.16
22 20 0.6 10 7.5 0.526 5.214 0.85
23 20 0.6 20 2.5 0.688 4.897 1.03
24 20 0.6 30 5 0.732 4.531 1.08
25 20 1.0 10 7.5 0.688 5.002 0.64
26 20 1.0 20 2.5 0.887 4.389 0.99
27 20 1.0 30 5 0.944 3.989 1
168 S. Agarwal et al. / Karbala International Journal of Modern Science 6 (2020) 164e174
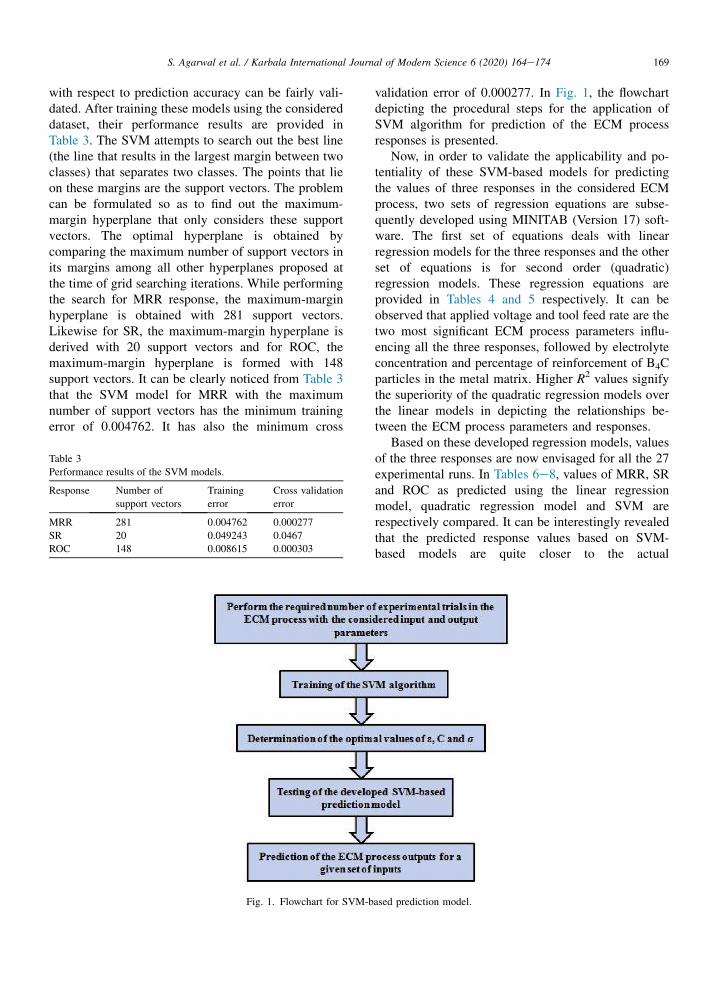
with respect to prediction accuracy can be fairly vali-dated. After training these models using the considereddataset, their performance results are provided inTable 3. The SVM attempts to search out the best line(the line that results in the largest margin between twoclasses) that separates two classes. The points that lieon these margins are the support vectors. The problemcan be formulated so as to find out the maximum-margin hyperplane that only considers these supportvectors. The optimal hyperplane is obtained bycomparing the maximum number of support vectors inits margins among all other hyperplanes proposed atthe time of grid searching iterations. While performingthe search for MRR response, the maximum-marginhyperplane is obtained with 281 support vectors.Likewise for SR, the maximum-margin hyperplane isderived with 20 support vectors and for ROC, themaximum-margin hyperplane is formed with 148support vectors. It can be clearly noticed from Table 3that the SVM model for MRR with the maximumnumber of support vectors has the minimum trainingerror of 0.004762. It has also the minimum cross
validation error of 0.000277. In Fig. 1, the flowchartdepicting the procedural steps for the application ofSVM algorithm for prediction of the ECM processresponses is presented.
Now, in order to validate the applicability and po-tentiality of these SVM-based models for predictingthe values of three responses in the considered ECMprocess, two sets of regression equations are subse-quently developed using MINITAB (Version 17) soft-ware. The first set of equations deals with linearregression models for the three responses and the otherset of equations is for second order (quadratic)regression models. These regression equations areprovided in Tables 4 and 5 respectively. It can beobserved that applied voltage and tool feed rate are thetwo most significant ECM process parameters influ-encing all the three responses, followed by electrolyteconcentration and percentage of reinforcement of B4Cparticles in the metal matrix. Higher R2 values signifythe superiority of the quadratic regression models overthe linear models in depicting the relationships be-tween the ECM process parameters and responses.
Based on these developed regression models, valuesof the three responses are now envisaged for all the 27experimental runs. In Tables 6e8, values of MRR, SRand ROC as predicted using the linear regressionmodel, quadratic regression model and SVM arerespectively compared. It can be interestingly revealedthat the predicted response values based on SVM-based models are quite closer to the actual
Table 3
Performance results of the SVM models.
Response Number of
support vectors
Training
error
Cross validation
error
MRR 281 0.004762 0.000277
SR 20 0.049243 0.0467
ROC 148 0.008615 0.000303
Fig. 1. Flowchart for SVM-based prediction model.
169S. Agarwal et al. / Karbala International Journal of Modern Science 6 (2020) 164e174
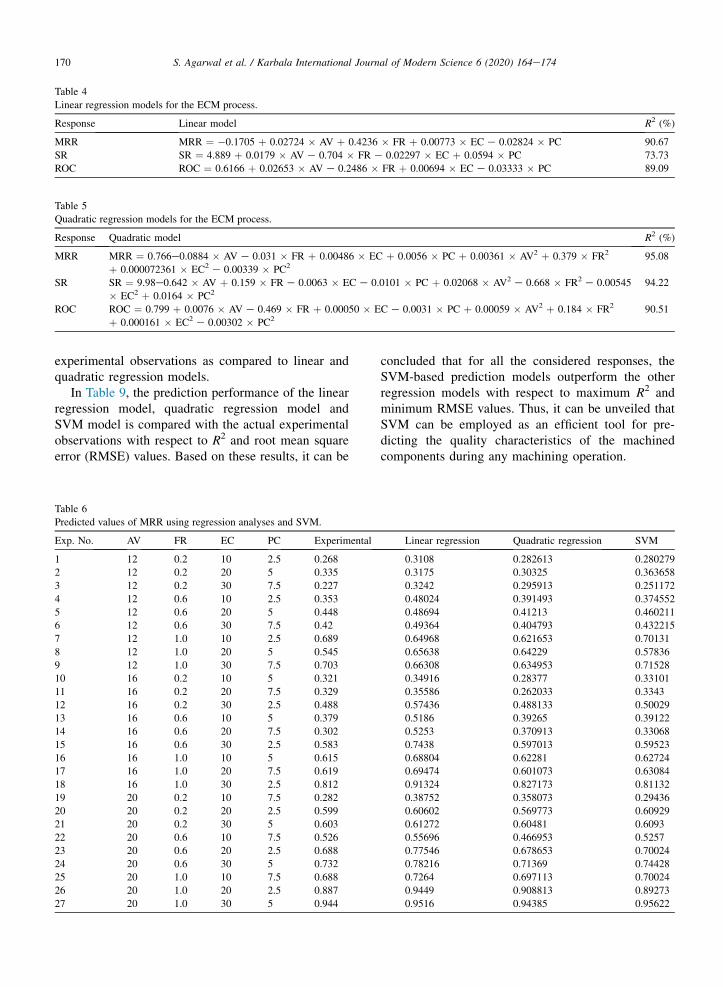
experimental observations as compared to linear andquadratic regression models.
In Table 9, the prediction performance of the linearregression model, quadratic regression model andSVM model is compared with the actual experimentalobservations with respect to R2 and root mean squareerror (RMSE) values. Based on these results, it can be
concluded that for all the considered responses, theSVM-based prediction models outperform the otherregression models with respect to maximum R2 andminimum RMSE values. Thus, it can be unveiled thatSVM can be employed as an efficient tool for pre-dicting the quality characteristics of the machinedcomponents during any machining operation.
Table 5
Quadratic regression models for the ECM process.
Response Quadratic model R2 (%)
MRR MRR ¼ 0.766e0.0884 � AV e 0.031 � FR þ 0.00486 � EC þ 0.0056 � PC þ 0.00361 � AV2 þ 0.379 � FR2
þ 0.000072361 � EC2 e 0.00339 � PC295.08
SR SR ¼ 9.98e0.642 � AV þ 0.159 � FR e 0.0063 � EC e 0.0101 � PC þ 0.02068 � AV2 e 0.668 � FR2 e 0.00545
� EC2 þ 0.0164 � PC294.22
ROC ROC ¼ 0.799 þ 0.0076 � AV e 0.469 � FR þ 0.00050 � EC e 0.0031 � PC þ 0.00059 � AV2 þ 0.184 � FR2
þ 0.000161 � EC2 e 0.00302 � PC290.51
Table 6
Predicted values of MRR using regression analyses and SVM.
Exp. No. AV FR EC PC Experimental Linear regression Quadratic regression SVM
1 12 0.2 10 2.5 0.268 0.3108 0.282613 0.280279
2 12 0.2 20 5 0.335 0.3175 0.30325 0.363658
3 12 0.2 30 7.5 0.227 0.3242 0.295913 0.251172
4 12 0.6 10 2.5 0.353 0.48024 0.391493 0.374552
5 12 0.6 20 5 0.448 0.48694 0.41213 0.460211
6 12 0.6 30 7.5 0.42 0.49364 0.404793 0.432215
7 12 1.0 10 2.5 0.689 0.64968 0.621653 0.70131
8 12 1.0 20 5 0.545 0.65638 0.64229 0.57836
9 12 1.0 30 7.5 0.703 0.66308 0.634953 0.71528
10 16 0.2 10 5 0.321 0.34916 0.28377 0.33101
11 16 0.2 20 7.5 0.329 0.35586 0.262033 0.3343
12 16 0.2 30 2.5 0.488 0.57436 0.488133 0.50029
13 16 0.6 10 5 0.379 0.5186 0.39265 0.39122
14 16 0.6 20 7.5 0.302 0.5253 0.370913 0.33068
15 16 0.6 30 2.5 0.583 0.7438 0.597013 0.59523
16 16 1.0 10 5 0.615 0.68804 0.62281 0.62724
17 16 1.0 20 7.5 0.619 0.69474 0.601073 0.63084
18 16 1.0 30 2.5 0.812 0.91324 0.827173 0.81132
19 20 0.2 10 7.5 0.282 0.38752 0.358073 0.29436
20 20 0.2 20 2.5 0.599 0.60602 0.569773 0.60929
21 20 0.2 30 5 0.603 0.61272 0.60481 0.6093
22 20 0.6 10 7.5 0.526 0.55696 0.466953 0.5257
23 20 0.6 20 2.5 0.688 0.77546 0.678653 0.70024
24 20 0.6 30 5 0.732 0.78216 0.71369 0.74428
25 20 1.0 10 7.5 0.688 0.7264 0.697113 0.70024
26 20 1.0 20 2.5 0.887 0.9449 0.908813 0.89273
27 20 1.0 30 5 0.944 0.9516 0.94385 0.95622
Table 4
Linear regression models for the ECM process.
Response Linear model R2 (%)
MRR MRR ¼ �0.1705 þ 0.02724 � AV þ 0.4236 � FR þ 0.00773 � EC e 0.02824 � PC 90.67
SR SR ¼ 4.889 þ 0.0179 � AV e 0.704 � FR e 0.02297 � EC þ 0.0594 � PC 73.73
ROC ROC ¼ 0.6166 þ 0.02653 � AV e 0.2486 � FR þ 0.00694 � EC e 0.03333 � PC 89.09
170 S. Agarwal et al. / Karbala International Journal of Modern Science 6 (2020) 164e174

Table 7
Predicted values of SR using regression analyses and SVM.
Exp. No. AV FR EC PC Experimental Linear regression Quadratic regression SVM
1 12 0.2 10 2.5 4.948 4.8818 5.21875 5.025122
2 12 0.2 20 5 5.002 4.8006 5.2745 4.900699
3 12 0.2 30 7.5 4.591 4.7194 5.42625 4.692491
4 12 0.6 10 2.5 4.92 4.6002 5.06859 4.818579
5 12 0.6 20 5 4.498 4.519 5.12434 4.599409
6 12 0.6 30 7.5 4.725 4.4378 5.27609 4.623488
7 12 1.0 10 2.5 4.555 4.3186 4.70467 4.568086
8 12 1.0 20 5 4.356 4.2374 4.76042 4.254431
9 12 1.0 30 7.5 4.232 4.1562 4.91217 4.333455
10 16 0.2 10 5 4.882 5.1019 5.24916 4.9349
11 16 0.2 20 7.5 4.823 5.0207 5.50991 4.800759
12 16 0.2 30 2.5 4.254 4.494 4.40491 4.355366
13 16 0.6 10 5 4.54 4.8203 5.099 4.641145
14 16 0.6 20 7.5 4.431 4.7391 5.35975 4.532416
15 16 0.6 30 2.5 3.998 4.2124 4.25475 4.008566
16 16 1.0 10 5 4.274 4.5387 4.73508 4.375348
17 16 1.0 20 7.5 4.346 4.4575 4.99583 4.244467
18 16 1.0 30 2.5 3.598 3.9308 3.89083 3.699541
19 20 0.2 10 7.5 5.472 5.322 6.14633 5.370803
20 20 0.2 20 2.5 4.797 4.7953 5.15033 4.898431
21 20 0.2 30 5 4.64 4.7141 5.09708 4.695756
22 20 0.6 10 7.5 5.214 5.0404 5.99617 5.198132
23 20 0.6 20 2.5 4.897 4.5137 5.00017 4.795556
24 20 0.6 30 5 4.531 4.4325 4.94692 4.429595
25 20 1.0 10 7.5 5.002 4.7588 5.63225 4.900715
26 20 1.0 20 2.5 4.389 4.2321 4.63625 4.490256
27 20 1.0 30 5 3.989 4.1509 4.583 4.09052
Table 8
Predicted values of ROC using regression analyses and SVM.
Exp. No. AV FR EC PC Experimental Linear regression Quadratic regression SVM
1 12 0.2 10 2.5 0.96 0.732515 0.883195 0.9779591
2 12 0.2 20 5 0.94 0.57979 0.87212 0.9597756
3 12 0.2 30 7.5 0.79 0.427065 0.855495 0.8097946
4 12 0.6 10 2.5 0.75 0.633075 0.754475 0.7455534
5 12 0.6 20 5 0.65 0.48035 0.7434 0.6697914
6 12 0.6 30 7.5 0.8 0.327625 0.726775 0.8131503
7 12 1.0 10 2.5 0.67 0.533635 0.684635 0.6897996
8 12 1.0 20 5 0.64 0.38091 0.67356 0.6597868
9 12 1.0 30 7.5 0.65 0.228185 0.656935 0.6697983
10 16 0.2 10 5 0.91 0.75531 0.9153 0.9289596
11 16 0.2 20 7.5 0.94 0.602585 0.866475 0.9490444
12 16 0.2 30 2.5 1.05 0.699835 1.118475 1.0698451
13 16 0.6 10 5 0.76 0.65587 0.78658 0.7660861
14 16 0.6 20 7.5 0.69 0.503145 0.737755 0.7098141
15 16 0.6 30 2.5 0.99 0.600395 0.989755 1.0098487
16 16 1.0 10 5 0.75 0.55643 0.71674 0.7564918
17 16 1.0 20 7.5 0.7 0.403705 0.667915 0.707678
18 16 1.0 30 2.5 0.93 0.500955 0.919915 0.9498055
19 20 0.2 10 7.5 0.91 0.778105 0.928535 0.9265004
20 20 0.2 20 2.5 1.1 0.875355 1.148335 1.1082601
21 20 0.2 30 5 1.16 0.72263 1.16946 1.1567052
22 20 0.6 10 7.5 0.85 0.678665 0.799815 0.8343884
23 20 0.6 20 2.5 1.03 0.775915 1.019615 1.0498376
24 20 0.6 30 5 1.08 0.62319 1.04074 1.0998425
25 20 1.0 10 7.5 0.64 0.579225 0.729975 0.6532017
26 20 1.0 20 2.5 0.99 0.676475 0.949775 1.0097725
27 20 1.0 30 5 1 0.52375 0.9709 1.0189854
171S. Agarwal et al. / Karbala International Journal of Modern Science 6 (2020) 164e174

Fig. 2 graphically exhibits the relationships betweenthe actual experimental observations and responsevalues as predicted using the considered models. It canclearly be observed that for all the responses, the SVM
model-based response values are the nearest to theobserved values having minimum deviations.
The SVM has already proved itself as an effectiveprediction model in the domain of data mining to
Table 9
Comparison of different prediction models with actual experimental data.
Response Compared pair R R2 RMSE
MRR Actual vs. SVM 0.9993 0.9986 0.015
Actual vs. Linear regression 0.9522 0.9067 0.087
Actual vs. Quadratic regression 0.9751 0.9508 0.043
SR Actual vs. SVM 0.9769 0.9543 0.09
Actual vs. Linear regression 0.8479 0.7189 0.2112
Actual vs. Quadratic regression 0.8846 0.7825 0.5163
ROC Actual vs. SVM 0.9983 0.9966 0.0165
Actual vs. Linear regression 0.6674 0.4454 0.3043
Actual vs. Quadratic regression 0.9514 0.9052 0.4836
Fig. 2. Comparison between predicted and actual experimental data for three responses.
172 S. Agarwal et al. / Karbala International Journal of Modern Science 6 (2020) 164e174

envisage the possible outcomes based on a set of inputvariables. In SVM, each model consists of a number ofpredictors, which are variables influencing the out-comes. It is an efficient tool for modeling of multi-dimensional problems where standard analytical/sta-tistical approaches fail. If the values of its three freeparameters, i.e. C, e and s are optimally chosen, it issupposed to provide robust prediction models whilecapturing small scale fluctuations in training as well astesting datasets. Other statistical approaches may havegeneralization property producing over-fitted models,but SVM minimizes the upper bound of the expectedrisk to minimize error in the training data. Thus,compared to statistical learning methodologies, SVMis devoid of four problems of efficiency of training,efficiency of testing, over-fitting and algorithmparameter tuning. As compared to other models, it canproduce accurate predictions and are least affected bynoisy data. In this paper, three SVM-based models aredeveloped to accurately predict MRR, SR and ROCresponses in an ECM process which would help theconcerned process engineers to maintain the quality ofthe machined components. In Table 9, high R2 valuesbetween the actual experimental data and SVM-basedpredicted values for all the three ECM responsesvalidate the superiority of SVM over linear andquadratic regression-based models as employed for theprediction purpose.
While applying GRA technique, Rao and Padma-nabhan [28] determined the optimal parametric mix forthe considered ECM process parameters as appliedvoltage ¼ 16 V, tool feed rate ¼ 1.0 mm/min, con-centration of the electrolyte ¼ 30 g/l and reinforcementcontent ¼ 5%. At that optimal setting, MRR, SR andROC values were obtained as 0.798 g/min, 3.859 mmand 0.73 mm respectively. On the other hand, thecorresponding responses were experimented as0.268 g/min, 4.948 mm and 0.96 mm at the initialoperating levels of the process parameters as applied
voltage ¼ 12 V, tool feed rate ¼ 0.2 mm/min, con-centration of the electrolyte ¼ 10 g/l and reinforcementcontent ¼ 2.5%. Table 10 exhibits the predicted valuesof the considered responses both at the initial andoptimal operating levels using linear, quadratic andSVM-based models. It can be clearly revealed that theSVM-based model is perfectly able to anticipate bettervalues of all the responses as compared to the obser-vations of Rao and Padmanabhan [28].
5. Conclusions
This paper deals with the development of suitableSVM-based models for effective prediction of MRR,SR and ROC during an ECM operation on metal ma-trix composites. The relationships of applied voltage,tool feed rate, electrolyte concentration and percentageof reinforcement of B4C particles in the metal matrixwith the considered responses are examined based onlinear and quadratic regression models. For successfulprediction of the responses, Gaussian radial basiskernel function is considered in the SVM algorithm.Finally, the optimal values of C, e and s are identified.The prediction performances of SVM, linear regressionand quadratic regression models are compared with theactual experimental data with respect to R2 and RSMEvalues. It can be revealed that SVM-based model hasbetter prediction accuracy as compared to the other tworegression-based models. The response values asenvisaged using the developed SVM-based modelsclosely match with the actual values. Thus, this modelcan be efficiently implemented to predict the qualitycharacteristics of varied machining processes. Study-ing the influences of other kernel functions, and valuese, C, and s on the prediction performance of the SVMalgorithm for the considered ECM process may betreated as the future scope of this paper.
References
[1] V.K. Jain, Advanced Machining Processes, Allied Publishers
Pvt. Ltd., New Delhi, India, 2010.
[2] P. Pandey, H. Shan, Modern Machining Processes, Tata
McGraw-Hill Publishing Com. Ltd., New Delhi, India, 2017.
[3] H.A.-G. El-Hofy, Advanced Machining Processes-Nontradi-
tional and Hybrid Machining Processes, McGraw-Hill Educa-
tion, USA, 2005.
[4] B. Bhattacharyya, S. Mitra, A.K. Boro, Electrochemical
machining: new possibilities for micro machining, Robot. Cim-
Int. Manuf. 18 (2002) 283e289.
[5] P. Asokan, R. Ravi Kumar, R. Jeyapaul, M. Santhi, Develop-
ment of multi-objective optimization models for electro-
chemical machining process, Int. J. Adv. Manuf. Technol. 39
(1e2) (2008) 55e63.
Table 10
Prediction of the responses at the optimal operating levels.
Response Method Initial operating
levels
Optimal operating
levels
MRR Linear 0.3108 0.84264
Quadratic 0.28261 0.77761
SVM 0.28028 0.85213
SR Linear 4.8818 4.0793
Quadratic 5.21875 4.17308
SVM 5.02512 3.72361
ROC Linear 0.73252 0.41763
Quadratic 0.88320 0.85554
SVM 0.97795 0.67256
173S. Agarwal et al. / Karbala International Journal of Modern Science 6 (2020) 164e174

[6] C. Senthilkumar, G. Ganesan, R. Karthikeyan, Study of elec-
trochemical machining characteristics of Al/SiCp composites,
Int. J. Adv. Manuf. Technol. 43 (3e4) (2009) 256e263.[7] K.L. Senthil Kumar, R. Sivasubramanian, Modeling of metal
removal rate in machining of aluminum matrix composite using
artificial neural network, J. Compos. Mater. 45 (22) (2011)
2309e2316.[8] B.R. Acharya, C.P. Mohanty, S.S. Mohapatra, Multi-objective
optimization of electrochemical machining of hardened steel
using NSGA II, Procedia Eng 51 (2012) 554e560.
[9] H.H. Abuzied, M.A. Awad, H.A. Senbel, Prediction of elec-
trochemical machining process parameters using artificial
neural networks, Int. J. Comput. Sci. Eng. 4 (1) (2012)
125e132.[10] C. Senthilkumar, G. Ganesan, R. Karthikeyan, Optimisation of
ECM parameters using RSM and non-dominated sorting ge-
netic algorithm (NSGA II), Int. J. Mach. Mach. Mater. 14 (1)
(2013) 77e90.[11] S.R. Rao, G. Padmanabhan, Multi-response optimization of
electrochemical machining of Al-Si/B4C composites using
RSM, Int. J. Manuf. Mater. Mech. Eng. 3 (3) (2013)
42e56.
[12] R. Teimouri, H. Sohrabpoor, Application of adaptive neuro-
fuzzy inference system and cuckoo optimization algorithm for
analyzing electro chemical machining process, Front. Mech.
Eng. 8 (4) (2013) 429e442.
[13] D.K. Kasdekar, V. Parashar, Performance of Box-Behnken and
prediction model are compared with Al-Nano MMC to maxi-
mize MRR, Mater. Today Proc. 4 (2016) 3173e3181.[14] A. Mehrvar, A. Basti, A. Jamali, Optimization of electro-
chemical machining process parameters: combining response
surface methodology and differential evolution algorithm, P. I.
Mech. Eng. E - J. Pro. 231 (6) (2017) 1114e1126.[15] D.K. Kasdekar, V. Parashar, C. Arya, Artificial neural network
models for the prediction of MRR in electro-chemical
machining, Mater. Today Proc. 5 (1) (2018) 772e779.
[16] L. Zhang, Z. Jia, F. Wang, W. Liu, A hybrid model using
supporting vector machine and multi-objective genetic algo-
rithm for processing parameters optimization in micro-EDM,
Int. J. Adv. Manuf. Technol. 51 (5e8) (2010) 575e586.
[17] P.H. Chou, M.J. Wu, K.K. Chen, Integrating support vector
machine and genetic algorithm to implement dynamic wafer
quality prediction system, Expert Syst. Appl. 37 (6) (2010)
4413e4424.
[18] W. Xu, Z. Wei, J. Sun, L. Wei, Z. Yu, Surface quality prediction
and processing parameter determination in electrochemical
mechanical polishing of bearing rollers, Int. J. Adv. Manuf.
Technol. 63 (1e4) (2012) 129e136.
[19] K.C. Nayak, R.K. Tripathy, Taguchi integrated least square
support vector machine an alternative to artificial neural
network analysis of electrochemical machining process, IOSR
J. Mech. Civ. Eng. 1 (3) (2012) 1e10.
[20] U. Aich, S. Banerjee, Modeling of EDM responses by support
vector machine regression with parameters selected by particle
swarm optimization, Appl. Math. Model. 38 (11e12) (2014)
2800e2818.
[21] U. Aich, S. Banerjee, A. Bandyopadhyay, P.K. Das, Support
vector machine-based unified learning system for prediction of
multiple responses in AWJM of borosilicate glass and SEM
study, Int. J. Mechatron. Manuf. Syst. 9 (1) (2016) 56e80.
[22] J. Lu, X. Liao, S. Li, H. Ouyang, K. Chen, B. Huang, An
effective ABC-SVM approach for surface roughness prediction
in manufacturing processes, Complexity (2019), https://doi.org/
10.1155/2019/3094670. Article ID 3094670 (2019) 13 pages.
[23] A.M. Deris, A.M. Zain, R. Sallehuddin, Overview of support
vector machine in modeling machining performances, Procedia
Eng 24 (2011) 308e312.
[24] V.N. Vapnik, The Nature of Statistical Learning Theory,
Springer, New York, 1995.
[25] B. Sch€olkopf, J. Burges, A. Smolla, Advances in Kernel
Methods, Support Vector Machines, Springer, Cambridge,
1999.
[26] V.N. Vapnik, Statistical Learning Theory, John Wiley & Sons,
New York, 1998.
[27] M. Awad, R. Khanna, Efficient Learning Machines: Theories,
Concepts, and Applications for Engineers and System De-
signers, Springer, New York, 2015.
[28] S.R. Rao, G. Padmanabhan, Optimization of machining pa-
rameters in ECM of Al/B4C composites using Taguchi method,
Int. J. Appl. Sci. Eng. 12 (2) (2014) 87e97.
174 S. Agarwal et al. / Karbala International Journal of Modern Science 6 (2020) 164e174