a supervised technique to ensure data...
TRANSCRIPT
I J L S C M • 4(1), 2012, pp. 1-8
A SUPERVISED TECHNIQUE TO ENSURE DATARELIABILITY IN WIRELESS SENSOR NETWORKS
N. CHITRADEVI1, V. PALANISAMY2, K. BASKARAN3 AND D. ASWINI4
1Associate Professor, Department of Information Technology, Kumaraguru College of Technology, Coimbatore2Principal, INFO Institute of Engineering, Coimbatore
3Assistant Professor,Department of Computer Science and Engineering, Government College of Technology, Coimbatore4Departmrnt of Computer Science and Engineering, PG Scholar, Kumaraguru College of Technology, Coimbatore
Abstract: In Wireless Sensor Network (WSN), sensors at different locations can generate streaming data, which canbe analyzed in real-time to identify events of interest. WSN usually have limited energy and transmission capacity,which cannot match the transmission of a large number of data collected by sensor nodes. So, it is necessary toperform in-network data aggregation in the WSN which is performed by aggregator node. Since, the nodes in WSNare vulnerable to malicious attackers and physical impairment; the data collected in WSNs may be unreliable. So, inthis paper, we propose an efficient technique to detect the unreliable data. Earlier, A Principal Component Analysis(PCA) is used to compress the data by reducing the number of dimensions. But as a drawback, it is not robust tooutliers. Hence, if the input data is corrupted, an arbitrarily wrong representation is obtained. To overcome thisproblem, we propose a Robust PCA which is augmented with Minimum Covariance Determinant (MCD), highly robustestimator. In the proposed approach the distributed nature of sensor data is modelled using the sound statisticaltechnique PCA and MCD is employed to design a noise-free data model. The performance of proposed approach isevaluated and compared with previous approaches and found that our approach is effective and efficient.
Keywords: WSN, PCA, and MCD.
I. INTRODUCTION
Wireless Sensor Networks (WSNs) are comprised ofmany tiny low-cost battery-powered sensors in a smallarea. The sensors detect physical or environmentalvariations and then transmit the detection results toother sensors or a base station. WSNs are resourceconstraint: limited battery power supply, bandwidth forcommunication, processing speed, and memory space.One possible way of achieving maximum utilizationof power is applying data aggregation on sensor data.Usually, processing data consumes much less powerthan transmitting data in wireless medium. Hence wego for a mechanism in which the packet size is reducedto considerable level and that leads to data aggregation.So, it is effective to apply data aggregation beforetransmitting data for reducing power consumption bya sensor node. Although aggregation markedly lowersthe traffic between node and the base station, the sensornode is critical and vulnerable to malicious attacks,which affect various operations of the network suchas routing, data aggregation, voting, and fair resourceallocation in various ways such as sybil attacks or
denial of service attacks. So, the data integrity andaccuracy problems that may be caused by compromisedor malfunctioning nodes are of high research andpractical importance. Towards this direction, in thispaper, we propose and evaluate an anomaly detectionapproach that fuses data gathered from different nodesin a distributed WSN and also provides data reliability.In earlier approach, A Principal Component Analysis(PCA) is used to compress the data by reducing thenumber of dimensions. But as a drawback, it is notrobust to outliers. Hence, if the input data is corrupted,an arbitrarily wrong representation is obtained. Toovercome this problem, we propose a Robust PCAwhich is augmented with Minimum CovarianceDeterminant (MCD), which removes the outliers. Thusthe data reliability and accuracy is achieved. One ofthe key features of the proposed approach is that itprovides an integrated methodology for effectivelycombining correlated sensor data, in a distributedfashion, in order to reveal anomalies that span througha number of neighboring sensors. Furthermore, itallows the integration of results from neighboring
2 N. Chitradevi, V. Palanisamy, K. Baskaran and D. Aswini
network regions to detect correlated anomalies/attacksthat involve multiple groups of sensors. Such anapproach can be used in principle to identify anabnormal situation in measurements (e.g., cases wherethe values of the measured or monitored parametersmay deviate significantly from the normal) discoverthe existence of faulty sensors, detect potential networkattacks, and filter suspicious reports throughout theoverall decision making process.
The remainder of this paper is organized as follows.In Section 2, we present some related work and InSection 3, we present system model and thecorresponding architecture used throughout this paperare described. In Section 4, the proposed model processis presented in detail. The corresponding performanceof our proposed approach is evaluated in Section 5,while Section 6 concludes this paper.
II. RELATED WORK
In [9]–[10], the authors presented several attackscenarios that exploit the weaknesses of WSNs. Thescale of deployments of WSNs requires carefuldecisions and tradeoffs among various securitymeasures. The authors discussed these issues andconsidered mechanisms to achieve a higher level ofsecurity and reliability in these networks. In [11], theauthors presented a statistical en-route filteringmechanism to detect and drop false reports during theforwarding process. Assuming that an event may bedetected by multiple sensors, each of the detectingsensors generates a keyed message authentication code(MAC), and multiple MACs are attached to the eventreport. In [12], the problem of faulty or malicious nodesis formalized as how to construct a dominating tree tocover all the neighbors of the suspect and give the lowerbound of the message complexity. Earlier related workreported in the literature has focused on detectingdeviations in data patterns among the sensors. In [13],the authors presented a framework for randomsampling mechanisms and interactive proofs to checkthat the values returned by aggregators are goodapproximations of the true values, even when theaggregators and a fraction of the sensor nodes arecorrupted. However, the described tests serve only asa proof of concept, as they consist of simple algorithmssuch as finding the minimum, maximum, and medianvalues. In [14], a spatial-temporal correlation analysiscalled “abnormal relationships test” (ART) is proposed,to detect outliers in the collected data. This method is
based on correlation coefficient tests betweenneighboring nodes. In [15], the authors describe atechnique for online identification of outliers inreadings collected by individual wireless sensors, andattempt to extend this technique to an entire networkof sensors, taking into consideration the distributedprocessing of events. However, that technique requiresthe complete knowledge of the density distributionfunction of the collected data. In [8], the approachfocused on the efficient detection of outliers throughouta sensor network in a distributed manner, and is basedon the use of PCA [4].
But the above works are not robust to outliers. Ourapproach makes PCA as Robust PCA by combiningMCD with PCA, where MCD is a robust estimator oflocation and scatter. The goal of PCA is to reduce thedimensionality of a data set in which there are a largenumber of interrelated variables, while retaining asmuch as possible of the variation present in the dataset. When an anomaly occurs, the system detects thepath containing the anomaly and necessary action istaken. The MCD algorithm [3] uses several time-savingtechniques which make it available as a routine tool toanalyze data sets with large n, and to detect deviatingsubstructures in them. The proposed approach is usefulin several fields like, online event detection, intrusiondetection and network anomaly detection.
III. SYSTEM ARCHITECTURE
We envision a sensor network paradigm with severalheterogeneous sensor nodes, where each node mayhave different capabilities and execute differentfunctions. A sensor network is usually represented bya network graph. An algorithm that correlates metricsfrom neighboring sensors is considered, to detect thenode(s) containing anomalies in the correspondingnetwork graph. In order to decentralize the detectionalgorithm, the sensor network is divided into groupsof sensors. The division may be done either staticallywhen the network is originally deployed, or the networkmay be dynamically rearranged periodically, if theenvironment changes. In any case, we consider thatthe division of the network into subgroups of nodes isbased on correlation tests among the nodes.
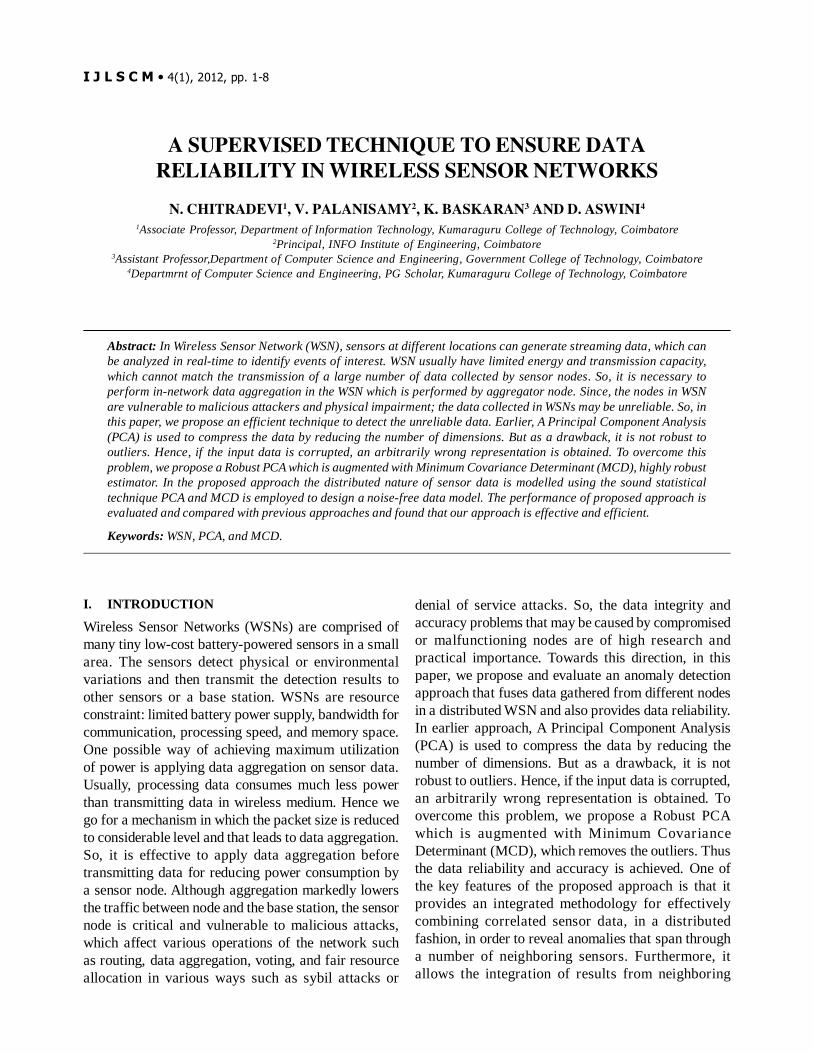
Figure 1 presents the sensor network topology andarchitecture under consideration. The creation ofgroups is based on the interrela tion in thecorresponding readings of the sensors. In every groupwe assume that there is a primary node, which usually
A Supervised Technique to Ensure Data Reliability in Wireless Sensor Networks 3
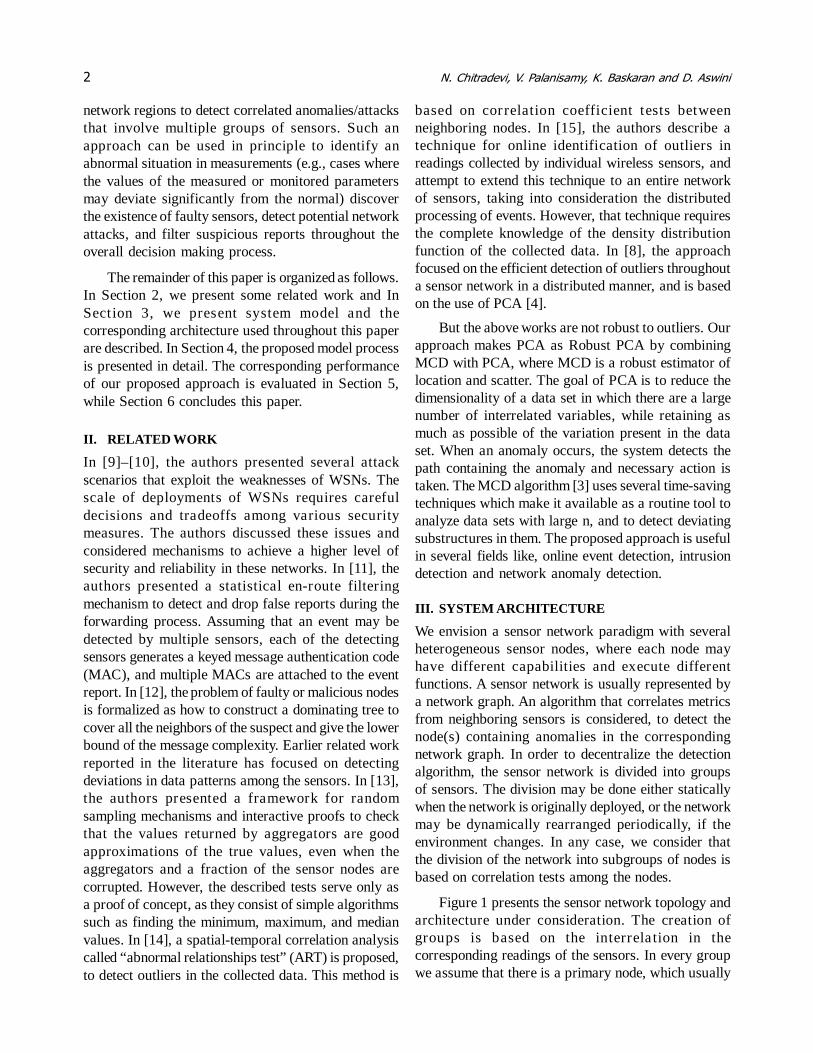
is equipped with more processing capability, power,sophistication, and intelligence. As the data in theneighbouring nodes are considered highly correlated,the data processing and aggregation might utilize thespatial correlation of local nodes and dramaticallydecrease the amount of information to be transmitted.Estimation of the data correlation properties based onthe previous and current collected data, can be used tolocally optimize the data compression and aggregationin the subsequent data gathering phases [2]. Theoutcome of the grouping procedure is that the groupsconsist of nodes with interrelated readings. It shouldbe also noted here that the various groups do not needto have mutually exclusive members as shown inFig. 2, the existence of a number of common secondarynodes is actually desired in many cases in order toimprove the detection effectiveness. Each primary nodeobtains sensor readings from the nodes in its groupand may perform localized real-time analysis. Ingeneral, every network node collects data withreference to one or more metrics that describe thespecific parameters that the node monitors.
IV. PROPOSED MODEL
The objective of this paper is to provide an efficientand effective methodology of fusing and combiningdata of heterogeneous monitors that spread through outthe network, in order to provide a generalizedframework, capable of detecting a wide range of classesof anomalies, such as the ones created randomly byfaulty nodes or others that result from coordinatedcompromised nodes. It provides data reliability. In ourwork, this is achieved by using PCA with MCD.
(A) Proposed Scheme
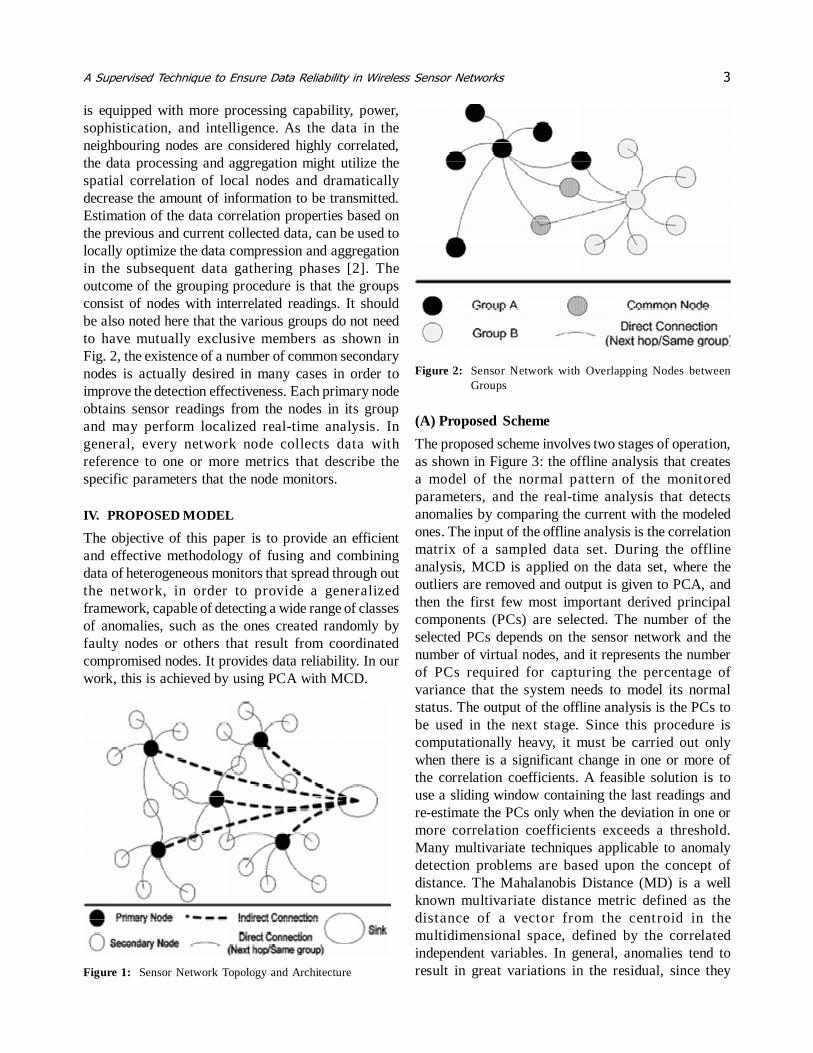
The proposed scheme involves two stages of operation,as shown in Figure 3: the offline analysis that createsa model of the normal pattern of the monitoredparameters, and the real-time analysis that detectsanomalies by comparing the current with the modeledones. The input of the offline analysis is the correlationmatrix of a sampled data set. During the offlineanalysis, MCD is applied on the data set, where theoutliers are removed and output is given to PCA, andthen the first few most important derived principalcomponents (PCs) are selected. The number of theselected PCs depends on the sensor network and thenumber of virtual nodes, and it represents the numberof PCs required for capturing the percentage ofvariance that the system needs to model its normalstatus. The output of the offline analysis is the PCs tobe used in the next stage. Since this procedure iscomputationally heavy, it must be carried out onlywhen there is a significant change in one or more ofthe correlation coefficients. A feasible solution is touse a sliding window containing the last readings andre-estimate the PCs only when the deviation in one ormore correlation coefficients exceeds a threshold.Many multivariate techniques applicable to anomalydetection problems are based upon the concept ofdistance. The Mahalanobis Distance (MD) is a wellknown multivariate distance metric defined as thedistance of a vector from the centroid in themultidimensional space, defined by the correlatedindependent variables. In general, anomalies tend toresult in great variations in the residual, since theyFigure 1: Sensor Network Topology and Architecture
Figure 2: Sensor Network with Overlapping Nodes betweenGroups
4 N. Chitradevi, V. Palanisamy, K. Baskaran and D. Aswini
present different characteristics. When there are onlya few multivariate outliers, examine each individuallyto determine how they differ from the centroid. Whenthere are many outliers we want to describe how theoutliers as a group differ from the centroid – justcompare the means of the outliers with the means ofthe total data set. When an anomaly occurs, the residualvector presents great variation in some of its variablesand the system detects the path containing the anomalyby selecting these variables.
Y = Ynorm + Yres (1)
Such Ynorm corresponds to modeled (normal) dataand Yres to the residual. We form Ynorm by projectingy onto the normal subspace S, and we form Yres byprojecting onto the abnormal subspace S. Toaccomplish this, we arrange the set of PCscorresponding to the normal subspace (v1, v2,….,vr)as columns of a matrix P of size p × r, where r denotesthe number of normal axes. Following this approach,Ynorm and Yres may be rewritten as follows:
Ynorm = PPTY = Cy and Yres = (I–PPT)y–C (2)
where matrix C = PPT represents the linear operatorthat performs projection onto the normal subspace S,and C likewise projects onto the anomaly subspace S.Thus, Ynorm contains the modeled (normal) data,while Yres contains the residual. In general, theoccurrence of an anomaly tends to result in a largechange to Yres. A change in variable correlation willincrease the projection of Y to the subspace S. Withinsuch a framework a typical statistic for detectingabnormal conditions is the squared prediction error(SPE) [7].
SPE = ||Yres||2 = ||�||2 (3)
When an anomaly occurs, the SPE exceeds the normalthresholds and the system detects the set of sensorscontaining the anomaly, by selecting the variables thatcontribute mostly to the large change of the SPE. Thismay be realized by selecting the virtual nodes in theresidual vector whose variation is significantly largerthan the corresponding one under normal conditions.
(C) Minimum Covariance Determinant
The MCD is a robust method in the sense that theestimates are not unduly influenced by outliers in thedata, even if there are many outliers. Due to the MCD’srobustness, we can detect outliers by their large robustdistances. The latter are defined like the usualMahalanobis distance, but based on the MCD locationestimate and scatter matrix (instead of the nonrobustsample mean and covariance matrix). The FASTMCDalgorithm [3] uses several time-saving techniqueswhich make it available as a routine tool to analyzedata sets with large n, and to detect deviatingsubstructures in them. An important feature of theFASTMCD algorithm is that it allows for exact fitsituations, i.e. when more than h observations lie on a(hyper) plane. Then the program still yields the MCDlocation and scatter matrix, the latter being singular,
Figure 3: Proposed Model
(B) Principal Component Analysis
PCA is a powerful tool for analyzing data and a usefulstatistical technique. The goal of PCA is to reduce thedimensionality of a data set in which there are a largenumber of interrelated variables, while retaining asmuch as possible of the variation present in the dataset [4], [5]. The extracted noncorrelated components(i.e., PCs) are estimated from the eigenvectors of thecovariance matrix of the original variables. One of themain tasks in PCA-based anomaly detectionapproaches is the choice of the number of PCs requiredto capture the percentage of variance desired. In ourcase, we need to determine the most suitable value ofthe number of the PCs required for the application ofthe subspace method. One of the most commoncriterions for choosing r is the cumulative percentageof total variation [4]. PCA based anomaly detection isas follows:
After having acquired the PCs and determined thenumber of PCs that will be retained, a normalizedsample vector can be decomposed into two portions,as follows:
A Supervised Technique to Ensure Data Reliability in Wireless Sensor Networks 5
as well as the equation of the hyper plane. The MCDobjective is to find h observations (out of n) whoseclassical covariance matrix has the lowest determinant.The MCD estimator of location is then the average ofthose h points and the MCD estimate of scatter istheir covariance matrix. The minimum (and default)h = (n + nvariables + 1)/2 so the algorithm is effectivewhen less than (n + nvar + 1) / 2 variables are outliers.The Fast MCD core idea is as follows:
1. The default h is [(n+p+1)/2)], but the user maychoose any integer h with [(n+p+1)/2)] � h � n.
2. If h = n then the MCD location estimate T is theaverage of the whole data set, and MCD scatterestimate S is its covariance matrix. Report theseand stop.
3. If p = 1 (univariate data) compute the MCDestimate (T, S) by the exact algorithm ofRousseeuw and Leory.
4. From here on, h < n and p � 2. If n is small thenRepeat (say) m times:
• Construct an initial h-subset H1 starting froma random (p + 1) subset.
• Carry out two C-steps [3].
For the 10 results with lowest det (S3):
• Carry out C-steps until convergence
Report the solution (T, S) with lowest det(S)
5. If n is larger then
Construct up to five disjoint random subsets of sizen
sub.
Inside each subset, repeat m/k times:
• Construct an initial subset H1 of size hsub
= [(h/n)]
• Carry out two C-Steps, using nsub
and hsub
• Keep the 10 best results (Tsub, Ssub)
Pool the subsets, yielding the merged set
In the merged set, repeat for each of the 50 solutions(T
sub, S
sub)
• Carry out two C-setps, using nmerged
and hmerged
= [nmerged
(h/n)]
• Keep the 10 best results (Tmerged
, Smerged
)
In the full data set, repeat for the best results
• Take several C-steps, using n and h
• Keep the best final result (Tfull
, Sfull
)
Thus MCD based PCA is a robust version ofmultivariate analysis.
V. PERFORMANCE EVALUATION
This section evaluates the performance of the proposedmechanism numerically by considering the DetectionRate (DR) and False Alarm Rate (FAR) as performancemetrics.
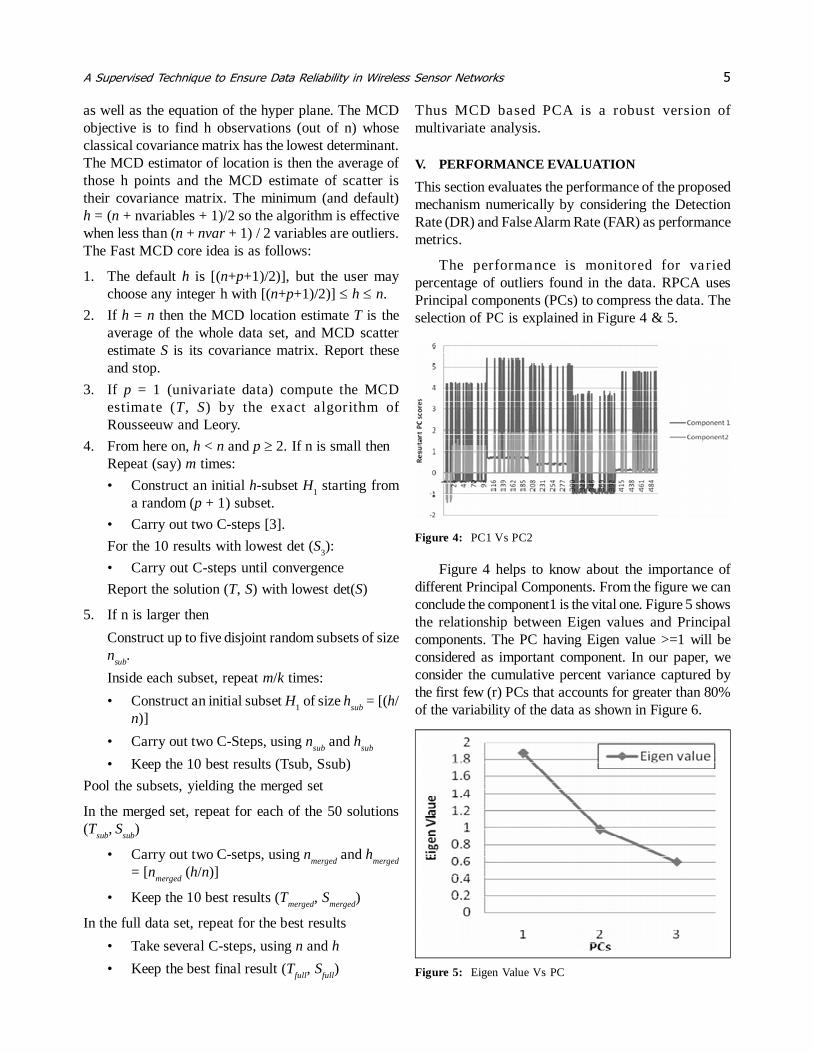
The performance is monitored for variedpercentage of outliers found in the data. RPCA usesPrincipal components (PCs) to compress the data. Theselection of PC is explained in Figure 4 & 5.
Figure 4: PC1 Vs PC2
Figure 4 helps to know about the importance ofdifferent Principal Components. From the figure we canconclude the component1 is the vital one. Figure 5 showsthe relationship between Eigen values and Principalcomponents. The PC having Eigen value >=1 will beconsidered as important component. In our paper, weconsider the cumulative percent variance captured bythe first few (r) PCs that accounts for greater than 80%of the variability of the data as shown in Figure 6.
Figure 5: Eigen Value Vs PC
6 N. Chitradevi, V. Palanisamy, K. Baskaran and D. Aswini
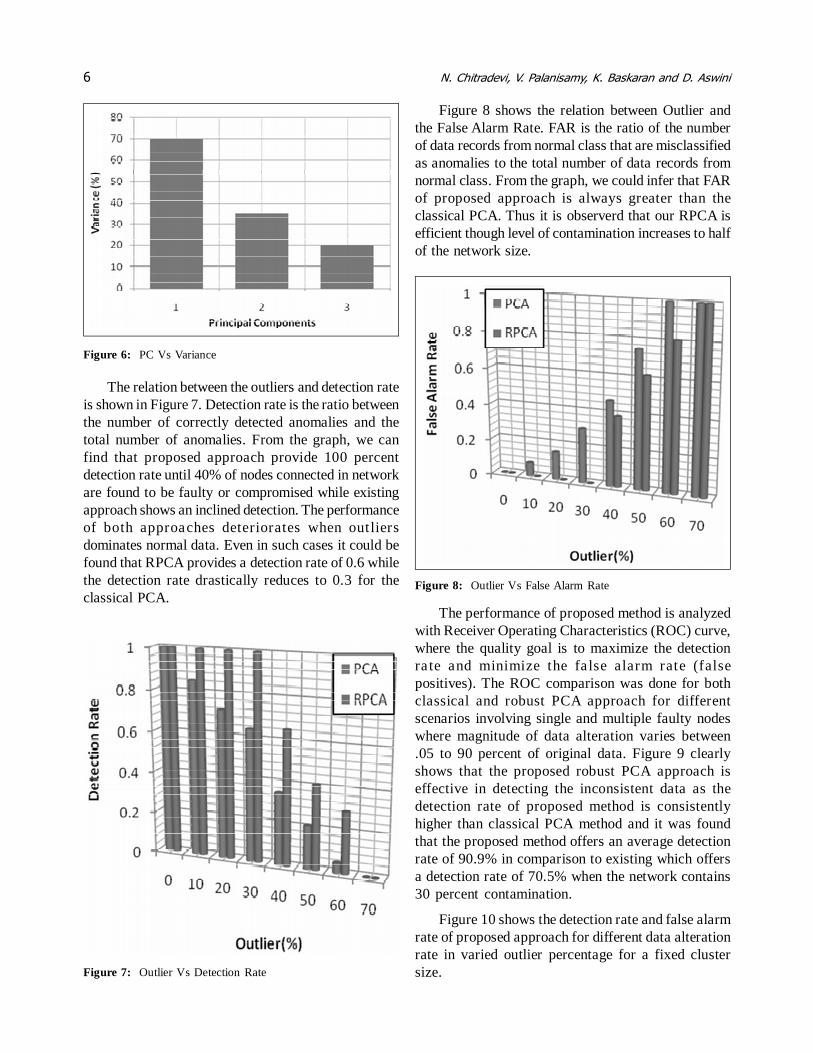
The relation between the outliers and detection rateis shown in Figure 7. Detection rate is the ratio betweenthe number of correctly detected anomalies and thetotal number of anomalies. From the graph, we canfind that proposed approach provide 100 percentdetection rate until 40% of nodes connected in networkare found to be faulty or compromised while existingapproach shows an inclined detection. The performanceof both approaches deteriorates when outliersdominates normal data. Even in such cases it could befound that RPCA provides a detection rate of 0.6 whilethe detection rate drastically reduces to 0.3 for theclassical PCA.
Figure 8 shows the relation between Outlier andthe False Alarm Rate. FAR is the ratio of the numberof data records from normal class that are misclassifiedas anomalies to the total number of data records fromnormal class. From the graph, we could infer that FARof proposed approach is always greater than theclassical PCA. Thus it is observerd that our RPCA isefficient though level of contamination increases to halfof the network size.
Figure 6: PC Vs Variance
Figure 7: Outlier Vs Detection Rate
Figure 8: Outlier Vs False Alarm Rate
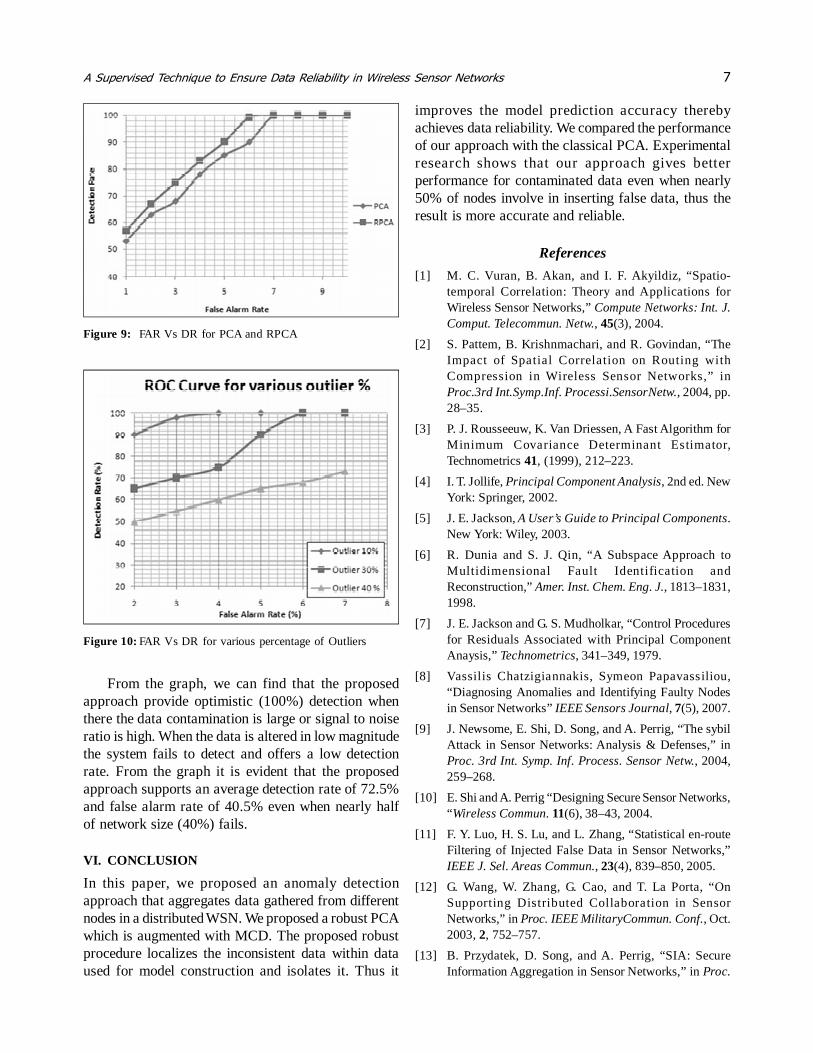
The performance of proposed method is analyzedwith Receiver Operating Characteristics (ROC) curve,where the quality goal is to maximize the detectionra te and minimize the fa lse alarm rate (falsepositives). The ROC comparison was done for bothclassical and robust PCA approach for differentscenarios involving single and multiple faulty nodeswhere magnitude of data alteration varies between.05 to 90 percent of original data. Figure 9 clearlyshows that the proposed robust PCA approach iseffective in detecting the inconsistent data as thedetection rate of proposed method is consistentlyhigher than classical PCA method and it was foundthat the proposed method offers an average detectionrate of 90.9% in comparison to existing which offersa detection rate of 70.5% when the network contains30 percent contamination.
Figure 10 shows the detection rate and false alarmrate of proposed approach for different data alterationrate in varied outlier percentage for a fixed clustersize.
A Supervised Technique to Ensure Data Reliability in Wireless Sensor Networks 7
From the graph, we can find that the proposedapproach provide optimistic (100%) detection whenthere the data contamination is large or signal to noiseratio is high. When the data is altered in low magnitudethe system fails to detect and offers a low detectionrate. From the graph it is evident that the proposedapproach supports an average detection rate of 72.5%and false alarm rate of 40.5% even when nearly halfof network size (40%) fails.
VI. CONCLUSION
In this paper, we proposed an anomaly detectionapproach that aggregates data gathered from differentnodes in a distributed WSN. We proposed a robust PCAwhich is augmented with MCD. The proposed robustprocedure localizes the inconsistent data within dataused for model construction and isolates it. Thus it
improves the model prediction accuracy therebyachieves data reliability. We compared the performanceof our approach with the classical PCA. Experimentalresearch shows that our approach gives betterperformance for contaminated data even when nearly50% of nodes involve in inserting false data, thus theresult is more accurate and reliable.
References
[1] M. C. Vuran, B. Akan, and I. F. Akyildiz, “Spatio-temporal Correlation: Theory and Applications forWireless Sensor Networks,” Compute Networks: Int. J.Comput. Telecommun. Netw., 45(3), 2004.
[2] S. Pattem, B. Krishnmachari, and R. Govindan, “TheImpact of Spatial Correlation on Routing withCompression in Wireless Sensor Networks,” inProc.3rd Int.Symp.Inf. Processi.SensorNetw., 2004, pp.28–35.
[3] P. J. Rousseeuw, K. Van Driessen, A Fast Algorithm forMinimum Covariance Determinant Estimator,Technometrics 41, (1999), 212–223.
[4] I. T. Jollife, Principal Component Analysis, 2nd ed. NewYork: Springer, 2002.
[5] J. E. Jackson, A User’s Guide to Principal Components.New York: Wiley, 2003.
[6] R. Dunia and S. J. Qin, “A Subspace Approach toMultidimensional Fault Identification andReconstruction,” Amer. Inst. Chem. Eng. J., 1813–1831,1998.
[7] J. E. Jackson and G. S. Mudholkar, “Control Proceduresfor Residuals Associated with Principal ComponentAnaysis,” Technometrics, 341–349, 1979.
[8] Vassilis Chatzigiannakis, Symeon Papavassiliou,“Diagnosing Anomalies and Identifying Faulty Nodesin Sensor Networks” IEEE Sensors Journal, 7(5), 2007.
[9] J. Newsome, E. Shi, D. Song, and A. Perrig, “The sybilAttack in Sensor Networks: Analysis & Defenses,” inProc. 3rd Int. Symp. Inf. Process. Sensor Netw., 2004,259–268.
[10] E. Shi and A. Perrig “Designing Secure Sensor Networks,“Wireless Commun. 11(6), 38–43, 2004.
[11] F. Y. Luo, H. S. Lu, and L. Zhang, “Statistical en-routeFiltering of Injected False Data in Sensor Networks,”IEEE J. Sel. Areas Commun., 23(4), 839–850, 2005.
[12] G. Wang, W. Zhang, G. Cao, and T. La Porta, “OnSupporting Distributed Collaboration in SensorNetworks,” in Proc. IEEE MilitaryCommun. Conf., Oct.2003, 2, 752–757.
[13] B. Przydatek, D. Song, and A. Perrig, “SIA: SecureInformation Aggregation in Sensor Networks,” in Proc.
Figure 9: FAR Vs DR for PCA and RPCA
Figure 10: FAR Vs DR for various percentage of Outliers

8 N. Chitradevi, V. Palanisamy, K. Baskaran and D. Aswini
1st Int. Conf. Embedded Networked Sensor Syst., 2003,255–265.
[14] S. Tanachaiwiwat and A. Helmy, “Correlation Analysisfor Alleviating Effects of Inserted Data in Wireless
Sensor Networks,” in Proc. Mobileand Ubiquitous Syst.:Networking Services, 2005, 97–108.
[15] T. Palpamas, “Distributed Deviation Detection in SensorNetworks,” in Proc. ACM SIGMOD, 2003, 32.