a summary of state tobacco control program evaluation
TRANSCRIPT

Evidence of Effectiveness A Summary of State Tobacco Control Program Evaluation Literature

Suggested Citation Kuiper NM, Nelson DE, Schooley M. Evidence of Effectiveness: A Summary of State Tobacco Control Program
Evaluation Literature. Atlanta: U.S. Department of Health and Human Services, Centers for Disease Control and Prevention, National Center for Chronic Disease Prevention and Health Promotion,
Office on Smoking and Health; May 2005.
Acknowledgments We would like to thank the following people for their assistance with reviewing, editing, and producing this document: Michelle Brown, Julie Doetsch, Monica Eischen, Matthew Farrelly, Gary Giovino, Philip Huang, Rick Hull, Brick Lancaster, Stephen Marcus, Sharon McAleer, Jeffrey McCarthy, Helen McClintock, Danny McGoldrick, James Padilla, Mike Placona, Deirdre Rogers, Todd Rogers, Diana Toomer, and Donna Vallone.
Publication support was provided by Palladian Partners, Inc., under Contract No. 200-980-0415 for the National Center for Chronic Disease Prevention and Health Promotion, Centers for Disease Control
and Prevention, U.S. Department of Health and Human Services.
To download a copy of this report, please visit our Web site at http://www.cdc.gov/tobacco/sustainingstates/index.htm
For further information, please contact Centers for Disease Control and Prevention
National Center for Chronic Disease Prevention and Health Promotion Office on Smoking and Health
4770 Buford Highway N.E., Mailstop K–50 Atlanta, GA 30341-3717
Telephone: 770/488-5705, Press 3 for a SpecialistInternet: http://www.cdc.gov/tobacco
E-mail: [email protected]

Evidence of Effectiveness A Summary of State Tobacco Control Program Evaluation Literature
May 2005
Nicole M. Kuiper, MPH David E. Nelson, PhD, MPH Michael Schooley, MPH
U.S. DEPARTMENT OF HEALTH AND HUMAN SERVICES
Centers for Disease Control and Prevention National Center for Chronic Disease Prevention and Health Promotion Office on Smoking and Health


Table of Contents�Abbreviations and Technical Terms . . . . . . . . . . . . . . . . . . . . . . . . . . . . . . . . . . . . v�
Introduction . . . . . . . . . . . . . . . . . . . . . . . . . . . . . . . . . . . . . . . . . . . . . . . . . . . . . . . . . . . . . . . . . . . . . . . . vii� Methods and Organization . . . . . . . . . . . . . . . . . . . . . . . . . . . . . . . . . . . . . . . . . . . . . . . . . . . . . . . . . . . . vii�
Availability and Use . . . . . . . . . . . . . . . . . . . . . . . . . . . . . . . . . . . . . . . . . . . . . . . . . . . . . . . . . . . . . . . . . vii� Evaluation Results Organized by Outcome Indicators . . . . . . . . . . . . . . . . . . . . . . . . . . . . . . . . . . . . . viii�
1. Recent Reviews. . . . . . . . . . . . . . . . . . . . . . . . . . . . . . . . . . . . . . . . . . . . . . . . . . . . . . . . . . . . . . . . . . . . . 1�
2. Major Evaluation Summaries. . . . . . . . . . . . . . . . . . . . . . . . . . . . . . . . . . . . . . . . . . . . . . . . . . . . . . . . . 3�
3. Tobacco-Related Mortality . . . . . . . . . . . . . . . . . . . . . . . . . . . . . . . . . . . . . . . . . . . . . . . . . . . . . . . . . . 17�Table 1A. Heart Disease Mortality . . . . . . . . . . . . . . . . . . . . . . . . . . . . . . . . . . . . . . . . . . . . . . . . . . . . . 17�Table 1B. Lung Cancer Mortality . . . . . . . . . . . . . . . . . . . . . . . . . . . . . . . . . . . . . . . . . . . . . . . . . . . . . . 18�
4. Prevalence of Tobacco Use. . . . . . . . . . . . . . . . . . . . . . . . . . . . . . . . . . . . . . . . . . . . . . . . . . . . . . . . . . . 19�Table 2A. Adult Smoking Prevalence . . . . . . . . . . . . . . . . . . . . . . . . . . . . . . . . . . . . . . . . . . . . . . . . . . . 19�Table 2B. Young Adult Smoking Prevalence/Initiation. . . . . . . . . . . . . . . . . . . . . . . . . . . . . . . . . . . . . . 22�Table 2C. Youth Smoking Prevalence/Initiation . . . . . . . . . . . . . . . . . . . . . . . . . . . . . . . . . . . . . . . . . . . 23�
5. Consumption of Tobacco Products . . . . . . . . . . . . . . . . . . . . . . . . . . . . . . . . . . . . . . . . . . . . . . . . . . . . 25�Table 3A. Total Consumption . . . . . . . . . . . . . . . . . . . . . . . . . . . . . . . . . . . . . . . . . . . . . . . . . . . . . . . . . 25�Table 3B. Per Capita Consumption . . . . . . . . . . . . . . . . . . . . . . . . . . . . . . . . . . . . . . . . . . . . . . . . . . . . 26�Table 3C. Average Daily Consumption. . . . . . . . . . . . . . . . . . . . . . . . . . . . . . . . . . . . . . . . . . . . . . . . . . 29�
6. Cessation of Tobacco Use. . . . . . . . . . . . . . . . . . . . . . . . . . . . . . . . . . . . . . . . . . . . . . . . . . . . . . . . . . . . 31�Table 4A. Quit Ratio . . . . . . . . . . . . . . . . . . . . . . . . . . . . . . . . . . . . . . . . . . . . . . . . . . . . . . . . . . . . . . . . 31�Table 4B. Other Cessation Measures . . . . . . . . . . . . . . . . . . . . . . . . . . . . . . . . . . . . . . . . . . . . . . . . . . . 32�
7. Smoke-Free Legislation and Policy�. . . . . . . . . . . . . . . . . . . . . . . . . . . . . . . . . . . . . . . . . . . . . . . . . . . 33�Table 5. Enactment and Enforcement of Smoke-Free Policies. . . . . . . . . . . . . . . . . . . . . . . . . . . . . . . . 33�
Reference List . . . . . . . . . . . . . . . . . . . . . . . . . . . . . . . . . . . . . . . . . . . . . . . . . . . . . . . . . . . . . . . . . . . . . . . 35�
iii


Abbreviations and Technical�Terms�95% Confidence Interval (CI) A computed interval with a 95% probability that the true value is contained within the interval. In this document, the first occasion of a 95% CI is stated as (95% CI = X, X) within a summary; the comparison group’s confidence interval thereafter is listed as (X, X).
Absolute Percentage Change The difference in actual percentage at two points in time. For example, a decrease in prevalence from 20% to 15% is an absolute decrease of 5 percentage points.
ADC Average daily consumption; the average number of cigarettes smoked per day by continuing smokers.
ANOVA Acronym for “analysis of variance,” a statistical test of the difference between three or more independent samples.
AOR Adjusted odds ratio (see OR); the association is adjusted for variables that have been indicated in the model.
ASSIST American Stop Smoking Intervention Study.
Attributable Risk The proportion of disease or other outcome in exposed individuals that can be attributed to the exposure of interest, calculated by subtracting the rate of the out-come (e.g., incidence, mortality) among the unexposed from the rate among the exposed individuals. Sometimes attributable risk is used to refer to the proportion of all cases that can be attributed to the exposure of interest; however, this is defined as the attributable fraction, and is calculated by dividing the attributable risk by the incidence rate in the group.
Beta coefficient; an indicator of the relative weight attached to the independent variable in contributing to the mean of the dependent variable in a standardized multivariate regression. The larger the absolute value of , the greater the impact of the independent variable on changes in the dependent variable.
BRFSS Behavioral Risk Factor Surveillance System; a population-based telephone survey of noninstitutionalized adults conducted at the state and large metropolitan area levels to assess health risks and protective behaviors. For more information, see http://www.cdc.gov/brfss.
CDC Centers for Disease Control and Prevention.
IOI Initial Outcomes Index; developed by Stillman et al. (2003) as a summary measure that assesses policy out-comes. The IOI includes (1) the percentage of workers covered by 100% smoke-free workplace laws, (2) the average cigarette price (including tax), and (3) a yearly rating of state and local smoke-free legislation.
OR Odds ratio; the probability of a certain outcome or dis-ease when a particular exposure is present. For example, the exposure-odds ratio is the odds of exposure among the cases compared with the odds of exposure among the controls.
OSH Office on Smoking and Health; the division that leads CDC’s tobacco use prevention and control efforts.
v

p p value; the probability that the observed difference could have occurred by chance if the groups were actu-ally similar. For example, a test statistic followed by “p < 0.05” means that there is less than a 5% chance that the observed difference is due to chance and sug-gests that the null hypothesis should be rejected (i.e., that the difference is genuine).
PCC Per capita consumption; the number of cigarette packs sold per adult in the population in a specified time frame. PCC can be measured as packs/person/month, packs/ person/year, or packs/year/year, which averages the annual rate per adult within a specified span of years.
Price Elasticity Price elasticity is the percentage change in demand resulting from a 1% change in consumer price. For example, a price elasticity of cigarette demand of –0.4 means that a 1% increase in price causes a 0.4% reduc-tion in demand.
QIT Question Inventory on Tobacco; an online searchable database that categorizes over 1,000 tobacco-related sur-vey questions. This resource can be found at http://apps.nccd.cdc.gov/QIT/index_clt.asp
Quit Ratio The proportion of ever smokers who have quit smok-ing, often expressed as a percentage. A quit ratio may be calculated by dividing the number of former smokers by the percentage of ever smokers (i.e., former plus current smokers).
Quit Success Rate The proportion of previous-year smokers who have recently quit; “recent” may be defined by the author.
r Represents the correlation coefficient, which is a mea-sure of association indicating the degree to which two
variables have a statistically linear relationship; r can range from –1 (perfect negative linear association) to +1 (perfect positive linear association).
Relative Change Measures the degree of change over time. For example, a decrease in prevalence from 20% to 15% is equal to a relative decline of 25% [(0.20 – 0.15)/0.20].
SE Standard Error; the standard deviation of an estimate, which is used to calculate the confidence interval.
SEER Surveillance, Epidemiology, and End Result, a program of the National Cancer Institute. The SEER program currently collects and publishes cancer incidence and survival data from 14 population-based and 3 supple-mental cancer registries covering approximately 26% of the U.S. population. For more information, see http:// seer.cancer.gov
SOTC Strength of Tobacco Control; an index developed by Stillman et al. (2003) to help determine the effective-ness of different components of ASSIST or ASSIST-like programs. The SOTC is a multielement measure that assesses the combined amount of three variables in each state: tobacco control resources (state budgetary ex-penditures and number of full-time tobacco personnel), capacity (health department infrastructure, staff experi-ence, interagency relationships, and number and cover-age of statewide coalitions), and program efforts focused on policy and environmental change.
TIPS Tobacco Information and Prevention Source; the Web site of the Office on Smoking and Health, http://www. cdc.gov/tobacco This Web site contains links to factsheets, publications, the Question Inventory on Tobacco (QIT), all of the Sustaining State Programs information and products, and much more.
vi

Introduction�How do we know that comprehensive state tobacco con-trol programs are effective in reducing tobacco use? As state programs lose funding, there is an urgent need to collect and update the evidence of their effectiveness.
The purpose of this literature summary is to present find-ings on the effectiveness of comprehensive state tobacco control programs. Several recent reviews have been pub-lished, including those by Siegel (2002) and the Institute of Medicine (2000). However, several major evaluation studies have been published since 2002, and many states have presented evaluation results in state reports or with independent evaluators. This summary is not a listing of all available evidence on state programs; rather, it is a focused selection of the most relevant, recent evidence, and it attempts to include states other than those cited most often.
Methods and Organization • �Section 1: Recent major review articles are first
summarized.
•�Section 2: From the reference lists of the review articles, the major evaluation studies are summarized. A Medline search of additional state evaluation studies was conducted to identify studies published since the most recent review article in 2002. In addition, select independent evaluation and state program reports were chosen to provide evidence for states that have not yet published results in peer-reviewed journals.
These individual study summaries are organized in alphabetical order. Section 2 contains the study refer-ence, the state and time period examined, an indica-tion as to whether the study was peer-reviewed, the outcome measures chosen by the evaluators, and the major findings. The Centers for Disease Control and Prevention’s (CDC) Office on Smoking and Health (OSH) maintains a collection of the hard copies of each study and will continue to collect and update this evidence on an annual basis.
• �Sections 3–7: These tables organize the results ac-cording to major outcome indicators used by evalua-tion studies. The major outcome indicators are mortality (Table 1), prevalence (Table 2), consumption (Table 3), cessation (Table 4), and smoke-free policies (Table 5). These tables are referred to as the “Navigational Guide” on the Web-based version of this report be-cause they contain links to each study summary.
•�Reference List: A full citation for each study is provided. Many citations include Web addresses if the report is available online.
Availability and Use These summaries can be used to provide evidence that comprehensive state tobacco control programs are effec-tive in reducing tobacco use and tobacco-related disease in the population. As more states begin to develop com-prehensive programs, the evidence base will grow. As some state programs mature, we can begin to assess long-term impacts. Additionally, as state programs experience budget cuts, it is important to evaluate the effects of eliminating or scaling back programs that were effective when they were funded at CDC-recommended levels.
This summary is also available on CDC’s Tobacco Information and Prevention Source (TIPS) Web site at http://www.cdc.gov/tobacco/sustainingstates/index.htm, both in downloadable format and as a navigational ver-sion with links from the outcome indicator tables to the individual study summaries. (Please note that the Web- site data may be organized differently from this report; however, the information is essentially the same.) In addition, other key publications like Data Highlights 2004, Sustaining State Funding for Tobacco Control— The Facts, and Research Synopsis of State Tobacco Control Programs provide working templates that can be tailored to any state. The Web site will also contain the annual updates to this summary, such as new evaluation studies or reviews that will be added in the future.
vii
Evaluation Results Organized by Outcome Indicators Sections 3–7 organize the major evaluation findings by outcome indicators. Tables 1–5 list the evidence from evaluation studies relating to each of five major evalua-tion outcome indicators: mortality (Table 1), prevalence (Table 2), consumption (Table 3), cessation (Table 4), and smoke-free policies (Table 5). Tables are organized by subcategory (if applicable), and within each sub-category, the most recent evidence is listed first. Other short-term or intermediate outcome indicators, such as awareness of media campaigns, public attitudes towards smoke-free policies, or health care provider behavior, are not included in outcome tables but are included in the individual study summaries (Section 2) when they were included in the evaluation.
Studies may be listed more than once in Tables 1–5 because they often present more than one type of out-
come evidence. For example, evaluators may have exam-ined both consumption data and prevalence rates in order to assess the effect of the tobacco control program in the state. Statistical testing is referenced when available (odds ratios, p values, etc.). The State column indicates which state program was evaluated, although some stud-ies examined the United States as a whole or specific groups of states. The time frame refers to the time period the evaluation examined, while the single year after the authors’ names refers to the year of publication of the article or the release of the report.
For more detailed information about a particular study, refer to the full summary (Section 2) or the original study (see the Reference List for the full citation). Within the tables, studies with an asterisk (*) are state or independent evaluation reports and are not published in peer-reviewed journals.
viii

Recent Reviews�The conclusions of recent major reviews of comprehensive state programs are summarized in Section 1. The major studies in these reviews were identified and subsequently used for Section 2. Elements of listed program components were taken from the review articles and do not necessarily indicate the full scope of the programs.
Siegel, 2002 States: California, Massachusetts, Arizona, Oregon, Florida
Program Components: Comprehensive state programs
Major Findings: Media campaigns are the most critical component of successful state programs, and suspending campaigns and limiting their aggressiveness have resulted in reversals of consumption trends. Intervening at the local level is critical to success, especially in passing smoke-free policies. Such policies are crucial to state programs because they protect the public from secondhand smoke, increase cessation, and reduce consumption. Campaigns that expose tobacco industry marketing techniques are demonstrably more effective in reducing initiation.
California
Program Components: Dedicated excise tax, media campaign, smoke-free policies
Major Findings: Proposition 99 (passed in 1988) resulted in a significant decline in consumption and prevalence among adults compared with the rest of the country; the media campaign in particular was effective in reducing consumption beyond the effect of the tax increase. When funding for the program and the media campaign was cut, however, declines in consumption also slowed. Proposition 99 also led to the proliferation of local smoke-free policies, with more than 75% of in-door workers reporting smoke-free work sites. Reduced heart disease mortality (33,000 lives saved) within 1–3 years of the program’s inception was shown.
Massachusetts
Program Components: Dedicated excise tax, media campaign, smoke-free policies
Major Findings: Question 1 (passed in 1992) was as-sociated with a significant reduction in consumption and adult prevalence. Evidence suggests that youth exposure to media campaigns may be linked with lower rates of progression to established smoking. Local smoke-free policies, including smoke-free restaurants, have prolifer-ated, and more than 75% of private sector indoor work-ers report smoke-free work sites.
Arizona
Program Components: Dedicated excise tax, limited media campaign for youth and pregnant women
Major Findings: Proposition 200 (passed in 1994) and resultant price increases resulted in reduced per capita consumption (PCC), but no rigorous studies on adult or youth prevalence have been completed. A comparison of adult and youth trends with national data suggests preva-lence may have decreased because of Arizona’s program. Proposition 200 appears to have accelerated the develop-ment of local smoke-free policies.
Oregon
Program Components: Dedicated excise tax resulting in comprehensive program
Major Findings: Measure 44 (passed in 1996) has been linked with a significant decrease in consumption, above
1

that expected from price elasticity† estimates, suggesting that components of the tobacco control program other than the tax increase are responsible. No published analyses have examined prevalence, but Behavioral Risk Factor Surveillance System (BRFSS) evidence suggests that prevalence might have declined as a result of the program. Preliminary evidence suggests that declines in youth prevalence may be due to varied implementation of programming, but further analysis is needed to verify that reductions are attributable to the program. In 1997 the first local smoke-free restaurant ordinances were established.
Florida
Program Components: Youth-focused “truth” �campaign�
Major Findings: The Medicaid Fraud suit (settled in �1997) resulted in funding for the “truth” media campaign �focused on youth. Within 2 years of program imple-�mentation, youth smoking prevalence dropped signifi-�cantly in middle school and high school youth, whereas �rates increased in other states. Studies have also linked �reported exposure to the truth campaign with decreased �initiation for up to 2 years and showed a dose-response �relationship between awareness and initiation risk. State�preemption laws have precluded local smoke-free poli-�cies.�
Institute of Medicine, 2000 States: California, Massachusetts, Oregon, Washington, �Florida, Arizona �
Program Components: Counteradvertising/education, �smoke-free environments, taxation, cessation, youth access�
Major Findings: Multifaceted programs reduce to-bacco use, and a dose-response effect exists between programming intensity and declines in consumption. Effects of counteradvertising depend on intensity and dose. Smoke-free work sites reduce illness and death from secondhand smoke, increase cessation, and reduce consumption among continuing smokers. Raising excise taxes decreases smoking prevalence and increases state revenue. Cessation programs are cost effective. To be effective, youth access restrictions require maximum retailer compliance.
Wakefield & Chaloupka, 2000 States: California, Massachusetts, Arizona, Oregon, Florida
Program Components: Comprehensive state programs
Major Findings: Critical to program success are the ex-tent of funding and the degree to which it is undermined by the tobacco industry and other funding competitors. Prices influence adolescent and adult tobacco use; the addition of tobacco control programs reduces consump-tion more than would be expected by price increases alone. Programs are associated with a decrease in adult prevalence (California, Massachusetts, Oregon; Arizona and Florida data not yet available). Because programs focus more on youth, the effects on adult prevalence are not yet known. Early evidence shows that programs can reduce youth smoking. Although youth prevalence rose across the rest of the United States in 1993–1996 (29% increase in grade 8 and 23% in grade 10), the compa-rable rates in California were less (16% and 6%, respec-tively). Massachusetts reported a similar experience; Florida reported greater relative declines than national trends in 30-day prevalence for middle and high school students in February 1998–1999.
† Price elasticity is the percentage change in demand resulting from a 1% change in consumer price. For example, a price elasticity of cigarette demand of –0.4 means that a 1% increase in price causes a 0.4% reduction in demand.
2

Major Evaluation SummariesSection 2 summarizes the major evaluation studies that were included in the review articles, published since the review articles, or are unpublished state or independent evaluation reports. Studies are ordered alphabet-ically by citation (authors and year published or released). After the study citation, the state and time frame of the evaluation are listed, followed by an indication as to whether the study was published in a peer-reviewed journal. For more complete information and additional statistical details, see the outcome indica-tor tables (Tables 1–5) or the specific articles (see the Reference List).
Abt Associates, Inc., 2000 Massachusetts, 1994–2000
Peer Review: No
Evaluation Outcome Indicators: Per capita consumption (PCC), adult, youth, and pregnant women prevalence, smoke-free environments, attitudes, cessation
Major Findings: PCC decreased by 36% compared with 16% in other states (minus California). Adult prevalence decreased from 22.6% to 17.9%, which was a greater decrease than in other states (minus California), even after accounting for demographic changes. Most of this decrease was attributed to males, who decreased con-sumption 1.6% annually from 25.1% in 1990 to 19.6% in 1999 (p = 0.02) compared with a 0.8% annual increase nationally among men (p = 0.02 for comparison). Smok-ing by pregnant women fell from 25% to 11%, the largest decrease in the United States. Youth prevalence decreased from 36% to 30% in 1995–1999 while remaining stable nationwide. Smokeless tobacco use by high school males decreased 50% from 17% in 1993 to 8% in 1999. Exposure to secondhand smoke fell at work from 44% to 29%, at home from 28% to 18%, and at restaurants from 64% to 39%. Retailer compliance with youth access restrictions increased sharply from 53% to 90%. Public support for smoking bans increased as well as knowledge of the harms of secondhand smoke; both nonsmokers (96.0%) and smokers (91.2%) believe that secondhand smoke can harm children. State and local laws, new taxes, and advertising restrictions have followed program implementation. The quit success rate increased from 17% in 1993 to 25% in 1997–1999, showing that smok-
ers who attempted to quit were more likely to succeed with the comprehensive program in place.
Arizona Department of Health Services, 2003 Arizona, 1997–2000
Peer Review: No
Evaluation Outcome Indicators: Youth prevalence
Major Findings: High school youth smoking rates in Arizona declined 21% from 31.3% in 1997 to 24.6% in 2000. Nationally, the high school smoking rate in 2000 was 34.5%, but these rates are not comparable because an insufficient number of Arizona high schools was surveyed. Among middle school students, smoking rates declined 39%, from 18.7% in 1997 to 11.4% in 2000, compared with 15.1% nationally in 2000.
Bartosch & Pope, 2002 Massachusetts, 1999
Peer Review: Yes
Evaluation Outcome Indicators: Local tobacco control policy
Major Findings: When multiple indicators of communi-ties were considered (social and political demographics), state-level funding to local programs was strongly and sig-nificantly associated with the enactment of local tobacco control policies. City size was also associated such that very small towns were less likely to have the capacity to help enact policies. No other city characteristics were significantly associated with enactment of local policies.
3

Bauer et al., 2000 Florida, 1998–2000
Peer Review: Yes
Evaluation Outcome Indicators: Youth prevalence, intentions, and behaviors
Major Findings: Changes in cigarette use prevalence in the 1998, 1999, and 2000 surveys were examined among middle school students (MSS) and high school students (HSS). Current use significantly declined 40% in MSS (18.5% to 11.1%; p < 0.001) and 18% in HSS (27.4% to 22.6%; p = 0.01). Frequent use decreased significantly from 5.4% to 2.9% ( p < 0.001) among MSS and 13.5% to 10.4% ( p < 0.001) in HSS. Never users increased sig-nificantly from 56.4% to 69.3% ( p < 0.001) in MSS and from 31.9% to 43.1% ( p = 0.001) among HSS. Experi-menters decreased from 21.4% to 16.2% ( p < 0.001) in MSS and 32.8% to 28.2% ( p < 0.001) in HSS. Current use decreases were significant in all subgroups except non-Hispanic black HSS, who had the lowest current smoking prevalence of any group. Among never users, those reporting a commitment to not smoke increased significantly from 67.4% to 76.9% ( p < 0.001) among MSS and 73.7% to 79.3% ( p < 0.001) in HSS; increases were seen for all subgroups except for non-Hispanic white HSS. Among experimenters, those reporting their intention to not smoke again increased significantly from 30.4% to 42% ( p < 0.001) in MSS and 44.4% to 51% ( p < 0.001) in HSS from 1998 to 2000.
Biener et al., 2000 Massachusetts, 1993–1999
Peer Review: Yes
Evaluation Outcome Indicators: Per capita consump-tion (PCC), adult prevalence
Major Findings: PCC declines were similar in Massa-chusetts (15%) and the United States (minus Massachu-setts and California; 14%) from 1988 to 1992, an annual rate of decline of around 3%–4%. In 1993 (program implementation), PCC continued to decline in the rest of the country (minus California) at 4% but dropped 12% in Massachusetts in response to the tax increase. Because of the national tobacco industry price decreases in 1993, the national PCC decline slowed to 1% annu-ally until 1997 (last year national data were available),
whereas the Massachusetts decline remained at 4% annually until 1999. Similarly, the adult prevalence rate slope for 1992–1999 for comparison states (40 states that participate in the Behavioral Risk Factor Surveillance System [BRFSS]) was 0.03% (95% CI† = –0.06% to 0.12%) per year, not statistically different from zero. The rate in Massachusetts was –0.43% (–0.66% to –0.21%) per year, a significant decline compared with the rest of the United States ( p < 0.001).
California Department of Health Services, 2000 California, 1989–1999
Peer Review: No
Evaluation Outcome Indicators: Per capita consump-tion (PCC), youth prevalence, costs, cost savings
Major Findings: There were 1 million fewer smok-ers than would have been expected before Proposition 99 (using BRFSS trend data from 1984–1998). PCC has fallen by more than 50% since Proposition 99 was passed (in 1988), reaching a low of 61.3 packs/adult in 1998–1999 versus the U.S. PCC rate of 106.8 packs/ adult in 1999. Taking into account direct medical costs alone, the California Tobacco Control Program saved an estimated $3.01 billion, or $3.62 for every dollar spent on the program. An additional $5.4 billion was saved in indirect costs. Youth prevalence declined 43% from 12.1% in 1995 to 6.9% in 1999. Much of this decrease was likely due to the 40% increase in cigarette price that occurred in California in 1999; prevalence decreased 35.5% in 1998–1999 alone. California data show that in 1996–1999, the 30-day prevalence rate decreased 45% in California and 15% in the rest of the United States in grade 8. Similarly, prevalence in grade 12 declined 13% in California compared with 5% in the rest of the United States in 1997–1999.
CDC, 2001 Arizona, 1996–1999
Peer Review: Yes
Evaluation Outcome Indicators: Adult prevalence, health care provider behavior
Major Findings: After implementing the 1994 tax increase, a comprehensive program was established in † 95% CI = 95% confidence interval.
4

1995. Smoking prevalence dropped significantly from 23.1% in 1996 to 18.3% in 1999. Rates declined among men (25.3% to 19.7%), women (21.3% to 16.9%), whites (23.4% to 19.1%), and Hispanics (21.9% to 13.7%). The greatest decline among income groups was for those mak-ing less than $10,000/year (31.2% to 22.8%). Increases occurred in the proportion of smokers reporting health professionals asking about tobacco (30.9% to 43.7%) and asking about tobacco plus advising them to quit (25.7% to 36.7%). Increases also occurred in the proportion of smokers reporting dentists asking about and advising against tobacco use (9.9% to 24.9%). Cross-sectional studies cannot link outcomes to a program nor differen-tiate between the tax and price increases and program components.
CDC, 2000 California, 1988–1997
Peer Review: Yes
Evaluation Outcome Indicators: Mortality (lung cancer)
Major Findings: Surveillance, Epidemiology, and End Results (SEER) data from 5 states and 3 metropolitan sites (representing 9.5% of the U.S. population, exclud-ing California) were compared with the California cancer registry and California SEER data for lung and bronchus cancers. During 1988–1997, age-adjusted lung can-cer rates in California declined significantly compared with stable incidence rates for SEER data sites. During 1991–1997, California lung cancer rates declined from 68 per 100,000 to 60.1, for an estimated annual percentage change (EAPC) of –1.9% per year ( p < 0.01) from 1988 to 1997. In contrast, the non-California SEER rate decline was not significantly different from zero (–0.4%). Overall, California incidence rates decreased 14% from 1988 to 1997, whereas non-California SEER rates declined 2.7%. For men, the decline in California (EAPC = –2.9%; p < 0.01) was 1.5 times greater than for the decline in SEER regions (EAPC = –1.8%; p < 0.01) in 1988–1997. For women, rates declined 4.8% (EAPC = –0.6; p < 0.01) in California but increased 13.2% in non-California SEER regions (EAPC = 1.5; p < 0.01) in 1988–1997.
CDC, 1999 Oregon, 1993–1998
Peer Review: Yes
Evaluation Outcome Indicators: Per capita consump-tion (PCC)
Major Findings: Cigarette sales data in Oregon and the United States (minus Arizona, California, and Mas-sachusetts) were compared 1 year before and 2 years after implementation of an Oregon state program. In 1993–1996, PCC increased 2.2% in Oregon and de-creased 0.6% in the United States. In 1996–1998, PCC in Oregon decreased 11.6% (from 92 to 82 packs) despite a 2.6% increase in the state population. In the United States in 1996–1997, PCC decreased 1% (from 93 to 92 packs). Using a price elasticity of –0.4%, a price increase of 15.8% (as was the Oregon tax increase of $.30 to $.68) can be expected to reduce PCC by 6.3%. Because the decline in Oregon was 11.6%, it is likely that implementing the comprehensive state program resulted in reduced PCC above the tax effect.
CDC, 1996 Massachusetts, 1990–1996
Peer Review: Yes
Evaluation Outcome Indicators: Per capita consump-tion (PCC)
Major Findings: After a tax increase in Massachusetts, PCC decreased 19.7% in Massachusetts and 6.1% in the United States (minus California) in 1992–1996. After tobacco industry-wide price decreases in 1993 that brought real prices back to pretax increase levels, PCC continued to decrease in Massachusetts while remain-ing constant in the United States (minus California). This reduction cannot be accounted for by cross-border purchasing. Thus, the media campaign is likely to be re-sponsible for the decreased PCC because price estimates alone would suggest increasing consumption. This study suggests that a media campaign can be more effective in reducing PCC than a tax increase alone.
5

Chen et al., 2003 California, 1990–1999
Peer Review: Yes
Evaluation Outcome Indicators: Youth prevalence
Major Findings: Modeling that estimates the effects of age, time period, and the cohort on youth smoking trends in California from 1990 to 1999 was used to estimate change in never smoking among California youth ages 12–17 years. For cohorts born in 1978 and after (i.e., were 12 years or younger when the California program began), there was an increase in the proportion of never smokers. During the decade, the proportion of never smokers increased for both boys (60% in 1990 to 69% in 1999) and girls (66% in 1990 to 70% in 1991). As all cohorts aged, the estimated effect of the program declined as smoking initiation increased with age. The authors conclude that the California program may have prevented the onset of smoking in youth for those born after 1978.
Elder et al., 1996 California, 1980–1994
Peer Review: Yes
Evaluation Outcome Indicators: Per capita consump-tion (PCC)
Major Findings: The average quarterly decline in PCC was 3.6% in California and 2.4% in the rest of the United States in 1980–1988 and 7.9% in California and 3.2% in the rest of the country in 1989–1994. This reduction occurred despite declining major brand sales in favor of generics and demographic shifts that would predict greater smoking in California.
Farrelly et al., 2003 United States, 1981–2000
Peer Review: Yes
Evaluation Outcome Indicators: Total consumption
Major Findings: Data on state aggregate cigarette sales, state and federal excise taxes, and state-level expenditures on tobacco control programs were used; potential confounders were addressed by trend analyses taking into account changes in excise taxes, cross-
border cigarette sales, and other state-specific factors such as unemployment and disposable income. Well-funded long-term state programs reduce tobacco use, and cumulative expenditures continue to affect cigarette consumption. Consistently well-funded programs show more dramatic declines over time than what would be expected from analysis of current or past program fund-ing. One key simulation finding was that if states had funded at the CDC-recommended level of $6 per capita, consumption nationally would have declined by as much as an additional 9% by 2000, thereby doubling the exist-ing rate of decline in sales.
Farrelly et al., 1999 United States, 1992–1993
Peer Review: Yes
Evaluation Outcome Indicators: Prevalence, average daily consumption (ADC)
Major Findings: In a nationally representative cross-sectional sample of indoor workers with extensive de-mographic control variables, comprehensive workplace smoking bans (common and work areas) were associated with a 5.7% reduction in smoking prevalence and re-duced daily consumption among remaining smokers by 2.7 cigarettes when compared with no smoking restric-tions. Having work-area bans but allowing smoking in common areas reduced these effects by half. A partial smoking restriction in these areas was not associated with reductions in prevalence but with a 0.5 reduction in daily consumption. Comparisons of complete smok-ing bans with no smoking bans showed larger declines in ADC (–3.4 cigarettes) for older workers (ages 40–65; highest ADC) than for younger workers (–1.72 ciga-rettes for ages 18–24; lowest ADC), with ages 25–39 in between. Declines in prevalence were not as systematic among age groups: 7.8% for ages 18–24, 4.5% for ages 25–39, and 6.2% for ages 40–65 years. Workers with less education than a high school diploma had the largest decline in ADC (–3.9 cigarettes); the decline in ADC for college graduates was –1.7 cigarettes. In industry groups, groups with highest prevalence (wholesale and retail trade) benefitted most from the smoking ban: a 30.5% prevalence decreased to 22.6% (25.9% decline). Apply-ing workplace bans to all work sites would result in an additional 2.6 percentage points (10% decline) and a 7% decline in ADC among continuing smokers.
6

Fichtenberg & Glantz, 2002 United States, varies (review article)�
Peer Review: Yes�
Evaluation Outcome Indicators: Per capita consump-�tion (PCC), adult prevalence
Major Findings: Smoke-free work sites are associated with reduced smoking prevalence by 3.8% and reduced consumption among continuing smokers of 3.1 fewer cigarettes per day. Enacting policies in all U.S. work-places that do not yet have them would result in a 4.5% decrease in PCC, the equivalent of raising excise taxes from $0.76 to $1.11.
Fichtenberg & Glantz, 2000 California, 1980–1998
Peer Review: Yes
Evaluation Outcome Indicators: Mortality (heart disease)
Major Findings: Before 1989, the age-adjusted heart disease mortality rate in California was about two-thirds that of the United States. The introduction of the California Tobacco Control Program was associated with a significantly greater annual rate of decline (by 2.93 deaths/year/100,000). After program funding was reduced in 1992, the rate of decline slowed (by 1.71 deaths/year/100,000) but was still significantly greater than that of the United States The program was thus associated with 33,000 fewer deaths in 1989–1997 (a total of 611,500 deaths during this period); the campaign cutback in 1992 was associated with 8,300 excess deaths in 1993–1997. Changes in mortality mirrored changes in PCC: before 1989, PCC declined slightly faster than in the United States; after 1989, PCC accelerated to –2.72 packs/year. After 1992 the decline was significantly reduced by +2.05 packs per year ( p < 0.04), compared with the period from 1989–1991.
Gallup Organization, Inc., 2003 Maine, 1994–2001
Peer Review: No
Evaluation Outcome Indicators: Per capita consump-tion (PCC), adult and youth prevalence
Major Findings: Since the start of the Partnership for a Tobacco-Free Maine (PTM) and an increase in tobacco tax from $0.34 to $0.74 in 1997, the PCC decline has more than tripled its previous rate of decline; however, it remains above other states with aggressive state tobacco control campaigns. PCC declined 19% from 132.8 packs/year in 1997 to 107 packs/year in 2000. Adult prevalence remained consistently higher than the national average for most of the 1990s. The big-gest drop in adult prevalence occurred in 1996–1997, and the decrease continued until 1998. For high school students, last 30-day prevalence increased from 1993 to 1997 but decreased from 39.2% to 38% in 1997 and to 24.8% in 2001. Media coverage of PTM has signifi-cantly increased since it began. The establishment of public smoke-free places has increased. Tobacco sales to minors decreased from 44% in 1994–1995 to 7% in 2000–2001 according to Synar data.
Gilpin et al., 2001 California, 1990–1999
Peer Review: No
Evaluation Outcome Indicators: Per capita consump-tion (PCC), adult and youth prevalence, smoke-free policies, cessation
Major Findings: PCC was reduced by 57%, compared with 27% in the rest of the country (partially because of an 18.6% decline in daily smoking among continuing smokers). More than 60% of smokers smoke less than 15 cigarettes/ day, and more than 20% of current smokers are nondaily smokers. Adult prevalence decreased to 17.5% but has remained stable since 1994. Proportions of smokers attempting to quit increased from 49% to 60%. Despite an increase in youth 30-day prevalence in 1993–1996, the 1999 rate of 7.7% was significantly lower than the 1990 rates. Youth committed to never smoking rose from 17.7% in 1996 to 65.7% in 1999. Perceived ease of buying a pack of cigarettes decreased significantly from 52% to 27%. Percentage of indoor workers reporting smoke-free policies increased from 35% to 93%. How-ever, since 1996, nonsmokers reporting recent exposure to secondhand smoke in their work area increased from 12% to 16%. The percentage of California residents liv-ing in smoke-free homes was 73%, up 30% from 1993, including 88.6% of children and 47% of smokers.
7

Glantz, 1993 California, 1981–1992
Peer Review: Yes
Evaluation Outcome Indicators: Per capita consump-tion (PCC), total consumption
Major Findings: The rate of decline in total consump-tion (2% per year during 1981–1988) more than tripled in 1989–1991 after Proposition 99. In 1992 the decline decelerated after the media campaign was suspended and fell more slowly than it did before the campaign. PCC was decreasing at –4 packs/year before the cam-paign and doubled to –8 packs/year. In 1992 the decline slowed to –1.42 packs/year; this decline in PCC was not statistically different from the decline in the national rate as of 1993.
Harris, 1999 Massachusetts, 1990–1996
Peer Review: No
Evaluation Outcome Indicators: Pregnant women prevalence, cost savings
Major Findings: In 1990, the rate of reported smok-ing during pregnancy according to birth certificate data in Massachusetts was about 7 percentage points higher than the national rate (of those states that collect smoking data on birth certificates). The Massachusetts state program significantly decreased the rate of reported smoking during pregnancy in Massachusetts by 47.8% compared with 26.1% in the United States. The de-crease in Massachusetts occurred during 1990–1996, but the largest 1-year drop was from 23.3% in 1992 to 16.5% in 1993, coinciding with the implementation of Question 1. By 1995, the Massachusetts rate was lower than the U.S. rate, and by 1996, it further declined to 13.2%. Because of a 3% decline in prevalence in current smoking, an estimated 140,000 fewer adults smoked in 1998. With established attributable risk calculations, an estimated $85 million is saved annually in public and private expenditures (by attributing 2% of the decline in prevalence to the campaign). In the author’s view, these estimates are conservative and the effect of the campaign may well be greater.
Hu et al., 1995a California, 1989–1991
Peer Review: Yes
Evaluation Outcome Indicators: Total consumption, cigarette prices
Major Findings: Econometric models based on addictive substances showed that Proposition 99 reduced con-sumption 8%–9% in the short run and 10%–13% in the long run. Authors pointed out that a 25¢ tax increase resulted in retail prices 21.2% higher than before the tax increase because of increased tobacco industry prices during 1988–1990.
Hu et al., 1995b California, 1990–1992
Peer Review: Yes
Evaluation Outcome Indicators: Per capita consump-tion (PCC)
Major Findings: Both the tax increase and the media campaign affected the decline in consumption in California. The price elasticity due to the tax increase was –0.30 and for the media campaign was –0.05 for 1989–1992. For the 30 months from the 3rd quarter 1990 through 4th quarter 1992, sales dropped by 35 packs/adult (> 15 years), with 79% of the reduction attributable to the price increase and 21% to the media campaign. Each reduced consumption in different ways: the tax provided economic disincentive, and the media education was directed at reducing demand.
Hu et al., 1994 California, 1984–1991
Peer Review: Yes
Evaluation Outcome Indicators: Per capita consump-tion (PCC)
Major Findings: One month after the implementation of Proposition 99, PCC decreased by 25.7%, or 2 packs/ adult, part of this decrease being attributed to an over-stocking phenomenon, when sales in the month preced-ing the tax increase were 10% higher than expected. This effect rapidly diminished and after 3 years remained at a
8
9.5% reduction rate. Also found was a significant impact of the 4¢ federal tax increase in 1991 (–0.28 packs/ adult), which was accounted for in the above analyses.
Jemal et al., 2003 United States (33 states), 1990–1999
Peer Review: Yes
Evaluation Outcome Indicators: Mortality (lung cancer)
Major Findings: Rates of lung and bronchus cancers in young adults (ages 30–39) from 1990–1994 (r = –0.54; p = 0.0013) and 1995–1999 (r = –0.80; p = 0.0001) were highly inversely correlated with an index of tobacco con-trol in the state. The index contains data on cigarette price and workplace and home smoking policies in 1992– 1993. States were ranked; negative values are below the median and positive values are above the median. Ex-cluding outliers (Kentucky, California, and Washington) had little effect on results. Notably, the correlation of index with lung cancer rates became substantially stron-ger in 1995–1999 than in 1990–1994. The index was also moderately correlated (r = –0.56; p = 0.0008) with percentage change in the death rate during the 1990s (as more states implemented programs). The index was highly inversely correlated with smoking prevalence for ages 30–39 years (r = –0.81; p < 0.0001) and highly positively correlated with percentage of former smokers ages 30–39 who had quit (r = 0.82; p < 0.0001).
Manley et al., 1997 United States, 1989–1996
Peer Review: Yes
Evaluation Outcome Indicators: Per capita consump-tion (PCC), tax policies, real prices of cigarettes
Major Findings: Early evaluation of the American Stop Smoking Intervention Study (ASSIST) showed PCC in ASSIST states (versus control states minus California) began to diverge significantly in 1994, and by 1996 achieved a 7% reduction. Both groups had a drop in real price in 1992–1993, but by 1994, prices in intervention states returned to 1992 levels, whereas prices were lower than 1992 levels in the control states (12.6¢ difference). Although no control state experienced a price increase
in 1992–1994, 55% still showed a decrease in PCC. Of 14 intervention states with a price decrease, 11 (76%) showed a decrease in PCC. The three intervention states that had price increases experienced decreases in PCC as predicted, and the three remaining control states had no significant decline in PCC. Process evaluation showed that only 40% of ASSIST states were able to increase taxes in 1993–1994, whereas one-third of the control states raised taxes during that time. The slope of the re-gression for effect of real price on PCC for intervention states shows a diminished effect of price, suggesting that elasticity of demand may be different when the program is in place.
McMillen & Baldwin, 2003 Mississippi, 1998–2002
Peer Review: No
Evaluation Outcome Indicators: Youth prevalence, knowledge, and attitudes
Major Findings: From 1999 to 2002, current (past 30 days) smoking in public middle school students (MSS) declined from 23% to 11.9% while declining among public high school students (HSS) from 32.5% to 23.1%. In both groups, the declines from 2000 to 2002 were statistically significant. Overall, since program imple-mentation, current smoking declined 42% in MSS and 24% in HSS. Although male HSS showed a significant decline from 33.9% in 1998 to 25.1% in 2002, the female HSS decline from 27.1% in 1998 to 21.1% in 2002 was not statistically significant. Similarly, frequent smoking (> 20 of last 30 days) declined significantly for male HSS from 17.3% to 10.4%, whereas the female HSS decline of 11.6% to 7.8% was not significant. Ever-smoking rates for male (78.7% to 64%) and female (72.6% to 59.3%) HSS declined significantly from 1998 to 2002. For MSS, current-smoking rates declined significantly for both males (23% to 12.1%) and females (18.2% to 11.5%) from 1998 to 2002. Frequent smok-ing in MSS declined significantly for males (6.8% to 3.2%) but not for females (3.6% to 2.2%). Ever smoking declined significantly for male and female MSS. Ever-smoking rates for grades 8–12 declined significantly from 1998 to 2002.
9

McMillen et al., 2003 Mississippi, 2000–2002
Peer Review: No
Evaluation Outcome Indicators: Adult knowledge, attitudes
Major Findings: Many attitudes regarding tobacco use and smoke-free environments showed significant improvement among adults. Universal beliefs (> 85%) were that children should not smoke, adults should not smoke around children, and parents’ secondhand smoke harms children. Significant improvement was made from 67.6% in 2000 to 80.8% in 2002 in the belief that schools should prohibit clothing or goods with tobacco logos. Support for tobacco regulation as a drug increased significantly from 67.9% in 2000 to 73.2% in 2002, compared with 63.7% and 66% for the United States. Those reporting a smoking ban at all work areas rose significantly from 53.2% in 2000 to 64.7% in 2002, compared with 65.7% and 65% for the United States. Adults reporting strictly enforced tobacco policy at the workplace increased from 72.3% in 2000 to 85.4% in 2002, compared with U.S. rates of 78% and 80.7%. Less than 20% reported employers offering a cessation program in the last 12 months in all years. Although 85% of Mississippi adults believe that smoking ciga-rettes is very dangerous, 76.9% believe that cigars, 75.3% believe that snuff, and 72.5% believe that chewing tobacco is very dangerous. None of these rates changed significantly from 2000 to 2002. In the United States, these same beliefs increased in the same time period to rates comparable with that of Mississippi. State respondents were less likely than U.S. respondents to report smoke-free restaurants, bars/taverns, convenience stores, indoor shopping malls, or outdoor parks but were similarly likely to report believing that these should be smoke-free venues.
Meshack et al., 2003 Texas, 2000–2002
Peer Review: No
Evaluation Outcome Indicators: Adult awareness and use of cessation services, adult prevalence
Major Findings: The effects of the Texas Tobacco Prevention Pilot Initiative (TTPPI), which randomly assigned interventions to regions to assess effectiveness,
are summarized. Regions 5 and 6 received intensive pilot activities, and adults reported more awareness (23.1% vs. 13.8%) and use (2.7% vs. 1.2%) of telephone counseling services and higher rates of cessation (11% vs. 9.5%). Cessation differences were due mainly to differences among women. No significant differences in prevalence occurred among the regions in 1999, but at the end of the initiative, declines in pilot areas were twice as large as declines in nonpilot areas (5.1% vs. 2.5% absolute percent reduction, 21% vs. 11% relative reduction). Estimates are that there were about 90,000 fewer smokers than if TTPPI had not been implemented. An experimental evaluation of the telephone counsel-ing service provided by the American Cancer Society compared 1,014 callers (of total 12,500) who randomly received booklets and the new telephone counseling service with those who received self-help booklets. Re-ceipt of telephone counseling led to significantly higher 1-year cessation rates (20.7% vs. 13.2%), not taking into account loss to follow-up. Conservatively assuming that those lost to follow-up were still smoking halves success rates, but rates are still significantly different. Effects among young adults (18–25 years) were also assessed; 1-year follow-up cessation rates were 36% for counsel-ing and booklets versus 11% for booklets only.
Norman et al., 2000 California, 1998
Peer Review: Yes
Evaluation Outcome Indicators: Smoke-free policies (in homes), average daily consumption
Major Findings: This cross-sectional survey assessed smokers’ exposure to California state tobacco control messages as well as behaviors. Smokers with a home indoor smoking ban were twice as likely (adjusted odds ratio [AOR] = 2.27; 95% CI = 1.23, 4.21) to have heard of community programs to encourage home and car re-strictions and were almost 3 times as likely to have seen and talked about a secondhand smoke TV ad (AOR = 2.87; 95% CI = 1.11, 7.41), after adjustment for demo-graphic factors. Just seeing the “Baby Blocks” ad alone was not associated with smoking restrictions or a ban; 6% of smokers saw and talked about the ad; of those, 53.8% had a total home smoking ban, compared with 40.1% of smokers who did not recall seeing the ad. In multivariate models controlling for demographics and
10

2003
attitude toward secondhand smoke, having a full smok-ing ban was significantly associated with average cigarettes smoked per day ( p < 0.01) and desire to quit smoking (odds ratio [OR] = 2.16; 95% CI = 1.26, 3.7).
Oregon Department of Human Services,
Oregon, 1996–2003
Peer Review: No
Evaluation Outcome Indicators: Per capita consump-tion (PCC); adult, youth, and pregnant women preva-lence; smoke-free environments
Major Findings: PCC decreased by 30%, more than that of other U.S. states (minus Arizona, California, Massachusetts, Oregon). Adult smoking prevalence decreased 13% from 23.4% to 20.4%, compared with an 8% decrease in the United States. Smoking by pregnant women fell 28% and saved an estimated $1.3 million in caring for low-birth-weight infants. Smokeless tobacco use declined 48% among men, from 9.4% to 4.9%. Youth smoking prevalence declined 47% for grade 8 and 26% for grade 11, the latter of which is lower than the U.S. rate. Smokeless tobacco use among teens also declined; use dropped 45%, from 22.7% to 12.5%. More than 95% of work sites are now covered by smoke-free law. Homes with smoke-free policies increased from 71% to 81% and to 95% of homes where women had recently given birth in 2000.
Pierce et al., 1998a California, 1989–1996
Peer Review: No
Evaluation Outcome Indicators: Per capita consump-tion (PCC), adult and youth prevalence, smoke-free environments
Major Findings: In 1989–1993, adult prevalence and PCC declined over 50% faster than previously in Cali-fornia and over 40% faster than rest of the United States. In 1993–1996, declines slowed to rates slower than the previous period, with declines in prevalence similar to U.S. declines, whereas U.S. PCC remained constant. Additionally, even though prevalence declines leveled
off in California in 1993–1996, because of a greater decline in average daily consumption among continuing California smokers relative to the country, PCC con-tinued to decline in California. From 1989 to 1996, an estimated 2 billion fewer packs were sold in California, a cost to the tobacco industry of $3 billion in lost sales. Despite high awareness of media campaigns, youth smoking remained stable in 1989–1993 but increased 26% in 1993–1996. Indoor workers having smoke-free workplaces increased nearly 160%, from 35% in 1990 to more than 90% in 1996. In 1990–1996, indoor workers exposed to secondhand smoke at work decreased from 29% to 11.7%. For children, exposure to secondhand smoke at home decreased 55% from 29% in 1992 to 13% in 1996.
Pierce et al., 1998b California, 1989–1996
Peer Review: Yes
Evaluation Outcome Indicators: Per capita consump-tion (PCC), adult prevalence
Major Findings: Early program implementation (1989– 1993) was associated with a 52% more rapid decline in PCC than previously recorded in California (from 9.7 packs/person/month in 1989 to 6.5 in 1993) and signifi-cantly greater than the decline in the rest of the country (12.5 to 10.4; p < 0.001). In 1994–1996, California’s rapid decline in PCC slowed to 28% of the 1989–1993 decline (and 40% of the preprogram number) while the U.S. decline halted. By 1996 an average of 6 packs/ person/month was sold in California versus 10.5 in the United States. Before the California program was imple-mented, adult prevalence was declining at about the same rate (0.74% per year) as the country (0.77%). After program implementation, the rate of decline in California prevalence accelerated to 1.06% per year while slowing in the rest of the country to only 0.56%; thus, the rate of decline in California was nearly 90% greater than in the United States in 1989–1993 ( p < 0.05). The prevalence rate decline was significantly greater in 1990–1993 than in 1993–1996 for both California and the United States. The authors concluded that the decline in PCC cannot be explained by tax increase alone and that other program elements had an effect.
11

Popham et al., 1998 California, 1990–1991
Peer Review: Yes
Evaluation Outcome Indicators: Cessation
Major Findings: The effects of a media campaign on cessation were qualitatively measured by asking smok-ers what helped them quit. Quitters were asked to recall three experiences that helped them to quit; 6.7% of them indicated advertisements (radio, TV, billboard) in uncued questions. When asked directly about the media campaign, 34.4% of respondents indicated that the ads had played a role in their decision to quit. Estimates are that for 33,000 former smokers in California who quit in 1990–1991, the media campaign played a large part in their decision to quit, whereas for an additional 140,000, it played at least some part.
Porter, 2000 Arizona, 1996–1999
Peer Review: No
Evaluation Outcome Indicators: Adult prevalence, smoke-free environments, knowledge, health providers’ behavior
Major Findings: Adult smoking rates declined 21% from 23.8% in 1996 to 18.8% in 1999. The 18–24 age group showed a 24% decrease from 27.5% to 21%. Hispanic smoking prevalence decreased from 23.5% in 1996 to 14.6% in 1999, the greatest reduction of any ethnicity group. For the 18–24 age group, age at first use increased from a median of 15 years in 1996 to 16 years in 1999. Reports of home smoking bans decreased significantly both for smokers (from 15.7% in 1996 and 6.9% in 1999) and nonsmokers (from 50.6% to 39.4%). However, the proportions of those reporting outdoor-only smoking restrictions increased significantly, from 32.2% to 41% among smokers and 30% to 43.9% among nonsmokers. Those reporting no home restrictions also decreased among both groups. Knowledge of health risks from secondhand smoke and smokeless tobacco use improved slightly, but less than 25% of respondents believed that tobacco is as addictive as “hard” drugs. Reported exposure to different antitobacco media mes-sages changed from 1996 to 1999: significant increases included radio, from 38% to 43%, and billboards, from 40% to 55%; significant decreases included pamphlets,
from 41% to 36%; newspapers, from 47% to 41%; and magazines, from 47% to 44%. TV exposure remained stable at 79% and 78% and was the most common source of information for men and women and for all age and ethnicity groups.
Rigotti et al., 2002 Massachusetts, 1999
Peer Review: Yes
Evaluation Outcome Indicators: Young adult preva-lence
Major Findings: In a public college sample in Mas-sachusetts, students who were ages 11–17 years in 1993 and attended high school in Massachusetts during the state program had a 39% lower current tobacco use (last 30-day use) rate than did students who attended high school outside the state after adjustment for demographic factors (age, sex, race, parental educational attainment, college residence). However, there was no difference in current cigarette use between the two groups after adjustment for residence. Because nearly all students who lived at home in college resided in the state during high school, separate analyses were conducted for those not living with parents. For these students, both current tobacco and cigarette use were significantly lower for students who attended high school in state versus out of state, even after adjustment for controls (all tobacco use: AOR = 0.66; 95% CI = 0.45, 0.96; cigarette use: AOR = 0.58; 95% CI = 0.40, 0.87; p < 0.01).
Rohrbach et al., 2002 California, 1996–1998
Peer Review: Yes
Evaluation Outcome Indicators: Adult and youth prevalence, smoke-free policies
Major Findings: Recall of exposure to multiple pro-gram components including media, community pro-grams, and school programs was assessed. The unit of analysis was the county, and two cross-sectional obser-vations were made in 1996 and 1998. Multicomponent exposure was significantly associated with reductions in adult prevalence, increases in home smoking bans, and reductions in perceived violations of workplace no-smoking rules over time ( p < 0.05 for all). Although
12

youth (grade 10) showed significant reductions over time from 27.4% to 21.8% in last 30-day smoking prevalence and in reported secondhand smoke exposure from 65.9% to 58.2% ( p < 0.05 for both), these reductions were not associated with exposure to program components.
Siegel & Biener, 2000 Massachusetts, 1993/1994–1997/1998
Peer Review: Yes
Evaluation Outcome Indicators: Youth initiation
Major Findings: Using a cohort design with a 4-year longitudinal follow-up, this study found that youth ages 12–13 years reporting exposure to television antismok-ing ads from a state program were half as likely to have progressed to becoming established smokers. No effect was found for youth ages 14–15 years. No effect was found for either age group for exposure to radio or out-door (e.g., billboard) ads. This study controlled for many potential confounders including demographics, friends’ and parental smoking, TV viewing, baseline susceptibil-ity, and smoking status. Of eight potential mediators investigated, perceived prevalence of youth smoking was significantly related for ages 12–13 years such that those reporting exposure to television antismoking ads were more likely to have an accurate rather than inflated perception of youth prevalence.
Siegel et al., 1998 California, 1978–1994
Peer Review: Yes
Evaluation Outcome Indicators: Adult prevalence, quit ratio
Major Findings: In 1985–1990, a significant decline in adult prevalence occurred in California (–1.22% annually; 95% CI = –1.51, –0.93) and the rest of the country (–0.93% annually; 95% CI = –1.13, –0.73), compared with rates in 1978–1985. In 1990–1994, the rates in California slowed to –0.39% annually (95% CI= –0.76, –0.03) but leveled off in the rest of the United States (–0.05% annually; 95% CI = –0.52, +0.12). The quit ratio (ratio of former smokers to former plus current smokers) was similar in California and the country in all time periods (1978–1985, 1985–1990, and 1990–1994).
Sly et al., 2001 Florida, 1998–1999
Peer Review: Yes
Evaluation Outcome Indicators: Youth prevalence, ad awareness, knowledge, and attitudes
Major Findings: The effects of Florida’s media cam-paign with the theme of tobacco industry manipulation and an aggressive governor-sponsored public service announcement deglamorizing smoking was compared with tobacco use indicators in control states that had no tobacco control program. Confirmed awareness (being able to describe the theme) of ads reached 93% by 1 year, with 89% of those reporting TV exposure; nationally, only 30% reported exposure to any TV ads. Regarding receptivity to ads, Florida youth rated the industry manipulation ads higher than the public service announcements (liking ads: 83% vs. 37%, talking with friends about ads: 34% vs. 10%, saying ads made them think about not smoking: 61% vs. 28%). Compared with youth in other states, Florida youth showed a higher awareness of antitobacco ads at baseline (54% to 41%) and higher confirmed awareness (32% vs. 6.1%). Two receptivity measures were twice as high in Florida, and the “talked with friends” measure was 6 times greater in Florida than in other states. For all youth combined and those younger than 16 years, significant declines occurred in cigarette use and susceptible nonsmokers, whereas comparable national rates either decreased less or increased. Among youth younger than 16, Florida declines were not significantly different from national rates except for the decrease in susceptible nonsmokers.
Soldz et al., 2002 Massachusetts, 1996–1999
Peer Review: Yes
Evaluation Outcome Indicators: Youth prevalence (lifetime and current use)
Major Findings: Cigarette, smokeless tobacco, and cigar use by middle and high school students was exam-ined. Significant declines in 1996–1999 were noted for current use of all three types and for lifetime use of ciga-rettes and cigars (but not smokeless tobacco). Among middle school students, significant declines for lifetime and current use of cigarettes and cigars were noted, as
13

well as for lifetime smokeless tobacco use. High school students reported significant declines in current use of all three forms, but for lifetime use, only the decline in smokeless tobacco was significant. Differences by gender and race/ethnicity were also noted, as well as in grade 6 trends. (Grade 6 is not usually included in middle schools in Massachusetts.) For lifetime and cur-rent use of cigarettes, declines in Massachusetts were significantly greater than declines nationally or region-ally for grades 6, 8, 10, and 12. However, for smokeless tobacco, rates were not different from those seen nation-ally or regionally (cigar use data not available nationally).
Stillman et al., 2003 United States, 1992–1999
Peer Review: Yes
Evaluation Outcome Indicators: Per capita consump-tion (PCC), adult prevalence, tobacco control policies
Major Findings: This was an evaluation of the Ameri-can Stop Smoking Intervention Study (ASSIST). The strength of tobacco control (SOTC) index was created to reflect the extent to which states devoted resources to tobacco control programming and was measured for all intervention (ASSIST) and control states (minus Cali-fornia). The intermediate outcome variable—the initial outcomes index (IOI)—was a measure of policy change: the proportion of workers covered by smoke-free poli-cies, cigarette real price, and local smoke-free policy rat-ings. After controlling for demographics and other state factors, the SOTC index was related to PCC but was not significantly related to adult prevalence after adjustment for person-level factors. Notably, the capacity compo-nent of the SOTC index was significantly and inversely related to PCC regardless of ASSIST status. Although in 1993–1994, ASSIST states showed greater increases in IOI, after adjustment for the entire 8 years, both ASSIST and non-ASSIST states showed an increase in policy changes (as measured by IOI). States with a greater in-crease in IOI (from the 25th to the 75th percentile) over the 8 years showed a decrease in PCC of 0.57 packs/ person/month.
Washington State Department of Health, 2003 Washington, 1999–2002
Peer Review: No
Evaluation Outcome Indicators: Adult and youth prevalence
Major Findings: From 1999 to 2002 there was an 8% decrease in adult smokers. More smokers attempted to quit (26% in 2002) than before the launch of the program (15% in early 2000). Overall, last 30-day youth smoking decreased 40% in 1999–2002, and there was a 30% decrease in high school youth who have ever tried smoking. The reduction in prevalence among high school youth in 1999–2002 was twice the U.S. rate of decline.
Weintraub & Hamilton, 2002 Massachusetts, 1990–1999
Peer Review: Yes
Evaluation Outcome Indicators: Adult prevalence
Major Findings: In 1990 the difference between preva-lence in Massachusetts and the rest of the United States (41 states that do BRFSS) was not significant, but by 1999, adult prevalence in Massachusetts (19.4%) was significantly different from other U.S. states (23.5%; p < 0.001). After adjustment for changes in demographic characteristics, prevalence declined 17% in 1990–1999 (OR = 0.83; 95% CI = 0.70, 0.99) while there was no change in the U.S. rate (OR = 1.01; 95% CI = 0.97, 1.05). For Massachusetts men in 1990–1999, a 27% decline in prevalence was significant (after adjustment for demographics), while for women a 5% decline was not significant. There were no significant differences in the United States in the same time period for men or women.
14

Willet et al., 2003 Nebraska, 2000–2003
Peer Review: No
Evaluation Outcome Indicators: Smoking bans, youth prevalence, cessation
Major Findings: Youth 30-day smoking prevalence declined significantly from 30.5% to 24.1% in 2001– 2003, down from 39.2% in 1997 and 37.3% in 1999. A 30% increase occurred in youth reporting never hav-ing smoked a cigarette, from 30.5% in 1997 to 39.8% in 2003. Vendor compliance with youth access laws increased from 67.8% to 81.2% in 2003. From August 2002 to October 1, 2003, the quitline received more than 6,600 calls from people seeking cessation counseling/ information; the proportion of callers who heard about the quitline from their physicians increased (about 4% overall). Additionally, the quitline reached its goal of reaching a lower-income socioeconomic group because 54% of callers reported household income of less than $15,000. Awareness of dangers of secondhand smoke increased as did reports of home or workplace smoke-free policies. More than 70% (71.1%) of Nebraskans support local ordinances banning smoking in restaurants, although no city or county in Nebraska has a compre-hensive ban for public places.
15


Tobacco-Related MortalityReducing tobacco-related morbidity and mortality are the long-term goals of tobacco prevention and con-trol programs. Few states have had established comprehensive programs long enough to realize decreases in disease, but early data have shown decreases in mortality in states that have comprehensive programs. Because population subgroups experience differential rates of disease, it is important to examine and remedy disparities in mortality rates among all population groups.
Table 1A. Heart Disease Mortal i ty
REFERENCE(STATE)
TIME FRAME MAJOR FINDINGS
Fichtenberg & Glantz, 2000 (California)
1980–1988 Mortality declined faster in California than the rest of the United States; regression coefficient =0.67 (p < 0.001).
1988–1991 California’s age-adjusted heart disease mortality rate decline accelerated by –2.93/100,000(p < 0.001) from the previous period.
1992–1998 The rate declined further in California by –1.22/100,000 from the previous period (p = 0.03), whichrepresents a reduced effect of 1.71 deaths per 100,000 population per year.
Declines over the latter two time periods mean 33,000 heart disease deaths were prevented overall.
An additional 8,300 deaths might have been prevented had the media campaign not been scaled back after 1992.
17

Table 1B. Lung Cancer Mortal i ty�
REFERENCE(STATE)
TIME FRAME MAJOR FINDINGS
Jemal et al., 2003 (United States)
1990–1994 An index of the strength of state tobacco control programs was negatively correlated with lung cancer death rates for adults ages 30–39: –0.54 (p = 0.0013).
1995–1999 The correlation of an index of the strength of state tobacco control programs with lung cancer death rates for adults ages 30–39 strengthened to –0.80 (p < 0.0001). Overall correlation of the index with percent change in death rates for adults ages 30–39 from 1990–1999 was –0.56 (p < 0.0008).
CDC, 2000 (California)
1988–1997 There was a 2.7% total decline in non-California SEER† areas; the average annual decline of –0.4% is not significantly different from zero. There was a 14% total decline in lung cancer mortality in California; the average annual decline of 1.9% (p < 0.01) was 1.5 times that of non-California SEER areas. Among men there was a 2.9% average annual decline (p < 0.01) in California vs. a 1.8% average annual decline (p < 0.01) in non-California SEER areas. Among women, rates declined 4.8% (average annual decline of 0.6%, p < 0.01) in California, while rates increased 13.2% (average annual increase of 1.5%, p < 0.01) in non-California SEER areas.
† SEER = Surveillance, Epidemiology, and End Results, a program of the National Cancer Institute. The SEER program currently col-lects and publishes cancer incidence and survival data from 14 population-based and 3 supplemental cancer registries coveringapproximately 26% of the U.S. population. For more information, see http://seer.cancer.gov.
18

Prevalence of Tobacco UsePrevalence is defined as the proportion of the population who report current tobacco use, and reducing preva-lence among all population groups is considered an intermediate or long-term program goal. In adults, current smoking is usually defined as ever having smoked 100 cigarettes plus current smoking on some or all days. For youth, smokers are often defined as those who report any tobacco use in the last 30 days (“current smokers”) or those who report ever having tried cigarettes (“ever smokers”). Prevalence findings are organized by age sub-categories (adults, young adults, and youth) and indicate cigarette use, unless otherwise noted.
When prevalence declines are given, they are presented in absolute or relative terms. An absolute percentage change indicates the difference in actual percentage at two points in time, while a relative change measures the degree of change over time. For example, a decrease in prevalence from 20% to 15% is an absolute decrease of 5 percentage points and a relative decline of 25% [(0.20 – 0.15)/0.20]. These tables present what the authors have offered in their reports, often including both absolute and relative changes.
Table 2A. Adult Smoking Prevalence
REFERENCE(STATE)
TIME FRAME MAJOR FINDINGS
Jemal et al., 2003 (United States)
1990–1999 An index of the strength of state tobacco control programs was highly negatively correlated with current adult smoking (r = –0.81; p < 0.0001).
Stillman et al., 2003 (United States)
1992–1999 Adjusted difference in prevalence between ASSIST† vs. non-ASSIST states was –0.63% (95% CI = –1.38%, 0.12%; p = 0.49); for women it was –0.96% (–1.90%, –0.02%; p = 0.023); for men it was 0.09% (–0.80%, 0.97%; p = 0.42). A measure of change in tobacco control policy outcomes (initial outcomes index) was associated with declines in adult prevalence when the District of Columbia was removed from analyses (regression coefficient = –0.15 [–0.28, –0.02; p = 0.015]).
Meshack et al.,2003* (Texas)
2000–2002 Declines in prevalence in pilot areas vs. control areas: absolute percentage declines of 5.1% (21% relative decline) vs. 2.5% (11% relative decline). There were an estimated 90,000 fewer smokers because of pilot programs.
Oregon Depart-ment of Human Services, 2003*
1996–2003 Overall prevalence declined from 23.4% to 20.4%, which is a 13% relative decline, compared with an 8% relative decline in United States. Among pregnant women there was a 28% relative decline, saving an estimated $1.3 million in low-birth-weight care.
* Indicates a state or independent evaluation report that was not published in a peer-reviewed journal. † ASSIST = American Stop Smoking Intervention Study.
19

REFERENCE(STATE)
TIME FRAME MAJOR FINDINGS
Washington State Depart-ment of Health, 2003*
1999–2002 The program resulted in 83,000 fewer adult smokers,, an 8% decline.
Biener et al., 2002 (Massachusetts)
1993–1999 The slope in Massachusetts declined at a rate of –0.44 per year (95% CI = –0.66, –0.21; p = 0.001 ) compared with the U.S. slope of +0.03% per year (–0.05, 0.09; p = 0.46), which showed no significant change.
Fichtenberg &
(Glantz, 2002 United States)
Varies (review) Smoke-free work sites are associated with a decline in adult prevalence of –3.8%.
Rohrbach et al., 2002 (California)
1996–1998 Changes in absolute percentage in adult prevalence associated with lowest, moderate, and high-est exposure (to state tobacco control program) categories were +2.53%, +0.23%, and –0.95%, respectively (p = 0.03).
Weintraub & Hamilton, 2002 (Massachusetts)
1990–1999 In Massachusetts, rate decreased from 23.5% (95% CI = 21, 26.1) to 19.4% (18, 20.8), which is a relative decline of 17% after demographic adjustments (AOR‡ = 0.83; 95% CI = 0.70, 0.99). In the United States, an absolute decline from 24.2% (23.7, 24.7) to 23.3% (22.9, 23.7) was not significant (AOR = 1.01; 0.97, 1.05).• The difference between Massachusetts and other states was significant in 1999 (p < 0.001),
but not in 1990 (p = 0.62).
In Massachusetts men, the rate declined from 25.9% (22, 29.8) to 19.5% (17.3, 21.6), a relativedecline of 27% after demographic adjustments.
In U.S. men, the rate declined from 26.0% (25.2, 26.7) to 25.6% (24.9, 26.2), not a significantchange (multivariate OR§ = 1.03; .97, 1.08).• The difference between men in Massachusetts and other states was significant in 1999
(p < 0.001), but not in 1990 (p = 0.97).
In Massachusetts women, the rate declined from 21.5% (18.2, 24.8) to 19.3% (17.5, 21.1), arelative decline of 5%, which was not statistically significant (p = 0.62).
In U.S. women, the rate declined from 22.5% (21.9, 23.2) to 21.2% (20.7, 21.7), not a significantchange (multivariate OR = 0.99; .95, 1.04).• The difference between women in Massachusetts and other states was significant in 1999
(p = 0.04), but not in 1990 (p = 0.54).
CDC, 2001 (Arizona)
1996–1999 The rate in Arizona declined from 23.1% (95% CI = 21.9, 24.3) to 18.3% (17.1, 19.5; p 0.05).
* Indicates a state or independent evaluation report that was not published in a peer-reviewed journal. ‡ AOR = adjusted odds ratio; adjusted for said variables in model. § OR = odds ratio.
20

REFERENCE(STATE)
TIME FRAME MAJOR FINDINGS
Porter, 2000*(Arizona)
1996–1999 The rate declined from 23.8% to 18.8%, a relative decline of 21%.
Abt Associates,2000*(Massachusetts)
1994–2000 The Massachusetts rate declined from 22.9% to 19.7% (p = 0.04), after accounting for demographic changes, compared with no change in the other 41 BRFSS|| states (from 22.2% to 22.3%).
The rate declined from 25.1% to 19.6% (p = 0.02) in Massachusetts men, a 1.6% annual decrease (p = 0.09), compared with a 0.8% annual increase (p = 0.01) in U.S. men (p = 0.02 for difference in annual rates).
Among women, rates did not significantly decline for Massachusetts (20.8% to 19.8%; p = 0.67) or the other 41 states (20.6% to 20.4%).
Among pregnant women, the rate declined from 25% to 11% in Massachusetts, while the national rate declined from 18% to 11%.
Farrelly et al., 1999 (United States)
Sep 1992– May 1993
Smoke-free workplaces, compared with no smoking restrictions, are associated with lower prevalence by 5.7 percentage points (95% CI = –6.5, –4.9), a relative difference of 22.8%.
Having work area bans but allowing smoking in common areas decreases effects by half ( –2.6%;95% CI = –3.5, –1.7).
Harris, 1999 (Massachusetts)
1990–1996 An ANOVA¶ model of BRFSS data estimates that the adult prevalence rate declined by 2.13 per-centage points in Massachusetts (95% CI = 0.81, 3.45; p = 0.003), by 2.05 percentage points in California (0.88, 3.22; p = 0.002), and by 0.8 percentage points in 40 other states plus the District of Columbia (0.20, 1.42; p = 0.012).
In 1996, there were 140,000 fewer adult smokers than in 1990.
Among pregnant women, the rate declined from 25.3% to 13.2%, a 47.8% relative decline in Massachusetts, while the U.S. rate (including Massachusetts) declined from 18.3% to 13.7%, a 26.1% relative decline.
Pierce et al.,1998b (California)
Pre-1989 The rate was 23.3% (0.74% annual decrease) in California vs. 26.2% (0.77% annual decrease) in the rest of the United States.
1989–1993 The rate declined to 18% in California (1.06% annual decrease; p < 0.001 for change) and 23.2% in the rest of the United States (0.57% annual decrease; p < 0.05 for difference between Califor-nia and the rest of the United States).
1994–1996 The rate remained at 18% (0.01% annual increase) in California, which represented a significantslowing of the decline from the previous period (p < 0.001).
The rate for the rest of the United States declined to 22.4%, but the 0.28% annual decrease was significantly slower than the previous decline (p < 0.001).
*Indicates a state or independent evaluation report that was not published in a peer-reviewed journal. || BRFSS = Behavioral Risk Factor Surveillance System, a population-based telephone survey of noninstitutionalized adults
conducted at the state level. For more information, see http://www.cdc.gov/brfss. ¶ ANOVA is an acronym for “analysis of variance,” a statistical test of the difference between three or more independent samples.
21

REFERENCE(STATE)
TIME FRAME MAJOR FINDINGS
Siegel et al., 1998 (California)
1978–1985 The estimated annual change (in absolute percentage points) was –0.60 (95% CI = –0.79, –0.40) in California vs. –0.50 (–0.67, –0.33) in the rest of the United States.
1985–1990 The estimated annual change was –1.22 (95% CI = –1.51, –0.93) in California vs. –0.93 (–1.13, –0.73) in the rest of the United States (p < 0.05 for both rates increasing from previous period).
1990–1994 The estimated annual change was –0.39 (95% CI = –0.79, –0.40) in California vs. –0.05 (–0.34, +0.24) in the rest of the United States (p < 0.05 for both rates slowing).
CDC, 1996 (Massachusetts)
1990–1992 The rate was 23.5% (95% CI = 22.1, 24.9) in Massachusetts, 20.1% (19.2, 21.0) in California, and 24.1% (23.8, 24.4) in the rest of the United States.
1993–1995 The rate declined to 21.3% (95% CI = 20.1, 22.5) in Massachusetts, 17.4% (16.5, 18.3) in California, and 23.4% (23.1, 23.6) in the rest of the United States.
Table 2B. Young Adult Smoking Prevalence/ Ini t iat ion�
REFERENCE(STATE)
TIME FRAME MAJOR FINDINGS
Rigotti et al., 2002 ( )Massachusetts
1999 Public college students who currently live away from their parents and attended high school in state vs. out of state were less likely to report
• All tobacco use, AOR = 0.66; 95% CI = 0.45, 0.96 (p = 0.03). • Current smoking, AOR = 0.58; 95% CI = 0.40, 0.87 (p < 0.01).
Porter, 2000*(Arizona)
1996–1999 The rate decreased from 27.5% to 21% among ages 18–24, a 24% relative decline.
* Indicates a state or independent evaluation report that was not published in a peer-reviewed journal.
22

Table 2C. Youth Smoking Prevalence/ Ini t iat ion�
REFERENCE(STATE)
TIME FRAME MAJOR FINDINGS
Arizona Depart-ment of Health Services, 2003*
1997–2000 For high school students, the rate decreased from 31.3% to 24.6%, a 21% relative decline in Arizona.
For middle school students, the rate decreased from 18.7% to 11.4%, a 29% relative decline in Arizona vs. the prevalence rate of 15.1% in the United States in 2000.
Chen et al., 2003 (California)
1990–1999 Rates of never smokers increased for males from 60% to 69% (0.87% annually) and for females from 66% to 70% (0.29% annually).
Gallup, 2003* (Maine)
1997–2001 The current (last 30 days) use among Maine high school students decreased from 39.2% to 24.8%, a 38% relative decline.
McMillen & Baldwin, 2003* (Mississippi)
1999–2002 The current (last 30 days) use in Mississippi public middle schools decreased from 23.0% to 11.9% (p < 0.05), a 42% relative decline.
For high school students, the rate decreased from 32.5% to 23.1% (p < 0.05), a 24% relative decline.
Oregon Depart-ment of Human Services, 2003*
1996–2003 Relative declines were 47% for grade 8 and 26% for grade 11 in Oregon.
Washington State Depart-ment of Health, 2003*
1999–2002 Relative declines (last 30 days) were 53% (grade 6), 39% (grade 8), 40% (grade 10), and 35% (grade 12). There were an estimated 55,000 fewer youth smoking in 2002 than in 1999, and high school declines were twice the national rate of decline.
Willet et al., 2003* (Nebraska)
1997–1999 The current (last 30 days) use rate declined from 39.2% to 37.3%.
2000–2003 The current (last 30 days) use rate declined from 30.5% to 24.1% (p < 0.05).
Rohrbach et al., 2002 (California)
1996–1998 The current (last 30 days) use rate declined from 27.4% to 21.8% (p < 0.05) for grade 10, although these declines were not statistically associated with exposure to tobacco control program components.
Soldz et al., 2002 (Massachusetts)
1996–1999 The current (last 30 days) use rate in Massachusetts: • Grade 8 declined from 26.0% to 15.6% (p < 0.01); grade 10, from 33.6% to 24.6% (p < 0.05);
grade 12, from 40.7% to 34.9%.
* Indicates a state or independent evaluation report that was not published in a peer-reviewed journal.
23
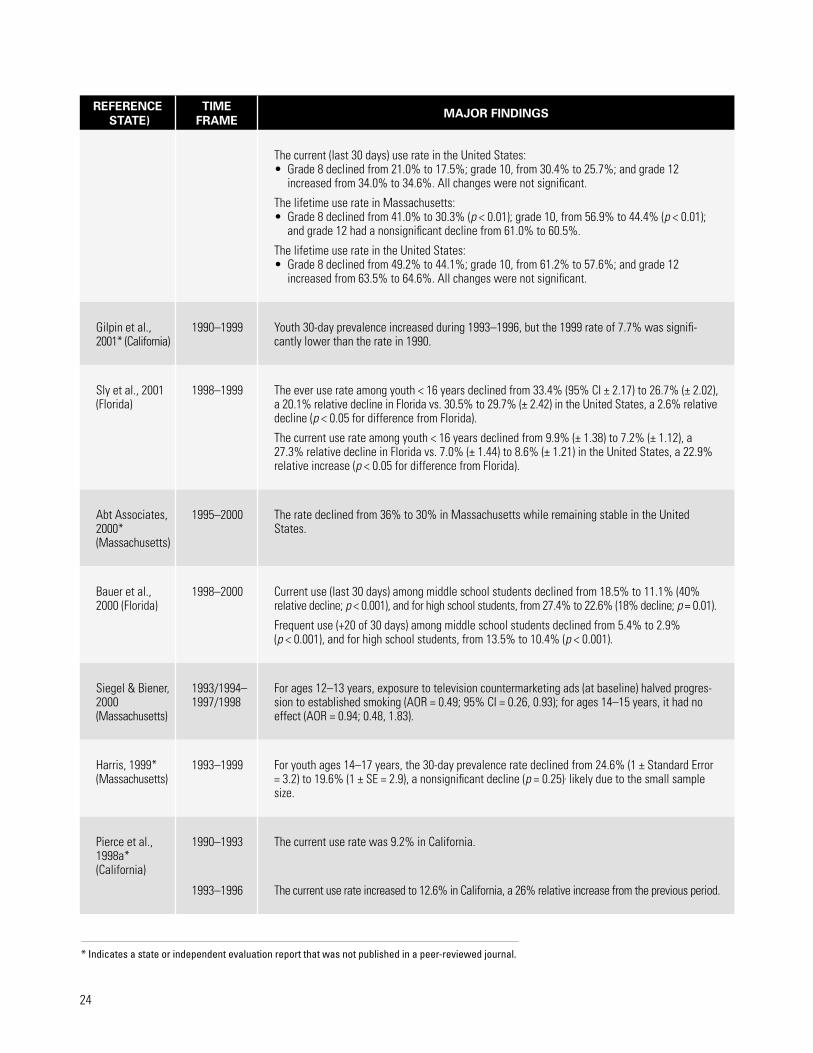
REFERENCESTATE)
TIME FRAME MAJOR FINDINGS
The current (last 30 days) use rate in the United States:• Grade 8 declined from 21.0% to 17.5%; grade 10, from 30.4% to 25.7%; and grade 12
increased from 34.0% to 34.6%. All changes were not significant.
The lifetime use rate in Massachusetts:• Grade 8 declined from 41.0% to 30.3% (p < 0.01); grade 10, from 56.9% to 44.4% (p < 0.01);
and grade 12 had a nonsignificant decline from 61.0% to 60.5%.
The lifetime use rate in the United States: • Grade 8 declined from 49.2% to 44.1%; grade 10, from 61.2% to 57.6%; and grade 12
increased from 63.5% to 64.6%. All changes were not significant.
Gilpin et al., 2001* (California)
1990–1999 Youth 30-day prevalence increased during 1993–1996, but the 1999 rate of 7.7% was signifi-cantly lower than the rate in 1990.
Sly et al., 2001 (Florida)
1998–1999 The ever use rate among youth < 16 years declined from 33.4% (95% CI ± 2.17) to 26.7% (± 2.02),
decline (a 20.1% relative decline in Florida vs. 30.5% to 29.7% (± 2.42) in the United States, a 2.6% relative
p < 0.05 for difference from Florida).
The current use rate among youth < 16 years declined from 9.9% (± 1.38) to 7.2% (± 1.12), a 27.3% relative decline in Florida vs. 7.0% (± 1.44) to 8.6% (± 1.21) in the United States, a 22.9% relative increase (p < 0.05 for difference from Florida).
Abt Associates, 2000* (Massachusetts)
1995–2000 The rate declined from 36% to 30% in Massachusetts while remaining stable in the United States.
Bauer et al., 2000 (Florida)
1998–2000 Current use (last 30 days) among middle school students declined from 18.5% to 11.1% (40% relative decline; p < 0.001), and for high school students, from 27.4% to 22.6% (18% decline; p = 0.01).
Frequent use (+20 of 30 days) among middle school students declined from 5.4% to 2.9% (p < 0.001), and for high school students, from 13.5% to 10.4% (p < 0.001).
Siegel & Biener, 2000 (Massachusetts)
1993/1994–1997/1998
For ages 12–13 years, exposure to television countermarketing ads (at baseline) halved progres-sion to established smoking (AOR = 0.49; 95% CI = 0.26, 0.93); for ages 14–15 years, it had no effect (AOR = 0.94; 0.48, 1.83).
Harris, 1999* (Massachusetts)
1993–1999 For youth ages 14–17 years, the 30-day prevalence rate declined from 24.6% (1 ± Standard Error = 3.2) to 19.6% (1 ± SE = 2.9), a nonsignificant decline (p = 0.25), likely due to the small sample size.
Pierce et al., 1998a* (California)
1990–1993 The current use rate was 9.2% in California.
1993–1996 The current use rate increased to 12.6% in California, a 26% relative increase from the previous period.
* Indicates a state or independent evaluation report that was not published in a peer-reviewed journal.
24

Consumption of Tobacco Products�Reducing per capita consumption (PCC) of tobacco products is a long-term goal of tobacco control programs. Consumption can be measured as overall sales of cigarettes or total sales per capita (per adult in the population). Daily consumption or average daily consumption (ADC) refers to the number of cigarettes smoked per day by an individual smoker. Comprehensive tobacco control strategies have been shown to reduce PCC by increasing cessation and by preventing initiation among youth, as well as decreasing daily consumption among continuing smokers. Thus, while reducing ADC for smokers may be an early sign of program success, it is an intermediate outcome, and cessation is the long-term goal for continuing smokers. Moreover, simply reducing the number of cigarettes smoked per day may not reduce exposure to toxins in a dose-related fashion (Hecht et al., 2004).
Table 3A. Total Consumption
REFERENCE(STATE)
TIME FRAME MAJOR FINDINGS
Farrelly et al., 2003 (United States)
1981–2000 Sales dropped more than twice as much in states that spend more on comprehensive tobacco control programs than in the United States as a whole.
During 1990–2000, sales decreased an average of 43% in Arizona, California, Massachusetts, and Oregon, compared with 20% decrease in all other states combined.
Hu et al., 1995a (California)
1989–1991 There was an 8%–9% reduction in the short run, and a 10%–13% reduction in the long run.
Glantz, 1993 (California)
1981–1988 Consumption was decreasing at rate of –45.9 million packs/year, about 2% annually.
1989–1991 The decline more than tripled to –164.3 million packs/year (p < 0.001).
June 1992 There was a significant deceleration of decline (–19.4 million packs/year; p = 0.007).
Through June 1993, 1.1 billion fewer packs were sold since the passage of Proposition 99 in California.
25

Table 3B. Per Capita Consumption�
REFERENCE(STATE)
TIME FRAME MAJOR FINDINGS
Stillman et al., 2003 (United States)
1989–1999 Before intervention, ASSIST† states sold 10.64 packs/person/month, similar to non-ASSIST states at 10.54 (p = 0.88).
During the course of the intervention, ASSIST states experienced a nonsignificant decrease(p = 0.22). Regardless of ASSIST status, states with higher cigarette price and greater increase in price over time showed a decrease in PCC of 0.57 packs/person/month (95% CI = 0.43, 0.72).
Gallup, 2003* (Maine)
1997–2001 PCC decreased from 132.8 to 107 packs/year in Maine.
Oregon Depart-ment of Human Services, 2003*
1996–2003 Oregon experienced a relative decrease of 30%, steeper than other states with no comprehen-sive tobacco control program.
Biener et al., 2002 ( )Massachusetts
1988–1992 There was a 15% decline in Massachusetts and a 14% decline in the 48 comparison states (California also excluded), representing a 3%–4% annual decline for both groups.
1993–1999 In 1993, there was a 12% decline in Massachusetts and a 4% decline in the United States. After 1993, when cigarette prices leveled off, Massachusetts experienced an annual decline of> 4%, while the 48 comparison states experienced an annual decline of < 1% thereafter.
Gilpin et al., 2001* (California)
1990–1999 There was a relative decline of 57% in California, compared with 27% in the United States.
Fichtenberg & Glantz, 2000 (California)
1980–1988 The regression coefficient for California vs. the rest of the United States was 1.09 (p < 0.001); PCC was falling slightly faster in California.
1988–1991 PCC annual rate of decline in California was significantly greater (by –2.72 packs/year/year) thanin the rest of the United States.
1992–1998 Rate of the previous decline (during 1988–1991) was reduced by 2.05 packs/year/year in Califor-nia, relative to the decline in the United States (p < 0.04, compared with the previous period).
Abt Associates, 2000* (Massachusetts)
1994–2000 Massachusetts had a relative decline of 36% in PCC, compared with a 16% relative decline in the United States.
* Indicates a state or independent evaluation report that was not published in a peer-reviewed journal. † ASSIST = American Stop Smoking Intervention Study.
26

REFERENCE(STATE)
TIME FRAME MAJOR FINDINGS
California Department of Health Services,2000*
1989–1999 PCC declined more than 50% in California to 61.3 packs/adult in 1998–1999, compared with a U.S. PCC of 106.8 packs/adult in 1999.
CDC, 1999 (Oregon)
1993–1996 PCC increased 2.2% in Oregon, while decreasing 0.6% in the United States.
1996–1998 PCC decreased 11.3% in Oregon (from 92 to 82 packs/adult), which translates to 25 million fewer packs sold in 1998 than in 1996, despite a 2.7% increase in the state population.
Pierce et al., 1998a* (California)
Pre–1989 PCC was 9.7 packs/person/month in California (–0.40% annual decrease) and 12.4 in the United States (–0.36% annual decrease).
1989–1993 PCC was 6.7 packs/person/month in California (–0.65% annual decrease; a 63% relative increase in the annual rate of decline from the previous period) and 10.4 in the United States (–0.45% annual decrease).
1993–1996 PCC was 6.0 packs/person/month in California (–0.22% annual decrease, one-third the previous rate of decline) and 10.3 in the United States (–0.02% annual decrease).
Pierce et al., 1998b (California)
1983–1989 In 1988, PCC was 9.7 packs/person/month in California, 22% less than the 12.5 packs/person/month sold in the rest of the country.
Rate of monthly PCC decline was –0.42 pack in California and –0.36 in the rest of the country (p < 0.01 for difference).
1989–1993 In 1993, PCC declined to 6.5 packs/person/month in California, while declining to 10.4 packs/person/month in the rest of the country.
Rate of monthly PCC decline increased to –0.64 pack in California (p < 0.001 for difference from the previous period). The rate of decline slightly (but insignificantly) increased in the rest of thecountry to –0.42 pack (p < 0.001 for difference from California).
1994–1996 In 1996, PCC declined to 6 packs/person/month in California, 43% less than the 10.5 packs/person/month in the rest of the country.
The rate of the monthly PCC decline slowed to –0.17 pack in California (p < 0.001 for differencefrom the previous period); in the rest of the country, the previous decline reversed and monthlyPCC increased to +0.4 (p < 0.001 for difference from California and difference from previousperiod).
* Indicates a state or independent evaluation report that was not published in a peer-reviewed journal.
27

REFERENCE(STATE)
TIME FRAME MAJOR FINDINGS
Manley et al., 1997 (United States)
1989–1991 PCC was 12 packs/person/month in ASSIST states (as a group) and non-ASSIST states (as a group; excluding California) in 1989 and 11 in 1991.
1993–1996 In 1993, ASSIST states (as a group) maintained low PCC, while PCC began to increase in non-ASSIST states (as a group, excluding California); in 1994, this increase was statistically significant (p < 0.05). At the beginning of 1996, PCC in ASSIST states (as a group) was 7% less than the comparison group.
76% of ASSIST states vs. 55% of comparison states had declines in PCC, despite a real cigaretteprice decrease.
CDC, 1996 (Massachusetts)
1990–1992 Relative declines in PCC were –6.4% in Massachusetts, –11.0% in California, and –5.8% in therest of the United States.
1992–1996 Relative declines in PCC were –19.7% in Massachusetts, –15.8% in California, and –6.1% inthe rest of the United States.
Elder et al., 1996 (California)
1980–1988 Average quarterly PCC declines were 3.6% in California and 2.4% in the rest of theUnited States.
1989–1994 Average quarterly PCC declines were 7.9% in California and 3.2% in the rest of theUnited States.
Hu et al., 1995b (California)
1990–1992 PCC decreased by 35 packs/person; 79% of the decline was attributable to the price increase and 21% to the media campaign.
Hu et al., 1994 (California)
1984–1991 Immediate effect on PCC seen in 1989, with a decline of 2 packs/person (–25.7% relative decline). Long-term effect on PCC seen in 1991, with a decline of 0.75 packs/person (–9.5% rel iat ve decline).
Glantz, 1993 (California)
1980 Baseline PCC (packs/person/year) was 122.8 (p = 0.001) in California vs. 143.5 (p = 0.001) in the United States.
1981–1988 PCC decreased by – 4 packs/person/year (p = 0.001) in California vs. –3.8 (p = 0.001) in the United States, both significant declines.
1989–1991 PCC decrease doubled to –8 packs/person/year (p = 0.001) in California vs. – 4.7 (p = 0.39) in the United States.
1992 PCC decrease slowed to –1.42 packs/person/year in California (p = 0.032), not significantly different from the U.S. decrease.
* Indicates a state or independent evaluation report that was not published in a peer-reviewed journal.
28

Table 3C. Average Daily Consumption�
REFERENCE(STATE)
TIME FRAME MAJOR FINDINGS
Fichtenberg & Glantz, 2002 (United States)
Varies (review) Smoke-free work sites are associated with 3.1 (95% CI = 2.4, 3.8) fewer cigarettes per day among continuing smokers.
Gilpin et al., 2001* ( California)
1990–1999 Of the continuing smokers who did not quit, >60% of them smoked <15 cigarettes/day and >20%of them were nondaily smokers.
Norman et al., 2000 (California)
1998 With average daily consumption in smokers as the outcome, the home smoking ban beta coefficient () = –0.301 (p < 0.01).
Farrelly et al., 1999 (United States)
September 1992–May
1993
For those with smoke-free work sites, continuing smokers reported consuming 2.67 (95% CI = 2.28, 3.05) fewer cigarettes/day compared with smokers with no smoking restrictions; population subgroups varied in these effects.
Pierce et al., 1998a* (California)
1989 Smokers smoked 17.3 cigarettes/day in California vs. 19.5 in the rest of the United States.
1992–1993 Smokers smoked 15.3 cigarettes/day in California vs. 18.1 in the rest of the United States.
1995–1996 Smokers smoked 13.7 cigarettes/day in California (a 10.4% decrease from previous period) vs. 17.3 in the rest of the United States (a 4.4% decrease from the previous period).
* Indicates a state or independent evaluation report that was not published in a peer-reviewed journal.
29


Cessation of Tobacco Use�Cessation of tobacco use by youth and adults is a long-term outcome of tobacco control program initiatives, which include efforts to promote and support cessation. Various cessation indicators are used by evaluation stud-ies. Examples of indicators include the quit ratio (proportion of ever smokers who have quit smoking), awareness of cessation services, desire to quit, proportion of users making quit attempts, and quit success rates (i.e., recent quitters/previous-year smokers).
Table 4A. Quit Ratio
REFERENCE(STATE)
TIME FRAME MAJOR FINDINGS
Jemal et al., 2003 (United States)
1990–1999 An index of the strength of state tobacco control programs was highly correlated with state quit ratios (r = –0.82, p < 0.0001).
Siegel et al., 1998 ( California)
1978–1985 Estimated annual change was 0.73 (95% CI = 0.22, 1.24) in California and 0.73 (0.40, 1.05) in the rest of the United States.
1985–1990 Estimated annual change was 1.36 (95% CI = 0.74, 1.97) in California and 1.04 (0.62, 1.46) in the rest of the United States.
1990–1994 Estimated annual change was 0.18 (95% CI = –0.80, 1.15) in California and 0.15 (–0.47, 0.77) in the rest of the United States.
31

Table 4B. Other Cessat ion Measures�
REFERENCE(STATE)
TIME FRAME MAJOR FINDINGS
Meshack et al.,2003* (Texas)
2000–2002 The regions with most intensive pilot activities experienced higher rates of awareness (23.1% vs. 13.8%), use of telephone counseling services (2.7% vs. 1.2%), and cessation (11% vs. 9%). Additionally, receipt of telephone counseling services led to significantly higher 1-year cessationrates (20.7% vs. 13.2%, or 10.3% vs. 6.6% if assumed those lost to follow-up failed).
Washington State Depart-ment of Health, 2003*
1999–2002 Smokers making serious quit attempts increased from 15% to 26%.
Gilpin et al., 2001* (California)
1990–1999 Smokers making quit attempts increased from 49% to 60%.
Abt Associates,2000*(Massachusetts)
1993–1999 Quit success rate increased from 17% to 25%.
Norman et al., 2000 (California)
1998 Smokers with a home smoking ban were twice as likely to report wanting to quit smoking than smokers with no rules in the home after controlling for multiple predictors (OR = 2.16; 95% CI = 1.26, 3.7; p < 0.01).
Popham et al., 1998 (California)
1990–1991 According to qualitative self-report, the California media campaign influenced at least 173,000 former smokers to quit and was a major influence for 33,000 of those.
* Indicates a state or independent evaluation report that was not published in a peer-reviewed journal.
32

Smoke-Free Legislation and Policy�Eliminating exposure to secondhand smoke is a long-term program goal. Enactment and enforcement of smoke-free policies are short-term goals in this goal area, and compliance with such policies is an intermediate goal. Compliance with smoke-free policies reduces or eliminates exposure to secondhand smoke among nonsmokers and also encourages cessation and decreased consumption among continuing smokers.
Table 5 . Enactment and Enforcement of Smoke-Free Policies
REFERENCE(STATE)
TIME FRAME MAJOR FINDINGS
McMillen et al., 2003* (Mississippi)
2000–2002 Smoking bans in all work areas increased from 53.2% to 64.7% (p < 0.05) in Mississippi vs. 65.7% to 65.0% in the United States.
Oregon Depart-ment of Human Services, 2003*
1996–2003 More than 95% of work sites were covered by smoke-free law, while 71% to 81% of homesreportedly had smoke-free policies.
Bartosch &Pope, 2002(Massachusetts)
March 1999 In a regression model of local enactment of smoke-free and youth access policies, 47% of the variance in policy enactment was explained by state funding and larger town size.
Rohrbach et al., 2002 (California)
1996–1998 Changes in absolute percentage in home smoking bans associated with lowest, moderate, and highest exposure categories were +2.01%, +2.89%, and +4.15%, respectively (p = 0.04). Changes in absolute percentage in perceived violations of work no-smoking policies associated with lowest, moderate, and highest exposure categories were +0.66%, –0.31%, and –3.2%, respectively (p = 0.03).
Siegel, 2002 (United States)
Varies (review) State tobacco control programs focused on controlling secondhand smoke usually enact policies at state and local levels (precluding the existence of state preemption laws).
Gilpin et al., 2001* (California)
1990–1999 Indoor workers with smoke-free policies increased from 35% to 93%. Those with indoor home smoke-free policies were 73% in 1999, a 30% relative increase from 1993. Also, 88.6% of children and 47.0% of smokers resided in smoke-free homes in 1999.
* Indicates a state or independent evaluation report that was not published in a peer-reviewed journal.
33

REFERENCE(STATE)
TIME FRAME MAJOR FINDINGS
Norman et al., 2000 (California)
March–July 1998
Porter, 2000*(Arizona)
1996–1999 Indoor home smoking bans increased from 32.2% to 41.1% for smokers and from 30.0% to 43.9% for nonsmokers. Total home smoking bans (including outdoors) decreased from 15.7% to6.9% for smokers and from 50.6% to 39.4% for nonsmokers.
Smokers with a home smoking ban were more than 2 times as likely to have heard of commu-nity programs (AOR = 2.27; 95% CI = 1.23, 4.21) and almost 3 times as likely to have seen and discussed a television ad about smoking around children (AOR = 2.87; 95% CI = 1.11, 7.41) after adjusting for age, race/ethnicity, gender, and education. In multivariate models, having a home smoking ban was associated with average daily consumption (= –0.3.1; p < 0.01) and express-ing a desire to quit smoking (OR = 2.16; 95% CI = 1.26, 3.7).
* Indicates a state or independent evaluation report that was not published in a peer-reviewed journal.
34

Reference List�Abt Associates, Inc. Independent Evaluation of the Massachusetts Tobacco Control Program, 7th Annual Report. Cambridge, MA: Abt Associates, Inc.; 2000.URL: http://www.mass.gov/dph/mtcp/reports/2000/aptrep_2000.htm.
Arizona Department of Health Services. Results in Arizona: Tobacco Programs Work. Phoenix, AZ: Arizona Department of Health Services, Tobacco Education and Prevention Program; 2004. URL: http://www.tepp. org/legislature/results.pdf.
Bartosch WJ, Pope GC. Local enactment of tobacco control policies in Massachusetts. American Journal of Public Health, June 2002;92(6):941–43.
Bauer UE, Johnson TM, Hopkins RS, Brooks RG. Changes in youth cigarette use and intentions following implementation of a tobacco control program: findings from the Florida Youth Tobacco Survey, 1998–2000. JAMA: The Journal of the American Medical Associa-tion, Sept. 9, 2000;284(6):723–28.
Biener L, Harris JE, Hamilton W. Impact of the Massa-chusetts Tobacco Control Programme: population based trend analysis. BMJ (British Medical Journal), Aug. 5, 2000;321(7257):351–54.
California Department of Health Services. California Tobacco Control Update. Sacramento, CA: California Department of Health Services, Tobacco Control Sec-tion; Aug. 2000. URL: http://www.dhs.ca.gov/ps/cdic/ ccb/tcs/documents/CTCUpdate.pdf.
Centers for Disease Control and Prevention. Tobacco use among adults—Arizona, 1996 and 1999. MMWR: Morbidity and Mortality Weekly Report, May 25, 2001;50(20):402–6. URL: http://www.cdc.gov/mmwr/preview/mmwrhtml/mm5020a2.htm.
Centers for Disease Control and Prevention. Declines in lung cancer rates—California, 1988–1997. MMWR: Morbidity and Mortality Weekly Report, Dec. 1,2000;49(7):1066–69. URL: http://www.cdc.gov/mmwr/preview/mmwrhtml/mm4947a4.htm.
Centers for Disease Control and Prevention. Decline in cigarette consumption following implementation of a comprehensive tobacco prevention and education program—Oregon, 1996–1998. MMWR: Morbidity and Mortality Weekly Report, Feb. 26, 1999;48(7):140–43.URL: http://www.cdc.gov/mmwr/preview/mmwrhtml/00056574.htm.
Centers for Disease Control and Prevention. Cigarette smoking before and after an excise tax increase and an antismoking campaign—Massachusetts, 1990–1996. MMWR: Morbidity and Mortality Weekly Report,Nov. 8, 1996;45(44):966–70. URL: http://www.cdc.gov/mmwr/preview/mmwrhtml/00044337.htm.
Chen X, Li G, Unger JB, Liu X, Johnson CA. Secular trends in adolescent never smoking from 1990 to 1999 in California: an age-period-cohort analysis. American Journal of Public Health, Dec. 2003;93(12):2099–2104.
Elder JP, Edwards CC, Conway TL, Kenney E, Johnson CA, Bennett ED. Independent evaluation of the Califor-nia Tobacco Education Program. Public Health Reports, July 1996;111(4):353–58.
Farrelly MC, Pechacek TP, Chaloupka FJ. The impact of tobacco control program expenditures on aggregate cigarette sales: 1981–2000. Journal of Health Economics, Sept. 2003;22(5):843–59.
Farrelly MC, Evans WN, Sfekas AES. The impact of workplace smoking bans: results from a national survey. Tobacco Control, 1999;8(3):272–77.
35

Fichtenberg CM, Glantz SA. Effect of smoke-free work-places on smoking behaviour: systematic review. BMJ (British Medical Journal), July 27, 2002;325(7357):1–7.
Fichtenberg CM, Glantz SA. Association of the California Tobacco Control Program with declines in cigarette con-sumption and mortality from heart disease. New England Journal of Medicine, Dec. 14, 2000;343(24):1772–77.
Gallup Organization I. Independent Evaluation of Maine’s Tobacco Control Program. A Progress Report Card Year Two. Augusta, ME: Partnership for a Tobacco Free Maine, Bureau of Health, Department of Human Services; January 2002. URL: http://www.surveymaine. com/healthymainepartnership/resources/gallup1.pdf.
Gilpin EA, Emery SL, Farkas AJ, Distefan JM, White MM, Pierce JP. The California Tobacco Control Pro-gram: A Decade of Progress, Results from the California Tobacco Survey, 1990–1999. La Jolla, CA: University of California, San Diego; 2001.
Glantz SA. Changes in cigarette consumption, prices, and tobacco industry revenues associated with California’s Proposition 99. Tobacco Control, 1993;2(4):311–14.
Harris JE. Draft status report on the Massachusetts Tobacco Control Campaign, with a preliminary specula-tion of the impact of the campaign on total health care spending in Massachusetts. Cambridge, MA: Massachu-setts Institute of Technology and Massachusetts General Hospital; Oct. 11, 1999.
Hecht SS, Murphy SE, Carmella SG, Zimmerman CL, Losey L, Kramarczuk I, et al. Effects of reduced ciga-rette smoking on the uptake of a tobacco-specific lung carcinogen. Journal of the National Cancer Institute, Jan. 2004;96(2):107–15.
Hu TW, Keeler TE, Sung H, Barnett PG. (1995a) The impact of California anti-smoking legislation on ciga-rette sales, consumption, and prices. Tobacco Control, 1995;4(Suppl 1):S34–S38.
Hu TW, Sung HY, Keeler TE. (1995b) Reducing ciga-rette consumption in California: tobacco taxes vs. an anti-smoking media campaign. Annual Review of Public Health, Sept. 1995;85(9):1218–22.
Hu TW, Bai J, Keeler TE, Barnett PG, Sung HY. The im-pact of California Proposition 99, a major anti-smoking law, on cigarette consumption. Journal of Public Health Policy, 1994;15(1):26–36.
Institute of Medicine, National Research Council, Na-tional Cancer Policy Board. State Programs Can Reduce Tobacco Use. Washington, DC: National Academy Press; 2000.
Jemal A, Cokkinides VE, Shafey O, Thun MJ. Lung can-cer trends in young adults: an early indicator of progress in tobacco control (United States). Cancer Causes and Control, 2003;14(6):579–85.
Manley MW, Pierce JP, Gilpin EA, Rosbrook B, Berry C, Wun L. Impact of the American Stop Smoking Intervention Study on cigarette consumption. Tobacco Control, 1997;6(Suppl 2):S12–S16.
McMillen R, Baldwin NL. The Youth Social Climate Survey of Tobacco Control. Cigarette Smoking Among Youth—Mississippi 2002. Starksville, MS: Social Sci-ence Research Center, Mississippi State University; June2003. URL: http://www.ssrc.msstate.edu/socialclimate/reports.htm.
McMillen R, Breen J, Frese W, Cosby AG. The Missis-sippi Social Climate of Tobacco Control, 2000–2002. Starksville, MS: Social Science Research Center, Mississippi State University; 2003. URL: http://www. ssrc.msstate.edu/publications/2001MSSocialClimate Report.pdf.
Meshack A, Pallonen U, Hu S, Rabius V, McAlister A. Evaluation of the Texas Department of Health Texas To-bacco Prevention Pilot Initiative, 2000–2002: Effects on Adults. Houston, TX: University of Texas Health Science Center at Houston, School of Public Health; May 2003.
Norman GJ, Ribisl KM, Howard-Pitney B, Howard KA, Unger JB. The relationship between home smoking bans and exposure to state tobacco control efforts and smok-ing behaviors. American Journal of Health Promotion, Nov. 2000;15(2):81–88.
36

Oregon Department of Human Services. Making Oregon Healthier: Saving Lives and Saving Dollars. Tobacco Prevention and Education in Oregon. Portland, OR: Oregon Department of Human Services, Health Servic-es, Tobacco Prevention and Education Program; 2003. URL: http://www.ohd.hr.state.or.us/tobacco/arpt2001/ results.cfm.
Pierce JP, Gilpin EA, Emery SL, Farkas AJ, Zhu SH, Choi WS, et al. (1998a) Tobacco Control in Califor-nia: Who’s Winning the War? An Evaluation of the Tobacco Control Program, 1989–1996. La Jolla, CA: University of California, San Diego; June 30, 1998. URL: http://www.dhs.cahwnet.gov/tobacco/documents/ CTS96FinalReport.PDF.
Pierce JP, Gilpin EA, Emery SL, White MM, Rosbrook B, Berry CC, Farkas AJ. (1998b) Has the California Tobacco Control Program reduced smoking? JAMA: The Journal of the American Medical Association, Sept. 9, 1998;280(10):893–99.
Popham WJ, Potter LD, Bal DG, Johnson MD, Duerr JM, Quinn V. Do anti-smoking media campaigns help smokers quit? Public Health Reports, 1993;108(4):510–13.
Porter RS. 1999 Arizona Adult Tobacco Survey Report. Phoenix, AZ: Department of Health Services Tobacco Education and Prevention Program; May 15, 2000. URL: http://www.tepp.org/evaluation/1999adultsurvey/ adultsurvey99.pdf.
Rigotti NA, Regan S, Majchrzak NE, Knight JR, Wechsler H. Tobacco use by Massachusetts public college students: long-term effect of the Massachu-setts Tobacco Control Program. Tobacco Control, June 2002;11(Suppl 2):ii20–ii24.
Rohrbach LA, Howard-Pitney B, Unger JB, Dent CW, Howard KA, Cruz TB, et al. Independent evaluation of the California Tobacco Control Program: rela-tionships between program exposure and outcomes, 1996–1998. American Journal of Public Health, June 2002;92(6):975–83.
Siegel M. The effectiveness of state-level tobacco control interventions: a review of program implementa-tion and behavioral outcomes. Annual Review of Public Health, 2002;23:45–71.
Siegel M, Biener L. The impact of an antismoking media �campaign on progression to established smoking: results �of a longitudinal youth study. Annual Review of Public �Health, Mar. 2000;90(3):380–86.�
Siegel M, Mowery PD, Pechacek TP, Strauss WJ, �Schooley MW, Merritt RK, et al. Trends in adult ciga-�rette smoking in California compared with the rest of the �United States, 1978–1994. American Journal of Public �Health, Mar. 2000;90(3):372–79.�
Sly DF, Heald GR, Ray S. The Florida “truth” anti�-tobacco media evaluation: design, first year results, and �implications for planning future state media evaluations. �Tobacco Control, Mar. 2001;10(1):9–15.�
Soldz S, Clark TW, Stewart E, Celebucki C, Klein�Walker D. Decreased youth tobacco use in Massachusetts:�1996 to 1999: evidence of tobacco control effectiveness. �Tobacco Control, June 2002;11(Suppl 2):ii14–ii19.�
Stillman FA, Hartman AM, Graubard BI, Gilpin EA, �Murray DM, Gibson JT. Evaluation of the American �Stop Smoking Intervention Study (ASSIST): a report �of outcomes. Journal of the National Cancer Institute,�Nov. 19, 2003;95(22):1681–91.�
Wakefield M, Chaloupka FJ. Effectiveness of com-�prehensive tobacco control programmes in reducing �teenage smoking in the USA. Tobacco Control, June �2000;9(2):177–86.�
Washington State Department of Health. Tobacco Preven-�tion and Control Program: Progress Report. Executive�Summary, March 2003. Olympia, WA: Washington State�Department of Health; Mar. 2003. URL: http://www.doh.�wa.gov/Tobacco/program/reports/TPCexecsum.pdf.�
Weintraub JM, Hamilton WL. Trends in prevalence �of current smoking, Massachusetts and states without �tobacco control programmes, 1990–1999. Tobacco Con-�trol, June 2002;11(Suppl 2):ii8–ii13.�
Willet J, Newman I, Wiese C, Emont S, Njobe T, Finn �P. Progress in Reducing Tobacco Use Across Nebraska.�A Snapshot Progress Report on Tobacco Free Nebraska�(TFN). Lincoln, NE: Tobacco Free Nebraska Program,�Nebraska Health and Human Services System; �Dec. 2003. URL: http://www.hhs.state.ne.us/tfn/�03TFNSnapMain.pdf.�
37

Centers for Disease Control and Prevention Safer • Healthier • People™
U.S. Department of Health and Human Services