a summary of evidence for the situational...
TRANSCRIPT

Enhancing Performance of Organizations, Leaders, and
Teams for Over 50 Years
A SUMMARY OF THE EVIDENCE FOR THE
SITUATIONAL OUTLOOK QUESTIONNAIRE®
A Technical Resource
Scott G. Isaksen
Göran Ekvall

1 Summary of the Evidence
A SUMMARY OF THE EVIDENCE FOR THE SITUATIONAL OUTLOOK QUESTIONNAIRE®
Enhancing Performance of Organizations, Leaders and Teams for Over 50 Years
Scott G. Isaksen Göran Ekvall
Published by The Creative Problem Solving Group, Inc.
Post Office Box 648
Orchard Park, New York 14127
USA
Email: [email protected]
Web site: www.cpsb.com
Phone: (+1) 716.667.1324
The Situational Outlook Questionnaire®, and its logo, are registered trademarks of
The Creative Problem Solving Group, Inc.
© 2015, 2nd ed. The Creative Problem Solving Group, Inc. All Rights Reserved.
No part of this publication may be reproduced, stored in a retrieval system, or transmitted,
in any form or by any means, electronic, mechanical, photocopying, recording, or otherwise,
without the prior written permission of The Creative Problem Solving Group, Inc.
A Technical Resource for the SOQ
2 Summary of the Evidence
List of Tables
TABLE 1 __________________________________________________________ 5 Approaches to Assesment
TABLE 2 __________________________________________________________ 7 Fundamentals of Measurement
TABLE 3 __________________________________________________________ 8 Forms of Reliability
TABLE 4 ___________________________________________________________ 9 Forms of Validity
TABLE 5 _________________________________________________________ 17 Innovative and Stagnated Organizations
TABLE 6 _________________________________________________________ 19 Leadership Support of Innovation
TABLE 7 _________________________________________________________ 20 Most and Least Creative Teams
TABLE 8 _________________________________________________________ 21 Best and Worst Case Workplaces
TABLE 9 _________________________________________________________ 22 Perceived Support of Creaitivity
TABLE 10 ________________________________________________________ 23 Successful Incremental Innovation
TABLE 11 ________________________________________________________ 24 Successful Radical Innovation
TABLE 12 ________________________________________________________ 25 Empowerment for Innovation
TABLE 13 ________________________________________________________ 26 Consumer Insight Driving Innovation
TABLE 14 ________________________________________________________ 27 Uncertainty Avoidance
TABLE 15 ________________________________________________________ 28 Successful Implementation of New Ideas
TABLE 16 ________________________________________________________ 29 Successful Innovation
TABLE 17 ________________________________________________________ 20 Magnet and Non-Magnet Hospitals
TABLE 18 ________________________________________________________ 31 Belief in Diversity

3 Summary of the Evidence
TABLE 19 ________________________________________________________ 32 Promoting Diversity
TABLE 20 ________________________________________________________ 33 Promoting Inclusion
TABLE 21 ________________________________________________________ 34 Considering Viewpoints from Diverse Populations
TABLE 22 ________________________________________________________ 35 Work Engagement
TABLE 23 ________________________________________________________ 36 Level of Collaboration
TABLE OF CONTENTS
CHAPTER 1
Reliability and Validity ___________________________________________ 5
Reliability ________________________________________________________________________ 6
Kinds of Reliability __________________________________________________________________ 7
Validity __________________________________________________________________________ 8
Forms of Validity (The 1985 Standards) ___________________________________________________ 9
Evidence of Validity (The 1999 Standards) ________________________________________________ 10
CHAPTER 2
A Summary Of the Evidence _____________________________________ 12
Evidence of SOQ’s Reliability __________________________________________________________ 12
Consistency over Time ______________________________________________________________ 12
Internal Reliability _________________________________________________________________ 12
Evidence of SOQ’s Validity ____________________________________________________________ 13
Evidence based on test content ________________________________________________________ 13
Evidence based on response processes ___________________________________________________ 14
Evidence based on internal structure ____________________________________________________ 14
Evidence based on relations to other variables _____________________________________________ 14
Usability ________________________________________________________________________ 16

4 Summary of the Evidence
CHAPTER 3 Alternative Benchmarks ________________________________________ 17
Innovative and Stagnated Organizations __________________________________________________ 17
Leadership Support of Innovation _______________________________________________________ 18
Most and Least Creative Teams ________________________________________________________ 19
Best and Worst Case Workplaces _______________________________________________________ 20
Perceived Support of Creativity ________________________________________________________ 21
Successful Incremental Innovation ______________________________________________________ 22
Successful Radical Innovation _________________________________________________________ 23
Empowerment for Innovation _________________________________________________________ 24
Consumer Insight Driving Innovation ____________________________________________________ 25
Uncertainty Avoidance ______________________________________________________________ 26
Successful Implementation of New Ideas _________________________________________________ 27
Successful Innovation _______________________________________________________________ 28
Magnet and Non-Magnet Hospitals _____________________________________________________ 29
Belief in Diversity __________________________________________________________________ 30
Promoting Diversity ________________________________________________________________ 31
Promoting Inclusion ________________________________________________________________ 32
Considering Viewpoints from Diverse Populations ____________________________________________ 33
Work Engagement _________________________________________________________________ 34

5 Summary of the Evidence
CHAPTER 1 Reliability and Validity
The purpose of this chapter is to provide the reader a high-level and illustrative summary of
the evidence to support the reliability and validity of the dimensions of the Situational
Outlook Questionnaire® (SOQ). Information about these attributes of the SOQ is provided
to introduce you to the instrument, explain how it operates and illustrate the soundness of
the measure. If you are already familiar with the behavioral sciences, then you already
know about the importance of these attributes. If you are new to this area, it may be helpful
to point out why it is important to present this kind of information.
Table 1 Approaches to Assessment
If you examine Table 1 above, you can see that there are many different approaches to
assessment. Our colleague, Dr. Don Treffinger frequently shared this two-by-two matrix
with his graduate students to illustrate this point. It is possible to focus on providing very
limited information and have a measure that is very easy to use. This is identified as
expedience in the matrix.

6 Summary of the Evidence
The kind of assessment that is expedient includes those measures you can pick up at the
grocery store that include five items and they try to tell you if you will have a good life.
They are easy to complete, but provide very limited information. It is also possible to
provide very little useful information and have a measure that is very difficult to use. This
is referred to as self-abuse. These are the kinds of measures that have many items, and
take a long time to complete, but only provide very limited information. A third possibility is
to have a measure that provides a great deal of useful information and is very easy to use.
This is referred to as fantasyland in the matrix above, because it is highly unlikely that any
measure that provides a high level of useful information can actually do so in a “quick and
dirty” way. The fourth quadrant in the matrix is where a measure provides a great deal of
useful information and has a degree of rigor to it. It is more likely that any measure or
assessment that provides the user with a rich amount of useful information and insight will
be relatively harder to administer, score and develop.
The basic tension in the matrix runs between those who desire a “quick and dirty” measure,
and those who tend toward “rigor mortis.” Usually the proponents of the quick and dirty end
of the tension include practitioners with little patience or interest in science, theory, or
conceptual foundations. Academics and researchers are often found at the other end of the
spectrum, some of whom have little interest in things practical. As with most things, the
truth and best position is somewhere between the two absolute end points.
The reason we believe it is important to present information about the psychometric
properties, reliability and validity of the SOQ is that the measure does provide a great deal
of useful information. Further, it has been developed over a fifty-year period of research
and development. Anyone who wishes to use the SOQ needs to be aware of the support for
the measure, as well as its limitations. Further, anyone who wishes to apply the measure to
organizational improvement and development, leadership development, or the improvement
of teamwork, needs to be thoroughly familiar with the standards that exist for such an
assessment.
When it comes to measurement in the behavioral sciences (and most other sciences), there
are two fundamental characteristics for which those who use quantitative measures look.
These are reliability and validity (see Pedhazur & Schmelkin, 1991).
Reliability
Reliability refers to the consistency or stability of a measure from one use to the next, with
different sets of equivalent items, or under other variable examining conditions. In other
words, does the measure assess what it is designed to assess consistently? The concept of
reliability underlies the computation of the error of measurement of a single score.
Reliability refers to the degree to which scores are free from errors of measurement.
Understanding the reliability of a measure enables us to predict the range of fluctuation
likely to occur in a single individual’s score as a result of irrelevant or chance factors. In its
broadest sense, reliability indicates the extent to which individual differences in test scores
are attributable to “true” differences in the characteristics under review and the extent to
which they are attributable to chance errors or error variance (Anastasi, 1988).

7 Summary of the Evidence
Table 2 Fundamentals of Measurement
VALIDITY
Degree to which an instrument actually measures the construct
it purports to measure
RELIABILITY
Degree to which an instrument consistently measures the
construct
No single observation truly represents a person or climate. To know how trustworthy a
measure is, we examine the consistency among administrations. There are many reasons
why scores could be inconsistent. The amount of participant attention or concentration may
change from moment to moment. Over longer periods of time scores can change due to
physical growth, learning, changes in health and personality, as well as other factors.
A high level of reliability is a required ingredient for any measure that can be considered
useful for research or practice. A measure that is reliable can be used with confidence in
most settings or time periods. The use of a measure that has a low level of reliability is
useless for purposes of carrying out research or for designing change in organizations.
Decisions and conclusions that are drawn from measures that have low levels of reliability
are built on the types of chance and randomness that typically result in failure. Erroneous
and unfavorable decisions, which are unjust, disruptive and damaging, can result when they
are influenced by temporary variations in performance or by the choice of questions
included on a measure (Cronbach, 1984).
Finally, reliability is a necessary but not a sufficient condition for validity. In other words, a
measure cannot be valid if it is not reliable.
Kinds of Reliability
There could be as many varieties of test reliability as there are sources for variation and
conditions affecting test scores (Anastasi, 1988). The level of a measure's reliability is
assessed through a variety of statistical techniques. The two most common categories of
reliability are known as consistency over time and internal consistency.
Consistency over time is derived from the correlation of the scores from subjects who took
the instrument and then took it again at a later point in time. The main question addressed
is: “How likely is it that I will get a similar result when I take this measure again?” The
span of time from the first administration to the second can range from weeks to months
and is generally known as test-retest reliability. If the correlations between the subjects’
first and second score are greater than .70, the instrument is generally considered reliable
over time.
8 Summary of the Evidence
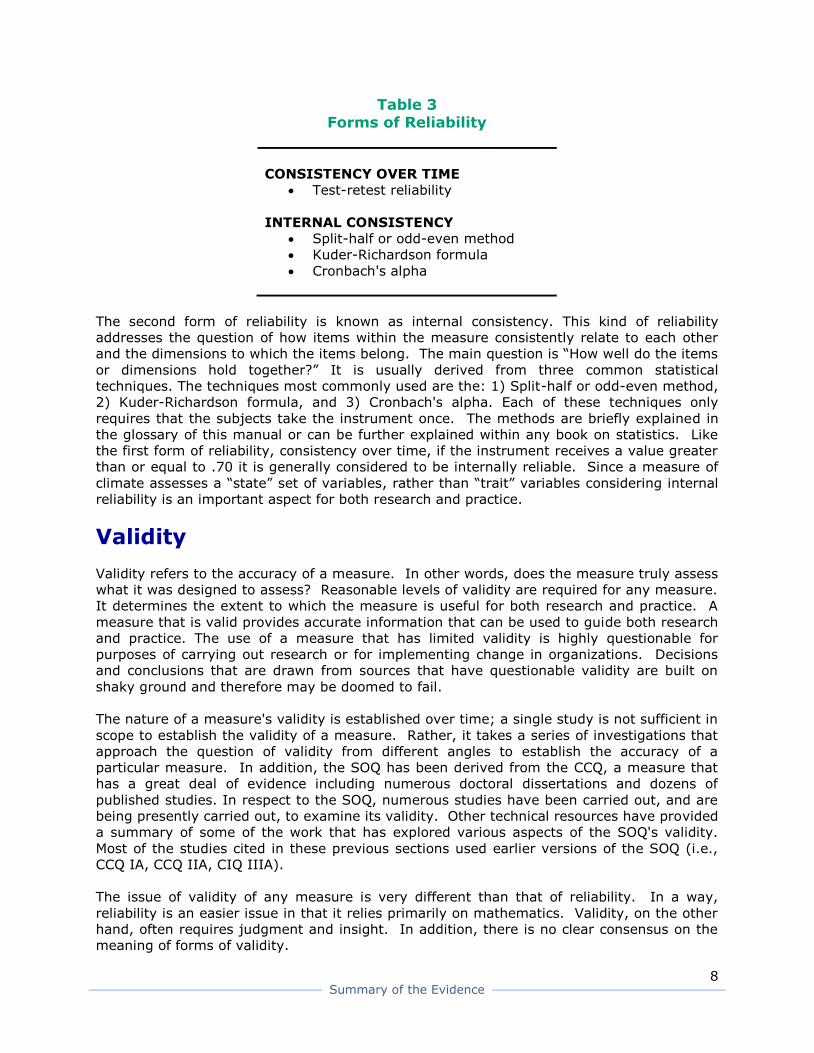
Table 3 Forms of Reliability
CONSISTENCY OVER TIME
Test-retest reliability
INTERNAL CONSISTENCY
Split-half or odd-even method
Kuder-Richardson formula
Cronbach's alpha
The second form of reliability is known as internal consistency. This kind of reliability
addresses the question of how items within the measure consistently relate to each other
and the dimensions to which the items belong. The main question is “How well do the items
or dimensions hold together?” It is usually derived from three common statistical
techniques. The techniques most commonly used are the: 1) Split-half or odd-even method,
2) Kuder-Richardson formula, and 3) Cronbach's alpha. Each of these techniques only
requires that the subjects take the instrument once. The methods are briefly explained in
the glossary of this manual or can be further explained within any book on statistics. Like
the first form of reliability, consistency over time, if the instrument receives a value greater
than or equal to .70 it is generally considered to be internally reliable. Since a measure of
climate assesses a “state” set of variables, rather than “trait” variables considering internal
reliability is an important aspect for both research and practice.
Validity
Validity refers to the accuracy of a measure. In other words, does the measure truly assess
what it was designed to assess? Reasonable levels of validity are required for any measure.
It determines the extent to which the measure is useful for both research and practice. A
measure that is valid provides accurate information that can be used to guide both research
and practice. The use of a measure that has limited validity is highly questionable for
purposes of carrying out research or for implementing change in organizations. Decisions
and conclusions that are drawn from sources that have questionable validity are built on
shaky ground and therefore may be doomed to fail.
The nature of a measure's validity is established over time; a single study is not sufficient in
scope to establish the validity of a measure. Rather, it takes a series of investigations that
approach the question of validity from different angles to establish the accuracy of a
particular measure. In addition, the SOQ has been derived from the CCQ, a measure that
has a great deal of evidence including numerous doctoral dissertations and dozens of
published studies. In respect to the SOQ, numerous studies have been carried out, and are
being presently carried out, to examine its validity. Other technical resources have provided
a summary of some of the work that has explored various aspects of the SOQ's validity.
Most of the studies cited in these previous sections used earlier versions of the SOQ (i.e.,
CCQ IA, CCQ IIA, CIQ IIIA).
The issue of validity of any measure is very different than that of reliability. In a way,
reliability is an easier issue in that it relies primarily on mathematics. Validity, on the other
hand, often requires judgment and insight. In addition, there is no clear consensus on the
meaning of forms of validity.

9 Summary of the Evidence
There are no fixed rules for deciding what high levels of validity are versus low levels of
validity. Studying a measure’s validity can be primarily based on logic (face or content), or
based on statistics or empirical examination (construct or a criterion-related form of validity
like concurrent, predictive or criterion-related).
Table 4
Forms of Validity
CONSTRUCT VALIDITY
Does the inventory measure what it intends to measure?
PREDICTIVE VALIDITY
Does the measure predict future performance?
CONTENT VALIDITY
Does the inventory assess the domain it claims to measure?
CONCURRENT VALIDITY
Is the inventory related to other valid measures of the same
construct?
Forms of Validity (The 1985 Standards)
There are various forms of validity. These were put forward by an earlier version of the
Standards for Educational and Psychological Tests (1985). One of the “lightest” forms is
called face validity. This typically means that the items, dimensions or scales look
appropriate. Most researchers would call face validity the least important indicator of a
measure’s soundness or adequacy.
Construct validity involves an effort to understand the meaningfulness of the instrument and
the rationale that lies behind the measure. It attempts to answer the question: Does the
assessment measure what it is intended to measure? When it comes to construct validity,
there may be no natural criterion upon which to claim validity for a measure. For many,
construct validity refers to the entire body of accumulated evidence surrounding a measure.
Content validity is concerned with the degree to which a measure represents knowledge or
behaviors from the domain it purports to measure. According to Jaeger (1990) content
validity is not determined through statistical procedures, but is assessed on the basis of
sound judgment. In order to assess the content validity of a measure, the content (items,
dimensions, scales, etc.) are examined in detail. Some of the ways to examine content
validity include Q-sort methods, inter-subjective verification of items, etc. For example, the
items within a creative climate measure should be able to be reviewed and classified by
reasonably informed groups and should cluster onto the theoretical dimensions. Further,
the specific dimensions measured by a creative climate assessment should have support in
the published scientific literature on the topic.
Predictive validity is sometimes also referred to as criterion validity, particularly when the
focus is on how well scores on one measure relate to some other criterion measure.

10 Summary of the Evidence
When this kind of validity is high, we can use the scores on one measure to predict
performance on the criterion variable. Evidence for this form of validity is usually gained by
producing a validity coefficient (a correlation between the scores on the measure and a
specified criterion). A creative climate measure should be able to predict the level of job
satisfaction, reduced levels of work-related stress, increased levels of creative productivity,
etc.
Concurrent validity is when a measure demonstrates a clear and significant relationship with
another measure for which there is some evidence of validity. If one measure of the climate
for creativity can correlate significantly with another measure of climate that has already
shown some evidence of validity we can claim concurrent validity for the first measure.
Evidence of Validity (The 1999 Standards)
The new standards published for educational and psychological tests have revised the
terminology associated with validity (American Educational Research Association, American
Psychological Association, & the National Council on Measurement in Education, 1999). The
new terms are designed to reflect the point of view that validity is not something to be
“typed.” Instead, there are different lines of validity evidence. As a result, this section will
use the more current terminology.
These lines of evidence include:
Evidence based on test content – an analysis on the relationship between a test’s
content and the construct it is intended to measure.
Evidence based on response processes – the analysis of response processes
concerning the fit between the construct and the detailed nature of performance or
response in which respondents engage.
Evidence based on internal structure – analysis of the internal structure of a test
indicating the degree to which the items conform to the construct.
Evidence based on relations to other variables – analysis of the relationship of test
scores to variables external to the test.
Ultimately, any user of an assessment needs to be concerned about the usability of the
measure. Of course, there is no point in using a measure unless we can have some
confidence in its results, but at some point a user must consider its functional or application
potential. Usability is concerned with a number of practical issues. Once the user is satisfied
that there is sufficient reliability and validity evident, attention must be focused on how long
it takes to complete the measure, how easily it is scored and interpreted, the cost of the
assessment, etc.
When you think about answering the question: What is a “good” assessment, you will need
to know that it makes sense and that it works. Making sense is often a matter of having
clear definitions of the concepts that are based on solid frameworks and theory. Having
tight definitions provide the borders of the measure so that you know what it assesses, and
what it does not assess. Knowing that a measure works is based on how reliable and valid
it is, as well as how useful and helpful it is.

11 Summary of the Evidence
References
American Educational Research Association, American Psychological Association, National
Council on Measurement in Education (1985). Standards for educational and psychological
testing. Washington, DC: American Educational Research Association.
American Educational Research Association, American Psychological Association, National
Council on Measurement in Education (1999). Standards for educational and psychological
testing. Washington, DC: American Educational Research Association.
Anastasi, A. (1988). Psychological testing (6th edition). New York: Macmillan Publishing.
Cronbach, L. J. (1984). Essentials of psychological testing (4th ed). New York: Harper &
Row Publishers.
Jaeger, R.M. (1990). Statistics: A spectator sport (2nd ed.). London: Sage.
Pedhazur, E. J., & Schmelkin, L. P. (1991). Measurement, design and analysis: An
integrated approach. Hillsdale, New Jersey: Lawrence Erlbaum Associates.

12 Summary of the Evidence
CHAPTER 2 A Summary of the Evidence
The Situational Outlook Questionnaire® (SOQ) is based on clear conceptual foundations and
has been the subject of continuous research and development for more than 50 years. This
means that the SOQ has more than adequate evidence regarding its reliability and validity.
The purpose of this chapter is to provide a representative summary of this evidence.
Evidence of SOQ’s Reliability
Reliability refers to the stability or consistency of a measure from one use to the next (test-
retest) or the stability of the measure itself (internal reliability). Below you will find a
representative listing of research findings for consistency over time and the internal
consistency of the SOQ.
Consistency over Time
• A longitudinal study of a product development project in a high-tech company was
conducted across a three-year period with the climate being measured every three
months. The results showed that the dimensions possessed good reliability using
aggregated scores.
• Similar comparisons using the current version of SOQ show good reliability using
aggregated scores. Specifically, four different groups of respondents within one
global organization took the SOQ as a part of the leadership development initiative
over seven months. There were no significant differences in their assessment of the
same organization over time.
Internal Reliability
Internal consistency is a measure of precision and deals with how items are related to
its own scale rather than to other scales. This is also referred to as internal reliability. We
would want the dimensions of the SOQ to be relatively stable over time, as well as have the
items consistently correlate with their respective scales.
• The results of analysis with the Scandinavian precursor (CCQ) show very high
levels of internal consistency for the version translated into English.
• Analysis for previous versions of the SOQ reports ranges of Cronbach’s Alphas:
.52-.90; Guttman split-half: .54-.86; and Spearman Brown: .57-.89.
• Analysis for the current version of SOQ reports Cronbach’s Alpha ranges for 8 of
the 9 dimensions from .79 - .89, which exceeds the accepted criteria of .70 for
internal consistency. Trust/Openness is the only dimension not to fall into this range
with a reported alpha of .69 - very close to the standard of .70.

13 Summary of the Evidence
Consistency of Format
• Substantial correlations were found between the paper and web-based version of
the SOQ. Analysis of Variance on these results showed no significant differences
between results from either form of the measure.
Evidence of SOQ’s Validity
Validity refers to the accuracy of a measure. A variety of kinds of evidence can and should
be collected to support the validity of any measure. The list below summarizes many of the
more detailed findings presented in the other technical resources.
Evidence based on test content
Evidence based on test content includes an analysis on the relationship between a test’s
content and the construct it is intended to measure.
• A comprehensive study of the climate literature focusing on the 50 most pertinent
works provided evidence for all the dimensions of the SOQ.
• Multiple Q-sort studies conducted also provide support that the SOQ’s items and
dimensions measure the domain they are designed to assess.
• Comparison of R&D departments with different kinds of innovation (adaptive or
incremental versus innovative and radical) using the dimensions of the SOQ have
shown predictable and clear differences.
• Research on best-practice versus normal practice research and development teams
has shown the dimensions of the SOQ discriminate between these types of teams.
• Studies on quality of care in primary care centers and day-homes for children have
shown that the dimensions of the SOQ have picked up on observed differences.
• Dimensions of the SOQ have demonstrated relationships that sort groups based on
their number and kind of rewards given for effective performance on the job.

14 Summary of the Evidence
Evidence based on response processes
Evidence based on response processes includes the analysis of response processes
concerning the fit between the construct and the detailed nature of performance or
response in which respondents engage.
• Studies to ensure that the dimensions of the SOQ are measuring an organizational
attribute, rather than an individual one, have shown consistent significant
discrimination among multiple departments within a large industrial company.
• Research studies of patterns of interaction in work-groups – offensive and
defensive action – routines, show appropriate and significant correlations between
dimensions of the SOQ and perceived patterns of interaction.
• Multiple studies examining the relationship between individual psychological climate
(using the SOQ) and other distinct constructs of cognitive style (KAI), problem
solving style (VIEW), and psychological type (MBTI) show few modest correlations.
This provides support that the interpersonal domain of climate is distinct from the
intrapersonal domain of style.
• Comparison studies of various divisions or subsidiaries within organizations has
shown that the dimensions of the SOQ can and do discriminate among them;
particularly when considering factors relating to creativity, innovation and change.
• The SOQ has been able to discriminate the nature of the working environment
between magnet (those having more discretion) and non-magnet hospitals.
Evidence based on internal structure
Evidence based on internal structure includes analysis of the internal structure of a test
indicating the degree to which the items conform to the construct.
• Consistent examination of multiple exploratory factor analyses on all versions of
the SOQ have shown an increasingly clear factor structure that shows the items of
the measure falling on their respective dimensions.
• Confirmatory factor analysis with 225 samples of convenience (N = 7,345) resulted
in a GFI of 0.88, an AGFI of 0.87, an NFI of 0.89, and a RMSEA of .047, indicating an
adequate fit of the nine-dimensional model.
Evidence based on relations to other variables
Evidence based on relations to other variables includes analysis of the relationship of test
scores to variables external to the test.
Dimensions of the SOQ show significant correlations with a number of effect
(dependent) variables including:
Warr’s Well-Being Scales, having to do with psychological well-being
Job-satisfaction

15 Summary of the Evidence
Sources of Pressure in Your Job (SPIYP), a measure of occupational stress
Survey of Creative and Innovative Performance (SCIP), a measure of creative
productivity and kinds of creative products developed
Numbers of patents produced
Numbers of suggestions contributed to suggestion systems
Dimensions of the SOQ show significant correlations with a number of antecedent
variables including:
Organizational Value Scales (multiple studies)
Leadership Style
Innovation Strategy
Dimensions of the SOQ show significant correlations with:
Work Environment Scale, assessing related social factors at work.
Scales on the Work Environment Inventory (WEI-later named KEYS), another
commercially available measure of the work environment for creativity.
Organizational Value Scales (multiple studies), showing the significant relationship
between values relating to structure, people and development and the dimensions
assessed by the SOQ.
Multi-method research comparing the quantitative and qualitative portions of the
SOQ have shown confirmatory support for the dimensions of climate.
Research using Nystrom’s method for determining the level of innovation of
organizations has shown clear and significant differences on all SOQ dimensions
between innovative and stagnated organizations.
Dimensions of the SOQ clearly separate people’s perceptions of the best and worst
work environments.
Dimensions of the SOQ demonstrate clear and significant differences between
people’s perceptions of their most and least creative teamwork experiences.
The SOQ shows significant correlations with measures of employee recognition for
making new contributions to the organization.
The SOQ demonstrates statistically significant ability to discriminate on measures of
perceived support for creativity on the job.
The SOQ demonstrates the ability to significantly discriminate levels of leadership
support for creating an environment that supports innovation.
The SOQ demonstrates the ability to significantly discriminate levels of success with
both incremental and radical innovation.
The SOQ demonstrates the ability to significantly discriminate levels of
empowerment for making decisions locally (within the meaningful and proximal work
unit) about innovation.

16 Summary of the Evidence
The SOQ demonstrates the ability to significantly discriminate the degree to which
people consider consumer insight and needs more than technology push in
innovation efforts.
The SOQ demonstrates the ability to significantly discriminate levels of uncertainty
avoidance in the workplace.
The SOQ demonstrates the ability to significantly discriminate levels of support for
implementing new ideas within work units and overall success with innovation.
The SOQ demonstrates the ability to significantly discriminate the degree to which
people in an organization believe in and promote both diversity and inclusion.
Usability
Usability is concerned with a number of practical issues. Once the user is satisfied that
there is sufficient reliability and validity evident, attention must be focused on how long it
takes to complete the measure, how easily it is scored and interpreted, the cost of the
assessment, etc.
Over 50 years of inquiry into the dimensions that capture the perceived patterns of behavior
that characterize the work-life and psychosocial environment that supports creativity,
innovation, and change has resulted in rather substantial evidence of reliability and validity.
The SOQ, along with its Scandinavian precursor, has also demonstrated high levels of
usefulness and practical utility for those who lead and manage organizations.
The SOQ has been applied within hundreds of organizations to help them assess their
readiness and ability to develop a work environment that supports creativity, innovation and
change. More recently, the SOQ has been successfully applied to help cross-functional
teams assess their work environment and to help leaders better understand their role in
creating a climate that engages and enables people.
Over the years, the dimensions have weathered a variety of versions, statistical evaluations,
and structural modifications all designed to improve their accuracy and precision as tools to
improve the working climate for creative productivity in all sorts of organizations. The next,
and final, chapter in this section outlines the kinds of research and development that will
help continue this journey.
17 Summary of the Evidence
Chapter 3 Alternative Benchmarks
A benchmark is a standard by which something can be measured or judged. The hope is
that by using specified standards better comparisons can be made in order to make
improvements. The earliest, and most widely applied climate benchmarks have been the
work done by Göran Ekvall to illustrate the differences between innovative and stagnated
organizations. This work was done during the 1980’s and 1990’s so some people may
discount their value, but we have continued to examine the dimensions and have quite a
few additional benchmarks you can use to help your clients.
Innovative and Stagnated Organizations
Ekvall collaborated with Harry Nyström on a unique program of research. They applied a
comprehensive innovation audit on 30 international organizations and were able to clearly
differentiate those organizations that were innovative (they invested in new products that
increase the likelihood of long-term survival and commercial success) from those that were
stagnated (unsuccessful in creating new products and experienced troubled commercial
performance).
These are the most widely used benchmarks to compare the innovative with the stagnated
climates within organizations. They provide clear directionality for the SOQ dimensions that
has been supported by many more recent studies. They can help those who receive their
SOQ results decide upon which dimensions to focus. The emphasis should be upon their
own strategy and conditions rather than using these benchmarks as “absolutes.”
Citation:
Ekvall, G. (1996). Organizational climate for creativity and innovation. Journal of Work and
Organizational Psychology, 5 (1), 105-123.
Nyström, H. (1990). Technological and market innovation: Strategies for product and
company development. London: Wiley.

18 Summary of the Evidence
Table 5 Innovative and Stagnated Organizations
SOQ Dimensions
Innovative
organizations
(n=10)
Mean
Stagnated
organizations
(n=5)
Mean
ANOVA
Sig.
Challenge/Involvement 238 163 <.001
Freedom 210 153 <.001
Trust/Openness 178 128 <.05
Idea-Time 148 97 <.001
Playfulness/Humor 230 140 <.001
Conflict 78 140 <.01
Idea-Support 183 108 <.001
Debate 158 105 <.001
Risk-Taking 195 53 <.01

19 Summary of the Evidence
Leadership Support of Innovation
Participants were asked to respond to an additional question when completing the SOQ.
The question was: Leaders and managers I observe are effective in creating an environment
that supports innovation. The Akkermans study included 140 participants from 103
companies and 31 industries, Retz included 180 participants from aerospace engineering,
and the Adolfsen study included 57 participants from Volvo and Wärtsilä.
Citations:
Isaksen, S. G., & Akkermans, H. (2011). Creative climate: A leadership lever for
innovation. Journal of Creative Behavior, 45, 161-187.
Akkermans, H. (2008). Leadership behavior and climate: A multi-method exploratory
investigation of SOQ and proximal leadership behaviors that help and hinder innovation. An
unpublished thesis for the Masters degree in Business Economics, VLEKHO Hogeschool for
Science and Art. (140 participants)
Retz, K. (2011). Factors that affect the climate for creativity and innovation in an
Aerospace Engineering Organization. Unpublished Doctoral Dissertation. Doctor of Business
Management, Apollos University. (180 participants)
Adolfsen, J., Stojcecski, T., & Lampeskeper J. (2013) Influence of Leadership Characteristics
on Creative Climate In Research and Development Teams. Executive MBA, Gothenburg
University. (57 participants)
Table 6 Leadership Support of Innovation
SOQ Dimensions
LSI “fairly
applicable” or
“applicable to a
high degree”
(n=189)
LSI “not at all”
or “to some
extent”
(n=194)
F ANOVA
Sig.
Mean Mean
Challenge/Involvement 239 178 130.502 <.001
Freedom 203 147 71.011 <.001
Trust/Openness 213 156 87.526 <.001
Idea-Time 182 112 113.138 <.001
Playfulness/Humor 213 151 102.428 <.001
Conflict 64 116 55.771 <.001
Idea-Support 222 135 210.448 <.001
Debate 223 164 94.420 <.001
Risk-Taking 186 115 141.685 <.001

20 Summary of the Evidence
Most and Least Creative Teams
Participants in a global professional services organization were asked to identify their most
and least creative team experience before completing a short form of the SOQ. The
definition provided to them regarding the most creative team was one that produced
something that was: new, unique, or original; valuable, relevant and useful; and accepted,
produced results, and made a positive impact. The least creative team was described for
them as one that produced something that was: well within previous practice or standard,
where they “reinvented the wheel;” useless or valueless; and was rejected or produced very
little or no impact.
Citation:
Isaksen, S. G., & Lauer, K. J. (2002). The climate for creativity and change in teams.
Creativity and Innovation Management Journal, 11, 74-86.
Table 7
Most and Least Creative Teams
SOQ Dimensions
Most creative
teams
(n=154)
Least creative
teams
(n=154) F
ANOVA
Sig.
Mean Mean Challenge/Involvement 256 94 410.34 <.001
Freedom 193 101 946.68 <.001
Trust/Openness 248 79 494.59 <.001
Idea-Time 219 59 461.34 <.001
Playfulness/Humor 230 68 360.96 <.001
Conflict 16 113 131.02 <.001
Idea-Support 213 65 421.72 <.001
Debate 228 77 453.02 <.001
Risk-Taking 208 61 322.94 <.001

21 Summary of the Evidence
Best and Worst Case Workplaces
Two studies examined the differences in people’s perceptions of the climate in their best and
worst-case work experiences. Participants reflected on their previous work experiences and
were given the following written instructions: “The purpose of this questionnaire is to
examine your experience working in a situation you would consider to be the most
supportive of your creativity. From your memory of that ‘best case’ situation, please rate
that environment on the following statements by circling the appropriate number on the
scale below the statement.” Similar instructions phrased for “least supportive” and “worst-
case” were provided on another form. To ensure that the participants had a clear
retrospective focus, they were asked to write down a description of the specific work
situation before completing the climate assessments.
Citations:
Aerts, W. (2008). An exploratory investigation into the relationships between VIEW An
Assessment of Problem Solving Style and Best and Worst-case work climates. An
unpublished thesis for the Masters degree in Business Economics, VLEKHO Hogeschool for
Science and Art. Brussels, Belgium.
Isaksen, S. G., & Aerts, W. S. (2011). Linking problem-solving style and creative
organizational climate: An exploratory interactionist study. The International Journal of
Creativity & Problem Solving, 21, 7-38.
Isaksen, S. G., Aerts, W. S., & Isaksen, E. J. (2009). Creating More Innovative Workplaces:
Linking Problem-Solving Style and Organizational Climate. Orchard Park, NY: The Creativity
Research Unit of the Creative Problem Solving Group, Inc.
Isaksen, S. G., Lauer, K. J., Ekvall, G., & Britz, A. (2001). Perceptions of the best and
worst climates for creativity: Preliminary validation evidence for the Situational Outlook
Questionnaire. Creativity Research Journal, 13, 171-184.
Table 8
Best and Worst Case Workplaces
SOQ Dimensions
(n=459)
Best-case
(n=459)
Worst-case
(n=459) F ANOVA
Sig. Mean Mean
Challenge/Involvement 240 107 899.48 <.001
Freedom 208 105 463.93 <.001
Trust/Openness 222 91 699.57 <.001
Idea-Time 200 73 830.55 <.001
Playfulness/Humor 234 88 892.94 <.001
Conflict 65 161 289.82 <.001
Idea-Support 219 73 1118.72 <.001
Debate 213 98 644.93 <.001
Risk-Taking 200 70 697.59 <.001

22 Summary of the Evidence
Perceived Support of Creativity
The relationship between mean ratings of the nine dimensions that make up the Situational
Outlook Questionnaire and the self-perception of the organizational climate as conducive (or
not conducive) to creativity was tested with a sample of 1,830 individuals from a variety of
organizations. Participants were categorized on their level of perceived support for
creativity. The results indicated that the means of all nine dimensions of the Situational
Outlook Questionnaire were different for each level of perceived support for creativity in the
work environment. The difference was statistically significant for each level. The results of
this study indicated that the Situational Outlook Questionnaire is able to discriminate
effectively among different levels of perceived support for creativity in the immediate work
environment.
Citation:
Isaksen, S. G. & Lauer, K. J. (2001). Convergent validity of the Situational Outlook
Questionnaire: Discriminating levels of perceived support for creativity. North American
Journal of Psychology, 3, 31-40.
Table 9 Perceived Support of Creativity
SOQ Dimensions
Not
supportive
(n=201)
Mean
To Some
Extent
(n=609)
Mean
Fairly
Supportive
(n=702)
Mean
Highly
Supportive
(n=318)
Mean
ANOVA
Sig.
Challenge
/Involvement 149 187 224 258 <.001
Freedom 136 169 205 238 <.001
Trust/Openness 110 168 213 251 <.001
Idea-Time 103 144 180 216 <.001
Playfulness/Humor 128 167 201 233 <.001
Conflict 98 141 176 215 <.001
Idea-Support 178 136 108 77 <.001
Debate 112 140 167 194 <.001
Risk-Taking 78 115 151 194 <.001

23 Summary of the Evidence
Successful Incremental Innovation
One hundred and eighty participants in the aerospace industry completed the full SOQ and
an additional question: “In general, my organization is successful at incremental
innovation.”
Citation:
Retz, K. (2011). Factors that affect the climate for innovation and creativity in aerospace
organizations (Unpublished doctoral dissertation). Apollos University, Huntington Beach,
CA. (180 participants)
Table 10 Successful Incremental Innovation
SOQ Dimensions
Not at all
applicable
(n=22)
Mean
Applicable
to some
extent
(n=67)
Mean
Fairly
applicable
(n=63)
Mean
Applicable
to a high
degree
(n=28)
Mean
F ANOVA
Sig.
Challenge
/Involvement 144 166 194 257 25.12 <.001
Freedom 92 139 160 234 25.47 <.001
Trust/Openness 106 155 171 224 18.14 <.001
Idea-Time 50 111 144 227 53.60 <.001
Playfulness/Humor 112 133 184 245 39.60 <.001
Conflict 145 108 87 80 4.04 .008
Idea-Support 64 130 175 244 52.52 <.001
Debate 91 156 196 254 45.58 <.001
Risk-Taking 48 108 146 219 52.07 <.001

24 Summary of the Evidence
Successful Radical Innovation
One hundred and eighty participants in the aerospace industry completed the full SOQ and
an additional question: “In general, my organization is successful at radical innovation.”
Citation:
Retz, K. (2011). Factors that affect the climate for innovation and creativity in aerospace
organizations (Unpublished doctoral dissertation). Apollos University, Huntington Beach,
CA. (180 participants)
Table 11 Successful Radical Innovation
SOQ Dimensions
SRI “fairly
applicable” or
applicable to a
high degree”
(n=50)
Mean
SRI “not at all”
or “to some
extent”
(n=130)
Mean
F ANOVA
Sig.
Challenge/Involvement 243 166 79.28 <.001
Freedom 205 136 40.42 <.001
Trust/Openness 210 148 38.77 <.001
Idea-Time 201 107 93.47 <.001
Playfulness/Humor 227 142 83.07 <.001
Conflict 75 111 7.85 .006
Idea-Support 219 131 70.36 <.001
Debate 232 156 54.58 <.001
Risk-Taking 193 108 76.19 <.001

25 Summary of the Evidence
Empowerment for Innovation
Three hundred and thirty-four employees of a global pharmaceutical company were
surveyed as a part of a global innovation audit. A question was added to the full SOQ to
determine the extent to which employees felt empowered to make decisions “in the
trenches” about their work on innovation.
Citation:
Isaksen, S. G., & Isaksen, E. J. (2010). The climate for creativity and innovation: And its
relationship to empowerment, consumer insight, and ambiguity. A technical report from the
Creativity Research Unit of the Creative Problem Solving Group, Inc.
Table 12
Empowerment for Innovation
SOQ Dimensions
Not at all
applicable
(n=24)
Mean
Applicable
to some
extent
(n=109)
Mean
Fairly
applicable
(n=152)
Mean
Applicable
to a high
degree
(n=49)
Mean
F ANOVA
Sig.
Challenge
/Involvement 236 224 240 271 14.72 <.001
Freedom 147 154 194 233 41.61 <.001
Trust/Openness 178 185 199 225 6.48 <.001
Idea-Time 97 110 152 186 36.04 <.001
Playfulness/Humor 189 173 206 226 12.89 <.001
Conflict 90 76 88 88 1.07 .362
Idea-Support 153 169 209 246 36.13 <.001
Debate 173 181 213 250 27.13 <.001
Risk-Taking 98 119 167 197 57.95 <.001

26 Summary of the Evidence
Consumer Insight Driving Innovation
Three hundred thirty-four employees of a global pharmaceutical company were surveyed as
a part of a global innovation audit. A question was added to the full SOQ to determine the
extent to which employees considered consumer insights and needs more than technology
when driving innovation.
Citation:
Isaksen, S. G., & Isaksen, E. J. (2010). The climate for creativity and innovation: And its
relationship to empowerment, consumer insight, and ambiguity. A technical report from the
Creativity Research Unit of the Creative Problem Solving Group, Inc.
Table 13
Consumer Insight Driving Innovation
SOQ Dimensions
Not at all
applicable
(n=15)
Mean
Applicable
to some
extent
(n=97)
Mean
Fairly
applicable
(n=158)
Mean
Applicable
to a high
degree
(n=64)
Mean
F ANOVA
Sig.
Challenge
/Involvement 224 229 237 261 8.61 <.001
Freedom 150 169 182 215 13.26 <.001
Trust/Openness 195 184 193 224 6.56 <.001
Idea-Time 106 116 149 159 12.21 <.001
Playfulness/Humor 183 186 198 215 3.48 .016
Conflict 97 79 92 71 2.53 .053
Idea-Support 149 174 204 228 18.11 <.001
Debate 189 189 210 223 6.12 <.001
Risk-Taking 111 129 160 171 14.32 <.001
27 Summary of the Evidence
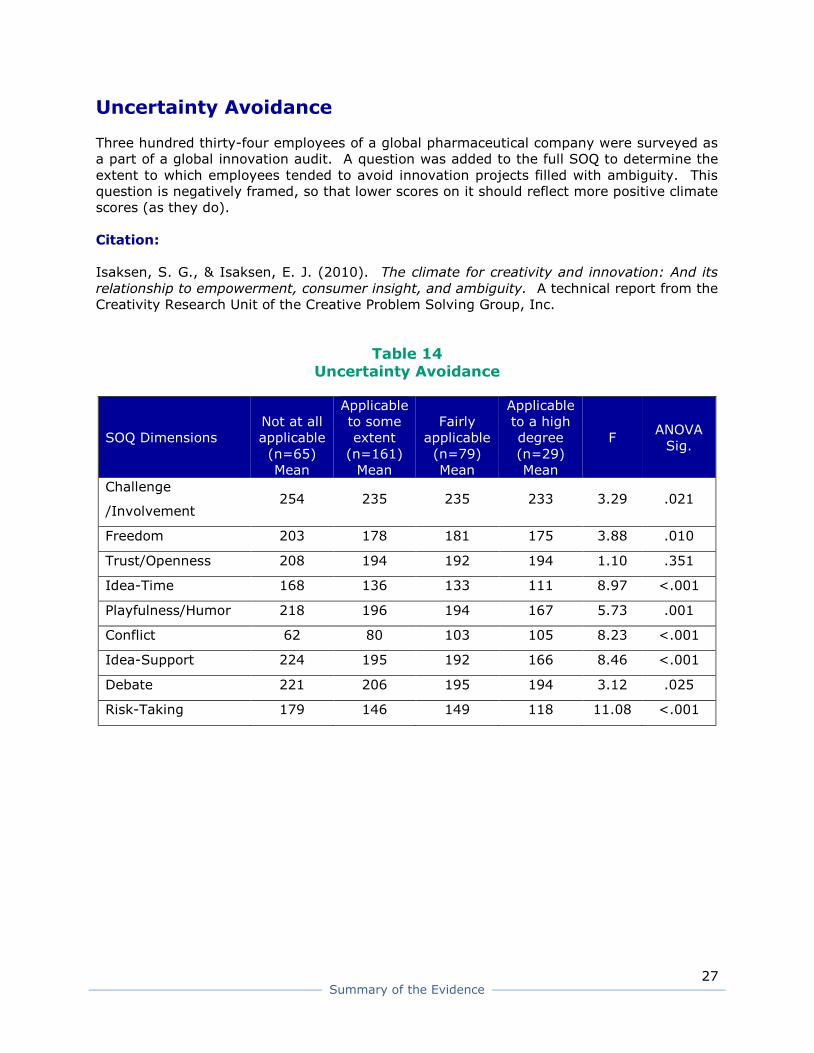
Uncertainty Avoidance
Three hundred thirty-four employees of a global pharmaceutical company were surveyed as
a part of a global innovation audit. A question was added to the full SOQ to determine the
extent to which employees tended to avoid innovation projects filled with ambiguity. This
question is negatively framed, so that lower scores on it should reflect more positive climate
scores (as they do).
Citation:
Isaksen, S. G., & Isaksen, E. J. (2010). The climate for creativity and innovation: And its
relationship to empowerment, consumer insight, and ambiguity. A technical report from the
Creativity Research Unit of the Creative Problem Solving Group, Inc.
Table 14 Uncertainty Avoidance
SOQ Dimensions
Not at all
applicable
(n=65)
Mean
Applicable
to some
extent
(n=161)
Mean
Fairly
applicable
(n=79)
Mean
Applicable
to a high
degree
(n=29)
Mean
F ANOVA
Sig.
Challenge
/Involvement 254 235 235 233 3.29 .021
Freedom 203 178 181 175 3.88 .010
Trust/Openness 208 194 192 194 1.10 .351
Idea-Time 168 136 133 111 8.97 <.001
Playfulness/Humor 218 196 194 167 5.73 .001
Conflict 62 80 103 105 8.23 <.001
Idea-Support 224 195 192 166 8.46 <.001
Debate 221 206 195 194 3.12 .025
Risk-Taking 179 146 149 118 11.08 <.001

28 Summary of the Evidence
Successful Implementation of New Ideas
For the purposes of this study, the SOQ was modified to include an additional question to
assess the level of proximal innovation. The question was: We are successful in
implementing new ideas to obtain results in my work unit. The aim of this question was to
assess the level of success with innovation within the more immediate working climate.
Citations:
Isaksen, S. G., & Akkermans, H. (2011). Creative climate: A leadership lever for
innovation. Journal of Creative Behavior, 45, 161-187.
Akkermans, H. (2008). Leadership behavior and climate: A multi-method exploratory
investigation of SOQ and proximal leadership behaviors that help and hinder innovation. An
unpublished thesis for the Masters degree in Business Economics, VLEKHO Hogeschool for
Science and Art. Brussels, Belgium. (140 participants)
Table 15 Successful Implementation of New Ideas
SOQ Dimensions
Not at all
successful
(n=4)
Mean
Successful
to some
extent
(n=35)
Mean
Fairly
successful
(n=58)
Mean
Successful
to a high
degree
(n=43)
Mean
F ANOVA
Sig.
Challenge
/Involvement 146 201 221 269 24.523 <.001
Freedom 188 153 200 233 10.054 <.001
Trust/Openness 130 164 181 233 14.844 <.001
Idea-Time 88 130 162 213 11.853 <.001
Playfulness/Humor 113 156 187 239 17.630 <.001
Conflict 175 116 95 46 10.925 <.001
Idea-Support 95 148 197 246 23.064 <.001
Debate 209 190 207 243 6.529 <.001
Risk-Taking 110 129 162 213 15.976 <.001

29 Summary of the Evidence
Successful Innovation
Omnibus Innovation was assessed by a closed-ended question: In general, my organization
has been successful at innovation. The aim of this question was to anchor the distal
perceptions of the respondents regarding the overall level of innovation success of their
organization.
Citations:
Isaksen, S. G., & Akkermans, H. (2011). Creative climate: A leadership lever for
innovation. Journal of Creative Behavior, 45, 161-187.
Akkermans, H. (2008). Leadership behavior and climate: A multi-method exploratory
investigation of SOQ and proximal leadership behaviors that help and hinder innovation. An
unpublished thesis for the Masters degree in Business Economics, VLEKHO Hogeschool for
Science and Art. Brussels, Belgium. (140 participants)
Table 16 Successful Innovation
SOQ Dimensions
Not at all
successful
(n=4)
Mean
Successful
to some
extent
(n=35)
Mean
Fairly
successful
(n=58)
Mean
Successful
to a high
degree
(n=43)
Mean
F ANOVA
Sig.
Challenge
/Involvement 204 200 226 264 14.774 <.001
Freedom 171 158 201 238 11.671 <.001
Trust/Openness 130 169 182 235 13.663 <.001
Idea-Time 59 128 170 215 15.197 <.001
Playfulness/Humor 154 159 192 235 11.717 <.001
Conflict 167 108 90 55 6.257 <.001
Idea-Support 110 150 201 248 23.514 <.001
Debate 175 190 210 247 8.548 <.001
Risk-Taking 100 124 169 219 22.900 <.001

30 Summary of the Evidence
Magnet and Non-Magnet Hospitals
The SOQ was applied to study nurses’ perceptions of climate in magnet versus non-magnet
Veterans Administration hospitals. Nurses in magnet hospitals experience more
empowerment, better support for clinical decision-making, and better patient outcomes.
Hospitals that achieve magnet status must demonstrate compliance with standards of care
and professional performance.
Citation:
Erickson, D. (2010). The climate for nursing creativity and risk-taking: A magnet
environment versus non-magnet environment. (Unpublished doctoral dissertation.) Capella
University, Minneapolis, MN.
Table 17
Magnet and Non-Magnet Hospitals
SOQ Dimensions Magnet
(n=30)
Mean
Magnet
(n=41)
Mean
F ANOVA
Sig.
Challenge/Involvement 219 205 0.895 .347
Freedom 193 169 2.485 .120
Trust/Openness 164 164 0.001 .980
Idea-Time 177 113 15.744 <.001
Playfulness/Humor 198 185 0.543 .464
Conflict 109 108 0.004 .950
Idea-Support 195 151 6.257 .015
Debate 213 182 5.445 .023
Risk-Taking 172 125 8.815 .004

31 Summary of the Evidence
Belief in Diversity
An SOQ intervention was undertaken in 2010 at a large American university. The total
sample was 525 individuals across a wide variety of roles in the university. One of the main
focuses of the intervention was to gauge their diversity and inclusion efforts. This allowed
CPSB to also look into the relationships between these efforts and the perceived climate for
creativity and innovation. The additional question was: “People here believe the staff is
diverse.”
Table 18 Belief in Diversity
SOQ Dimensions
Not at all
applicable
(n=15)
Mean
Applicable
to some
extent
(n=101)
Mean
Fairly
applicable
(n=181)
Mean
Applicable
to a high
degree
(n=228)
Mean
F ANOVA
Sig.
Challenge
/Involvement 140 169 197 204 9.78 <.001
Freedom 118 150 158 165 3.418 .017
Trust/Openness 89 128 154 157 7.673 <.001
Idea-Time 89 119 141 152 7.824 <.001
Playfulness/Humor 112 152 171 178 6.756 <.001
Conflict 169 138 106 104 6.244 <.001
Idea-Support 84 133 167 167 9.503 <.001
Debate 132 148 174 183 7.939 <.001
Risk-Taking 99 111 139 138 6.305 <.001

32 Summary of the Evidence
Promoting Diversity
An SOQ intervention was undertaken in a large American university. The total sample was
525 individuals across a wide variety of roles in the university. One of the main focuses of
the intervention was to gauge their diversity and inclusion efforts. This allowed CPSB to also
look into the relationships between these efforts and the perceived climate for creativity and
innovation. The additional question was: “People here strongly promote diversity.”
Table 19
Promoting Diversity
SOQ Dimensions
Not at all
applicable
(n=25)
Mean
Applicable
to some
extent
(n=85)
Mean
Fairly
applicable
(n=201)
Mean
Applicable
to a high
degree
(n=214)
Mean
F ANOVA
Sig.
Challenge
/Involvement 131 142 190 223 45.93 <.001
Freedom 120 128 155 179 17.78 .017
Trust/Openness 68 106 147 176 35.95 <.001
Idea-Time 81 90 137 169 38.59 <.001
Playfulness/Humor 118 132 162 196 27.75 <.001
Conflict 185 156 109 91 18.85 <.001
Idea-Support 62 96 159 193 55.31 <.001
Debate 107 129 166 201 38.87 <.001
Risk-Taking 71 90 131 156 35.85 <.001
33 Summary of the Evidence
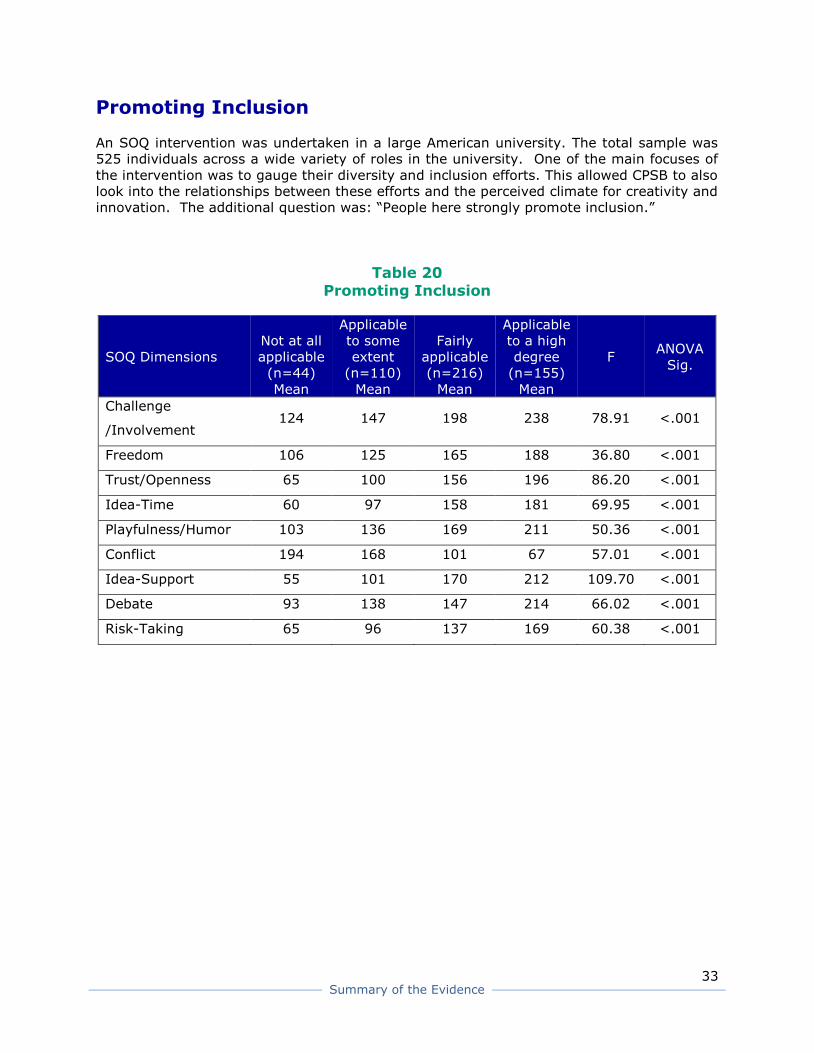
Promoting Inclusion
An SOQ intervention was undertaken in a large American university. The total sample was
525 individuals across a wide variety of roles in the university. One of the main focuses of
the intervention was to gauge their diversity and inclusion efforts. This allowed CPSB to also
look into the relationships between these efforts and the perceived climate for creativity and
innovation. The additional question was: “People here strongly promote inclusion.”
Table 20
Promoting Inclusion
SOQ Dimensions
Not at all
applicable
(n=44)
Mean
Applicable
to some
extent
(n=110)
Mean
Fairly
applicable
(n=216)
Mean
Applicable
to a high
degree
(n=155)
Mean
F ANOVA
Sig.
Challenge
/Involvement 124 147 198 238 78.91 <.001
Freedom 106 125 165 188 36.80 <.001
Trust/Openness 65 100 156 196 86.20 <.001
Idea-Time 60 97 158 181 69.95 <.001
Playfulness/Humor 103 136 169 211 50.36 <.001
Conflict 194 168 101 67 57.01 <.001
Idea-Support 55 101 170 212 109.70 <.001
Debate 93 138 147 214 66.02 <.001
Risk-Taking 65 96 137 169 60.38 <.001

34 Summary of the Evidence
Considering Viewpoints from Diverse Populations
An SOQ intervention was undertaken in a large American university. The total sample was
525 individuals across a wide variety of roles in the university. One of the main focuses of
the intervention was to gauge their diversity and inclusion efforts. This allowed CPSB to also
look into the relationships between these efforts and the perceived climate for creativity and
innovation. The additional question was: “People here consider viewpoints from diverse
populations when making decisions.”
Table 21
Considering Viewpoints from Diverse Populations
SOQ Dimensions
Not at all
applicable
(n=44)
Mean
Applicable
to some
extent
(n=110)
Mean
Fairly
applicable
(n=216)
Mean
Applicable
to a high
degree
(n=155)
Mean
F ANOVA
Sig.
Challenge
/Involvement 100 152 204 250 168.17 <.001
Freedom 94 133 163 200 60.35 <.001
Trust/Openness 60 106 161 202 117.98 <.001
Idea-Time 53 103 152 189 102.12 <.001
Playfulness/Humor 105 132 174 218 72.39 <.001
Conflict 211 147 100 64 64.76 <.001
Idea-Support 42 103 175 227 223.53 <.001
Debate 89 140 178 222 98.69 <.001
Risk-Taking 64 95 145 172 83.77 <.001

35 Summary of the Evidence
Work Engagement
This study applied the SOQ and the Utrecht Work Engagement Scale with 95 employees of a
major Ministry in Bergen, Norway. All dimensions of the SOQ correlated significantly with
work engagement, with Challenge and Involvement having the highest r value of .71
(p<.0001). Regression analysis showed that higher scores on Challenge and Involvement
and slightly lower scores on Debate were good predictors of engagement (B = .831;
F=50.63, p<0001).
Citations:
Dahl, T. J., & Nyland, R. B. (2013). Climate for job engagement: A win-win situation.
(Unpublished Master of Management Thesis on Human Resource Management). Bergen,
Norway: Norwegian Business School.
Schaufeli, W. B., & Bakker, A. B. (2006). The measurement of work engagement with a
short questionnaire: A cross-national study. Educational and Psychological Measurement,
66, 7-1-716.
Table 22
Work Engagement
SOQ Dimensions
Low
(n=11)
Medium
(n=59)
High
(n=25) F ANOVA
Sig. Mean Mean Mean
Challenge
/Involvement 130 191 234 32.56 <.001
Freedom 136 155 189 7.66 .001
Trust/Openness 122 164 193 7.96 .001
Idea-Time 118 118 152 5.19 .007
Playfulness/Humor 115 175 205 11.82 <.001
Conflict 117 87 83 1.46 n.s.
Idea-Support 113 151 176 5.40 .006
Debate 145 188 210 5.11 .008
Risk-Taking 102 128 160 8.37 <.001

36 Summary of the Evidence
Level of Collaboration
This study applied the SOQ and a collaborative relationship survey with 222 employees
working in the third-part logistics industry. Collaboration was defined as occurring when two
or more independent companies work jointly to plan and execute operations with greater
success than when acting alone (Nyaga, Whipple, & Lynch, 2010). Collaborative
relationships stress an exchange of information, knowledge, complementary resources and
capabilities, and relational asset specific investments (Klein & Rai, 2009).
Citations:
Bushart, R. (2015). Examining the relationships between collaborative relationships and
organizational innovation within the third-part logistics industry. Unpublished Doctoral
Dissertation. Phoenix, Arizona: Northcentral University.
Klein, R. & Rai, A. (2009). Inter-firm strategic information flows in logistics supply chain
relationships. MIS Quarterly, 33(1), 4-19.
Nygaga, G. N., Whipple, J. M., & Lynch, D. F. (2010). Examining supply-chain relationships:
Do buyer and supplier collaborative relationships differ? Journal of Operations Management,
28, 101-114.
Table 23 Level of Collaboration
SOQ Dimensions Low
(n=30)
Mean
High
(n=41)
Mean
F ANOVA
Sig.
Challenge/Involvement 182 219 31.339 <.001
Freedom 152 195 24.569 <.001
Trust/Openness 182 206 17.101 <.001
Idea-Time 149 186 23.321 <.001
Playfulness/Humor 190 208 4.287 .04
Conflict 132 111 3.589 .059
Idea-Support 155 205 31.131 <.001
Debate 169 192 11.523 .001
Risk-Taking 149 191 26.449 <.001