a subspace method for the blind extraction of a
TRANSCRIPT

A SUBSPACE METHOD FOR THE BLIND EXTRACTION OF ACYCLOSTATIONARY SOURCE
Roger Boustany, and Jerome Antoni
Mechanical Engineering Department, University of Technology of CompiegneCentre de Recherche de Royallieu, 60205, Compiegne, France
email:[email protected]
ABSTRACTThe need for blindly separating mixtures of source signals arises inmany signal processing applications. The solution to this problemwas found using emerging blind source separation (BSS) techniqueswhich rely on the knowledge of the number of independent sourcespresent in the mixture. This paper deals with the case where thenumber of sources is unknown and statistical independence maynot apply, but where there is only one signal of interest (SOI) to beseparated. We propose a method for extracting this SOI by exploit-ing its cyclostationarity through a subspace decomposition of theobservations. This method is first developed for instantaneous mix-tures and is then extended to the convolutive case in the frequencydomain where it does not suffer from the permutation problem asdoes classical BSS. Experiments on electrocardiogram and indus-trial data are finally performed and illustrate the high performanceof the proposed method.
1. INTRODUCTION
The problem of blindly separating instantaneous or convolutivemixtures of sources is encountered in many signal processing ap-plications. Among these, one can cite communications, radar andsonar systems, biomedical applications, the “cocktail party effect”and many other fields. The solution to this problem was foundusing emerging blind source separation techniques which usuallyrely on the assumption of the mutual statistical independence of thesources present in the mixture. Ways of ensuring the mutual in-dependence of the recovered sources include exploiting their non-gaussianity [1], their non-whiteness [2], or their non-stationarity —and particularly their cyclostationarity [3], [4], [5]. As a matterof fact, many (quasi-)periodic physical phenomena generate (quasi-)cyclostationary signals. Examples of these are the electrocardio-gram (ECG) measuring the electrical activity of the heart and thevibrations caused by rotating or reciprocating mechanical systems[6].However, in many situations, the number of sources is often un-known and may be greater than the number of sensors. Since classi-cal BSS needs the information on the number of sources and usuallyrelies on a greater number of measurement signals, it fails to dealwith such cases. Mutual statistical independence of the sources isanother restrictive condition which might not be respected in someapplications, like those involving mechanical systems.The purpose of this work is to propose a substitute approach to BSSin order to extract one cyclostationary source labelled “SOI” (forsignal of interest) drowned by an unknown number of interferingsources and noise. This subject was addressed in the communica-tions context for instantaneous mixtures in [7] where the authorsproposed a class of Spectral Self-Coherence Restoral (SCORE) al-gorithms which take advantage of the fundamental cyclic frequencyof the SOI. We propose a novel approach still exploiting the cy-clostionarity of the SOI but using a subspace decomposition of thedata. Unlike SCORE, the method decribed in this paper easily al-lows the use of several cyclic frequencies which yields a more ac-curate estimation of the SOI, and it requires the determination ofonly half the number of unknowns of SCORE. A frequency-domainextension to the convolutive case is also presented in order to cover
a broad range of applications.The paper is organized as follows. In section 2, we review the prob-lem of BSS, its formulation and its limitations. After a brief reviewof cyclostationary properties in section 3, a more suitable approachfor mixtures with an unknown number of sources and one cyclosta-tionary SOI is developed in section 4. An extension to convolutivemixtures is then described in section 5. Finally, we present experi-ments carried out on real world signals to illustrate the efficiency ofthe approach.
2. BLIND SOURCE SEPARATION AND EXTRACTION
Blind source separation consists of retrieving m unknown sources,s(t) = (s1(t),s2(t), . . . ,sm(t))T solely from the knowledge of n ob-servation signals x(t) = (x1(t),x2(t), . . . ,xn(t))T , t ∈ IR. Dependingon the application, the mixture model may be either instantaneous
x(t) = As(t)+n(t) (1)
or convolutivex(t) = H(t)∗s(t)+n(t), (2)
where ∗ is the convolution product, A and H(t) denote respectivelyfull rank “scalar” and linear filter matrices modelling the transfersbetween sources and sensors and n(t) is an additive noise uncorre-lated with the sources. A typical condition for the BSS to work well,is to have n ≥ m, that is more equations than unknowns. Anothersimplifying assumption is to consider the noiseless mixture model(n(t)≡ 0).However, in many situations, the number of sources m is unknownand the noise is considerable. We will focus on the problem wherethere is only one SOI. In this case, the BSS problem reduces to ablind signal extraction (BSE) problem. In particular, we are inter-ested in solving the situation where the mixture contains only onecyclostationary source at some cyclic frequency a . Then, insteadof using an independence criterion as in classical BSS, one can takeadvantage of the cyclostationarity of the SOI.The next section reviews some basics about cyclostationary signalsbefore presenting the principles of our BSE approach.
3. CYCLOSTATIONARY SIGNALS AND THEIR SECONDORDER DESCRIPTORS
In the following all signals are assumed of finite-power and stochas-tic. A second-order cyclostationary signal s(t) (CS signal) withcyclic frequencies a i ∈A is such that its auto-correlation functionis periodic and therefore admits a Fourier series expansion
Rs(t, t ) , IEs(t)s∗(t− t )= å
a i∈A
Ra is (t )e j2p a it , (3)
where the so-called cyclic auto-correlation functions Ra is (t ) are
non-identically zero over the set A .Second-order spectral statistics are very useful and will be neededlater. For instance, the auto-spectral correlation is defined by the

double Fourier transform of the auto-correlation function with re-spect to t and t as
Ss(a , f ) =∫ ∫
Rs(t, t )e− j2p a te− j2p f t dtdt ,
and becomes upon inserting Eq.(3)
Ss(a , f ) = åa i∈A
Sa is ( f )d (a − a i), (4)
which means that the power of a cyclostationary signal is distributedalong spectral lines parallel to the f -axis and positioned on thecyclic frequencies a = a i. The spectral quantity Sa i
s ( f ) is known asthe cyclic power spectrum and will turn out very useful for the BSEmethod relative to convolutive mixtures derived in section 5. TheBSE method for instantaneous mixtures described hereafter willonly take advantage of the cyclic auto-correlation function.
4. THE SUBLEX METHOD
4.1 Principles — general case
We first consider the noisy mixture described in Eq.(1). As statedpreviously, the SOI results from a single CS source with cyclic fre-quency a — all other sources and the noise are either stationary orCS with different cyclic frequencies. The cyclic correlation matrixof the observed mixture is:
Rax (t ) ,
⟨IE
x(t)xH(t− t )
e− j2p a t⟩
= A⟨IE
s(t)sH(t− t )
e− j2p a t⟩AH
= ARas (t )AH ,
with 〈(. . .)〉 = limT→¥
T−1∫ T/2
−T/2(. . .)dt. This is a rank 1 matrix be-
cause Ras (t ) has only one non-zero element on its diagonal and
this is true independently of the noise n(t). Therefore, it can berewritten as
Rax (t ) = Ra
sa (t )aa aHa ,
where Rasa (t ) is the cyclic auto-correlation function at lag t of the
cyclostationary source sa (t), and aa is the corresponding columnof matrix A. Thus the eigenvalue decomposition of Ra
x (t )Rax (t )H
will give column aa of A up to a scaling factor but this is notsufficient to separate the mixture. In order to extract the SOI,a complementary orthogonal subspace to aa is constructed. Letb2, . . . ,bn be n− 1 mutually orthogonal and unitary vectors span-ning an (n− 1)-dimensional vector space B orthogonal to aa .Then, the signals ri(t) = bH
i x(t) where i = 2, · · · ,n , are n−1 mu-tually orthogonal references on the interferences and orthogonal tosa (t). In a matrix form, we have
r(t) = BHx(t), (5)
where r(t) is the (n− 1)-dimensional vector of references on theinterferences. Note that the n× (n−1) matrix B is easily found byusing the QR method which is a fast, stable and numerically effi-cient implementation of the Gram-Schmidt orthogonalisation.The contribution of the interfering sources on the sensors denotedby x.sa (t) (i.e. x.sa (t) are the observation signals when the cy-clostationary source sa is switched off) is then estimated by meansquares:
x.sa (t) = Cr(t),
whereC = R0
xr(0)R0r (0)+,
with
R0xr(0) =
⟨IE
x(t)rH(t)
⟩
R0r (0) =
⟨IE
r(t)rH(t)
⟩,
and the superscript + denoting the Moore-Penrose pseudoinverse ofa matrix. The SOI contribution x/sa (t) (i.e. the observation signalswhen only the SOI sa is switched on) is finally extracted from thesensor signals as:
x/sa (t) = x(t)− x.sa (t)
=(I−CBH)
x(t). (6)
4.2 Assessment in the noiseless case
The proposed approach is designed to replace BSS algorithms in thenoisy case, when there is only one (cyclostationary) SOI. However,it now remains to prove that it does just as well in the noiselesscase — i.e. it achieves perfect separation of the SOI as BSS willthen do. In order to prove it, let us first assume — without loss ofgenerality — that the first source in vector s(t) is the SOI sa (t) andthat IEs(t)s(t)H= I.Then, let
A = QΩ =(
aa‖aa ‖ B
)Ω (7)
be the QR decomposition which provided matrix B in Eq.(5),where W is the n×m upper triangular matrix. Upon insertingEq.(7) into Eq.(5), we get r(t) = ( 0 Ω22 )s(t) with Ω22 the
(n−1)×(m−1) block of matrix of W such that Ω=(
W 11 Ω120 Ω22
).
This yields after some manipulations C = A
(0T
Ω+22
), where
Ω+22 = ΩH
22(Ω22ΩH22)
+ is the pseudoinverse of Ω22.Finally, substituting C in Eq.(6) by the former expression yields:
x/sa (t) = As(t)−A
(0T
Ω+22
)BHQΩs(t)
= As(t)−A
(0 0T
0 I
)s(t)
= A
(sa (t)0
),
provided that Ω+22Ω22 = I, i.e Ω+
22 is the left inverse of Ω22 orn≥m. Hence in this case and in the noiseless mixture situation, theerror on x/sa (t) is null.
4.3 Practical considerations
4.3.1 Conditioning the empirical cyclic correlation matrix
In real situations, we only have finite-length measurement signalsand thus we deal with empirical statistics. The empirical matrixRa
x (t ) might be of a rank greater than 1 which yields a bad estima-tion of aa . To overcome this difficulty, the method will be ratherperformed on the pre-whitened observations
x(t) = Wx(t)= WAs(t)+Wn(t),
where W = (R0x(0)+)1/2. The algorithm is applied to these
whitened data without changing the principle of the SUBLEXmethod, but it now makes Ra
x (t ) closer to a rank-one matrix.
4.3.2 Joint diagonalisation
In order to make the estimation of aa more accurate (up to ascaling factor), we may perform the joint diagonalisation of a set ofhermitian matrices Ra
x (t )Rax (t )H indexed by different values of
a and t .
0
0.1
0.2
0.3
0.4
0.5
00.02
0.040.06
0.080.1
0.12
0
0.5
1
Norm
alis
ed F
requen
cy
Cyclic frequency α
Spectral Correlation
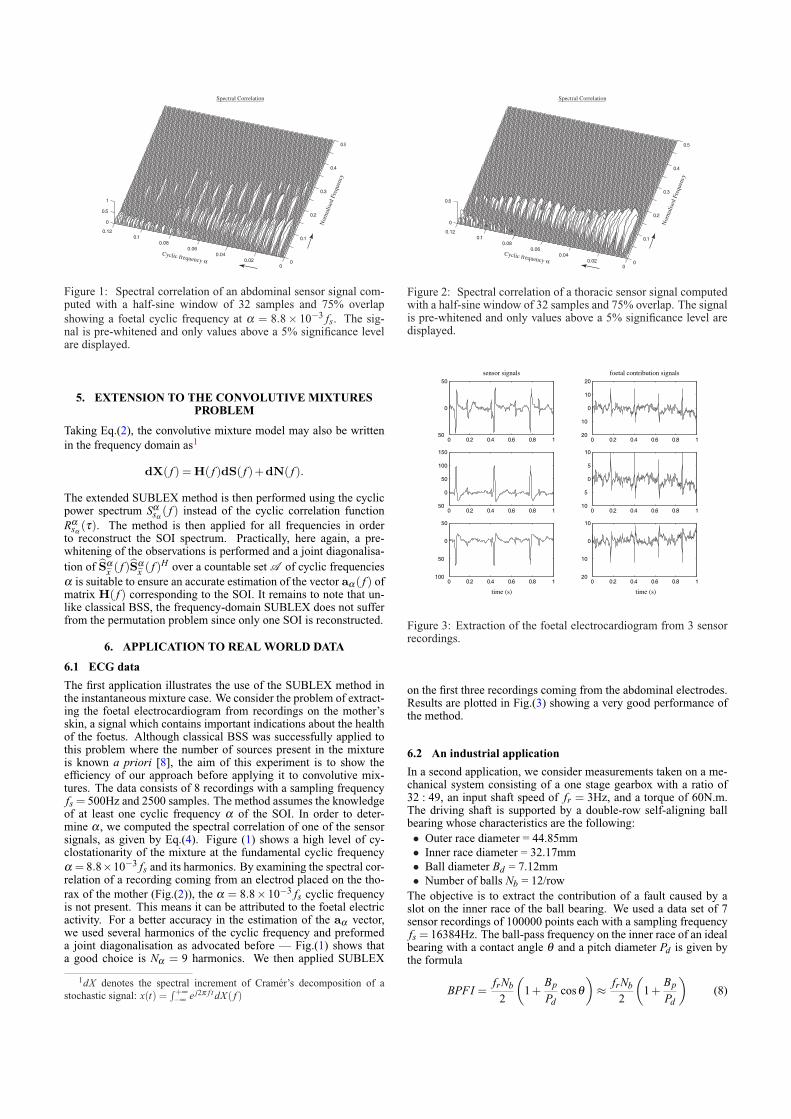
Figure 1: Spectral correlation of an abdominal sensor signal com-puted with a half-sine window of 32 samples and 75% overlapshowing a foetal cyclic frequency at a = 8.8× 10⁻³ fs. The sig-nal is pre-whitened and only values above a 5% significance levelare displayed.
5. EXTENSION TO THE CONVOLUTIVE MIXTURESPROBLEM
Taking Eq.(2), the convolutive mixture model may also be writtenin the frequency domain as1
dX( f ) = H( f )dS( f )+dN( f ).
The extended SUBLEX method is then performed using the cyclicpower spectrum Sa
sa ( f ) instead of the cyclic correlation functionRa
sa (t ). The method is then applied for all frequencies in orderto reconstruct the SOI spectrum. Practically, here again, a pre-whitening of the observations is performed and a joint diagonalisa-tion of Sa
x ( f )Sax ( f )H over a countable set A of cyclic frequencies
a is suitable to ensure an accurate estimation of the vector aa ( f ) ofmatrix H( f ) corresponding to the SOI. It remains to note that un-like classical BSS, the frequency-domain SUBLEX does not sufferfrom the permutation problem since only one SOI is reconstructed.
6. APPLICATION TO REAL WORLD DATA
6.1 ECG data
The first application illustrates the use of the SUBLEX method inthe instantaneous mixture case. We consider the problem of extract-ing the foetal electrocardiogram from recordings on the mother’sskin, a signal which contains important indications about the healthof the foetus. Although classical BSS was successfully applied tothis problem where the number of sources present in the mixtureis known a priori [8], the aim of this experiment is to show theefficiency of our approach before applying it to convolutive mix-tures. The data consists of 8 recordings with a sampling frequencyfs = 500Hz and 2500 samples. The method assumes the knowledgeof at least one cyclic frequency a of the SOI. In order to deter-mine a , we computed the spectral correlation of one of the sensorsignals, as given by Eq.(4). Figure (1) shows a high level of cy-clostationarity of the mixture at the fundamental cyclic frequencya = 8.8×10⁻³ fs and its harmonics. By examining the spectral cor-relation of a recording coming from an electrod placed on the tho-rax of the mother (Fig.(2)), the a = 8.8× 10⁻³ fs cyclic frequencyis not present. This means it can be attributed to the foetal electricactivity. For a better accuracy in the estimation of the aa vector,we used several harmonics of the cyclic frequency and preformeda joint diagonalisation as advocated before — Fig.(1) shows thata good choice is Na = 9 harmonics. We then applied SUBLEX
1dX denotes the spectral increment of Cramer’s decomposition of astochastic signal: x(t) =
∫ +¥−¥ e j2p f t dX( f )
0
0.1
0.2
0.3
0.4
0.5
00.02
0.040.06
0.080.1
0.12
0
0.5
Norm
alis
ed F
requen
cy
Cyclic frequency α
Spectral Correlation
Figure 2: Spectral correlation of a thoracic sensor signal computedwith a half-sine window of 32 samples and 75% overlap. The signalis pre-whitened and only values above a 5% significance level aredisplayed.
0 0.2 0.4 0.6 0.8 150
0
50
0 0.2 0.4 0.6 0.8 120
10
0
10
20
0 0.2 0.4 0.6 0.8 150
0
50
100
150
0 0.2 0.4 0.6 0.8 110
5
0
5
10
0 0.2 0.4 0.6 0.8 1100
50
0
50
0 0.2 0.4 0.6 0.8 120
10
0
10
time (s) time (s)
sensor signals foetal contribution signals
Figure 3: Extraction of the foetal electrocardiogram from 3 sensorrecordings.
on the first three recordings coming from the abdominal electrodes.Results are plotted in Fig.(3) showing a very good performance ofthe method.
6.2 An industrial application
In a second application, we consider measurements taken on a me-chanical system consisting of a one stage gearbox with a ratio of32 : 49, an input shaft speed of fr = 3Hz, and a torque of 60N.m.The driving shaft is supported by a double-row self-aligning ballbearing whose characteristics are the following:• Outer race diameter = 44.85mm• Inner race diameter = 32.17mm• Ball diameter Bd = 7.12mm• Number of balls Nb = 12/row
The objective is to extract the contribution of a fault caused by aslot on the inner race of the ball bearing. We used a data set of 7sensor recordings of 100000 points each with a sampling frequencyfs = 16384Hz. The ball-pass frequency on the inner race of an idealbearing with a contact angle q and a pitch diameter Pd is given bythe formula
BPFI =frNb
2
(1+
Bp
Pdcos q
)≈ frNb
2
(1+
Bp
Pd
)(8)

0
0.1
0.2
0.3
0.4
0.5
00.002
0.0040.006
0.0080.01
0
0.2
0.4
0.6
0.8
Nor
mal
ised
Fre
quen
cy
Cyclic frequency a
Spectral Correlation
Figure 4: Spectral correlation of a sensor signal computed with ahalf-sine window of 256 samples and 75% overlap showing a ballbearing fault cyclic frequency at a = 1.36× 10⁻³ fs. The signalis pre-whitened and only values above a 5% significance level aredisplayed.
which gives a BPFI ≈ 22.39 Hz. In order to determine more accu-rately the cyclic frequency of the damaged ball bearing, we com-puted the spectral correlation of one of the recordings [6]. Figure(4) shows high correlation values at the normalised cyclic frequen-cies a = 6.12× 10⁻³ fs corresponding to the gear mesh frequencyand a = 1.36× 10⁻³ fs = 22.28Hz and its harmonics correspond-ing to the fault which verifies the frequency obtained using Eq.(8).Next, we used the convolutive frequency-domain version of SUB-LEX for extracting the fault contribution with a = 1.36× 10⁻³ fsand Na = 4. The first column of Fig.(5) shows the sensor signals,and the second one the corresponding fault contribution signals ob-tained by the proposed method. A zoom on some cycles is shownin Fig.(6) which illustrates the impacts due to the slot on the innerrace of the ball bearing.
7. CONCLUSION
In this paper, we proposed a subspace method (SUBLEX) for theblind extraction of a cyclostationary source mixed with an unknownnumber of interfering sources — a typical situation where classicalblind source separation fails. We showed that our approach per-forms perfect separation of the SOI in the noiseless case providedthat the number of sensors is greater than the number of the sources;the error in the noisy case is still to be theoretically assessed al-though it was found very small in simulations. We successfullyapplied the method to ECG data to extract the foetal electrocar-diogram, and its frequency-domain extension to industrial data toextract the signature of a fault in a complex convolutive mixture.
REFERENCES
[1] J.-F. Cardoso and A. Souloumiac, “Blind beamforming fornon gaussian signals,” in IEE Proceedings-F, vol. 140, pp.362–370, Dec. 1993.
[2] A. Belouchrani, K. Abed-Meraim, J.-F. Cardoso andE.Moulines, “A blind source separation technique using sec-ond order statistics,” IEEE Trans. on Signal Processing, vol.45, no. 2, pp. 434–444, Feb. 1997.
[3] K. Abed-Meraim, Y. Xiang and Y. Hua, “Blind source sepa-ration using second-order cyclostationary statistics,” in IEEETrans. on Signal Processing, vol. 49, no. 4, pp. 694–701, Apr.2001.
x 104
0.01
0
0.01sensor signals
x 104
0.01
0
0.01damaged ball bearing contribution signals
x 104
0.01
0
0.01
x 104
0
x 104
0.01
0
0.01
x 104
0
x 104
0.02
0
0.02
x 104
0.01
0
0.01
x 104
0.02
0
0.02
x 104
0.01
0
0.01
x 104
0
5 x 10-3
x 104
0
2 x 10⁻³
0 1 2 3 4 5 x 1040.02
0
0.02
samples0 1 2 3 4 5 x 10
40.02
0
0.02
samples
5 x 10⁻³ 2 x 10
-3
5 x 10⁻³
5 x 10⁻³
5 x 10⁻³
5 x 10⁻³
Figure 5: Extraction of the damaged ball bearing signals from 7sensor recordings.
1.68 1.7 1.72 1.74 1.76 1.78 1.8 1.82 1.84 1.866
4
2
0
2
4
6x 10
3 sensor signal
1.68 1.7 1.72 1.74 1.76 1.78 1.8 1.82 1.84 1.86 3
2
1
0
1
2
3x 10
3 damaged bearing contribution signal
time (s)
Figure 6: Zoom on some cycles showing the typical impacts char-acterising the fault in the bearing.
[4] A. Ferreol and P. Chevalier, “On the behavior of current sec-ond and higher order blind source separation methods for cy-clostationary sources,” in IEEE Trans. on Signal Processing,vol. 48, no. 6, pp. 1712–1725, Jun. 2000.
[5] J. Antoni, F. Guillet, M. ElBadaoui and F. Bonnardot, “Blindseparation of convolved cyclostationary processes,” in SignalProcessing, 85, pp.51–66, 2005.
[6] R. B. Randall, J. Antoni, S. Chobsaard, “The Relationship be-tween Spectral Correlation and Envelope Analysis for Cyclo-stationary Machine Signals. Application to Ball Bearing Diag-nostics,” in Mechanical Systems and System Processing, vol.15, no. 5, pp. 945–962, 2001.
[7] B.G. Agee, S.V. Schell and W.A. Gardner, “Spectral self-coherence restoral: A new approach to blind adaptive signalextraction using antenna arrays,” in Proceedings of the IEEE,vol. 78, no. 4, pp. 753–767, Apr. 1990.
[8] J.-F. Cardoso, “Multidimensional independent componentanalysis,” in Proc. ICASSP’98, Seattle, USA, May. 12-15.1998, pp. 1941–1944.