a study on teacher attrition in two small school …
TRANSCRIPT

A STUDY ON TEACHER ATTRITION IN TWO SMALL SCHOOL DISTRICTS IN SOUTHEASTERN VIRGINIA
Walter R. Clemons
Dissertation submitted to the faculty of the Virginia Polytechnic Institute and State University in partial fulfillment of the requirements for the degree of
Doctor of Philosophy
In Educational Leadership and Policy Studies
Travis W. Twiford, Committee Chair M. David Alexander
N. Wayne Tripp Marion Wilkins
November 3, 2009 Virginia Beach, Virginia
Keywords: Teacher, Attrition, Retention, Small, Rural
A STUDY ON TEACHER ATTRITION IN TWO SMALL SCHOOL DISTRICTS IN SOUTHEASTERN VIRGINIA
Walter R. Clemons
ABSTRACT
All students deserve the opportunity to receive a high quality education that will enable them to
reach their full potential and become productive members of society. Teachers play a vital role in the
academic development of students and therefore school districts across the country need to do all they can to
ensure that all students have highly qualified teachers in their classrooms. Many school districts across the
country are having major difficulty retaining the very best educators. The purpose of this study was to
identify the factors that impact teacher attrition in two small school districts in Southeastern Virginia. This
study through survey responses gathered data from teachers who left both districts after the 2007-2008
school year on the factors that impacted their decisions to leave and the challenges they perceived both
school districts face that impact teachers attrition. Other data from the survey responses identified
characteristics of the teachers who left both school districts after the 2007-2008 school year. Additionally,
2007-2008 demographic data on the total teacher population in both school districts were collected from the
Human Resources departments of both school districts.
Results from the study revealed that 54 out of 240 (22.5%) teachers combined left both school
districts after the 2007-2008 school year. Of the 54 teachers who left, 52 were mailed surveys. A total of
40 responses were received from the survey population of teachers. This represented a 77% survey
response rate. A variety of reasons for leaving were given by the teachers who left both school districts, but
a major reason given for leaving was student discipline. The biggest challenge that both school districts
face that impacts teacher attrition as perceived by teachers who left was geographical location. Of the 54
teachers who left both school districts, the majority were White and female. The majority of teachers who
left both school districts combined had five years or less of total teaching experience. The majority of the

teachers who left indicated they entered the teaching profession with the desire to impact the lives of
children.
iii
DEDICATION
I dedicate this dissertation to my loving wife LaGuamna, who has always been and still is a rock in
my corner and my eternal soul mate. I truly appreciate your belief in me and your dedication, commitment,
and faithfulness to me. I will always love you. I also dedicate this dissertation to my mother and father, the
late Mr. and Mrs. Walter Clemons Jr. My parents provided a household for me filled with love and always
encouraged me to do my very best. I will always love them and miss them greatly.
Finally, this dissertation is dedicated in loving memory to my boxer puppy Mercedes, who passed
away suddenly and unexpectedly at the tender age of two on August 8, 2009 due to a rare heart condition in
boxers known as cardiomyopathy. Mercedes was truly a daddy’s girl, and lay beside my chair every
opportunity she had when I was working on my dissertation. She was dearly loved and is truly missed.
iv

ACKNOWLEDGMENTS
I first give all honor and praise to almighty God, who continues to bless me and without whom
none of this would be possible. To my loving wife LaGuamna, thank you for your encouragement
throughout this process and your unwavering belief that I could do it. I love you dearly and I thank you for
your continuous support in all my endeavors.
To Dr. Travis W. Twiford, my committee chairman, thank you for having enough belief in my work
and agreeing to serve as my chair. I truly appreciate your wisdom, feedback, and guidance throughout this
process. To my committee members, Dr. M. David Alexander, Dr. N. Wayne Tripp, and Dr. Marion
Wilkins, thank you for your feedback and constructive criticism in the effort to make this the best study
possible.
To Mr. Lloyd Hamlin (Superintendent of Schools) of Surry County Public Schools, thank you Mr.
Hamlin for allowing me to collect the data that I needed for this study from your school district. To Mr.
Patrick Barnes (Director of Human Resources and Food Services) of Surry County Public Schools, thank
you Mr. Barnes for providing me with the information that I needed for this study. To Mrs. Beverly Rabil
(Acting Superintendent of Schools) of Franklin City Public Schools, thank you Mrs. Rabil for signing the
District consent form I needed for data collection purposes for this study. To the former teachers in the
Franklin City and Surry County School districts that completed and returned the surveys, thank you for
giving me the feedback that I needed for this study.
v

TABLE OF CONTENTS
Page
Abstract………………………………………………………………………………….ii Dedication………………………………………………………………………………iv Acknowledgments………………………………………………………………………v Table of Contents……………………………………………………………………….vi List of Figures…………………………………………………………………………..x List of Tables…………………………………………………………………………...xi Chapter One: THE PROBLEM…………………………………………………………1
Context and Overview of the Study…..…………………………………………….2
Historical Background and Current Status…..……………………………………...2
Statement of the Problem……………………………………………………………3
Purpose and Significance of the Study…..…………………………………………..4
Conceptual Framework……………………………………………………………...8
Definition of Key Terms…………………………………………………………….8
Organization of the Study…………………………………………………………..10 Chapter Two: REVIEW OF RELATED LITERATURE………………………………11
Teacher Attrition Factors…………………………………………………………...11
Challenges for Small and Rural Areas…..……………………………………….....19
Characteristics of Those Who Enter Teaching…………………………………..….22
Gender……………………………………………………………………………....23 Race/Ethnicity……………………………………………………………………....24
vi

Ability (ACT Scores, SAT Scores and Postsecondary Institution Selection).……..27 Psychological and Family Factors………………………………………………….28 Chapter Summary (Analysis of Literature)………………………………………...29
Research Questions………………………………………………………………...31
Chapter Three: METHODOLOGY……………………………………………….........33
Purpose of the Study……………………………………………………………......33
Research Questions…………………………………………………………………33
Research Design/Methodology………………………………………………….….33
Research Design Justification………………………………………………………33
Site/Sample Selection………………………………………………………………34
Data Collection Procedures………………………………………………………...35
Data Gathering Procedures………………………………………………………....35 Instruments Design………………………………………………………………....36
Survey Validation Instruments……………………………………………………..37
Data Treatment and Management…..……………………………………………...39
Data Analysis Techniques………………………………………………………….39
Methodology Summary………………………………………………………….....39 Chapter Four: RESULTS OF THE STUDY…………………………………………...41
Receipt of Electronic Data………………………………………………………….42
Mailing of Surveys and Receipt of Surveys….…………………………………….42
Data Results and Analysis………………………………………………………….43
vii

Research Question One…………………………………………………………….43
Research Question Two…………………………………………………………....45
Research Question Three…………………………………………………………..46
Research Question Four…………………………………………………………....47
Electronic Data Results………………………………………………………….....50 Chapter Four Summary…………………………………………………………….55
Chapter Five: FINDINGS, IMPLICATIONS FOR PRACTICE, LIMITATIONS/ DELIMITATIONS, RECOMMENDATIONS FOR FUTURE
RESEARCH AND PERSONAL REFLECTIONS…………………….57
Introduction………………………………………………………………………....57 Findings (Survey Data)……………………………………………………………..58 Findings (Electronic Data)………………………………………………………….62 Implications for Practice…………………………………………………………....67 Limitations/Delimitations…………………………………………………………..69 Recommendations for Future Research…………………………………………….69 Personal Reflections………………………………………………………..............71
REFERENCES…………………………………………………………………………73 APPENDICES………………………………………………………………………….81
A. Cover Letter to District Superintendents………………………………………..81 B. Franklin City Public Schools District Consent Form…………………………....82 C. Surry County Public Schools District Consent Form……………………………83 D. Cover Letter Number One to Teachers………………………………………….84
viii

E. Cover Letter Number Two to Teachers………………………………………….85
F. Teacher Attrition Survey……………………………………………………........86 G. Survey Validation Instrument One (October 13, 2008)……………………….....90 H. Survey Validation Instrument Two (November 3, 2008)……..…………………95 I. Survey Validation Instrument One Alignment Results…………………………...99 J. Survey Validation Instrument Two Alignment Results………………………….100
K. Survey Validation Instrument One Clarity Results……………………………...101
L. Survey Validation Instrument Two Clarity Results……………………………...102
M. AAEE Table Consent Usage………………………………………………….....104
N. NCES Table Consent Usage…………………………………………………......105
O. IRB Approval………………………………………………………………….....106
P. Human Subjects Training………………………………………………………...107 Q. 2007-2008 Recoded Electronic Teacher Data for Surry County and
Franklin City………………………………………………………………….....108
ix

LIST OF FIGURES
Figure 1 Page
Conceptual Framework …………………………………………………………………9
x

LIST OF TABLES
Table Page
1 National Teacher Supply and Demand by Disciplines…………………………..5
2 2004-2005 Teacher Follow-up Survey …………………………………………20
3 Teacher Data Example………………….. ……………………………………..37
4 Cross tabulation and Frequency of Responses to Survey
Questions 7, 8, 10, and 12………………………………………………………44
5 Cross tabulation and Frequency of Responses to Survey Question 11…..……...47
6 Cross tabulation and Frequency of Responses to Survey Questions
1, 2 and 3…. …………………………………………………………………….48
7 Cross tabulation & Frequency of Responses to Survey
Questions 4, 5, 6 and 9……….………………………………………………….49
8 Cross tabulation of Teachers Who Left Surry County and Franklin City by
subject-areas, licensure, years of experience, race and gender………………….52
9 Cross tabulation of Teachers Who Left Surry County and Franklin City by
resignation, retirement, non-renewal or death…………………………………..53
10 Total Population School Districts Cross tabulation by subject-areas,
licensure, years of experience, race, gender and those who stayed or left………54
11 School Districts Cross tabulation Categories with Percentages within
selected subgroups………………………………………………………………66
xi

1
CHAPTER ONE
THE PROBLEM
The No Child Left Behind Act (NCLB) of 2001 is considered to be landmark legislation
in educational reform that is designed to improve student achievement and to close the
achievement gap (United States Department of Education, 2004). NCLB requires all public
school divisions to hire only teachers who are highly qualified. This requirement became
effective on July 1, 2006. A highly qualified teacher defined in NCLB is one who holds a
bachelor’s degree, holds full state certification as defined by the state and has demonstrated
competency in each core academic subject he or she teaches (United States Department of
Education, 2004). NCLB lists core academic subject areas as English, reading/language arts,
mathematics, science, foreign languages, civics/government, economics, arts, history and
geography. In addition, elementary school teachers must demonstrate competence in reading,
writing, mathematics and the other core academic subject areas in the elementary school
curriculum.
The mandate set by NCLB that every teacher be highly qualified has made teacher
retention efforts for school districts across this country more challenging. This was proven by
the fact that no state was able to meet the July 1, 2006 deadline for employing only highly
qualified teachers. The United States Department of Education required state agencies to submit
revised highly qualified teacher plans by July 7, 2006 (Spradlin & Prendergast, 2006). The
revised plans had to document the specific actions that each state was taking to reach the goal of
all teachers being highly qualified. The revisions resulted in full plan approval for nine states,
with an additional 37 states plus the District of Columbia and Puerto Rico receiving partial
approval. Those states receiving partial approval had to submit revised plans by September 29,

2
2006. The four remaining states that submitted revised plans that were not approved underwent
federal monitoring of teacher quality data and had to submit new plans by November 1, 2006
(Spradlin & Prendergast, 2006). This information clearly shows that NCLB had not taken into
account a decade-long teacher shortage in specific disciplines as reported by the American
Association for Employment in Education (2008). The American Association for Employment
in Education (2008) reported that 37 of 62 surveyed disciplines had some or considerable teacher
shortage. School divisions across the nation need to analyze their data on teachers who enter or
leave their divisions in an effort to develop practices and policies that reduce teacher attrition.
Context and Overview of the Study
For this study, the researcher identified factors that impact teacher attrition in two small
school districts in Southeastern Virginia. The literature review identified empirical research on
teacher attrition. The selection criteria used for the studies in the review of literature were as
follows: relevance, historical value, and empirical in nature. To assess relevance and gain a
historical perspective, the literature spans a period from 1960 through 2009. The researcher
believes that this gives a broad picture of the problem in its early stages and provides insight into
recent issues surrounding teacher attrition in the United States. Finally, the researcher selected
studies that were empirical in nature. By this the researcher means the studies selected relied on
data that were produced by observation or experimentation and not opinion.
Historical Background and Current Status
Teacher shortages and subsequent initiatives are not new to the K-12 education system
(Ingersoll, 2003). A series of highly publicized reports surfaced in the1980’s that centered on
diagnoses for this problem (National Commission on Excellence in Education, 1983; Darling-
Hammond, 1984; and National Academy of Sciences, 1987). Due to a lack of data on the topic

3
of teacher attrition, the United States Department of Education’s National Center for Education
Statistics developed the Schools and Staffing Survey (SASS) and its supplement, the Teacher
Follow-up Survey (TFS) in the late 1980’s (Haggstrom, Darling-Hammond, & Grissmer, 1988).
This is now the largest and most comprehensive data source available on the staffing,
occupational, and organizational aspects of schools (Ingersoll, 2003). The American Association
for Employment in Education [AAEE] (2003) has reported for more than 25 years that the areas
of greatest need in education-related disciplines nationwide include teachers and related service
personnel in special education, mathematics, and science (AAEE, 2003). In addition, AAEE
reported that education-related disciplines showed increased demand from 2007 to 2008 in the
areas of speech pathology, library science/media technology and elementary school principal
(American Association for Employment in Education, 2008).
The National Commission on Teaching and America’s Future [NCTAF] (1997) indicated
in a 1997 report that two million teachers at a minimum would need to be hired in America’s
schools over the next 10 years (NCTAF, 1997). In addition, NCTAF reported that nearly half of
new teachers leave the profession within their first five years of teaching (National Commission
on Teaching and America’s Future, 2003). Economic conditions in the United States today are
causing many states to roll back their expenditures on public education. Local, state, and federal
agencies that disperse funds for education are hard-pressed to determine which programs raise
the quality of teaching in the most cost-effective manner (Guarino, Santibañez, & Daley, 2006).
Statement of the Problem
A current problem for many school districts is providing each and every child in their
care a quality education taught by a highly qualified teacher. This requires school districts to
have an adequate supply of competent individuals who are willing and able to serve as teachers.
4
Therefore, school districts are constantly engaged in activities related to the retention of their
instructional staff. Today, many school districts are faced with an increasing school-aged
population, which in turn causes them to struggle to maintain standards for teacher quality while
continuously seeking to retain their most effective existing teachers (Guarino et al., 2006).
All children deserve a quality education, and that education is seriously jeopardized when
school districts do not supply every child with a highly qualified teacher. This is why the
researcher believes this study was very timely and has major implications for educational
leadership. School districts need to do all that they can to give students the very best education
possible. Providing highly qualified teachers is a key ingredient to academic success for
students.
Purpose and Significance of the Study
As stated previously, the American Association for Employment in Education (2008)
reported that there are teacher shortages in a variety of disciplines shown by regions across the
United States. Educator supply and demand research has been conducted by the American
Association for Employment in Education (2003) for over twenty-five years. When demand is
greater than supply, a teacher shortage occurs. A teacher surplus occurs when supply is greater
than demand. “The demand for teachers is defined as the number of teaching positions offered at
a given level of compensation and the supply of teachers as the number of qualified individuals
willing to teach at a given level of compensation” (Guarino et al., 2006, p.174). Table 1 shows
the national demand for educators as studied by the American Association for Employment in
Education (2008). Table 1 indicates that disciplines of special education, mathematics, science
and bilingual education all have some shortage or considerable shortage.
This teacher shortage problem becomes more critical due to the fact that school districts

5
Table 1
________________________________________________________________________
National Teacher Supply and Demand by Disciplines
“Demand codes: 5.00 - 4.21 = Considerable Shortage; 4.20 - 3.41 = Some Shortage; 3.40 - 2.61 =
Balanced; 2.60 - 1.81 = Some Surplus; 1.80 - 1.00 = Considerable Surplus ________________________________________________________________________ Disciplines with Considerable Shortage (5.00 - 4.21) Disciplines with Balanced Supply and Demand (3.40 - 2.61) Severe/Profound Disability 4.47 Speech Education 3.40 Math Education 4.46 Gifted/Talented Education 3.34 Physics 4.39 School Social Work 3.34 Multicategorical 4.39 Family & Consumer Science 3.33 Mild/Moderate Disability 4.37 Counseling 3.29 Chemistry 4.35 Language – Classics 3.22 Mental Retardation 4.34 Middle School 3.20 Emotional Disorders/ Language – French 3.13 Behavioral Disorders 4.31 Music – Instrumental 3.13 Bilingual Education 4.31 Language – German 3.04 Learning Disability 4.28 Music – Vocal 3.04 Visually Impaired 4.24 Journalism Education 3.03 Dual Certification (General Music – General 3.01 & Special Education) 4.23 Business Education 3.01 Hearing Impaired 4.23 English/Language Arts Education 3.02 Speech Pathology 4.21 Pre-Kindergarten 2.74
Art/Visual Education 2.74 Disciplines with Some Shortage (4.20 – 3.41) Intermediate 2.73 ESL/ELL 4.08 Theatre/Drama Education 2.70 Early Childhood Special Education 4.07 Dance Education 2.69 Biology 4.06 Earth/Physical 4.01 Disciplines with Some Surplus (2.60 – 1.81) Other Language #2 4.00 Health Education 2.57 Audiology 3.99 Kindergarten 2.52 Physical Therapy 3.91 Primary 2.41 Language – Spanish 3.88 Physical Education 2.33 General Science 3.87 Social Studies Education 2.20 Other Language #1 3.84 Occupational Therapy 3.82 Disciplines with Considerable Surplus (1.80 - 1.00) School Nursing 3.80 None Technology Education 3.64 Language – Japanese 3.53 Agriculture Education 3.52 Computer Science Education 3.52 Reading 3.52 Superintendent 3.50 High School Principal 3.49 School Psychologist 3.49 Middle School Principal 3.46 Library Science/Media Technology 3.46 Elementary School Principal 3.42” (American Association for Employment in Education, 2008, p. 7, Used with permission of)
AAEE, Neil Shnider, February 13, 2009).
________________________________________________________________________

6
are held to ever increasing academic accountability standards per NCLB requirements. These
goals for academic success are virtually impossible to reach when districts do not have highly
qualified teachers in the classroom. The lack of highly qualified teachers often results in
irrevocable instructional losses for students (Sanders & Rivers, 1996).
Darling-Hammond (1999) stated that quantitative analyses indicate that measures of
teacher preparation and licensure are by far the strongest correlates of student achievement in
reading and mathematics, even after controlling for student poverty and language status. Many
poor children’s underachievement that has been historically blamed on poverty or family
characteristics is instead attributable to what we have done by assigning these children
disproportionately to large numbers of our weakest teachers (Darling-Hammond, 1999).
Students in high-poverty or high-minority schools desperately need the best and brightest
teachers, but instead stand double the chance of having teachers who are not highly qualified.
The students lose due to not being taught by highly qualified teachers, and the school
districts are then forced to train their replacements (Alliance for Excellent Education, 2005).
“Teaching touches the lives of all children from a variety of backgrounds, including those from
families that exhibit a wide range of cultural and linguistic diversity” (Vocational and
Educational Services for Individuals with Disabilities, 2005, p.1). In some instances, there is an
opportunity for teachers to change the course of events for many children who come to school
with significant disadvantages, such as parental and societal neglect, intellectual and physical
disabilities, and poverty (Vocational and Educational Services for Individuals with Disabilities,
2005).
This problem is exacerbated by the fact that higher teacher attrition rates exist in school
districts where students are of high poverty status (Ingersoll, 2003). The rate of teacher attrition

7
is roughly 50 percent lower in wealthier schools than in poorer ones (Alliance for Excellent
Education, 2005). The researcher works in a small school district that has 31.49% of the total
district student population who come from families with incomes below the poverty line (State
Council of Higher Education in Virginia, 2009). According to Title II, Part A, non-regulatory
guidance, a high-need local education agency (LEA) is defined as one for which not less than
20% of the children served by the LEA are from families with incomes below the poverty line
(State Council of Higher Education in Virginia, 2009).
Teaching is a profession that loses thousands of members each year for a variety of
reasons (American Association for Employment in Education, 2003). In Virginia alone, the
Committee to Enhance the K-12 Teaching Profession in Virginia (2002) indicated that from
2000 to 2015 the student population will increase by four percent, but teachers (including new
teacher candidates) will decrease in numbers by four percent. This roughly equates to 76,000
additional students and 3,400 fewer teachers. This means that fewer teachers will be available
for a growing population of students. The researcher works in human resources in a small school
district in Southeastern Virginia that experiences a high rate of teacher attrition each year.
Specifically, the researcher serves in the capacity of Assistant Superintendent whose
responsibility is to directly oversee all human resources functions. The researcher also
conversed with human resources colleagues in neighboring school districts, and found that they
also have teacher attrition problems annually. Addressing teacher attrition is a must, even when
it seems too costly and out of reach for school districts as they constantly face mandated
instructional programs that are needed to increase student academic achievement (Norton, 1999).
The purpose of this study was to identify the factors that impact teacher attrition in two
small school districts in Southeastern Virginia. The literature review sets the stage for this study

8
by first identifying factors that impact teacher attrition, identifying teacher retention challenges
for small and rural areas and identifying the characteristics of those who enter teaching. The
literature review identifies the factors, challenges and characteristics from a national context.
Helping all school districts retain highly qualified teachers is significant to all children’s
educational future as well as the stability of our great nation. All children should have the
opportunity to reach their full potential, and reaching that potential should not be jeopardized due
to a poor education. No Child Left Behind has established the mandate that every child succeed
academically. Now, the challenge is to ensure that all children have highly qualified teachers
who will help them reach that goal.
Conceptual Framework
The Conceptual Framework, noted in Figure 1, serves as the guide for this study. It
depicts the concepts to be studied and relationships that exist. It illustrates the idea that there are
specific factors that correlate to teacher attrition.
Definition of Key Terms
Teacher: An individual whose profession is teaching.
Attrition: Teachers who leave a school, school district or the profession of teaching
altogether due to personal reasons, resignation, retirement or non-renewal.
Retention: Keeping teachers who are already employed in a school or school district.
Small: A census defined place that has a population of more than or equal to 2,500 but
less than 25,000, and located outside a metropolitan service area (National Center for Education
Statistics, 2005a).
Rural: A census defined territory that is more than five miles but less than or equal to 25
miles from an urbanized area (National Center for Education Statistics, 2005b).

9
Figure1 Conceptual Framework
Characteristics of Teachers who Entered the
Profession and then Left
Teacher Attrition
Factors That Impact Teachers’
Decisions to Leave
Teacher Attrition Challenges for Small
and Rural School Districts

10
Organization of the Study
This study includes the following components: Chapter one contains the introduction,
the context and overview, the historical and current status, the statement of the problem, the
purpose and significance of the study, the conceptual framework and definition of key terms.
Chapter two includes a review of the literature. Factors that impact teacher attrition, teacher
retention challenges for small and rural areas, and characteristics of those who enter teaching are
presented in chapter two. Additionally, chapter two includes the research questions.
Chapter three explains the methodology used for this study, the sample population, data
collection and gathering procedures, instruments design and validation and data analysis
techniques. The methods of data assessment are discussed in addition to a description of the
school districts that were selected for this study. Chapter four includes the results of the study
regarding teacher attrition in the two small school districts in Southeastern Virginia. In addition,
any emerging themes from the data are discussed. Finally, chapter five provides a discussion
and summary of the findings and the correlation to the review of related literature. Implications
for practice, limitations of the study and recommendations for future research are also discussed
in chapter five. The researcher gives personal reflections as well as concluding remarks in
chapter five.

11
CHAPTER TWO
REVIEW OF RELATED LITERATURE
The purpose of this review of literature was to identify factors that impact teacher
attrition, identify teacher retention challenges for small and rural areas and identify
characteristics of those who entered the teaching profession. This review of literature is
organized into three sections which include (a) teacher attrition factors, (b) teacher retention
challenges for small and rural areas and (c) characteristics of those who entered teaching. A
synthesis of all the literature reviewed occurs near the end of chapter two. Chapter two ends
with the research questions being stated.
Teacher Attrition Factors
Understanding why teachers choose to work in a particular school district and why
they leave is the first step in developing best practices that will get them to stay (Vocational
and Educational Services for Individuals with Disabilities, 2005). It is extremely costly for
students and school districts when teachers exit the profession or move to other districts. The
Alliance for Excellent Education (2005) released a national analysis on teacher attrition costs
and reported the estimated cost to replace teachers who leave the profession or move to other
districts is $ 4.9 billion annually.
Giacometti (2005) conducted a national study in May through August of 2003 that
focused on why teachers choose to stay or leave the profession. The instrument utilized was
a survey titled “Factors Affecting Job Satisfaction for New Teachers”. The problem was
identified as the growing debate over whether the teacher shortage is a shortage of
teachers entering the field or whether the problem is retaining teachers once they begin
their careers (Giacometti, 2005).

12
Descriptive discriminant analysis was used for two major groups categorized as
leavers and stayers and analyzed utilizing eight domains which were as follows: “emotional
factors; school and community support; instructional support; preparation in teaching
curriculum; managing students, and assessing students; collaboration; compensation and
benefits; motivation to teach; and culture shock” (Giacometti, 2005, p.74). Major findings of
the study indicated that the best predictor in choosing to leave or stay in the teaching
profession was emotional, followed by compensation and benefits and culture shock. One
implication for practitioners included an assessment of new teachers when they enter school
districts.
The study proposed to group teachers who have similar weaknesses and focus on
those specific weaknesses. Another suggestion was to conduct workshops during the school
day instead of after hours in an effort to eliminate fatigue. Recommendations for continued
research as indicated by Giacometti (2005) included surveying individual districts as opposed
to a national sample, and adding questions to the survey involving teacher licensure. The
limitations included a poor response rate (25.7%).
Ingersoll and Smith (2003) conducted a study on components of effective induction
programs and their effects on reducing teacher attrition. These data were collected from the
1999-2000 Schools and Staffing Survey (SASS) and the Teacher Follow-up Survey (TFS) of
2000-2001. Included also was some information from the Schools and Staffing Surveys from
1990-1991 and 1993-1994. The study focused on beginning teachers, with the sample size
being approximately 3,235 (Ingersoll & Smith, 2003). The study used three sets of questions
drawn from the survey questionnaire items.
The findings of the study revealed that teachers who were provided a mentor in the

13
same field reduced the risk of leaving after the first year by 30% (Ingersoll & Smith, 2003.
In addition, having common planning time with teachers in the same subject area reduced the
risk of leaving after the first year by 44% (Ingersoll & Smith, 2003). Both of these
percentages are considered to be statistically significant. Limitations as noted by Ingersoll
and Smith (2003) included the survey items provided limited depth and detail on the content
and character of teacher induction and mentoring. Also, very limited data on the
characteristics of the mentors were obtained.
Johnson and Birkeland (2003) conducted a study on first and second year teachers in
a wide range of Massachusetts public schools. The methods involved a descriptive analysis
of interview data. The sample of teachers was not random, but was chosen to maximize
diversity on a wide range of measures: large and small schools, urban and suburban schools
of all grade levels, graduates of public university and private college teacher education
programs, charter schools, first-career and mid-career entrants and the 1999 recipients of the
$20,000 signing bonus programs.
The study results indicated that 22 percent (11 teachers) of the original sample were
classified as leavers (leaving the profession altogether), 22 percent (11 teachers) were
classified as movers (changed schools), and 56 percent (28 teachers) were classified as
stayers (remained in the same school). Those who left either had not experienced any
success in the classroom and had experienced great frustration and failure or saw their
teaching career as short-term before moving on to another career. Those classified as movers
overall felt their frustrations were tied to a particular school setting, and not the teaching
profession. Those classified as stayers spoke positively about their schools. Factors cited by
both leavers and movers that influenced their decisions to leave the profession altogether or

14
move to another district were teacher pay, poor working conditions, and inadequate support.
Factors cited by those classified as stayers included principal support and parental
involvement.
Even though the sample size was small, the study did an adequate job explaining the
reasons behind beginning teachers’ decisions to remain in or leave the teaching profession.
The limitations of the study centered on the sample being chosen, which may reflect bias. A
random sample might have been a better design that could possibly ensure some degree of
generalizability of the results.
McKinney, Berry, Dickerson, and Campbell-Whately (2007) conducted a study that
developed a profile of high quality educators who remained in urban high poverty schools
within a large metropolitan school district, and identified the indicators that influenced them
to remain. The district wasn’t named; it was just noted as being an urban, metropolitan
school district located in the Southeastern United States. High poverty in this instance was
defined as having more than half of the students at the elementary level qualifying for free or
reduced-priced school lunches.
Purposeful sampling of fifty-four tenured teachers who had remained in urban school
settings and identified by their respective administrators were selected. The Star Teacher
Selection Interview was used as the instrument only for the purpose of subject selection.
Thirty-two of the fifty-four selected teachers received passing scores on the Star Teacher
Selection Interview. Teachers passing the survey then moved on to complete the Urban
Teacher Retention Survey.
The Urban Teacher Retention Survey contained 25 indicators that were categorized
according to six broad factors (Familial, Societal, Situational, Socioeconomic, Individual and

15
Emotional). The results from the study showed that the indicators that had the most
influence on teacher decisions to stay included Making Contributions to Society/ Community
(43.8%), Working with Diverse Populations (31.3%), Teacher Efficacy (21.9%), and being
Well-Suited for Urban Teaching (21.9%). It is interesting to note that salary and benefits had
little to no influence. Recommendations included continually conducting research on those
teachers who were considered to be stars or very effective with diverse student populations
and providing data that document why those teachers choose to remain in the most
challenging settings (McKinney et al., 2007).
The MetLife (2006) Survey of the American Teacher examined teacher expectations
upon entering the profession, factors that drive satisfaction, and teacher preparation and
support. The survey was conducted by Harris Interactive®, and consisted of both
quantitative and qualitative research methodologies. Specifically, survey questionnaires and
phone interviews were conducted between March 8, 2006 and April 15, 2006 on nationally
representative samples of teachers, principals, deans of schools of education and education
department chairpersons. Prospective teachers and former teachers were also used for online
bulletin board focus groups by Harris Interactive (MetLife, 2006).
The results from the study indicated that more than half (56%) of teachers were
satisfied with their careers, but a little over one quarter (27%) indicated that they were likely
to leave the profession within the next five years to enter a different occupation. The study
also reported that African American teachers and teachers with 21 years or more experience
are two to four times more likely to leave the profession. Reasons cited for leaving included
professional prestige, lack of resources, salary and benefits, student discipline, being ill-
prepared to work with children of varying abilities, lack of teacher input in decision making,

16
and lack of parental and administrative support. The study also reported that the greatest
teacher shortages are expected in secondary schools and schools with high concentrations of
minority and low-income students. Having, or assigning, mentors to new teachers was
viewed as a positive factor in improving teacher retention as well as increasing salaries and
providing more respect for teachers in today’s society (MetLife, 2006).
Hanushek, Kain, and Rivkin (2001) conducted a descriptive study involving
regression analysis on 378,790 teachers between 1993 and 1996. Results from the study
indicated that teachers’ decisions to switch schools had some correlations to salary,
especially for male teachers. The study also reported that relative salary level between
districts, rather than absolute salary, was a more important factor in teachers’ decisions to
leave their schools (Hanushek et al., 2001). It is interesting to note that the study indicated
that a stronger factor that contributed to the teachers leaving the public schools entirely was
poor student performance. The study also noted that schools with high minority and/or high-
poverty populations might have to pay 20% to 50% more in salary than schools that served
predominantly White, Asian, or academically successful students (Hanushek et al., 2001).
Lankford, Loeb and Wyckoff (2002) conducted a correlational study that analyzed
data on every teacher in New York State between 1984-1985 and 1999-2000. The study
looked at those teachers who transferred within districts and between districts. The teachers
who transferred within districts received increases from 4% to 15%. Those teachers who
transferred between districts received increases from 12% to 22%. The researchers’
implications from the findings indicated that within-district salary differences at that time
were generally not great enough to act as incentives to teach in one school as opposed to
another, however, salary differences between districts were more attractive and produced
17
higher rates of attrition (Lankford et al., 2002).
Clotfelter, Glennie, Ladd, and Vigdor (2006) conducted a study that examined a
bonus incentive program for certified mathematics, science, and special education teachers
working in high-poverty, low-performing schools. At that time, the state was offering $1,800
annual bonuses to teachers who taught math, science, or special education. The study results
indicated that the $1,800 bonus was sufficient to reduce teacher attrition in those subject
areas by 12 percent (Clotfelter et al., 2006). Teachers and principals in the schools involved
indicated through survey responses that they believed the potential effects of the $1800
annual bonuses were undermined due to the complexity of the incentive program (rules
determining who was eligible); its late start in the first year; and its short duration of only
three years (Clotfelter, Glennie, Ladd, & Vigdor, 2008).
The results of the sixth annual MetLife (2008) study of employee benefits trends were
released on April 7, 2008. The data collection methodology used were surveys. The surveys
were administered to 1652 employers at companies with between two employees and 1380
full-time employees. The surveys were given over a one-month period during the third
quarter of 2007 by GFK Custom Research (GFK). GFK Custom Research is the world’s
fourth largest market research company (MetLife, 2008). Eight percent of employers and ten
percent of employees responding to the study were from the field of education. Findings
from the study showed that there was a strong link between benefits and employee retention,
and there was a gap between employer and employee perceptions on the importance that
benefits play in reducing employee attrition. Specifically, 55% of education employers cited
that benefits play a very important factor in reducing employee attrition. Seventy nine
percent of education employees cited that benefits play a major role in reducing employee

18
attrition (MetLife, 2008).
As stated previously, the National Commission on Teaching and America’s Future
reported that nearly half of all teachers who enter the profession leave within their first five
years of teaching (NCTAF, 2003). This is further supported in the following studies by other
researchers (Kirby & Grissmer, 1993; Mark & Anderson, 1977; Rabinowitz & Crawford,
1960; Schlecty & Vance, 1981 & Hanushek et al., 2001). The Hanushek et al. (2001) study
analyzed data on Texas teachers from 1993 through 1996, and found that the majority who
left teaching were in their first two years of teaching or very experienced and nearing
retirement. Schlecty and Vance (1981) found that first year teachers leave at a rate of about
15 percent, and second- and third-year teachers leave at a rate of about 10 percent. Kirby and
Grissmer (1993) reported that approximately one-fifth leave after the first year of teaching,
one-third leave after the second year of teaching and by the end of the fourth year a little
more than half have left the field. Mark and Anderson (1977) reported that of the cohort of
new entrants to teaching in the St. Louis area in 1968, 40 percent did not stay beyond one
year. Rabinowitz and Crawford (1960) surveyed teachers who graduated through the New
York City Municipal college system. They issued a survey three times a year to the same
group during the five years following their college graduation. Results indicated only 50
percent of the 1,444 respondents were still teaching at the time of the final survey (five
years).
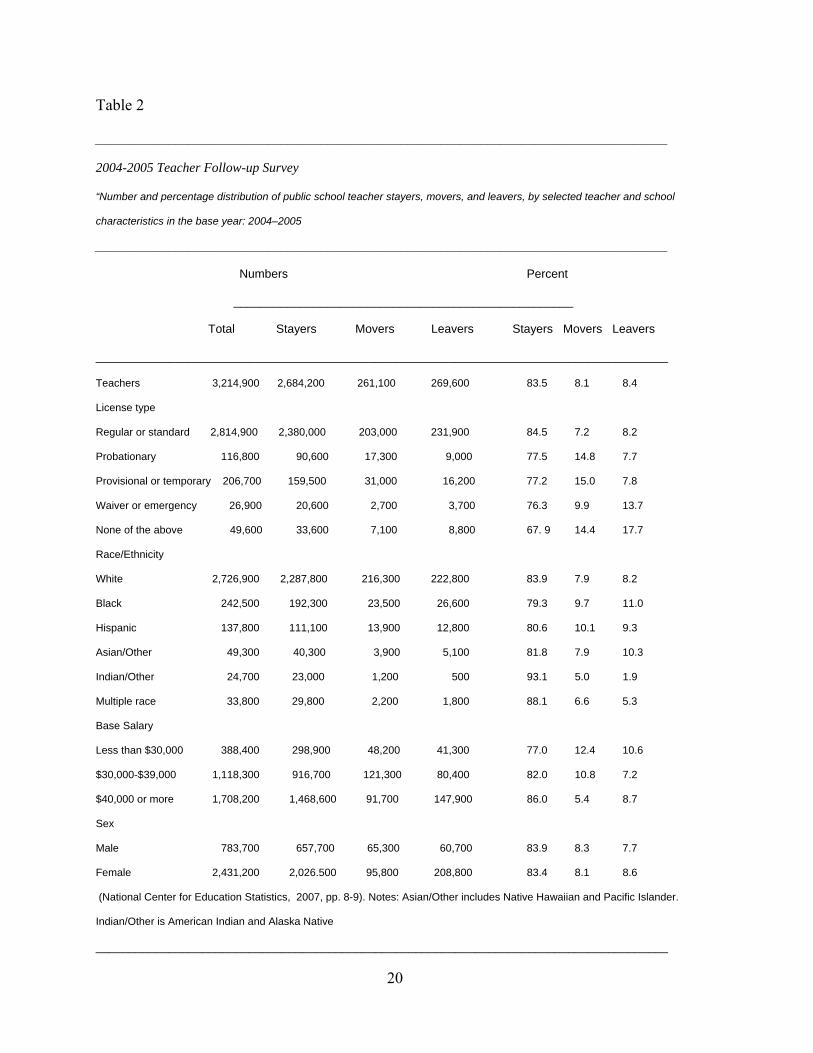
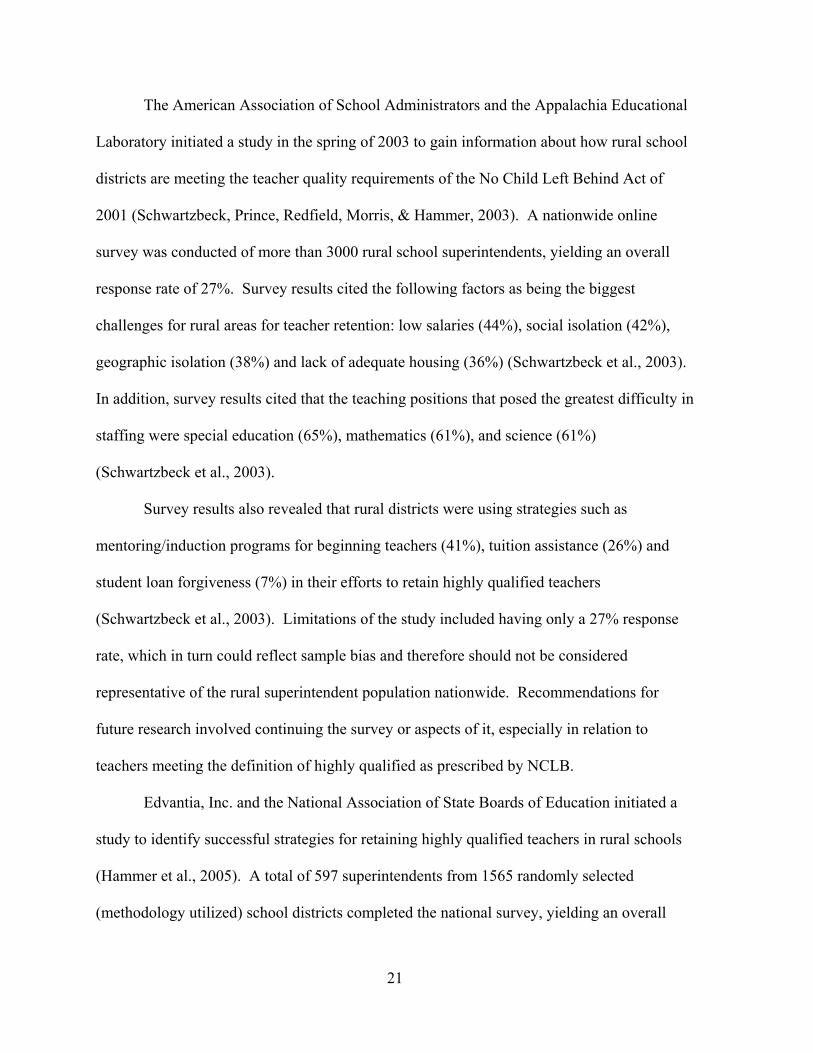
The National Center for Education Statistics [NCTAF] (2007) conducted a Teacher
Follow-up (TFS) Survey that sampled elementary and secondary school teachers who
participated in the previous year’s School and Staffing Survey (SASS) (National Center for
Education Statistics, 2007). Table 2 shows data from the 2004-2005 Teacher Follow-up

19
Survey. Table 2 shows that teachers who held provisional or temporary licenses left the field
or moved to other districts at a 22.8 % rate compared to a 15.4 % rate for teachers who held
regular or standard licenses.
Table 2 also shows that teachers who held regular or standard licenses moved less to
other schools or districts as compared to teachers who held probationary and waiver or
emergency licenses. These data revealed that White females made up the majority of the
American teacher labor force, and teachers who had annual salaries at $40,000 and above had
less attrition than teachers who made below $40,000. These data also revealed that Blacks
left the teaching profession at a higher rate than any other race/ethnicity.
Challenges for Small and Rural Areas
There are some specific challenges that small and rural school districts across the
nation face in the area of teacher retention. A main problem for rural districts as noted by
the American Association of School Administrators (1999) is retaining teachers. Nearly half
(49%) of all the school districts across the nation are rural and information on effective rural
teacher retention is limited (Hammer, Hughes, McClure, Reeves, & Salgado, 2005). Reeves
(2003) indicated that schools located on the outskirts of suburban areas face difficulty in
retaining teachers. A survey involving teachers in a rural British Columbia school district
revealed that teachers leave communities because of geographic isolation, weather,
inadequate shopping, and distance from larger communities and family (Murphy & Angelski,
1996/1997). Teacher salary also plays an important role in the retention of teachers in rural
areas. The Rural School and Community Trust (2000) indicated that the difference between
average rural teacher salaries and other teacher salaries varies by state from around $250 to
as much as $10,400.
20
Table 2
______________________________________________________________________________________
2004-2005 Teacher Follow-up Survey
“Number and percentage distribution of public school teacher stayers, movers, and leavers, by selected teacher and school
characteristics in the base year: 2004–2005
______________________________________________________________________________________
Numbers Percent
___________________________________________________
Total Stayers Movers Leavers Stayers Movers Leavers
______________________________________________________________________________________
Teachers 3,214,900 2,684,200 261,100 269,600 83.5 8.1 8.4
License type
Regular or standard 2,814,900 2,380,000 203,000 231,900 84.5 7.2 8.2
Probationary 116,800 90,600 17,300 9,000 77.5 14.8 7.7
Provisional or temporary 206,700 159,500 31,000 16,200 77.2 15.0 7.8
Waiver or emergency 26,900 20,600 2,700 3,700 76.3 9.9 13.7
None of the above 49,600 33,600 7,100 8,800 67. 9 14.4 17.7
Race/Ethnicity
White 2,726,900 2,287,800 216,300 222,800 83.9 7.9 8.2
Black 242,500 192,300 23,500 26,600 79.3 9.7 11.0
Hispanic 137,800 111,100 13,900 12,800 80.6 10.1 9.3
Asian/Other 49,300 40,300 3,900 5,100 81.8 7.9 10.3
Indian/Other 24,700 23,000 1,200 500 93.1 5.0 1.9
Multiple race 33,800 29,800 2,200 1,800 88.1 6.6 5.3
Base Salary
Less than $30,000 388,400 298,900 48,200 41,300 77.0 12.4 10.6
$30,000-$39,000 1,118,300 916,700 121,300 80,400 82.0 10.8 7.2
$40,000 or more 1,708,200 1,468,600 91,700 147,900 86.0 5.4 8.7
Sex
Male 783,700 657,700 65,300 60,700 83.9 8.3 7.7
Female 2,431,200 2,026.500 95,800 208,800 83.4 8.1 8.6
(National Center for Education Statistics, 2007, pp. 8-9). Notes: Asian/Other includes Native Hawaiian and Pacific Islander.
Indian/Other is American Indian and Alaska Native
______________________________________________________________________________________
21
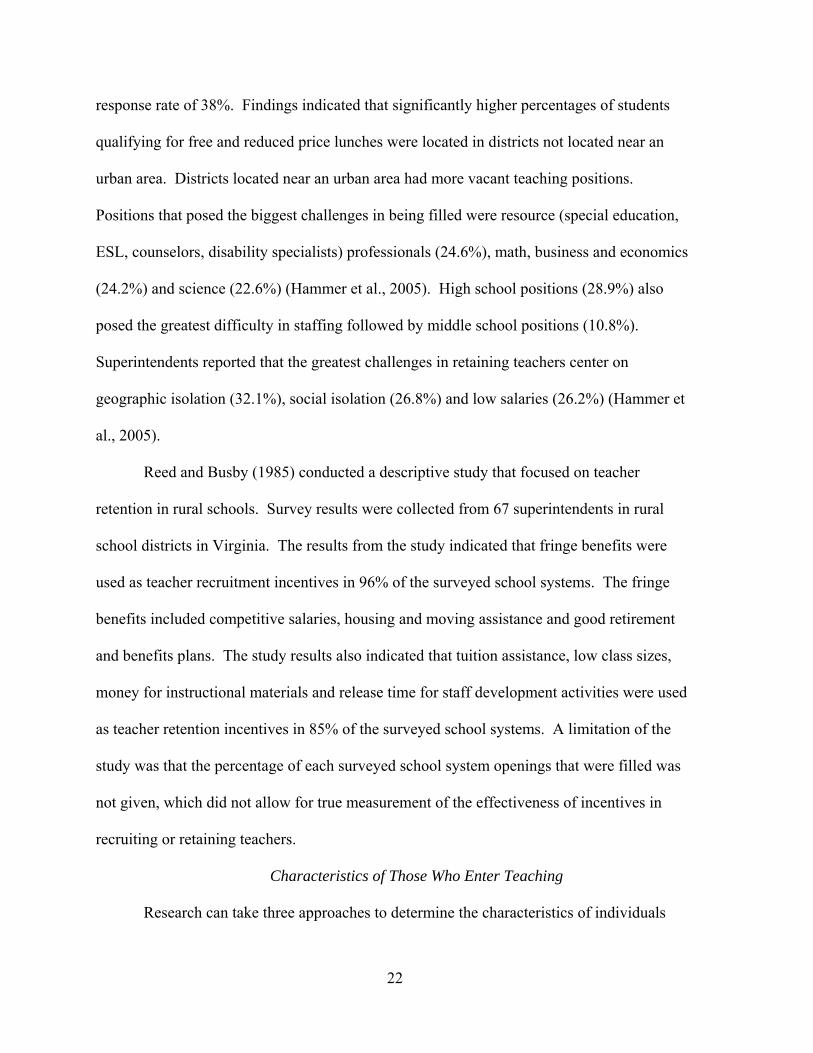
The American Association of School Administrators and the Appalachia Educational
Laboratory initiated a study in the spring of 2003 to gain information about how rural school
districts are meeting the teacher quality requirements of the No Child Left Behind Act of
2001 (Schwartzbeck, Prince, Redfield, Morris, & Hammer, 2003). A nationwide online
survey was conducted of more than 3000 rural school superintendents, yielding an overall
response rate of 27%. Survey results cited the following factors as being the biggest
challenges for rural areas for teacher retention: low salaries (44%), social isolation (42%),
geographic isolation (38%) and lack of adequate housing (36%) (Schwartzbeck et al., 2003).
In addition, survey results cited that the teaching positions that posed the greatest difficulty in
staffing were special education (65%), mathematics (61%), and science (61%)
(Schwartzbeck et al., 2003).
Survey results also revealed that rural districts were using strategies such as
mentoring/induction programs for beginning teachers (41%), tuition assistance (26%) and
student loan forgiveness (7%) in their efforts to retain highly qualified teachers
(Schwartzbeck et al., 2003). Limitations of the study included having only a 27% response
rate, which in turn could reflect sample bias and therefore should not be considered
representative of the rural superintendent population nationwide. Recommendations for
future research involved continuing the survey or aspects of it, especially in relation to
teachers meeting the definition of highly qualified as prescribed by NCLB.
Edvantia, Inc. and the National Association of State Boards of Education initiated a
study to identify successful strategies for retaining highly qualified teachers in rural schools
(Hammer et al., 2005). A total of 597 superintendents from 1565 randomly selected
(methodology utilized) school districts completed the national survey, yielding an overall
22
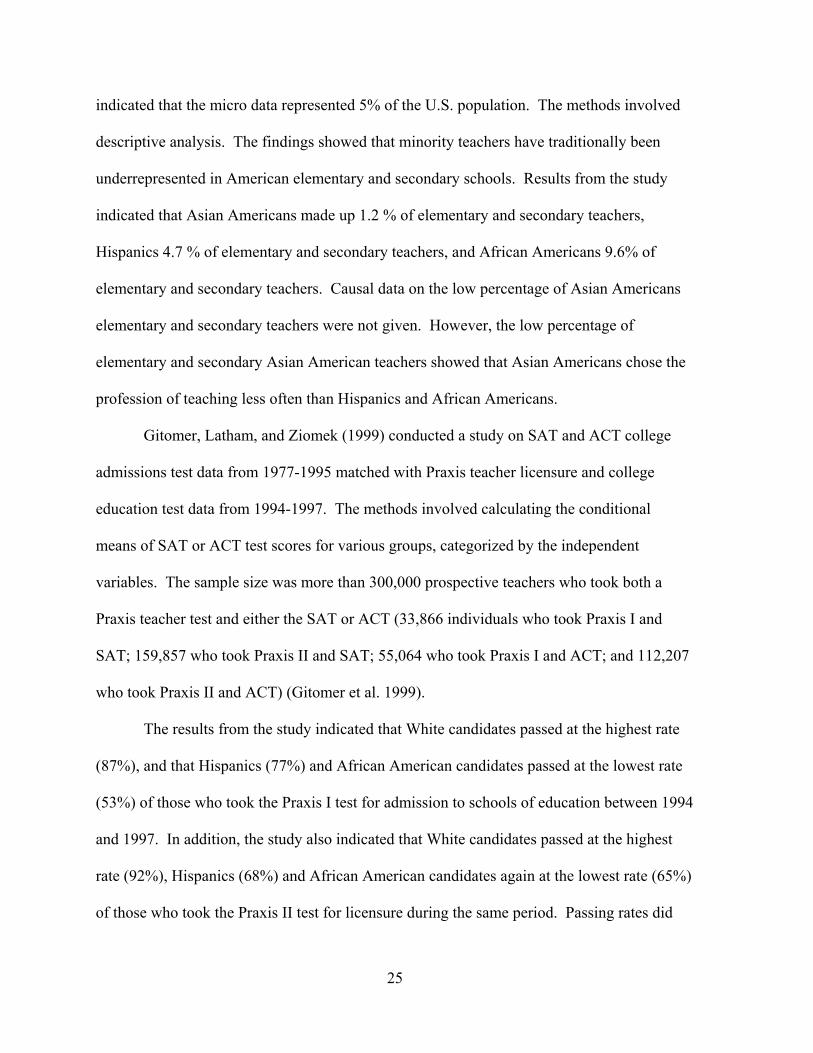
response rate of 38%. Findings indicated that significantly higher percentages of students
qualifying for free and reduced price lunches were located in districts not located near an
urban area. Districts located near an urban area had more vacant teaching positions.
Positions that posed the biggest challenges in being filled were resource (special education,
ESL, counselors, disability specialists) professionals (24.6%), math, business and economics
(24.2%) and science (22.6%) (Hammer et al., 2005). High school positions (28.9%) also
posed the greatest difficulty in staffing followed by middle school positions (10.8%).
Superintendents reported that the greatest challenges in retaining teachers center on
geographic isolation (32.1%), social isolation (26.8%) and low salaries (26.2%) (Hammer et
al., 2005).
Reed and Busby (1985) conducted a descriptive study that focused on teacher
retention in rural schools. Survey results were collected from 67 superintendents in rural
school districts in Virginia. The results from the study indicated that fringe benefits were
used as teacher recruitment incentives in 96% of the surveyed school systems. The fringe
benefits included competitive salaries, housing and moving assistance and good retirement
and benefits plans. The study results also indicated that tuition assistance, low class sizes,
money for instructional materials and release time for staff development activities were used
as teacher retention incentives in 85% of the surveyed school systems. A limitation of the
study was that the percentage of each surveyed school system openings that were filled was
not given, which did not allow for true measurement of the effectiveness of incentives in
recruiting or retaining teachers.
Characteristics of Those Who Enter Teaching
Research can take three approaches to determine the characteristics of individuals

23
who enter teaching. They are as follows: (a) “examining the characteristics of individuals
who choose teaching; (b) comparing those who choose teaching versus those who do not
choose teaching; or (c) examining the characteristics of individuals who choose to teach and
are chosen to teach by school districts” (Guarino et al., 2006, p.179). The research approach
taken for this study examined the characteristics of individuals who choose teaching. The
remaining two research approaches were not included because they were not germane to this
study.
Gender
Broughman and Rollefson (2000) conducted a study that analyzed three years of the
Schools and Staffing Survey (SASS) data. These data examined were for 184,000 newly
hired teachers in 1987-1988, 223,000 newly hired teachers in 1990-1991, and 259,000 newly
hired teachers in 1993-1994. The results of the study indicated that 78% of new teachers
hired in the 1987-1988 school year were female, 77.4% of new teachers hired in 1990-1991
were female and 72.5% of new teachers hired in 1993-1994 were female. This shows that
the number of newly hired teachers increased from the late 1980’s to the early 1990’s, while
the percentage of those teachers being female decreased slightly.
Flyer and Rosen (1997) conducted a study that analyzed data from the National
Center of Educational Statistics for the years 1960-1990, the Schools and Staffing Survey for
the years 1950-1990, the Current Population Survey for the years 1976-1991, the National
Longitudinal Survey of Youth for the years 1979-1991 and various status reports from the
National Education Association. The exact sample size was not given, but estimated to be in
the thousands. Results from the study indicated that nearly 50% of women graduating from
college in 1960 went into teaching, but fewer than 10% of women graduating from college in

24
1990 went into teaching. However, the study noted that women continued to dominate the
teaching profession. Specifically, almost 85% of elementary school teachers in 1990 were
female, and this has changed very little over several decades (Flyer & Rosen, 1997). This
shows that although there was a decrease in the overall percentage (50% to 10%) of women
who graduated from college who entered teaching in 1990 as compared to 1960, the teaching
profession is still predominantly female.
Henke, Zahn, and Carroll (2001) conducted a study that analyzed data from the 1993
Baccalaureate and Beyond Longitudinal Study that involved individuals who graduated from
college between 1992 and 1993 and were participants in follow-up interviews in 1994 and
1997. The sample size was 9,300 men and women who received bachelor’s degrees between
July 1992 and June 1993.
The findings identified those graduates (education and non-education majors) who
entered the teacher pipeline when they reported that they had taught in an elementary or
secondary school, had become certified to teach, had applied for a teaching position, or were
considering teaching at the time of either the 1994 or 1997 interview. Results from the study
indicated that women were more likely than men to enter the teacher pipeline. Within four
years of graduation from college, 43% of female graduates had entered the teacher pipeline
with 17.1% who actually had taught, compared to 29% of male graduates of which 7.5% had
actually taught. Results of the study also indicated that 82% of the graduates who were
working as teachers in 1994 were still working as teachers in 1997. (Henke et al., 2001)
Race/Ethnicity
Rong and Preissle (1997) conducted a study that analyzed United States census data
for the years 1970, 1980 and 1990. The exact sample size was not given, but the study
25
indicated that the micro data represented 5% of the U.S. population. The methods involved
descriptive analysis. The findings showed that minority teachers have traditionally been
underrepresented in American elementary and secondary schools. Results from the study
indicated that Asian Americans made up 1.2 % of elementary and secondary teachers,
Hispanics 4.7 % of elementary and secondary teachers, and African Americans 9.6% of
elementary and secondary teachers. Causal data on the low percentage of Asian Americans
elementary and secondary teachers were not given. However, the low percentage of
elementary and secondary Asian American teachers showed that Asian Americans chose the
profession of teaching less often than Hispanics and African Americans.
Gitomer, Latham, and Ziomek (1999) conducted a study on SAT and ACT college
admissions test data from 1977-1995 matched with Praxis teacher licensure and college
education test data from 1994-1997. The methods involved calculating the conditional
means of SAT or ACT test scores for various groups, categorized by the independent
variables. The sample size was more than 300,000 prospective teachers who took both a
Praxis teacher test and either the SAT or ACT (33,866 individuals who took Praxis I and
SAT; 159,857 who took Praxis II and SAT; 55,064 who took Praxis I and ACT; and 112,207
who took Praxis II and ACT) (Gitomer et al. 1999).
The results from the study indicated that White candidates passed at the highest rate
(87%), and that Hispanics (77%) and African American candidates passed at the lowest rate
(53%) of those who took the Praxis I test for admission to schools of education between 1994
and 1997. In addition, the study also indicated that White candidates passed at the highest
rate (92%), Hispanics (68%) and African American candidates again at the lowest rate (65%)
of those who took the Praxis II test for licensure during the same period. Passing rates did

26
not differ much by gender. The researchers noted that the teacher candidate pool was
predominantly White before testing (85%), and the test results would likely increase the
percentage of White teachers even further. Limitations of the study included using Praxis
data as the sole measure of teacher qualifications and statistical tests of differences in mean
scores or proportions of people passing the tests were not performed.
Kirby, Berends, and Naftel (1999) conducted a study that analyzed longitudinal
administrative data on public school teachers in Texas who were followed from 1980 through
1996. The sample size was 98,951 teachers. The results of the study indicated that the
percentage of Hispanic teachers had increased significantly from 11% in 1981 to 15% in
1996. However, the percentage of African American teachers decreased from 11% in 1981
to 8% in 1996. The study further indicated that the proportion of minorities among new
teachers was slightly higher at 26% in 1996 as compared to 23% of all teachers during the
same time period.
The study also pointed out that while the enrollment of minority students was
expected to increase significantly over the next 10 to 20 years, the recruitment of minority
individuals into the teaching profession did not keep pace with the increase in the percentage
of minority students in grades kindergarten through twelve in the 1980s and early 1990s.
This is consistent with the findings in the study that showed that while the percentage of
minority teachers in Texas was 26% in 1996, the percentage of minorities among K-12
students in Texas was just over 50% during the same period. Limitations of the study
centered on the fact that the regressions were estimated separately by race, which made
interracial comparisons impossible.

27
Ability
(ACT Scores, SAT Scores and Postsecondary Institution Selection)
Stinebrickner (2002) conducted a descriptive study that compared SAT scores of
teachers versus non-teachers. The data were taken from the National Longitudinal Study of
the High School Class of 1972, with follow-up surveys through 1986, and a supplemental
survey about teaching experiences. The sample size was 422 female teachers and 1,028
female non-teachers. A regression analysis was conducted using a subset of 313 female
teachers and 772 female non-teachers (Stinebrickner, 2002).
The results from the study indicated that non-teachers average combined verbal and
math SAT scores were 95 points higher than that of teachers in the sample. The study also
indicated that teachers with higher salaries are less likely to change occupations or leave the
workforce. The study results indicated that a large amount of teacher attrition is directly
related to marriage and pregnancy. Limitations of the study included no comprehensive
discussion of the estimates on each independent variable for teachers versus non-teachers.
Ballou (1996) conducted a correlational study that also employed a regression
analysis that analyzed data from a Survey of Recent College Graduates. The survey was a
questionnaire administered to individuals one year after graduating with a bachelor’s or
master’s degree. The survey was conducted six times over the period of 1976 through 1991.
The sample size consisted of 50,000 new bachelor’s degree recipients, of which 15,123
completed teacher education degrees (Ballou, 1996).
The results from the study indicated that students who graduated from colleges that
were defined as “selective” institutions as per the 1991 Barron’s ranking were less likely to
choose teacher education as a major and less likely to choose to teach after becoming

28
licensed than those who graduated from colleges that were defined as “average”. Limitations
of the study included no data on how the Barron’s rankings changed in the period under
study and no data on actual job offers made.
Podgursky, Monroe and Watson (2004) conducted a study that compared ACT scores
of new public school teachers who graduated from Missouri four year institutions of higher
education in the 1997-1998 and 1998-1999 years to Missouri graduates who did not enter
teaching during the same time period. The results from the study indicated that those who
entered teaching had significantly lower ACT scores than those who did not enter teaching.
The study also indicated that the lowest ACT scores were made by elementary school
teachers, but did not specifically state why (Podgursky et al., 2004).
Psychological and Family Factors
Farkas, Johnson, and Foleno (2000) used an attitude survey to determine
psychological and family related factors that impacted individuals’ decisions to enter the
teaching profession. This national survey was conducted by Public Agenda and had a
randomly selected sample of 664 public school teachers with five or fewer years of teaching
experience. The results from the study indicated new teachers stated it was essential (83%)
that you love the job you do, the job allows time for family (81%), and that the job must
contribute to society to help others (72%) (Farkas et al., 2000). The study also reported that
teachers stated that their current jobs had the aforementioned characteristics. In addition, the
study reported that new teachers (86%) believed that only those “called to teach” should do
so and teaching (52%) was something they longed to do (Farkas et al., 2000).
Shipp (1999) conducted a study that measured the importance of several factors
individuals’ placed on their decisions in choosing teaching as a career. These data were 159
29
questionnaires administered at one historically Black university in the Southeast, and 298
questionnaires administered to African American students at one predominantly White urban
university in the Midwest. The questionnaire response rate was 57.5% (263 of 457). Fifty-
two percent of students were education majors, and 48% were not. The results from the
study indicated that education majors placed greater importance on contributing to society as
a reason to enter teaching than non-education majors. The non-education majors placed great
emphasis on salary, advancement, job security, and prestige (Shipp, 1999). The study did not
compare the questionnaire responses of students from the historically Black university to
those questionnaire responses of students from the predominantly White urban university.
King (1993) conducted a survey that involved a descriptive analysis of reasons why a
cohort of African-American teachers entered teaching. The sample size was 41, which
included 14 prospective teachers, 26 beginning teachers, and 1 former (no longer teaching)
beginning teacher. The results from the study indicated that the major reasons that attracted
them to teaching were the opportunity to work with young people (83%), the feeling that
their abilities were well suited to teaching (78%), the belief that teachers contributed to the
betterment of society by impacting the lives of young people (73%), and the belief that
teaching provided many opportunities for creativity (66%) (King, 1993). Limitations of the
study included a small sample size, no comparison group, and all participants being from one
institution.
Chapter Summary (Analysis of Literature)
The findings from this initial review of literature gave the researcher a better
understanding from a national context the factors that impact teacher attrition, the teacher
retention challenges for small and rural areas and the characteristics of those who enter

30
teaching. The studies on teacher attrition found that professional prestige, poor working
conditions, lack of resources, student discipline, being ill-prepared to work with children of
varying abilities, lack of teacher input in decision making, and lack of parental and
administrative support were factors identified by teachers who chose to move to other school
districts or leave the teaching profession altogether. Other factors related to teacher attrition
included compensation and benefits, years of total teaching experience, and licensure. The
studies on compensation and benefits found that increases in salary reduced teacher
movement between districts, and bonus incentives reduced teacher attrition in the areas of
math, science, and special education. Benefits were also viewed as being much more
important factors in retention to education employees as opposed to education employers.
The studies on years of experience, subject-area, and licensure found that the highest teacher
attrition rates were found in teachers who were in their first five years of teaching and
teachers who held provisional or temporary licenses left the teaching profession or moved to
other school districts at a higher percentage than teachers who held regular or standard
licenses.
The studies on teacher retention challenges for small and rural areas found that
geographic isolation, social isolation, and lower pay were major obstacles. Salary was also
identified in some of the studies that discussed teacher attrition. Subject areas that posed the
greatest difficulty in staffing were special education, mathematics and science.
The studies on characteristics of those who enter teaching found that the American
teaching labor force was predominantly White and female, that minorities were
underrepresented in the teaching profession and that individuals’ with higher intellectual
ability and graduated from “selective” institutions chose teaching as a career less often. The
31
studies also found teacher licensure tests impact minority teacher retention due to low scores
on the Praxis I and Praxis II. The studies also found that the ability to contribute to society
had significant importance when choosing teaching as a career.
The researcher believes that implications of these results could lead school district
leaders and policy makers to examine the current state of educational practice in their
specific localities as it relates to teacher retention and implement educational practice and
policies that help reduce teacher attrition. The educational suffering that children experience
due to teacher attrition coupled with the large amounts of money that school districts spend
when teachers leave make this a critical issue for educational leadership.
This review of literature revealed that research on teacher attrition for small and rural
districts is limited, and that continued research needs to be conducted in this area. Therefore,
this study identified the factors that impact teacher attrition in two small school districts in
Southeastern Virginia. Additionally, this study identified the challenges that both districts
face that impact teacher attrition and identified the characteristics of those who entered
teaching and then left both school districts. The research questions for this study were as
follows:
Research Questions
1. What factors impacted teachers’ decisions to leave two small school districts in
Southeastern Virginia?
2. What are the major challenges that impact teacher attrition in two small school
districts in Southeastern Virginia as perceived by teachers who left both school
districts?
3. What are the characteristics of those who entered the teaching profession and then

32
left two small school districts in Southeastern Virginia?
4. What impact does race/ethnicity, subject-area, years of experience and
licensure have on teacher attrition in two small school districts in Southeastern
Virginia?
The methodology and research design are explained in chapter three.
33
CHAPTER THREE
METHODOLOGY
Purpose of the Study
The purpose of this study was to identify the factors that impact teacher attrition in
two small school districts in Southeastern Virginia. As stated previously, the research
questions were as follows:
Research Questions
1. What factors impacted teachers’ decisions to leave two small school districts in
Southeastern Virginia?
2. What are the major challenges that impact teacher attrition in two small school
districts in Southeastern Virginia as perceived by teachers who left both school
districts?
3. What are the characteristics of those who entered the teaching profession and then
left two small school districts in Southeastern Virginia?
4. What impact does race/ethnicity, subject-area, years of experience and
licensure have on teacher attrition in two small school districts in Southeastern
Virginia?
Research Design/Methodology
This study is quantitative in nature. This methodological research approach “is an
objective, formal, systematic process in which numerical data are used to quantify or
measure phenomena and produce findings. It describes, tests and examines cause and effect
relationships using a deductive process of knowledge attainment” (Carr, 1994, p. 716).
Research Design Justification
34
The researcher believes this design was the best way to gather the data needed for this
study due to the fact that quantitative research allowed the researcher to utilize surveys and
measure things as they were (Neill, 2007). The purpose of this study was to identify the
factors that impact teacher attrition in two small school districts in Southeastern Virginia.
The researcher in this descriptive study made no attempt to change behaviors or conditions
by manipulating variables (Neill, 2007).
Site/Sample Selection
Two small school districts in Southeastern Virginia were selected for this study. The
two districts selected were Franklin City Public Schools and Surry County Public Schools.
The two districts were chosen by the researcher due to the fact that both school districts
experienced a high degree of teacher attrition after the 2007-2008 school year. Franklin City
Public Schools is where the researcher works in the capacity of Assistant Superintendent of
Schools and is responsible for all human resources functions. Franklin City Public Schools
had to replace 34 out of 128 teachers at the conclusion of the 2007-2008 school year, which
equates to a 27% turnover rate.
The researcher conversed with the Human Resources Director for Surry County
Public Schools via phone, and he indicated that Surry County Public Schools had to replace
20 out of 112 teachers at the conclusion of the 2007-2008 school year (P. Barnes, personal
communication, December 15, 2008). This equates to a turnover rate of 18% for Surry
County Public Schools. A 2005 study conducted by the Alliance for Excellent Education
found that 16% (12,656 left or moved of 80,987 total) of public school teachers in Virginia
left the teaching profession altogether or moved from one school district to another school
district. The teacher attrition rates previously mentioned for Franklin City Public Schools

35
(27%) and Surry County Public Schools (18%) at the conclusion of the 2007-2008 school
year were higher than the Virginia state teacher attrition rate (16%) that was found at the time
of the Alliance for Excellent Education study (2005).
The school districts were also chosen due to convenience sampling, similarity in
student demographics, size of districts, number of teachers and number of schools. The
Franklin City Public Schools district serves a high minority population with less than 1300
students who attend three schools and employs between 100 and 130 teachers (National
Center for Education Statistics, 2005a). The Surry County Public Schools district serves a
high minority population with less than 1300 students who attend three schools and employs
between 100 and 130 teachers (National Center for Education Statistics, 2005b). At the time
of this study the combined teaching population of both school districts was 240 teachers.
Data Collection Procedures
Total teacher population data for the 2007-2008 school year were collected
electronically from the Human Resources departments of the Franklin City and Surry County
school districts. The data that were requested and collected electronically from each district
included the following: name of school district, total number of teachers in each school
district, specific subjects taught or building/grade level, total years of teaching experience,
license type, race/ethnicity, gender, number of teachers who stayed or left and number of
teachers who resigned, retired or were non-renewed. Survey data were also collected from
the teachers in both school districts who left after the 2007-2008 school year. The sample (n)
size that received the survey questionnaires was 52 teachers combined from both districts.
Data Gathering Procedures
The researcher gained the necessary permission from the Institutional Review Board

36
(IRB) of Virginia Polytechnic Institute and State University (Appendix O) to collect data and
conduct research under the auspices of the university on February 19, 2009. The researcher
then proceeded to hand deliver a cover letter (Appendix A) to the Superintendent of Schools
of each district with detailed explanation of the study, the procedural safeguards and a district
consent form. The district consent form required a signature from each superintendent
granting approval to collect the data needed for this study. The district consent forms are
shown in Appendices B and C.
After obtaining approval from both superintendents to collect the data, the researcher
asked both school districts to submit the requested information electronically. The researcher
asked the Human Resources department of Surry County Public Schools to provide contact
information (mailing addresses & phone numbers) on all teachers who left the school district
after the 2007-2008 school year. The researcher had prior access to a 2007-2008 district
directory that included the names and mailing addresses for all teachers in the Franklin City
Public Schools district.
Instruments Design
Excel spreadsheets from the Human Resources Departments of Franklin City Schools
and Surry County schools were sent electronically. After receiving the information from
both school districts, the researcher created a single database that included all of the data
from both school districts. The database created by the researcher is illustrated in Appendix
Q. The database was utilized to help answer research question four. Table 3 shows an
example of the data that were requested from the two school districts for the 2007-2008
school year.
The researcher developed survey (Appendix F) sought to collect 2007-2008 teacher

37
Table 3
Teacher Data Example
_________________________________________________________________________
T. Sub. Race L. Years Re. Res. Ret. Non. District
1 E. Sci. B Prov. 2 Yes No No No Franklin
2 Bio. B S. 4 No No Yes No Surry
3 Chem. W Prov. 1 No No No Yes Surry
4 Phy W S 15 No No No No Franklin
Note: E. Sci. = Earth Science, Bio. = Biology, Chem. = Chemistry, Phy. = Physics, Prov. =
Provisional, S= Standard , T. =Teacher, Sub. = Subject, L. = Licensure, Re. = Retained, Res.
=Resigned, Ret. = Retired, Non. = Non-renewed
__________________________________________________________________________
data on the factors that impacted teachers’ decisions to leave who left both school districts, to
identify teacher retention challenges as perceived by teachers who left both school districts,
and to identify characteristics of those who entered the teaching profession and then left the
two school districts. These data from the survey responses were utilized to answer research
questions one through four.
Survey Validation Instruments
Two researcher developed survey validation instruments were distributed to
colleagues in the 2005 Hampton Roads area doctoral cohort at Virginia Polytechnic Institute
and State University to measure validity. One survey validation instrument (Appendix G)
consisting of 15 questions was given to the cohort in October of 2008, and another survey
validation instrument (Appendix H) consisting of ten questions was administered in
November of 2008. The numerical goal that the researcher was seeking for validity was

38
80%. The 80% standard is the widely accepted number in the Behavioral and Social
Sciences that measure statistical power and validity (Trochim, 2006). This standard indicates
that the odds of confirming the theory correctly that there is a relationship between one thing
to another when in fact there is at least at an 80% rate (Trochim, 2006). The researcher used
a four point Likert scale to determine clarity (question was easy to understand) as follows: 1
= not clear (nc), 2 = somewhat clear, 3 = clear (c), and 4 = very clear (vc).
This means that each survey question had to have alignment with a specific research
question by having an 80% agreement by cohort members on each question. Each survey
question also had to have a clarity rating of at least 3.0 (clear and above) on the Likert scale.
Any question that had under an 80% cohort agreement that the question related to a specific
research question or had clarity below 3.0 on the Likert scale was considered unreliable. The
survey validation instrument (instrument one) given in October of 2008 had 8 out of 15
survey questions reach an 80% cohort agreement and a clarity rating at 3.0 or above. This
means that at least 11 out of 13 cohort members agreed that 8 out of 15 survey questions had
alignment and clarity as specified above. The seven survey questions that did not have the
80% alignment and 3.0 clarity rate were revised or eliminated and a second survey validation
instrument was administered.
The second survey validation instrument (instrument two) given in November of
2008 had five out of 10 survey questions reach an 80% cohort agreement and a clarity rating
of 3.0 or above. This means that at least 14 out of 17 cohort members agreed that five out of
ten survey questions had alignment and clarity as specified above. The five survey questions
that did not have the 80% alignment and 3.0 clarity rate were eliminated. The validity results
of both survey instruments are in Appendices I through L. The survey in Appendix F is the

39
final survey used for the study (seven questions from survey validation instrument one and
five questions from survey validation instrument two) questions having at least an 80%
validation rate and a 3.0 clarity rate. The researcher did not utilize one question from survey
validation instrument one (question 13) though validated.
Data Treatment and Management
All database information was stored on the home computer of the researcher. The
database information also had a backup disk that was kept in a locked file cabinet at the
home of the researcher. Any identifiable teacher information was recoded to numbers. The
returned surveys were also kept in the locked file cabinet at the home of the researcher. After
successfully defending the dissertation and making appropriate written revisions, the results
will be shared with the Superintendents of Franklin City and Surry County Schools and the
information will be deleted from the home computer of the researcher and the backup disk
destroyed.
Data Analysis Techniques
The researcher collected total teacher population data for each school district
electronically. These data from the electronic submissions and the survey responses were
input into SPSS to conduct the frequency and cross tabulation procedures as appropriate. All
survey responses were recorded and placed in table format with frequency and cross
tabulation of responses given.
Methodology Summary
The cross tabulation procedure was conducted on the data submitted electronically
from both school districts. This procedure was conducted utilizing SPSS and allowed the
researcher to distinguish between school districts. The frequency procedure allowed the

40
researcher to determine the percentages by variable category. The frequency and cross
tabulation procedures were conducted on the survey responses. The cross tabulation results
from the electronic submissions and the frequency and cross tabulation results from the
survey responses were reported out utilizing descriptive statistics.
41
CHAPTER FOUR
RESULTS OF THE STUDY
The purpose of this study was to identify the factors that impact teacher attrition in
two small school districts in Southeastern Virginia. This study through survey responses
gathered data from teachers who left both districts after the 2007-2008 school year on the
factors that impacted their decisions to leave and the challenges they perceived both school
districts face that impact teacher attrition. Other data from the survey responses identified
characteristics of the teachers who left both school districts after the 2007-2008 school year.
Additionally, 2007-2008 data on the total teacher population in both school districts were
collected electronically from the Human Resources departments of both school districts. The
research questions that guided this study were as follows:
1. What factors impacted teachers’ decisions to leave two small school districts in
Southeastern Virginia?
2. What are the major challenges that impact teacher attrition in two small school
districts in Southeastern Virginia as perceived by teachers who left both school
districts?
3. What are the characteristics of those who entered the teaching profession and then
left two small school districts in Southeastern Virginia?
4. What impact does race/ethnicity, subject-area, years of experience and
licensure have on teacher attrition in two small school districts in Southeastern
Virginia?
This chapter is organized as follows: receipt of electronic data, mailing of surveys and
receipt of surveys, data results and analysis, and chapter summary.

42
Receipt of Electronic Data
The researcher received the information sent electronically by both school districts
on March 1, 2009. The information received from each district included the name of the
school district, total number of teachers in each school district, specific subjects taught or
building/grade level, years of teaching experience, license type, race/ethnicity, gender,
number of teachers who stayed or left and number of teachers who resigned, retired or were
non-renewed. These data are shown in recoded form in Appendix Q.
Mailing of Surveys and Receipt of Surveys
The information received electronically from both school districts revealed that a total
of 54 out of 240 teachers combined left the Surry County and Franklin City School districts
after the 2007-2008 school year. These data submitted also revealed that two of the teachers
from Surry County died during the 2007-2008 school year. Therefore, the researcher mailed
52 surveys with an attached cover letter (Appendix D) on March 3, 2009 to those teachers
who left both school districts after the 2007-2008 school year. A total of 36 teacher survey
responses were received by March 31, 2009.
The researcher then conducted a follow-up mailing on April 3, 2009 to the 16
teachers who did not respond from the initial mailing. The cover letter for the follow-up
mailing is shown in Appendix E. Three additional teacher responses were received by April
17, 2009 in addition to two surveys being returned to sender with no forwarding address.
The researcher then attempted to contact by phone on April 20, 2009 the 13 (including the
two scheduled survey recipients that were returned to sender) teachers that did not respond
from the second mailing. The researcher was able to leave messages for two of the thirteen
teachers to give a return call, but the two teachers did not return the call. Another eight
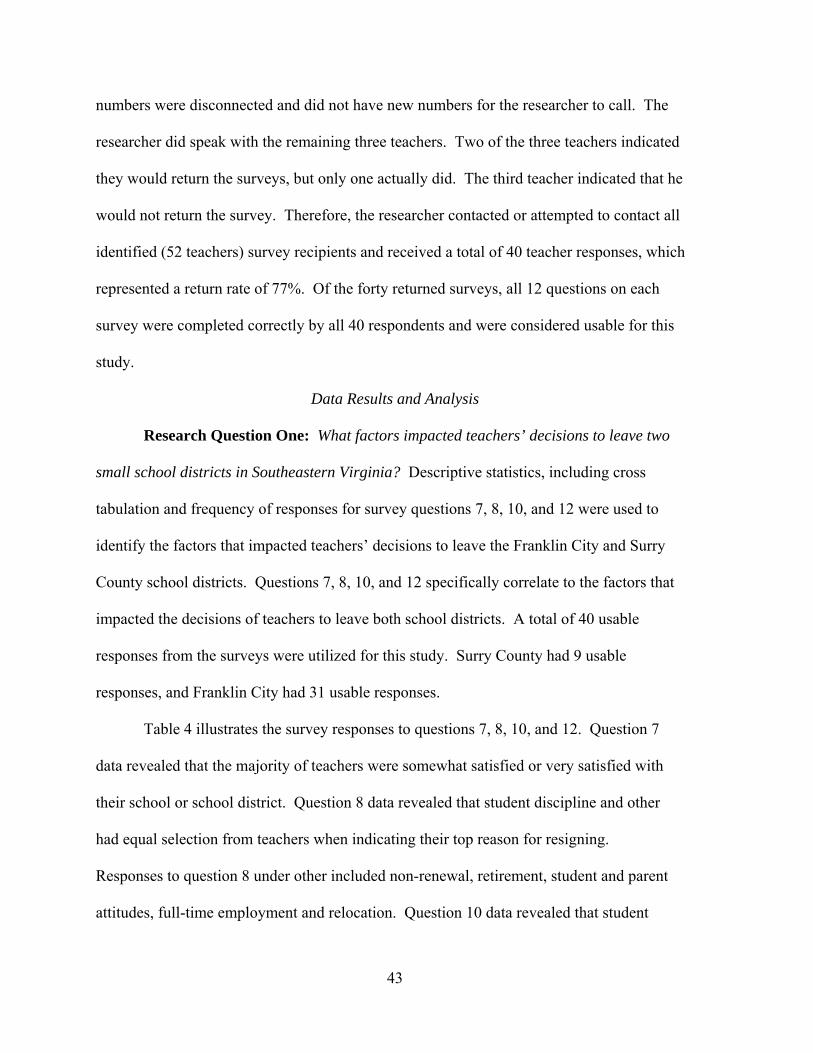
43
numbers were disconnected and did not have new numbers for the researcher to call. The
researcher did speak with the remaining three teachers. Two of the three teachers indicated
they would return the surveys, but only one actually did. The third teacher indicated that he
would not return the survey. Therefore, the researcher contacted or attempted to contact all
identified (52 teachers) survey recipients and received a total of 40 teacher responses, which
represented a return rate of 77%. Of the forty returned surveys, all 12 questions on each
survey were completed correctly by all 40 respondents and were considered usable for this
study.
Data Results and Analysis
Research Question One: What factors impacted teachers’ decisions to leave two
small school districts in Southeastern Virginia? Descriptive statistics, including cross
tabulation and frequency of responses for survey questions 7, 8, 10, and 12 were used to
identify the factors that impacted teachers’ decisions to leave the Franklin City and Surry
County school districts. Questions 7, 8, 10, and 12 specifically correlate to the factors that
impacted the decisions of teachers to leave both school districts. A total of 40 usable
responses from the surveys were utilized for this study. Surry County had 9 usable
responses, and Franklin City had 31 usable responses.
Table 4 illustrates the survey responses to questions 7, 8, 10, and 12. Question 7
data revealed that the majority of teachers were somewhat satisfied or very satisfied with
their school or school district. Question 8 data revealed that student discipline and other
had equal selection from teachers when indicating their top reason for resigning.
Responses to question 8 under other included non-renewal, retirement, student and parent
attitudes, full-time employment and relocation. Question 10 data revealed that student
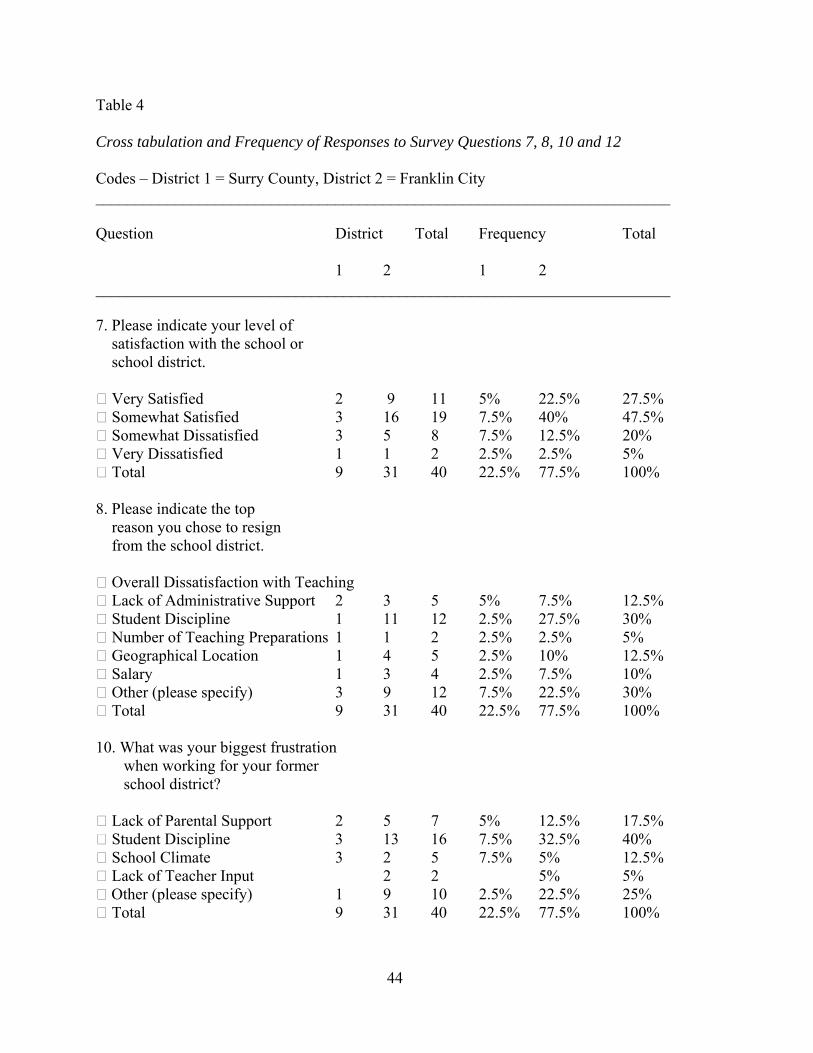
44
Table 4
Cross tabulation and Frequency of Responses to Survey Questions 7, 8, 10 and 12
Codes – District 1 = Surry County, District 2 = Franklin City ________________________________________________________________________
Question District Total Frequency Total
1 2 1 2 ________________________________________________________________________ 7. Please indicate your level of satisfaction with the school or school district.
Very Satisfied 2 9 11 5% 22.5% 27.5% Somewhat Satisfied 3 16 19 7.5% 40% 47.5% Somewhat Dissatisfied 3 5 8 7.5% 12.5% 20% Very Dissatisfied 1 1 2 2.5% 2.5% 5% Total 9 31 40 22.5% 77.5% 100% 8. Please indicate the top reason you chose to resign from the school district.
Overall Dissatisfaction with Teaching Lack of Administrative Support 2 3 5 5% 7.5% 12.5% Student Discipline 1 11 12 2.5% 27.5% 30% Number of Teaching Preparations 1 1 2 2.5% 2.5% 5% Geographical Location 1 4 5 2.5% 10% 12.5% Salary 1 3 4 2.5% 7.5% 10% Other (please specify) 3 9 12 7.5% 22.5% 30% Total 9 31 40 22.5% 77.5% 100% 10. What was your biggest frustration when working for your former school district?
Lack of Parental Support 2 5 7 5% 12.5% 17.5% Student Discipline 3 13 16 7.5% 32.5% 40% School Climate 3 2 5 7.5% 5% 12.5% Lack of Teacher Input 2 2 5% 5% Other (please specify) 1 9 10 2.5% 22.5% 25% Total 9 31 40 22.5% 77.5% 100%

45
Table 4 cont’d ________________________________________________________________________
Codes – District 1 = Surry County, District 2 = Franklin City
Question District Total Frequency Total
1 2 1 2
________________________________________________________________________
12. Please state one factor (if any) that would have changed your decision to leave the school district.
More Salary 4 4 10% 10% More Teacher Input 1 1 2.5% 2.5% Better Student Discipline 1 9 10 2.5% 22.5% 25% More Parental Support 1 1 2.5% 2.5% Other 7 17 24 17.5% 42.5% 60% Total 9 31 40 22.5% 77.5% 100% ________________________________________________________________________ discipline was the biggest frustration indicated by teachers. Responses to question 10 under
other included number of at-risk students, student accountability, micromanagement,
increasing demands, inclusion, number of meetings and lack of an appropriate curriculum
and lack of equipment. Question 12 data revealed that the factor selected by teachers by
majority percentage that would have changed their decisions to leave was other. Various
responses were given to question 12 under other including promotion opportunities, non-
renewal, retirement, inclusion, teaching at a different grade level, lack of planning time and
full-time employment.
Research Question Two: What are the major challenges that impact teacher
attrition in two small school districts in Southeastern Virginia as perceived by teachers who
left both school districts? Descriptive statistics, including cross tabulation and frequency of

46
survey responses to question 11 were used to identify the major challenges that impact
teacher attrition in the Franklin City and Surry County school districts as perceived by
teachers who left both school districts. Question 11 specifically correlates to the major
challenges identified by teachers who left both school districts. Table 5 illustrates the
responses to question 11. Question 11 data revealed that the major challenges that affect
teacher retention as perceived by teachers who left both school districts were geographical
location, other and salary. A further breakdown by district showed that the major challenges
identified by teachers in Surry County were geographical location, followed by salary. The
major challenges identified by teachers from Franklin City were other with emphasis on
student discipline and administrative support, followed by geographical location.
Research Question Three. What are the characteristics of those who entered the
teaching profession and then left two small school districts in Southeastern Virginia?
Descriptive statistics, including cross tabulation and frequency of survey responses to
questions 1, 2, and 3 were used to identify the characteristics of those who entered the
teaching profession and then left the Franklin City and Surry County school districts.
Questions 1, 2, and 3 specifically correlate to the characteristics of those who entered
the teaching professions and then left both school districts. Table 6 illustrates the
responses to questions 1, 2, and 3. Question 1 data revealed that the major reason
indicated by teachers who chose to enter the teaching profession and then left both school districts was impacting the lives of children. Question 2 data revealed that a slight
majority of the teachers who left had not gone through student teaching as opposed to those
who went through student teaching. Question 3 data revealed that more teachers had
teachers in their families as opposed to those who didn’t have teachers in their families by a

47
Table 5 Cross tabulation and Frequency of Responses to Survey Question 11 Codes – District 1 = Surry County, District 2 = Franklin City ________________________________________________________________________
Question District Total Frequency Total
1 2 1 2 ________________________________________________________________________ 11. What do you see as the biggest challenge for your former school district in retaining teachers? Size of District 1 2 3 2.5% 5% 7.5% Geographical Location 5 11 16 12.5% 27.5% 40% Salary 2 6 8 5% 15% 20% Other (please specify) 1 12 13 2.5% 30% 32.5% Total 9 31 40 22.5% 77.5% 100% ________________________________________________________________________ margin of 15%.
Research Question Four. What impact does race/ethnicity, subject-area, years of
experience and licensure have on teacher attrition in two small school districts in
Southeastern Virginia? Descriptive statistics, including cross tabulation and frequency of
survey responses to questions 4, 5, 6 and 9 were used to identify the race/ethnicity, the
types of licenses held and the disciplines taught by teachers who left the Franklin City
and Surry County school districts after the 2007-2008 school year. Questions 4, 5, and 6
specifically correlate to the types of licenses held and disciplines taught by the teachers who left both school districts. Question 9 correlates to the race/ethnicity of teachers who left both school districts. Table 7 illustrates the responses to questions 4, 5, 6 and 9. Question 4 data revealed that the majority of teachers who left both school districts held
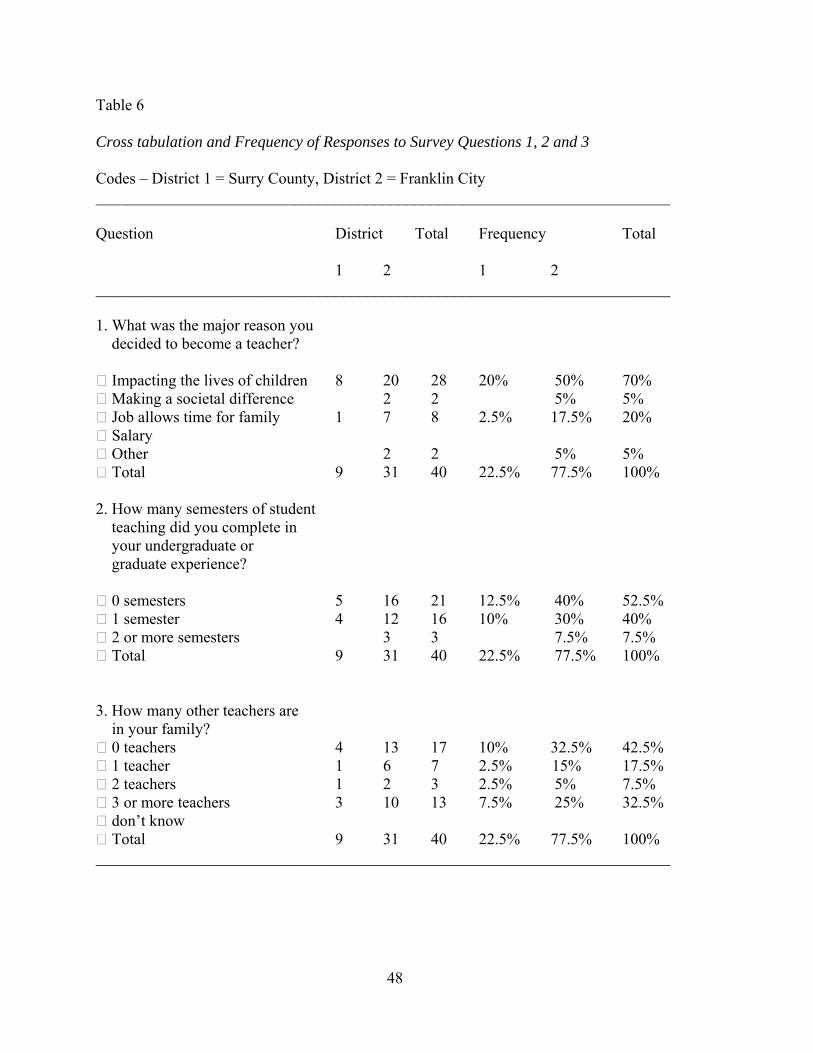
48
Table 6
Cross tabulation and Frequency of Responses to Survey Questions 1, 2 and 3
Codes – District 1 = Surry County, District 2 = Franklin City ________________________________________________________________________
Question District Total Frequency Total
1 2 1 2 ________________________________________________________________________
1. What was the major reason you decided to become a teacher? Impacting the lives of children 8 20 28 20% 50% 70% Making a societal difference 2 2 5% 5% Job allows time for family 1 7 8 2.5% 17.5% 20% Salary Other 2 2 5% 5% Total 9 31 40 22.5% 77.5% 100% 2. How many semesters of student teaching did you complete in your undergraduate or graduate experience? 0 semesters 5 16 21 12.5% 40% 52.5% 1 semester 4 12 16 10% 30% 40% 2 or more semesters 3 3 7.5% 7.5% Total 9 31 40 22.5% 77.5% 100% 3. How many other teachers are in your family? 0 teachers 4 13 17 10% 32.5% 42.5% 1 teacher 1 6 7 2.5% 15% 17.5% 2 teachers 1 2 3 2.5% 5% 7.5% 3 or more teachers 3 10 13 7.5% 25% 32.5% don’t know Total 9 31 40 22.5% 77.5% 100% ________________________________________________________________________

49
Table 7
Cross tabulation and Frequency of Responses to Survey Questions 4, 5, 6 and 9 Codes – District 1 = Surry County, District 2 = Franklin City ________________________________________________________________________
Question District Total Frequency Total
1 2 1 2
________________________________________________________________________ 4. What type of teaching license did you or do you currently hold? Provisional 1 6 7 2.5% 15% 17.5% Collegiate Professional 5 13 18 12.5% 32.5% 45% Postgraduate Professional 3 9 12 7.5% 22.5% 30% Technical Professional 2 2 5% 5% Conditional 1 1 2.5% 2.5% Total 9 31 40 22.5% 77.5% 100% 5. What area(s) are you endorsed to teach in? Reading/Language Arts 3 3 7.5% 7.5% Mathematics 5 5 12.5% 12.5% Science 3 3 7.5% 7.5% History/Social Science 1 3 4 2.5% 7.5% 10%
Fine Arts 1 1 2 2.5% 2.5% 5% Special Education 3 10 13 7.5% 25% 32.5%
Other 4 6 10 10% 15% 25% Total 9 31 40 22.5% 77.5% 100%
6. What subject(s) did you teach? Reading/Language Arts 3 3 7.5% 7.5% Mathematics 5 5 12.5% 12.5% Science 3 3 7.5% 7.5%
History/Social Science 1 3 4 2.5% 7.5% 10% Fine Arts 1 1 2 2.5% 2.5% 5% Special Education 3 10 13 7.5% 25% 32.5%
Other 4 6 10 10% 15% 25% Total 9 31 40 22.5% 77.5% 100%

50
Table 7 cont’d ________________________________________________________________________
Codes – District 1 = Surry County, District 2 = Franklin City
Question District Total Frequency Total
1 2 1 2 ________________________________________________________________________
9. What is your race? American Indian or Alaskan Native Asian or Pacific Islander 1 1 2.5% 2.5% Hispanic Black, not of Hispanic origin 5 8 13 12.5% 20% 32.5% White, not of Hispanic origin 4 22 26 10% 55% 65% Other (please specify) Total 9 31 40 22.5 77.5% 100% ________________________________________________________________________
standard licenses. Questions 5 and 6 data revealed that the discipline of special education
had the highest numbers of teachers who left both school districts. Question 9 data revealed
that the largest percentage of teachers who left the districts were White.
Electronic Data Results
As stated previously, the researcher received information sent electronically from the
Franklin City and Surry County school districts. The information received from each district
included name of school district, total number of teachers in each school district, specific
subjects taught or building/grade level, years of teaching experience, license type, race/
ethnicity, gender, number of teachers who remained and number of teachers who resigned,
retired, were non-renewed or passed away. Appendix Q shows the data that were submitted
by both school districts. The data in Appendix Q represent the total teaching population for
both school districts.

51
Table 8 illustrates the cross tabulation of teachers who left Surry County and Franklin
City by race/ethnicity, gender, subject-area, years of experience, and licensure. These data
reflect the entire sample (54) of teachers combined from both districts who did not return to
the districts after the 2007-2008 school year. This was part of the raw data submitted
electronically by both school districts. These data in Table 8 revealed the largest numbers of
teachers who left Surry County and Franklin City combined were as follows: Subject-area
(13 at special education = 24%), Licensure (39 at standard = 72%), Years of Experience (29
at 0-5 years = 54%), Race/ Ethnicity (36 at White = 67%), and Gender (37 at female = 69%).
These data in parentheses depict the percentage of teachers who left in each category as
measured against the total sample (54) of those who left. The data received electronically
reflect differences from the survey response data regarding licensure, subject-area and
race/ethnicity. The survey data reflect 77% (40 of 52) of the total sample of teachers who
left, but the electronic data represent 100% (54 of 54) of the sample of teachers who left.
Table 9 illustrates the cross tabulation of teachers who left the Franklin City and
Surry County school districts after the 2007-2008 school year due to resignation, non-
renewal, retirement or death. This was part of the raw data (Appendix Q recoded) submitted
electronically by both school districts. Surry County had 13 teachers who resigned, two
teachers who retired, three teachers who were non-renewed and two teachers who passed
away. Franklin City had 27 teachers who resigned, three teachers who retired and four
teachers who were non-renewed. These data show that the majority of the 54 teachers
combined from both school districts who left after the 2007-2008 school year resigned (40 =
74%) followed by non-renewal (7 = 13%), retirement (5 = 9%) and death (2 = 4%).
Table 10 illustrates the cross tabulation of the total teaching population in Surry
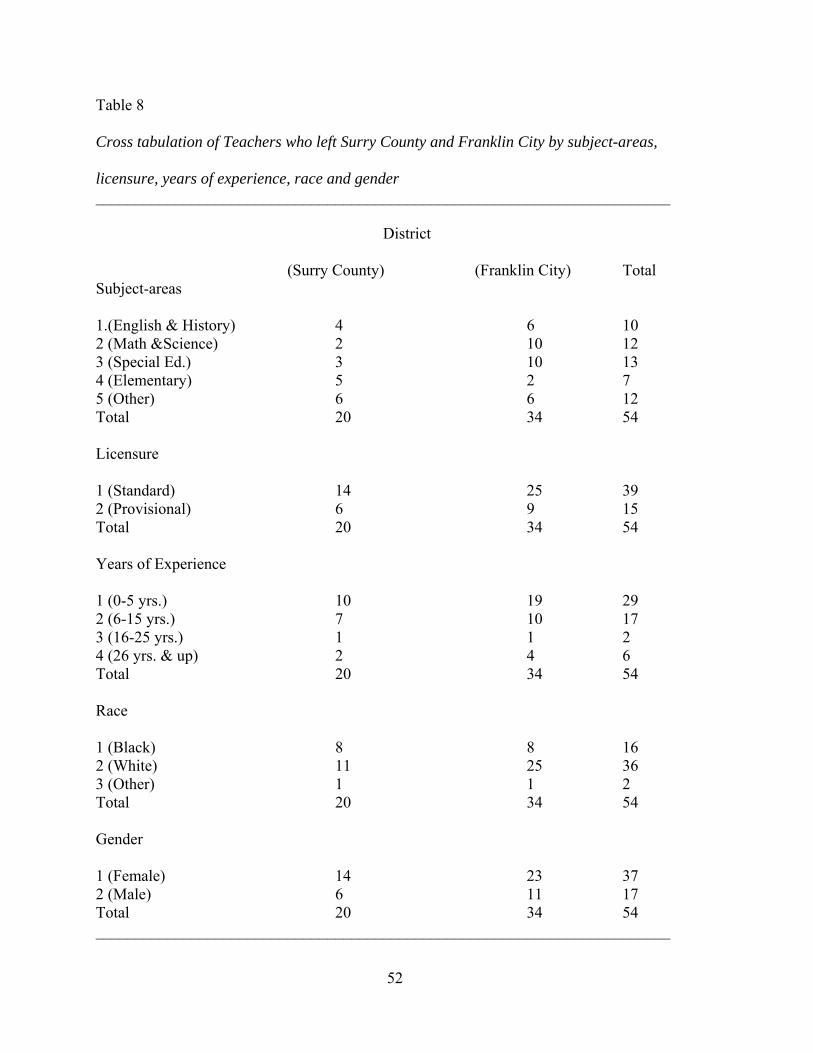
52
Table 8
Cross tabulation of Teachers who left Surry County and Franklin City by subject-areas, licensure, years of experience, race and gender ________________________________________________________________________
District
(Surry County) (Franklin City) Total
Subject-areas 1.(English & History) 4 6 10 2 (Math &Science) 2 10 12 3 (Special Ed.) 3 10 13 4 (Elementary) 5 2 7 5 (Other) 6 6 12 Total 20 34 54 Licensure 1 (Standard) 14 25 39 2 (Provisional) 6 9 15 Total 20 34 54 Years of Experience 1 (0-5 yrs.) 10 19 29 2 (6-15 yrs.) 7 10 17 3 (16-25 yrs.) 1 1 2 4 (26 yrs. & up) 2 4 6 Total 20 34 54 Race 1 (Black) 8 8 16 2 (White) 11 25 36 3 (Other) 1 1 2 Total 20 34 54 Gender 1 (Female) 14 23 37 2 (Male) 6 11 17 Total 20 34 54 ________________________________________________________________________

53
Table 9
Cross tabulation of Teachers who left Surry County and Franklin City by resignation, retirement, non-renewal or death ________________________________________________________________________
District
(Surry County) (Franklin City) Total 1.(Resigned) 13 27 40 2 (Retired) 2 3 5 3 (Non-renewed) 3 4 7 4 (Death) 2 0 2 Total 20 34 54 ________________________________________________________________________ County and Franklin City by race/ethnicity, gender, subject-areas, years of experience,
licensure and retention. These data reflect the total (240) population of teachers combined
from both districts. These data in Table 9 revealed that the largest number of teachers by
percentage in each category subset were as follows: Subject –area (77 at elementary = 32%),
Licensure (214 at standard = 89%), Years of Experience (84 at 0-5 years = 35%),
Race/Ethnicity (128 at White = 53%), Gender (199 at female = 82%) and Retained (186 at
yes = 77.5%).
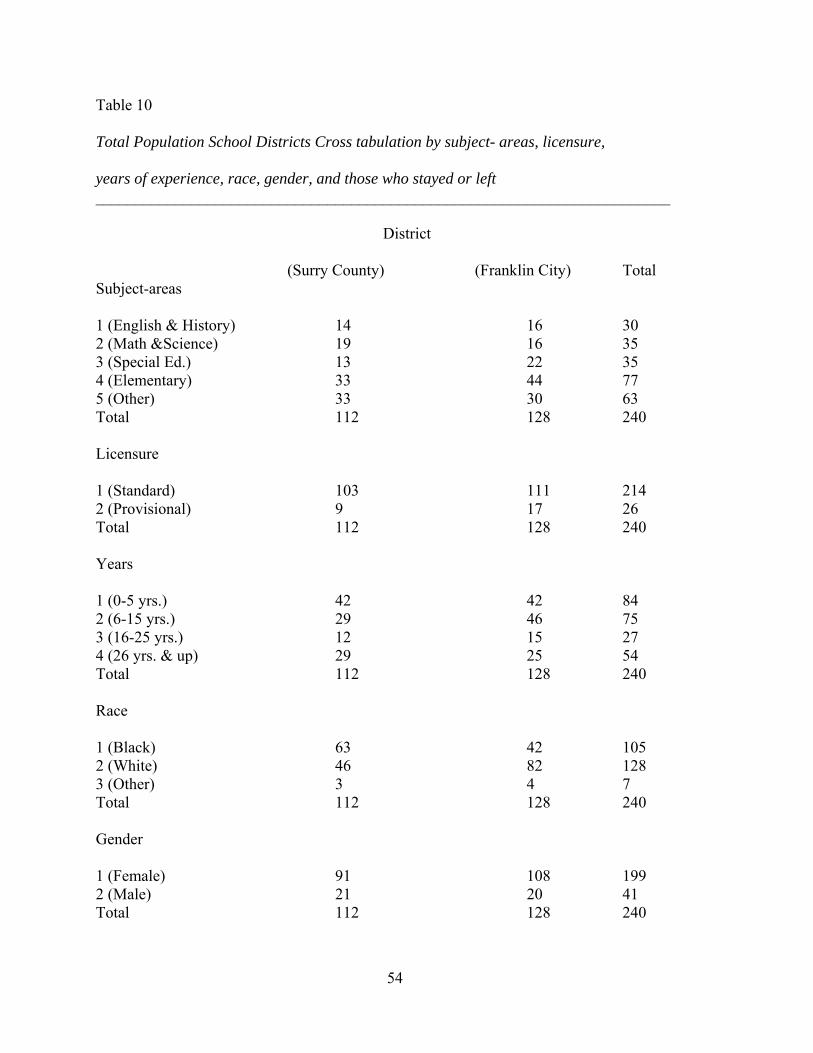
54
Table 10
Total Population School Districts Cross tabulation by subject- areas, licensure, years of experience, race, gender, and those who stayed or left ________________________________________________________________________
District
(Surry County) (Franklin City) Total
Subject-areas 1 (English & History) 14 16 30 2 (Math &Science) 19 16 35 3 (Special Ed.) 13 22 35 4 (Elementary) 33 44 77 5 (Other) 33 30 63 Total 112 128 240 Licensure 1 (Standard) 103 111 214 2 (Provisional) 9 17 26 Total 112 128 240 Years 1 (0-5 yrs.) 42 42 84 2 (6-15 yrs.) 29 46 75 3 (16-25 yrs.) 12 15 27 4 (26 yrs. & up) 29 25 54 Total 112 128 240 Race 1 (Black) 63 42 105 2 (White) 46 82 128 3 (Other) 3 4 7 Total 112 128 240 Gender 1 (Female) 91 108 199 2 (Male) 21 20 41 Total 112 128 240

55
Table 10 cont’d ________________________________________________________________________
District Total
(Surry County) (Franklin City) Yes (stayers) 92 94 186 No (leavers) 20 34 54 Total 112 128 240 Note: Other under subject-areas include Career & Technical Education, Foreign Languages, Health & PE, Instrumental Music, Choral Music, Media Specialists, JROTC, Guidance Counselors, Art, Alternative Education, and Instructional Technology Resource teachers. ________________________________________________________________________
Chapter Four Summary
Data were collected and analyzed on the factors that impact teacher attrition in
Surry County Public Schools and Franklin City Public Schools. These data were collected
through survey responses of teachers who left both school districts after the 2007-2008
school year and total teaching population information sent electronically from both school
districts. Surveys were mailed to 52 teachers who left both school districts after the 2007-
2008 school year to identify the reasons why they left, to identify the challenges that both
school districts face when trying to retain teachers as seen by those who left both districts and
to identify the characteristics of those who entered the teaching profession and then left. The
surveys yielded a return response rate of 77% (40 of 52). The total sample of teachers who
left was 54, but only 52 surveys were mailed due to the death of two teachers during the
2007-2008 school year. These data collected electronically did account for all 54 teachers in
the total sample.

56
Results from the study revealed that a variety of reasons for leaving were given by the
teachers who left both school districts, but a major reason given for leaving was student
discipline. The biggest challenge that both school districts face when trying to retain
teachers as perceived by teachers who left was geographical location. Of the 54 teachers
who left both school districts, the majority were White and female. The majority of teachers
who left both school districts combined had five years or less of total teaching experience.
The majority of the teachers who left indicated they entered the teaching profession with the
desire to impact the lives of children. Further discussion regarding the findings in this
chapter occurs in chapter five.
57
CHAPTER FIVE
FINDINGS, IMPLICATIONS FOR PRACTICE, LIMITATIONS/DELIMITATIONS,
RECOMMENDATIONS FOR FUTURE RESEARCH AND PERSONAL REFLECTIONS
Introduction
Teacher attrition is a problem that many school districts across this nation are faced
with on a yearly basis. Many school districts are having major difficulty retaining the very
best educators. The purpose of this study was to identify the factors that impact teacher
attrition in two small school districts in Southeastern Virginia. This study through survey
responses gathered data from teachers who left both districts after the 2007-2008 school year
on the factors that impacted their decisions to leave and the challenges they perceived both
school districts face that impact teacher attrition. Other data from the survey responses
identified characteristics of the teachers who left both school districts after the 2007-2008
school year. Additionally, 2007-2008 demographic data on the total teacher population in
both school districts were collected from the Human Resources departments of both school
districts. This chapter is divided into five sections. These five sections include a discussion
of findings, implications for practice, limitations/delimitations, recommendations for future
research and personal reflections.
These data collected for this study were used to answer the research questions. The
research questions were as follows:
1. What factors impacted teachers’ decisions to leave two small school districts in
Southeastern Virginia?
2. What are the major challenges that impact teacher attrition in two small school
58
districts in Southeastern Virginia as perceived by teachers who left both school
districts?
3. What are the characteristics of those who entered the teaching profession and then
left two small school districts in Southeastern Virginia?
4. What impact does race/ethnicity, subject-area, years of experience and licensure have
on teacher attrition in two small school districts in Southeastern Virginia?
Findings (Survey Data)
This study found that the majority of teachers in the two small school districts were
satisfied with working in the schools or districts. Data from this study revealed that 75% of
teachers who left combined from both school districts indicated that they were either
somewhat satisfied or very satisfied with their schools or districts. A breakdown by district
showed that five (56%) of nine teachers in Surry County were somewhat satisfied or very
satisfied with their school or district. Twenty-five (81%) of 31 teachers in Franklin indicated
they were somewhat satisfied or very satisfied with their school or district. These data found
in this study are similar to the data found in the MetLife (2006) study that also found that
more than half (56%) of teachers were satisfied with their careers.
This study found that teachers who left Franklin City indicated student discipline and
administrative support were major challenges. In contrast, the survey responses from
teachers in Surry County did not indicate student discipline and administrative support being
major challenges. The Schwartzbeck et al. (2003) and Hammer et al. (2005) studies also did
not indicate student discipline and administrative support as being major challenges.
This study found that the majority of teachers in the two small school districts
indicated student discipline was their biggest frustration. Data from this study revealed that

59
40% of teachers combined from both districts indicated student discipline was their biggest
frustration. A breakdown by district showed that three (33%) of nine teachers in Surry
County indicated student discipline was their biggest frustration. It is interesting to note that
survey responses from teachers in Surry County did not indicate student discipline as being a
major challenge, but did indicate student discipline as being their biggest frustration.
Thirteen (42%) of 31 teachers in Franklin indicated student discipline was their biggest
frustration. These data show that a larger percentage of teachers in Franklin City viewed
student discipline as being a bigger problem than teachers in Surry County. These data found
in this study are similar to the data found in the MetLife (2006) study that also cited a reason
for leaving by teachers was student discipline.
This study found that the majority of teachers who left the two small school districts
indicated geographical isolation was the biggest challenge that impacted teacher attrition.
Data from this study revealed that geographical isolation (40%) was the number one survey
response of teachers who left both school districts. A breakdown by district showed that five
(56%) of nine teachers in Surry County indicated geographical isolation was the biggest
challenge impacting teacher attrition. Eleven (35%) of 31 teachers in Franklin City indicated
geographical isolation was the biggest challenge impacting teacher attrition. These data in
this study are also similar to the data found in the Schwartzbeck et al. (2003) and Hammer et
al. (2005) studies that also indicated that a great challenge for rural school districts was
geographical isolation.
This study found that salary was a challenge reported by teachers who left the two
small school districts that impacts teacher attrition. Data from this study revealed that 20%
of teachers who left both school districts indicated salary was a challenge. A breakdown by

60
district showed that two (22%) of nine teachers in Surry County indicated salary was a
challenge. Six (19%) of 31 teachers in Franklin City indicated salary was a challenge. These
data found in this study are also similar to the data found in the Schwartzbeck et al. (2003)
and Hammer et al. (2005) studies which indicated that salary was a big challenge for rural
school districts that impacts teacher attrition.
This study found that the majority of teachers who left the two small school districts
entered the teaching profession to impact the lives of children. Data from this study revealed
that impacting the lives of children (70%) was the number one survey response from teachers
who left the Franklin City and Surry County Schools’ districts. A breakdown by district
showed that eight (89%) of nine teachers in Surry County chose impacting the lives of
children as the reason they entered teaching. Twenty (65%) of 31 teachers in Franklin City
chose impacting the lives of children as the reason they entered teaching. These data found
in this study are similar to the data found in the King (1993) study that revealed through
survey responses (73%) that contributing to the betterment of society by impacting the lives
of young people was a major reason for entering the teaching profession.
This study found that teachers who left the two small school districts indicated
that teaching allows time for family as being another reason for entering the teaching
profession. Data from this study revealed that the job allows time for family (20%) was the
second highest survey response from teachers who left the Franklin City and Surry County
Schools’ districts. A breakdown by district showed that one (11%) of nine teachers in Surry
County chose teaching because it allows time for family as the reason he/she entered
teaching. Seven (23%) of 31 teachers in Franklin City chose teaching because it allows time
for family as the reason they entered teaching. These data found in this study are similar to
61
the data found in the Farkas et al. (2000) study which also revealed through survey responses
(81%) that teaching allows time for family was a major reason for entering the teaching
profession. Teaching allows time for family was also the second highest survey response in
the Farkas et al. (2000) study.
This study found that the majority of teachers who left the two small school districts
had not done student teaching. Data from this study revealed that 52.5% of survey
respondents did not have student teaching experience. A breakdown by district showed that
five (56%) of nine teachers in Surry County did not have student teaching experience.
Sixteen (52%) of 31 teachers in Franklin City did not have student teaching experience.
Many public school teachers have gone through traditional teacher preparation programs to
become teachers. The state of Virginia has several methods in which one may obtain a
teaching license without having to go through student teaching. These include one year of
successful classroom teaching experience in lieu of student teaching, experiential learning,
career switcher programs and alternative licensure options (Virginia Department of
Education, 2007).
This study found that the majority of teachers who left the two small school districts
had one or more teachers in their families. Data from this study revealed that 57.5% of
survey respondents had one or more teachers in their families. A breakdown by district
showed that five (56%) of nine teachers in Surry County had one or more teachers in their
families. Eighteen (58%) of 31 teachers in Franklin City had one or more teachers in their
families. These data from this study revealed that having teachers in one’s family does not
necessarily have an impact on reducing teacher attrition.
This study found other reasons cited by teachers who left both school districts

62
included lack of teacher input, lack of an appropriate curriculum, lack of equipment and lack
of parental and administrative support. These data are similar to the data found in the
Johnson and Birkeland (2003) and MetLife (2006) studies. The Johnson and Birkeland
(2003) study indicated that factors cited by teachers who either moved from one school
district to another or left the profession entirely included poor working conditions and
inadequate support. The MetLife (2006) study indicated reasons for leaving cited by teachers
included professional prestige, lack of resources, being ill-prepared to work with children of
varying abilities, lack of teacher input in decision making and lack of parental and
administrative support.
This study found that special education teachers had the highest rate of attrition when
comparing by disciplines of those who left after the 2007-2008 school year. Specifically, 13
of 40 survey respondents who left both school districts taught special education. These data
are similar to the data found in the Schwartzbeck et al. (2003) and Hammer et al. (2005)
studies which both indicated the academic discipline that posed the greatest staffing
challenge for rural areas is special education.
Findings (Electronic Data)
This study found that White teachers left both school districts at a rate
disproportionate to the percentage of Whites in the overall population of teachers. Whites
accounted for 53% (128 of 240) of the overall teaching population, but left at a 69% (37 of
54) rate. This also held true when broken down by individual school district. These data
revealed that White teachers had a higher rate of attrition in both school districts than any
other race/ethnicity. The numbers of Whites who left both school districts included all
reasons for leaving such as those who retired, were non-renewed or may have gone to other

63
school districts. In contrast, the NCES (2007) study found that Blacks (11.0%) left the
teaching profession more frequently than Whites (8.2%) or any other race/ ethnicity.
This study found that the majority of the total teacher population in Surry County was
Black. Data from this study revealed that 56% (63 of 112) of the total teaching population in
Surry County was Black. This means that Surry County had more Black (56%) teachers than
teachers from any other race/ethnicity. These data are in sharp contrast to the total teacher
population data for Franklin City as well as specific studies discussed in the review of
literature on the overall racial makeup of the American teaching labor force. The total
teaching population data for Franklin City revealed that 64% (82 of 128) teachers in the
district were White. The Rong and Preissle (1997) study and the NCES (2007) study found
that minorities were underrepresented in the American teaching labor force. Education
Commission of the States’ (2005) study indicated the nation’s teaching workforce was
predominantly White (86%).
This study found that male teachers left both school districts at a rate disproportionate
to the percentage of males in the overall population of teachers. Males accounted for 17%
(41 of 240) of the overall teaching population, but left at a 31% (17 of 54) rate. This also
held true when broken down by individual school district. These data revealed that male
teachers had a higher rate of attrition in both school districts than any other race/ethnicity.
These data found in this study are similar to the data found in the NCES (2007) study that
also found males as compared to females had the highest rate of teacher attrition when
comparing to the overall teaching population by gender. Specifically, 126,000 (16%) of
787,700 male teachers in the NCES (2007) study either moved to other school females who
either moved to other school districts or left the teaching profession .

64
This study found that the majority of teachers combined in the two small school
districts were female. These data from this study revealed that the school districts combined
percentage of female teachers in Franklin City and Surry County was 83% (199 of 240).
These data in this study are also similar to that of the NCES (2007) study that found females
accounted for 76% (2,431,200 of 3,214,900) of the American teacher labor force. The
Broughman and Rollefson (2000), Flyer and Rosen, (1997) and Henke et al. (2000) studies
found that the majority of individuals in the teaching profession were female. This means
that male teachers were vastly underrepresented in the total teaching population in this study
as well as in the studies from the review of literature.
This study found that Franklin City and Surry County had a combined teacher
attrition rate of 22.5% for the 2007-2008 school year. Data from this study regarding teacher
retention in the two small school districts are illustrated in Table 10. A breakdown by district
showed that Surry County had a teacher attrition rate of 18% (20 of 112 left) after the 2007-
2008 school year. Franklin City had a teacher attrition rate of 27% (34 of 128 left) after the
2007-2008 school year. These data found in this study revealed that Surry County and
Franklin City had higher teacher attrition rates (meaning lower retention rates) than the
Virginia state (16%) teacher attrition rate as reported by Alliance for Excellent Education
(2005) and the national (16.5%) teacher attrition rate as shown in the NCES (2007) study.
This study found that provisionally licensed teachers left both school districts at a rate
disproportionate to the percentage of provisionally licensed teachers in the overall
population. Provisionally licensed teachers accounted for 9% (21 of 240) of the overall
teaching population, but left at a 17% (9 of 54) rate. This also held true when broken down
by individual school district. These data revealed that provisionally licensed teachers had a

65
higher rate of attrition in both school districts than teachers who held standard licenses.
These data found in this study are similar to the data found in the NCES (2007) study which
also revealed that a higher percentage (23%) of teachers in the American teacher labor force
that either moved from one school district to another or left the teaching profession altogether
held provisional licenses (47,200 of 206,700) as opposed to teachers (15 %) who held
standard licenses (434,900 of 2,814,900).
This study found that the majority (54%) of teachers (29 of 54) who left the two small
school districts after the 2007-2008 school year combined had five years or less of total
teaching experience. The total population of teachers combined from both school districts
also revealed that the largest percentage of teachers (35%) in teaching span was those who
had five years or less of total teaching experience. Data from this study regarding years of
experience of those who left the two small school districts are illustrated in Table 11. A
breakdown by district showed that Surry County had 50% (10 of 20) of teachers who left had
five years or less of total teaching experience. Franklin City had 56% (19 of 34) of teachers
who left had five years or less of total teaching experience. These data found in this study
are similar to the data found in the studies (Kirby & Grissmer, 1993; Mark & Anderson,
1977; Rabinowitz & Crawford, 1960; Schlecty & Vance, 1981 & Hanushek et al., 2001) that
also showed that the highest rate of teacher attrition occurred in those teachers who had five
years or less of total teaching experience.
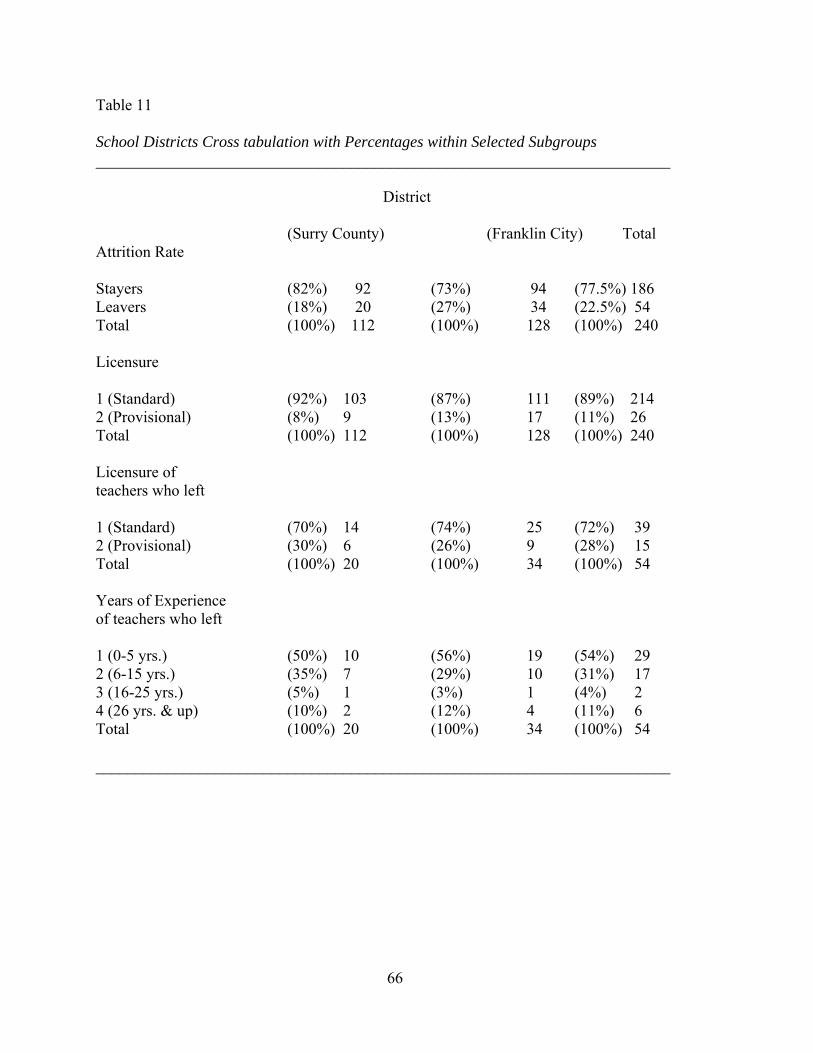
66
Table 11
School Districts Cross tabulation with Percentages within Selected Subgroups ________________________________________________________________________
District
(Surry County) (Franklin City) Total
Attrition Rate Stayers (82%) 92 (73%) 94 (77.5%) 186 Leavers (18%) 20 (27%) 34 (22.5%) 54 Total (100%) 112 (100%) 128 (100%) 240 Licensure 1 (Standard) (92%) 103 (87%) 111 (89%) 214 2 (Provisional) (8%) 9 (13%) 17 (11%) 26 Total (100%) 112 (100%) 128 (100%) 240 Licensure of teachers who left 1 (Standard) (70%) 14 (74%) 25 (72%) 39 2 (Provisional) (30%) 6 (26%) 9 (28%) 15 Total (100%) 20 (100%) 34 (100%) 54 Years of Experience of teachers who left 1 (0-5 yrs.) (50%) 10 (56%) 19 (54%) 29 2 (6-15 yrs.) (35%) 7 (29%) 10 (31%) 17 3 (16-25 yrs.) (5%) 1 (3%) 1 (4%) 2 4 (26 yrs. & up) (10%) 2 (12%) 4 (11%) 6 Total (100%) 20 (100%) 34 (100%) 54 ________________________________________________________________________

67
Implications for Practice
The following depicts implications for practice as a result of this study.
1. School districts should annually communicate (surveys, exit interviews, etc.) with all
teachers (including leavers and stayers) to gauge their levels of satisfaction with their schools
or districts. The studies in the review of literature (Giacometti, 2005; Johnson & Birkeland,
2003; & McKinney et al., 2007) revealed through analysis of survey responses the reasons
why teachers stayed, moved or left their respective schools or districts. The survey responses
from this study revealed reasons why teachers left both school districts. School districts must
continuously analyze what their teachers are saying and establish open lines of
communication for teachers regarding the positives as well as the negatives. School districts
will be better equipped to address the problem of teacher attrition and develop viable
educational practices that improve their teacher retention efforts if they know why their
teachers choose to enter the profession of teaching in addition to knowing why they stay or
leave.
2. School districts should continuously conduct staff development that includes mentoring,
classroom management, student discipline, and administrative (principals and assistant
principals) support, especially for those teachers who have five years or less of total teaching
experience. The results from this study and studies discussed in the review of literature
(MetLife, 2006; Ingersoll & Smith, 2003; Kirby & Grissmer, 1993; Mark & Anderson, 1977;
Rabinowitz & Crawford, 1960; Schlecty & Vance, 1981; & Hanushek et al., 2001) found that
the highest rate of teacher attrition occurred in those teachers who had five years or less of
total teaching experience, and that student discipline and lack of administrative support were
factors cited by teachers that impacted their decisions to leave their respective school

68
districts.
3. Small and rural school districts should continuously emphasize to their local Boards of
Supervisors or City Councils the importance of offering competitive salaries that match or
exceed the salaries of their larger urban and suburban counterparts. The results from this
study and studies discussed in the review of literature (Schwartzbeck et al., 2003; & Hammer
et al., 2005) found that geographical location and low salaries were major challenges that
impacted teacher attrition in small and rural school districts.
4. School districts should continuously place emphasis on bringing to the districts those
teachers who have gone through teacher preparation programs in their undergraduate or
graduate courses of study whenever possible. Although the state has various routes to
licensure, this study found that higher teacher attrition rates existed among teachers who do
not go through a traditional teacher preparation program. This could be an underlying factor
that increases teacher attrition.
5. School districts that serve high minority student populations should place greater emphasis
on improving or developing strategies that improve their retention rates regarding White
teachers. This study found that White teachers left both school districts at a disproportionate
rate when comparing by race/ethnicity to the overall teaching population. This is in contrast
to the NCES (2007) study that found Blacks (11.0%) left the teaching profession more
frequently than Whites (8.2%) or any other race/ ethnicity.
6. School districts should constantly share best practices that have shown to have an impact
on reducing attrition of minority teachers. This study found that Surry County had more
minority teachers in their school district than any other race/ethnicity. In contrast, Franklin
City and studies in the review of literature (Rong & Preissle, 1997; & Education Commission

69
of the States, 2005) found that Whites accounted for the largest percentage of teachers. This
information shows that Surry County may have strategies that if shared could possibly help
other school districts reduce their attrition rate of minority teachers.
7. School districts should place greater emphasis on improving or developing strategies that
improve their retention rates regarding male teachers. The results from this study and the
NCES (2007) study found that male teachers either moved from their school districts to other
school districts or left the profession of teaching altogether more frequently than female
teachers.
8. School districts should continuously place emphasis on bringing those teachers to the
districts that have standard licenses whenever possible. This study and the NCES (2007)
study found that higher teacher attrition rates existed among teachers who held provisional
licenses as opposed to those who held standard licenses.
Limitations/Delimitations
Limitations to this type of methodology included a lack of flexibility by analyzing
numbers, which gave a sense of rigidness. In addition, limitations to this study included
having a small sample size and analyzing data from only two school districts. Limitations to
this study also included having only a 50% return rate of teacher surveys from those who left
the Surry County Public Schools district after the 2007-2008 school year.
Recommendations for Future Research
The following depicts recommendations for future research.
1. A similar study could be conducted that is expanded to include all small and rural school
districts in Virginia to determine if other small and rural districts have similar challenges to
the challenges that were found in this study regarding teacher attrition.
70
2. A study could be conducted that measures the impact teacher attrition has on schools or
school districts abilities in meeting Adequate Yearly Progress (AYP) benchmarks as defined
by “No Child Left Behind”.
3. A study could be conducted that measures the impact the United States economy and state
budget shortfalls have on teacher attrition. Both Surry County and Franklin City saw a
decrease in teachers who left the school districts after the 2008-2009 school year as
compared to the 2007-2008 school year. Specifically, Surry County had 20 (18%) teachers
who left after the 2007-2008 school year, but only 14 (12.5%) left after the 2008-2009 school
year (P. Barnes, personal communication, August 11, 2009). Franklin City had 34 (27%)
teachers who left after the 2007-2008 school year, but only 22 (17%) left after the 2008-2009
school year.
4. Ongoing research could be conducted to determine if percentages of teachers leaving
school districts increase due to the race/ethnicity of the students in the school districts. C.
Kirabo Jackson (2009) conducted a study that studied patterns of teacher movement in the
Charlotte-Mecklenburg (North Carolina) school system between 2002 and 2003 when the
school district ended its policy on busing that promoted racial integration. The results of the
study revealed that the schools that had an increase in Black student enrollment saw a
decrease in highly qualified teachers, which was measured by years of experience and
licensure. In comparison, this study found that the majority of teachers who left Surry
County and Franklin City after the 2007-2008 school year had five years or less of total
teaching experience. Surry County and Franklin City also had predominantly African-
American student populations.

71
5. A study could be conducted to determine if minority teachers feel more comfortable
working in school districts that serve predominantly minority student populations as opposed
to school districts that serve predominantly non-minority student populations.
6. A follow-up study could be conducted on these two school divisions (Surry County and
Franklin City) that illustrates annually the number of teachers who leave both school districts
and go to other school districts or leave the teaching profession altogether.
Personal Reflections
I wanted to conduct this study on teacher attrition due to the fact that I currently
serve in the capacity of assistant superintendent for human resources and administrative
services in Franklin City Public Schools. I have seen a high attrition rate of teachers in the
District over the past few years. Through empirical research, I wanted to determine if those
factors identified in the review of literature that was said to impact teacher attrition had
impact on teacher attrition in Franklin City and Surry County. In addition, I wanted to see
if school districts with similar characteristics experienced similar challenges regarding
teacher attrition.
After conducting this study, I was surprised to find that Surry County had a larger
percentage of Black teachers than White teachers in the school district. This finding was in
contrast to the percentage of Black teachers in Franklin City and the national research on
percentages of teachers by race/ethnicity. I was also surprised to find that Franklin City had
a significantly higher teacher attrition rate than Surry County. Overall, this experience has
been rewarding and challenging, and has made me have an even greater appreciation for
scholarly research. I really felt ownership of this study when I got to chapter four, where I
was actually able to conduct this study and examine the results. In conclusion, I hope this

72
study can be used to guide educational practice and facilitate future research on teacher
attrition.

73
References
Alliance for Excellent Education. (2005). Teacher Attrition: A Costly Loss to the Nation and to the States. Issue Brief, Retrieved May 25, 2008 from http://www.all4ed.org/files/archive/publications/TeacherAttrition.pdf American Association of School Administrators. (1999). AASA online advocacy.
Retrieved October 8, 2007 from
http://www.ericdigests.org/2000-4/rural.htm
American Association for Employment in Education. (2003). Executive Summary: Educator
Supply & Demand Research. Retrieved October 12, 2007 from
http://aaeeohassoc.weblinkconnect.com/cwt/external/wcpages/resource
American Association for Employment in Education. (2008). Educator Supply
and Demand in the United States. Executive Summary. Columbus, OH: Author pp.1-
7.
Ballou, D. (1996). Do public schools hire the best applicants? Quarterly Journal
of Economics, 111(1), 97-133.
Broughman, S., & Rollefson, M. (2000). Teacher supply in the United States:
Sources of newly hired teachers in public and private schools: 1987-88 to 1993-94.
Education Statistics Quarterly, 2(3), 28-32.
Carr, L. T. (1994). The strengths and weaknesses of quantitative and qualitative research:
What method for nursing? Journal of Advanced Nursing, 20(4), 716-721
Clotfelter, C. T., Glennie, E., Ladd, H. F., & Vigdor, J. L. (2006). Would higher
salaries keep teachers in high-poverty schools? Evidence from a policy
intervention in North Carolina. (NBER Working Paper No. 12285).

74
Cambridge, MA: National Bureau of Economic Research.
Clotfelter, C. T., Glennie, E., Ladd, H. F., & Vigdor, J. L. (2008). “Teacher Bonuses
and Teacher Retention in Low Performing Schools: Evidence from the
North Carolina $1800 Teacher Bonus Program”. Public Finance Review,36
(1), 63-87.
Committee to Enhance the K-12 Teaching Profession in Virginia. (2002).
Stepping Up to the Plate…Virginia’s Commitment to A Highly Qualified
Teacher in Every Classroom. Retrieved October 30, 2007 from
http://www.schev.edu/Reportstats/SteppingUpToThePlate101602.pdf?from=
Darling-Hammond, L. (1984). Beyond the commission reports: The coming crisis
in teaching. Santa Monica, CA: Rand Corporation.
Darling-Hammond, L. (1999). Teacher quality and student achievement. A review
of state policy evidence. Education Policy Analysis Archives 8. Retrieved July
5, 2008 from http://epaa.asu.edu/epaa/v8n1/
Education Commission of the States. (2005). Eight Questions on Teacher
Recruitment and Retention: What Does the Research Say? Denver, CO.
Farkas, S., Johnson, J., & Foleno, T. (2000). A sense of calling: Who teaches and why. New York: Public Agenda Flyer, F., & Rosen, S. (1997). The new economics of teachers and education. Journal of Labor Economics, 15(1), S104-139 Giacometti, K. (2005). Factors Affecting Job Satisfaction and Retention of Beginning Teachers. doctoral dissertation, Virginia Tech, Blacksburg, VA. Gitomer, D., Latham, A., & Ziomek, R. (1999). The academic quality of

75
prospective teachers: The impact of admissions and licensure testing. Princeton, NJ: Educational Testing Service. Guarino, C., Santibañez, L., & Daley, G. (2006). Teacher Recruitment and Retention: A Review of the Recent Empirical Literature. Review of Educational Research, Vol. 76. No.2, pp.173-208. Haggstrom, G., Darling-Hammond, L., & Grissmer, D. (1988). Assessing teacher supply and demand (R-3633-ED/C578). Santa Monica, CA: RAND. Hammer, P., Hughes, G., McClure, C., Reeves, C., & Salgado, D. (2005). Rural Teacher Recruitment and Retention Practices: A Review of the Research Literature, National Survey of Rural Superintendents, and Case Studies of Programs in Virginia. Appalachia Educational Laboratory at Edvantia. (ERIC Document Reproduction Service No. ED 489143) Hanushek, E. A., Kain, J. F., & Rivkin, S. G. (2001). Why public schools lose teachers. (NBER Working Paper 8599). Cambridge, MA: National Bureau of Economic Research. Henke, R., Zahn, L., & Carroll, C. (2001). Attrition of new teachers among recent
college graduates: Comparing occupational stability among 1992-1993 college graduates who taught and those who worked in other occupations. Washington, DC: National Center for Education Statistics.
Ingersoll, R. (2003). Is There Really a Teacher Shortage? A Research Report co- Sponsored by the Center for the Study of Teaching and Policy and the Consortium for Policy Research in Education. Retrieved April 1, 2008 from http://depts.washington.edu/ctpmail/PDFs/Shortage-RI-09-2003.pdf

76
Ingersoll, R., & Smith, T. (2003). What are the effects of induction and mentoring programs for new teachers? Retrieved November 3, 2007 from http://www.ecs.org/clearinghouse/50/36/5036.htm Jackson, C. K. (2009). Do Good Teachers Leave When Black Students Enroll? Journal of Labor Economics, 27(2) pp. 213-256 Johnson, S., & Birkeland, S. (2003). Pursuing a “sense of success”: New teachers
explain their career decisions. American Educational Research Journal, 40(3), 581-617. King, S. (1993). Why did we choose teaching careers and what will enable us to stay? Insights from one cohort of the African-American teaching pool. Journal of Negro Education, 62(4), 475-492. Kirby, S., Berends, M., & Naftel, S. (1999). Supply and demand of minority teachers In Texas: Problems and prospects. Educational Evaluation and Policy Analysis, 21(1), 47-66. Kirby, S., & Grissmer, D. (1993). Teacher attrition: Theory, evidence, and suggested policy options. Santa Monica, CA-Rand Corporation, Center for the study of the Teacher Profession. Lankford, M., Loeb, S., & Wyckoff, J. (2002). Teacher sorting and the plight of urban schools: A descriptive analysis. Educational Evaluation and Policy Analysis, 24(1), 37-62. Mark, J., & Anderson, N. (1977). Teacher survival rates: A current look. The American Educational Research Journal, 15, 379-383. McKinney, S. E., Berry, R. Q., Dickerson, D. L., & Campbell-Whately, G. (2007).

77
Addressing urban high-poverty school attrition by addressing urban high- poverty school teacher retention: why effective teachers persevere.
Educational Research and Review Vol.3 (1), pp.001-009, January 2007 Retrieved July 8, 2008 from http://www.academicjournals.org/ERR/PDF/pdf%202008/Jan/McKinney%20et%20al.pdf MetLife. (2006). The MetLife Survey of the American Teacher, 2006: Expectations and Experiences. Retrieved December 12, 2008 from www.metlife.com/teachersurvey MetLife. (2008). Study of Employee Benefits Trends. Retrieved December 12, 2008 from http://www.whymetlife.com/trends/study.asp Murphy, P., & Angelski, K. (1996/1997). Rural teacher mobility: A report from British Columbia. Rural Educator, 18. National Academy of Sciences. (1987). Toward understanding teacher supply and demand. Washington, DC: National Academy Press. National Center for Education Statistics. (2005a). District Detail for Franklin City
Public Schools. Office of Educational Research & Improvement, United States Department of Education, Retrieved December 14, 2008 from
http://nces.ed.gov/ccd/districtsearch/district_detail.asp National Center for Education Statistics. (2005b). District Detail for Surry County Public Schools. Office of Educational Research & Improvement, United States Department of Education, Retrieved December 14, 2008 from http://nces.ed.gov/ccd/districtsearch/district_detail.asp National Center for Education Statistics. (2007). Teacher Attrition and Mobility: Results from the 2004-05 Teacher Follow-up Survey. United States

78
Department of Education. Retrieved February 26, 2009 from http://nces.ed.gov/pubs2007/2007307.pdf National Commission on Excellence in Education. (1983). A nation at risk: The imperative for education reform. Washington, DC: Government Printing Office. National Commission on Teaching and America’s Future. (1997). Doing what matters most: Investing in quality teaching. Retrieved September 30, 2007
from http://www.nctaf.org/ National Commission on Teaching and America’s Future. (2003). No dream denied: A Pledge To America’s children. (Summary Report). Retrieved September 30, 2007 from http://www.nctaf.org/documents/no-dream-denied_summary_report.pdf Neill, J. (2007). Qualitative versus Quantitative Research: Key Points in a Classic
Debate. Retrieved November 13, 2009 from http://wilderdom.com/research/QualitativeVersusQuantitativeResearch.html
Norton, M. S. (1999). Teacher retention: Reducing costly teacher turnover. Contemporary Education, 70 (3). Podgursky, M., Monroe, R., & Watson, D. (2004). The academic quality of public school teachers: An analysis of entry and exit behavior. Economics of Education Review, 23, 507-518. Rabinowitz, W., & Crawford, K. (1960). A study of teachers’ careers. The School Review, 68 (4), 377-99. Reed, D. F., & Busby, D. W. (1985). “Teacher Incentives in Rural Schools.” Research in Rural Education, 3(2), 69-73.

79
Reeves, C. (2003). Implementing the No Child Left Behind Act: Implications for Rural Schools and Districts. Retrieved November 5, 2007 from www.ncrel.org/policy/pubs/html/implicate/ Rong, X., & Preissle, J. (1997). The continuing decline in Asian-American teachers. American Educational Research Journal, 34(2), 267-293. Rural School and Community Trust. (2000). Why rural matters: The need for every state to take action on rural education. Washington, DC: Author. Sanders, W. L. & Rivers, J. C. (1996). Cumulative and residual effects of teachers on future student academic achievement. Knoxville, TN: University of Tennessee Value-Added Research and Assessment Center. Schlecty, P., & Vance, V. (1981). Do academically able teachers leave education, NC case. Phi Delta Kappan, 63, 106-112. Schwartzbeck, T., Prince, C., Redfield, D., Morris, H., & Hammer, P. (2003). How Are Rural Districts Meeting the Teacher Quality Requirements of No Child Left Behind? Retrieved November 6, 2007 from www.aasa.org/files/PDFs/Policy/Rural_Teacher_Quality_Study1.pdf Shipp, V. (1999). Factors influencing the career choices of African-American collegians: Implications for minority teacher recruitment. Journal of Negro Education, 68 (3), 343-351. Spradlin, T. E., & Prendergast, K. A. (2006). “Emerging Trends in Teacher Recruitment and Retention in the No Child Left Behind Era”. Retrieved September 17, 2008 from http://www.ceep.indiana.edu/projects/PDF/PB_V4N12_Winter_2006_Recruitment.pdf State Council for Higher Education in Virginia. (2009). High Need School Divisions
80
2008-2009 School Year. Retrieved September 4, 2009 from http://www.schev.edu/AdminFaculty/RFPs/NCLBforms/High%20needs%20schools%20revi
sed%202-13-09.doc Stinebrickner, T. (2002). An analysis of occupational change and departure from the labor force: Evidence of the reasons that teachers leave. Journal of Human Resources, 37(1), 192-216. Trochim, W. M. K. (2006). Statistical Power. Retrieved February 4, 2009 from http://www.socialresearchmethods.net/kb/concimp.php United States Department of Education. (2004). No Child Left Behind. A Toolkit for Teachers. Virginia Department of Education. (2007). Licensure Regulations for School Personnel. Retrieved November 18, 2009 from http://www.doe.virginia.gov/VDOE/Compliance/TeacherED/nulicr.pdf Vocational and Educational Services for Individuals with Disabilities. (2005). Keeping Quality Teachers – The Art of Retaining General and Special Education Teachers: Making the Case for Teacher Retention. Retrieved January 30, 2008 from http://www.vesid.nysed.gov/specialed/publications/persprep/qualityteachers/retention.htm

81
Appendix A
Cover Letter to District Superintendents
Dear Superintendent of Schools:
Teacher attrition is a major challenge that many school districts across this country are facing. Therefore, we are conducting a study on those factors that impact teacher attrition. We are asking for your support in using data from your district data on the total numbers of teachers during the 2007-08 school year. In addition, we are asking for permission to distribute a brief survey to those teachers who left your district after the 2007-08 school year. The information gained might help school districts understand the reasons for teacher attrition and develop strategies that will hopefully reduce annual teacher turnover.
All information will be kept confidential. In addition, we would be more than willing
to answer any questions that you may have about this study. We can be contacted by email ([email protected]) or by phone (H-757-365-0678 or C-757-409-7717).
In closing, thank you for your assistance in this matter. Have a great day.
Sincerely,
Walter R. Clemons Graduate Student Virginia Polytechnic Institute and State University
Dr. Travis W. Twiford Professor Virginia Polytechnic Institute and State University

82
Appendix B
83
Appendix C
ppendix C

84
Appendix D
Cover Letter Number One to Teachers
Date: March 3, 2009
Dear Colleague:
My name is Walter R. Clemons, and I am currently a doctoral student in the Educational Leadership and Policy Studies program at Virginia Polytechnic Institute and State University. My chairperson at Virginia Tech is Dr. Travis W. Twiford. In addition, I currently serve in the capacity of Assistant Superintendent for Human Resources and Administrative Services for Franklin City Public Schools, located in Franklin, Virginia.
Teacher attrition is a major challenge that many school districts across this country are facing.
Therefore, we are conducting a study on those factors that impact teacher attrition. We are asking you to complete a brief survey (enclosed) to assist me in this study. You have been selected based on the fact that you left your teaching position in Franklin City or Surry County Public Schools after the 2007-08 school year. Answers from the study will hopefully help pinpoint those factors that have the most impact on teachers’ decisions to leave their respective school districts. The information gained will hopefully help school districts understand the reasons for teacher attrition and possibly develop strategies that can help in reducing annual teacher turnover.
All information provided will be confidential. Your name will never be placed on the survey
itself. The survey only consists of 12 questions that require checking the responses, and should take 5 minutes or less to complete. The survey will have an identification number only for mailing purposes and the monitoring of returns. A self-addressed, stamped envelope is enclosed for your convenience. We are asking that you please complete and return the survey by March 27, 2009. The success of this study is dependent on your timely participation.
We would be more than willing to answer any questions that you may have about this study.
We can be contacted by email ([email protected]) or by phone (H-757-365-9678 or C-757-409-7717).
In closing, thank you for your assistance in this matter. Have a great day.
Sincerely,
Walter R. Clemons, Doctoral Student
Dr. Travis W. Twiford, Professor Virginia Polytechnic Institute and State University

85
Appendix E
Cover Letter Number Two to Teachers
Date: April 3, 2009
Dear Colleague:
My name is Walter R. Clemons, and I am currently a doctoral student in the Educational
Leadership and Policy Studies program at Virginia Polytechnic Institute and State University. My chairperson at Virginia Tech is Dr. Travis W. Twiford. In addition, I currently serve in the capacity of Assistant Superintendent for Human Resources and Administrative Services for Franklin City Public Schools, located in Franklin, Virginia.
We recently (March 3, 2009) sent you a survey on teacher attrition. We are resending the
survey (enclosed) and asking you to complete it if at all possible. We are trying to obtain at least 10 additional surveys from the initial mailing to increase our sample population. Therefore, your assistance in this matter would be greatly appreciated. You have been selected based on the fact that you left your teaching position in Franklin City or Surry County Public Schools after the 2007-08 school year. Answers from the study will hopefully help pinpoint those factors that have the most impact on teachers’ decisions to leave their respective school districts. The information gained will hopefully help school districts understand the reasons for teacher attrition and possibly develop strategies that can help in reducing annual teacher turnover.
All information provided will be confidential. Your name will never be placed on the survey
itself. The survey only consists of 12 questions that require checking the responses, and should take 5 minutes or less to complete. The survey will have an identification number only for mailing purposes and the monitoring of returns. A self-addressed, stamped envelope is enclosed for your convenience. We are asking that you please complete and return the survey by April 15, 2009. The success of this study is dependent on your timely participation.
We would be more than willing to answer any questions that you may have about this study.
We can be contacted by email ([email protected]) or by phone (H-757-365-9678 or C-757-409-7717).
In closing, thank you for your assistance in this matter. Have a great day.
Sincerely,
Walter R. Clemons, Doctoral Student
Dr. Travis W. Twiford, Professor Virginia Polytechnic Institute and State University

86
Appendix F
Teacher Attrition Survey
Instructions: Please read each question carefully and fill in text box or answer as appropriate.
Please answer all questions.
1. What was the major reason you decided to become a teacher?
□ Impacting the lives of children
□ Making a societal difference
□ Job allows time for family
□ Salary
□ Other
2. How many semesters of student teaching did you complete in your undergraduate or graduate experience?
□ 0 semesters
□ 1 semester
□ 2 or more semesters
3. How many other teachers are in your family?
□ 0 teachers
□ 1 teacher
□ 2 teachers
□ 3 or more teachers
□ Don’t know

87
4. What type of teaching license did you or do you currently hold?
□ Provisional
□ Collegiate Professional
□ Postgraduate Professional
□ Technical Professional
□ Conditional
5. What area(s) are you endorsed to teach in?
□ Reading/Language Arts
□ Mathematics
□ Science
□ History/Social Science
□ Fine Arts
□ Special Education
□ Other
6. What subject(s) did you teach?
□ Reading/Language Arts
□ Mathematics
□ Science
□ History/Social Science
□ Fine Arts
□ Special Education
□ Other
88
7. Please indicate your level of satisfaction with the school or school district.
□ Very Satisfied
□ Somewhat Satisfied
□ Somewhat Dissatisfied
□ Very Dissatisfied
8. Please indicate the top reason you chose to resign from the school district.
□ Overall Dissatisfaction with Teaching
□ Lack of Administrative Support
□ Student Discipline
□ Number of Teaching Preparations
□ Geographical Location
□ Salary
□ Other (please specify) ___________________
9. What is your race?
□ American Indian or Alaskan Native
□ Asian or Pacific Islander
□ Hispanic
□ Black, not of Hispanic origin
□ White, not of Hispanic origin
□ Other (please specify) ___________________

89
10. What was your biggest frustration when working for your former school district?
□ Lack of Parental Support
□ Student Discipline
□ School Climate
□ Lack of Teacher Input
□ Other (please specify) ______________________
11. What do you see as the biggest challenge for your former school district that affects teacher retention?
□ Size of District
□ Geographical Location
□ Salary
□ Other (please specify) ___________________
12. Please state one factor (if any) that would have changed your decision to leave the school district.
□ More Salary
□ More Teacher Input
□ Better Student Discipline
□ More Parental Support
□ Other (please specify) ______________

90
Appendix G
Survey Validation Instrument One (October 13, 2008)
Survey Validation Instrument One (October 13, 2008)
Dear Colleague:
Listed below are four research questions followed by 15 survey questions. This
survey will be given to teachers who left two small school districts in Southeastern Virginia
after the 2007-08 school year. Please read each survey question and then circle the
corresponding number of the research question that is in alignment with the survey question.
In addition, please indicate by circling the degree of clarity between the research question
and the survey question. (VC – Very Clear; C – Clear; SC – Somewhat Clear; NC – Not
Clear)
Research Questions:
1. What factors impacted teachers’ decisions to leave two small school districts in Southeastern Virginia? 2. What are the major challenges that impact teacher attrition in two small school districts in Southeastern Virginia as perceived by teachers who left both school districts?
3. What are the characteristics of those who entered the teaching profession and then left two small school districts in Southeastern Virginia? 4. What impact does race/ethnicity, subject-area, years of experience and licensure have on teacher attrition in two small school districts in Southeastern Virginia?
91
Survey Questions 1. What made you decide to choose teaching Relevance to Research Question : 1 2 3 4
as a profession? Clarity - VC C SC NC
□ Impacting the lives of children
□ Making a societal difference
□ Job allows time for family
□ Salary
□ Other
2. How long have you been in the teaching Relevance to Research Question : 1 2 3 4
profession? Clarity - VC C SC NC
□ 0 to 5 years
□ 6 to 10 years
□ 11 to 15 years
□ 16 or more years
3. What type of teaching license did you Relevance to Research Question : 1 2 3 4 or
do you currently hold? Clarity - VC C SC NC
□ Provisional
□ Collegiate Professional
□ Postgraduate Professional
□ Technical Professional
□ Special Education Conditional
4. What areas are you endorsed to teach in? Relevance to Research Question : 1 2 3 4
□ Reading/Language Arts Clarity - VC C SC NC
□ Mathematics
□ Science

92
□ History/Social Science
□ Fine Arts
□ Special Education
□ Other
5. What building level assignment did you Relevance to Research Question : 1 2 3 4
have? Clarity - VC C SC NC
□ Elementary
□ Middle
□ High
6. What subject(s) did you teach? Relevance to Research Question : 1 2 3 4
□ Reading/Language Arts Clarity - VC C SC NC
□ Mathematics
□ Science
□ History/Social Science
□ Fine Arts
□ Special Education
□ Other
7. How many years did you work for the Relevance to Research Question : 1 2 3 4
school district? Clarity - VC C SC NC
□ 0 to 5 years
□ 6 to 10 years
□ 11 to 15 years
□ 16 or more years

93
8. What factors impacted your decision to Relevance to Research Question : 1 2 3 4
work for the school district? Clarity - VC C SC NC
□ Size of District
□ Geographical Location
□ Salary
□ Other (please specify) ___________________
9. Please indicate your level of satisfaction Relevance to Research Question : 1 2 3 4
with the school or school district? Clarity - VC C SC NC
□ Very Satisfied
□ Somewhat Satisfied
□ Somewhat Dissatisfied
□ Very Dissatisfied
10. Please indicate the top reason you Relevance to Research Question : 1 2 3 4
chose to resign from the school district. Clarity - VC C SC NC
□ Overall Dissatisfaction with Teaching
□ Lack of Administrative Support
□ Student Discipline
□ Number of Teaching Preparations
□ Geographical Location
□ Salary
□ Other (please specify) ___________________
11. What is your gender? Relevance to Research Question : 1 2 3 4
□ Male Clarity - VC C SC NC
□ Female
94
12. What is your race? Relevance to Research Question : 1 2 3 4
□ American Indian or Alaskan Native Clarity - VC C SC NC
□ Asian or Pacific Islander
□ Hispanic
□ Black, not of Hispanic origin
□ White, not of Hispanic origin
□ Other (please specify) ___________________
13. Do you plan to stay in the teaching Relevance to Research Question : 1 2 3 4
profession? Clarity - VC C SC NC
□ Yes
□ No
14. Are you currently teaching in another Relevance to Research Question : 1 2 3 4
school district? Clarity - VC C SC NC
□ Yes
□ No
15. Please state one factor (if any) that would Relevance to Research Question : 1 2 3 4
have changed your decision to leave the Clarity - VC C SC NC
school district.
□ More Salary
□ More Teacher Input
□ Better Student Discipline
□ More Parental Support
□ Other (please specify) ______________

95
Appendix H
Survey Validation Instrument Two (November 3, 2008)
Survey Validation Instrument Two (November 3, 2008)
Dear Colleague:
Listed below are four research questions followed by 10 survey questions. This
survey will be given to teachers who left two small school districts in Southeastern Virginia
after the 2007-08 school year. Please read each survey question and then circle the
corresponding number of the research question that is in alignment with the survey question.
In addition, please indicate by circling the degree of clarity between the research question
and the survey question. (VC – Very Clear; C – Clear; SC – Somewhat Clear; NC – Not
Clear)
Research Questions:
1. What factors impacted teachers’ decisions to leave two small school districts in Southeastern Virginia? 2. What are the major challenges that impact teacher attrition in two small school districts in Southeastern Virginia as perceived by teachers who left both school districts?
3. What are the characteristics of those who entered the teaching profession and then left two small school districts in Southeastern Virginia? 4. What impact does race/ethnicity, subject-area, years of experience and licensure have on teacher attrition in two small school districts in Southeastern Virginia?

96
Survey Questions
1. How many semesters of student teaching Relevance to Research Question : 1 2 3 4
did you complete in your undergraduate Clarity - VC C SC NC
or graduate study?
□ 0 semesters
□ 1 semester
□ 2 or more semesters
2. What was your cumulative GPA upon Relevance to Research Question: 1 2 3 4
graduating from college? Clarity - VC C SC NC
□ 3.0 – 4.0
□ 2.0 – 2.99
□ 1.0 – 1.99
3. How many other teachers are in your Relevance to Research Question : 1 2 3 4
family? Clarity - VC C SC NC
□ 0 teachers
□ 1 teacher
□ 2 teachers
□ 3 or more teachers
□ Don’t Know

97
4. What was the major reason you decided to Relevance to Research Question: 1 2 3 4
become a teacher? Clarity – VC C SC NC
□ Impacting the lives of children
□ Making a societal difference
□ Job allows time for family
□ Salary
□ Other
5. How would you classify the geographical Relevance to Research Question : 1 2 3 4 area in
which you grew up as a child? Clarity - VC C SC NC
□ Suburban
□ Urban
□ Rural
6. How would you classify your former Relevance to Research Question: 1 2 3 4
school district? Clarity – VC C SC NC
□ Suburban
□ Urban
□ Rural
7. How important was the geographical location Relevance to Research Question : 1 2 3 4
of your former school district to you when Clarity - VC C SC NC
deciding to teach for the district?
□ Very Important
□ Important
□ Somewhat Important
□ Not important
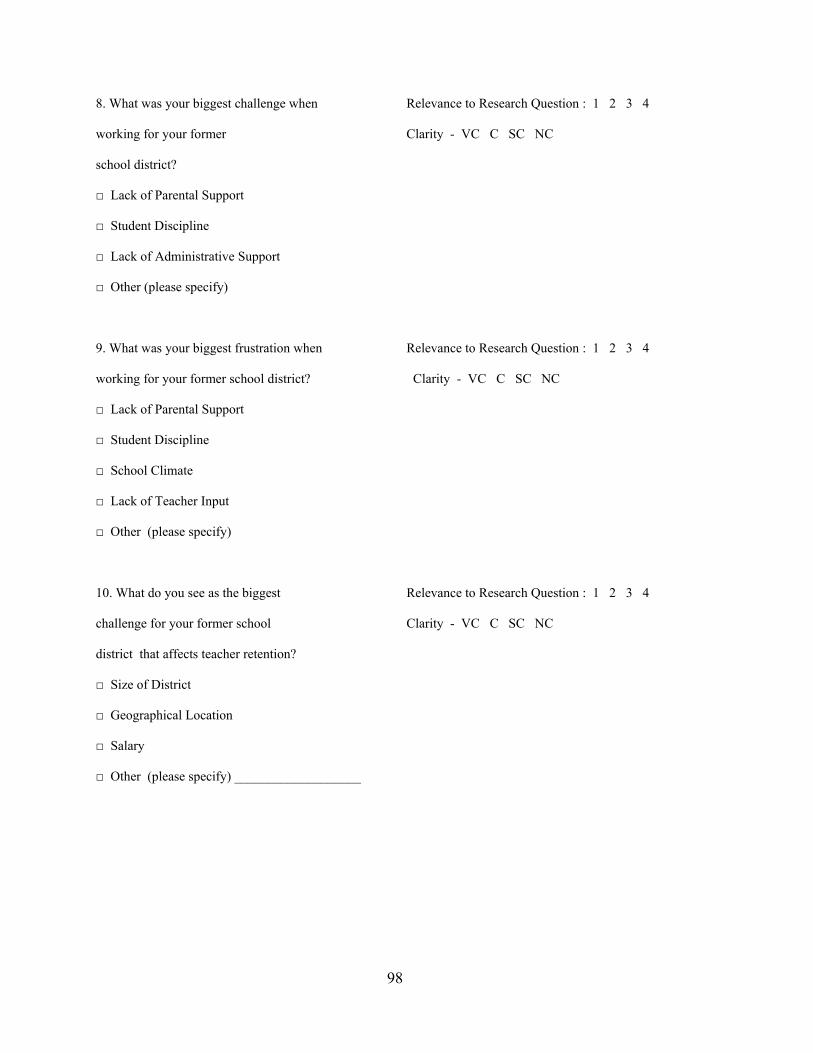
98
8. What was your biggest challenge when Relevance to Research Question : 1 2 3 4
working for your former Clarity - VC C SC NC
school district?
□ Lack of Parental Support
□ Student Discipline
□ Lack of Administrative Support
□ Other (please specify)
9. What was your biggest frustration when Relevance to Research Question : 1 2 3 4
working for your former school district? Clarity - VC C SC NC
□ Lack of Parental Support
□ Student Discipline
□ School Climate
□ Lack of Teacher Input
□ Other (please specify)
10. What do you see as the biggest Relevance to Research Question : 1 2 3 4
challenge for your former school Clarity - VC C SC NC
district that affects teacher retention?
□ Size of District
□ Geographical Location
□ Salary
□ Other (please specify) ___________________

99
Appendix I
Survey Validation Instrument One Alignment Results
Research Questions 1 2 3 4
Survey Questions
1. 11 (85%) 0 0 2 (15%)
2. 0 0 5 (38%) 8 (62%)
3. 0 0 0 13 (100%)
4. 0 0 2 (15%) 11 (85%) 5. 1 (8%) 0 6 (46%) 6 (46%) 6. 0 0 0 13 (100%) 7. 0 0 3 (23%) 10 (77%) 8. 2 (15%) 6 (46%) 5 (38%) 0 9. 0 0 11 (85%) 2 (15%) 10. 0 0 12 (92%) 1 (8%) 11. 6 (46%) 0 0 7 (54%) 12. 0 0 0 13 (100%) 13. 0 0 12 (92%) 1 (8%) (not used) 14. 0 6 (46%) 4 (31%) 3 (23%) 15. 0 2 (15%) 11 (85%) 0
(Note: Percentages may not equal 100% in some instances due to rounding. Thirteen cohort members on 10/13/08).

100
Appendix J
Survey Validation Instrument Two Alignment Results
Research Questions 1 2 3 4
Survey Questions
1. 15 (88%) 0 0 2 (12%)
2. 11 (65%) 0 6 (35%) 0
3. 14 (82%) 0 3 (18%) 0
4. 17 (100%) 0 0 0
5. 10 (59%) 4 (23%) 3 (18%) 0
6. 0 9 (53%) 8 (47%) 0
7. 6 (35%) 4 (23%) 7 (41%) 0
8. 0 12 (70%) 2 (12%) 3 (18%)
9. 0 14 (82%) 3 (18%) 0
10. 0 15 (88%) 2 (12%) 0
(Note: Percentages may not equal 100% in some instances due to rounding. Seventeen cohort members on 11/3/08).

101
Appendix K
Survey Validation Instrument One Clarity Results
(VC) = 4 (C3) = 3 (SC) = 2 (NC) = 1 Clarity
Survey Questions
1. 8 (62%) 2 (15%) 2 (15%) 1 (8%) 3.3
2. 11 (85%) 2 (15%) 0 0 3.6
3. 9 (69%) 4 (31%) 0 0 3.6
4. 8 (62%) 5 (38%) 0 0 3.6
5. 7(54%) 3 (23%) 1 (8%) 2 (15%) 3.1
6. 9 (69%) 2 (15%) 2 (15%) 0 3.5
7. 4 (31%) 6 (46%) 1 (8%) 2 (15%) 2.9
8. 5 (38%) 4 (31%) 3 (23%) 1 (8%) 3.0
9. 4 (31%) 8 (62%) 1 (8%) 0 3.2
10. 8 (62%) 5 (38%) 0 0 3.6
11. 8 (62%) 3 (23%) 1 (8%) 1 (8%) 3.3
12. 10 (77%) 3 (23%) 0 0 3.7
13. 7 (54%) 4 (31%) 2 (15%) 0 (not used) 3.3
14. 6 (46%) 3 (23%) 2 (15%) 2 (15%) 3.0
15. 9 (69%) 3 (23%) 1 (8%) 0 3.6
(Note: Percentages may not equal 100% in some instances due to rounding. Thirteen cohort
members on 10/13/08).

102
Appendix L
Survey Validation Instrument Two Clarity Results
(VC) = 4 (C) = 3 (SC) = 2 (NC) = 1 Clarity
Survey Questions
1. 8 (47%) 6 (35%) 1 (6%) 2 (12%) 3.1
2. 5 (29%) 7 (41%) 3 (18%) 2 (12%) 2.8
3. 9 (53%) 5 (29%) 2 (12%) 1 (6%) 3.2
4. 10 (59%) 6 (35%) 1 (6%) 0 3.5
5. 6 (35%) 4 (23%) 6 (35%) 1 (6%) 2.8
6. 5 (29%) 8 (47%) 4 (23%) 0 3.0
7. 4 (23%) 12 (71%) 1 (6%) 0 3.1
8. 9 (53%) 5 (29%) 3 (18%) 0 3.3
9. 5 (29%) 10 (59%) 1 (6%) 1 (6%) 3.1
10. 6 (35%) 8 (47%) 2 (12%) 1 (6%) 3.1
(Note: Percentages may not equal 100% in some instances due to rounding. Seventeen cohort members on 11/3/08). The numbers 1 through 4 beside Research Questions represent the four research
questions. The numbers one through 15 (survey validation instrument one) or one through
10 (survey validation instrument two) under Survey Questions represents the number of
survey questions. The bolded numbers with percentages represent the total number of cohort
members who indicated that the alignment of a specific survey question to a specific research
question was at or above 80%, and the clarity rating of each survey question was at or above
3.0. Therefore, only those questions from survey validation instruments one and two that had

103
an alignment rate at or above 80% and clarity rate at 3.0 or above minus number 13 on
survey validation instrument one were used for the survey in Appendix F. The questions
used from survey validation instrument one were numbers three, four, six, nine, ten, twelve,
and fifteen. The questions used from survey validation instrument two were numbers one,
three, four, nine, and ten.

104
Appendix M (AAEE Table Consent Usage)

105
Appendix N (NCES Table Consent Usage)

106
Appendix O (IRB Approval)

107
Appendix P (Human Subjects Training)
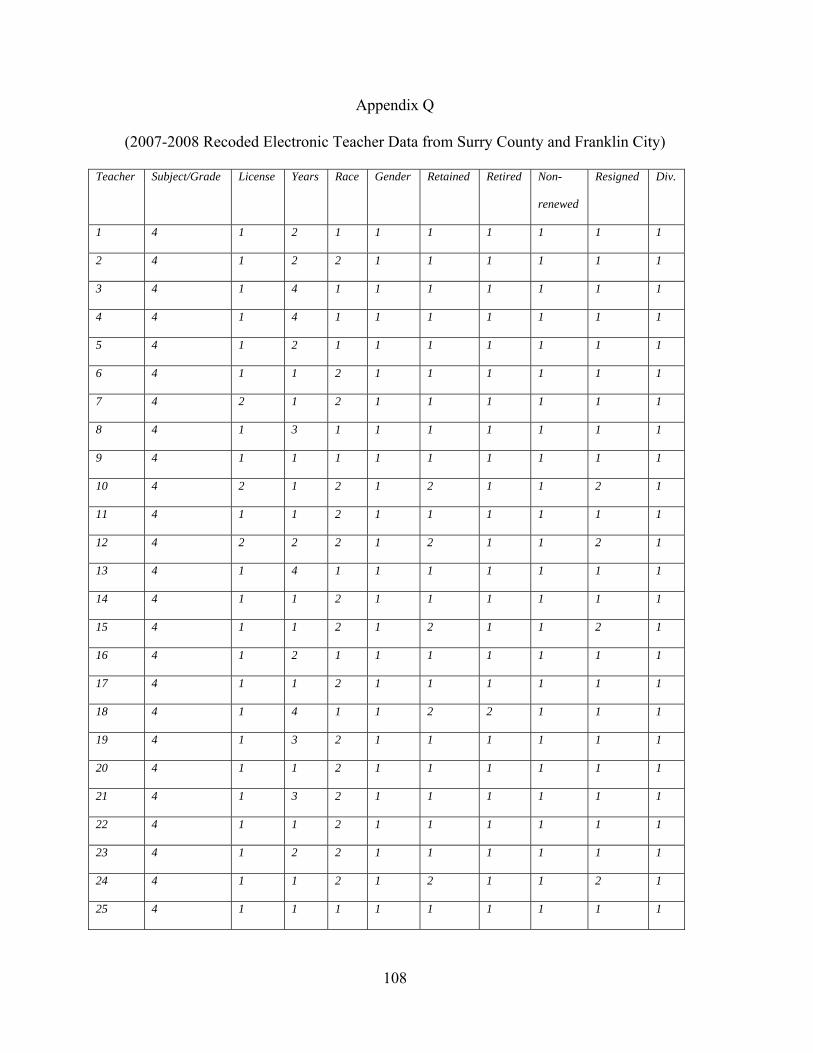
108
Appendix Q
(2007-2008 Recoded Electronic Teacher Data from Surry County and Franklin City)
Teacher Subject/Grade License Years Race Gender Retained Retired Non-
renewed
Resigned Div.
1 4 1 2 1 1 1 1 1 1 1
2 4 1 2 2 1 1 1 1 1 1
3 4 1 4 1 1 1 1 1 1 1
4 4 1 4 1 1 1 1 1 1 1
5 4 1 2 1 1 1 1 1 1 1
6 4 1 1 2 1 1 1 1 1 1
7 4 2 1 2 1 1 1 1 1 1
8 4 1 3 1 1 1 1 1 1 1
9 4 1 1 1 1 1 1 1 1 1
10 4 2 1 2 1 2 1 1 2 1
11 4 1 1 2 1 1 1 1 1 1
12 4 2 2 2 1 2 1 1 2 1
13 4 1 4 1 1 1 1 1 1 1
14 4 1 1 2 1 1 1 1 1 1
15 4 1 1 2 1 2 1 1 2 1
16 4 1 2 1 1 1 1 1 1 1
17 4 1 1 2 1 1 1 1 1 1
18 4 1 4 1 1 2 2 1 1 1
19 4 1 3 2 1 1 1 1 1 1
20 4 1 1 2 1 1 1 1 1 1
21 4 1 3 2 1 1 1 1 1 1
22 4 1 1 2 1 1 1 1 1 1
23 4 1 2 2 1 1 1 1 1 1
24 4 1 1 2 1 2 1 1 2 1
25 4 1 1 1 1 1 1 1 1 1
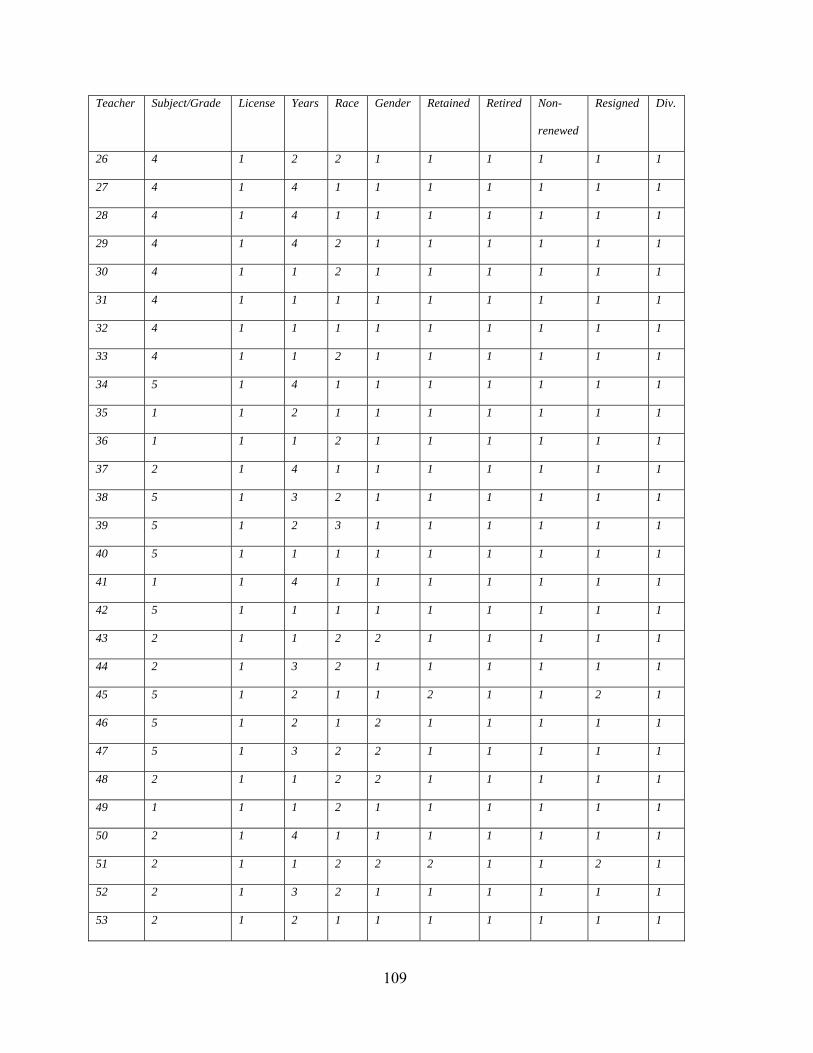
109
Teacher Subject/Grade License Years Race Gender Retained Retired Non-
renewed
Resigned Div.
26 4 1 2 2 1 1 1 1 1 1
27 4 1 4 1 1 1 1 1 1 1
28 4 1 4 1 1 1 1 1 1 1
29 4 1 4 2 1 1 1 1 1 1
30 4 1 1 2 1 1 1 1 1 1
31 4 1 1 1 1 1 1 1 1 1
32 4 1 1 1 1 1 1 1 1 1
33 4 1 1 2 1 1 1 1 1 1
34 5 1 4 1 1 1 1 1 1 1
35 1 1 2 1 1 1 1 1 1 1
36 1 1 1 2 1 1 1 1 1 1
37 2 1 4 1 1 1 1 1 1 1
38 5 1 3 2 1 1 1 1 1 1
39 5 1 2 3 1 1 1 1 1 1
40 5 1 1 1 1 1 1 1 1 1
41 1 1 4 1 1 1 1 1 1 1
42 5 1 1 1 1 1 1 1 1 1
43 2 1 1 2 2 1 1 1 1 1
44 2 1 3 2 1 1 1 1 1 1
45 5 1 2 1 1 2 1 1 2 1
46 5 1 2 1 2 1 1 1 1 1
47 5 1 3 2 2 1 1 1 1 1
48 2 1 1 2 2 1 1 1 1 1
49 1 1 1 2 1 1 1 1 1 1
50 2 1 4 1 1 1 1 1 1 1
51 2 1 1 2 2 2 1 1 2 1
52 2 1 3 2 1 1 1 1 1 1
53 2 1 2 1 1 1 1 1 1 1
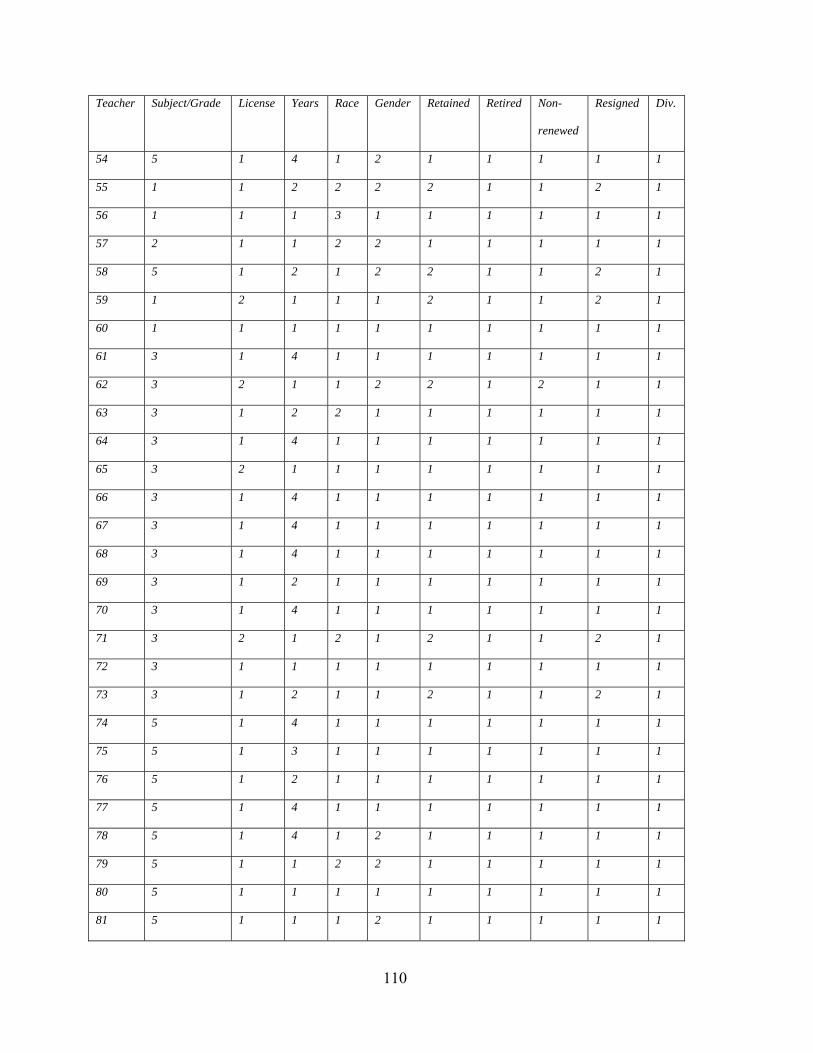
110
Teacher Subject/Grade License Years Race Gender Retained Retired Non-
renewed
Resigned Div.
54 5 1 4 1 2 1 1 1 1 1
55 1 1 2 2 2 2 1 1 2 1
56 1 1 1 3 1 1 1 1 1 1
57 2 1 1 2 2 1 1 1 1 1
58 5 1 2 1 2 2 1 1 2 1
59 1 2 1 1 1 2 1 1 2 1
60 1 1 1 1 1 1 1 1 1 1
61 3 1 4 1 1 1 1 1 1 1
62 3 2 1 1 2 2 1 2 1 1
63 3 1 2 2 1 1 1 1 1 1
64 3 1 4 1 1 1 1 1 1 1
65 3 2 1 1 1 1 1 1 1 1
66 3 1 4 1 1 1 1 1 1 1
67 3 1 4 1 1 1 1 1 1 1
68 3 1 4 1 1 1 1 1 1 1
69 3 1 2 1 1 1 1 1 1 1
70 3 1 4 1 1 1 1 1 1 1
71 3 2 1 2 1 2 1 1 2 1
72 3 1 1 1 1 1 1 1 1 1
73 3 1 2 1 1 2 1 1 2 1
74 5 1 4 1 1 1 1 1 1 1
75 5 1 3 1 1 1 1 1 1 1
76 5 1 2 1 1 1 1 1 1 1
77 5 1 4 1 1 1 1 1 1 1
78 5 1 4 1 2 1 1 1 1 1
79 5 1 1 2 2 1 1 1 1 1
80 5 1 1 1 1 1 1 1 1 1
81 5 1 1 1 2 1 1 1 1 1

111
Teacher Subject/Grade License Years Race Gender Retained Retired Non-
renewed
Resigned Div.
82 5 1 4 1 2 1 1 1 1 1
83 5 1 4 1 2 1 1 1 1 1
84 5 1 2 3 1 2 1 1 2 1
85 1 1 2 2 1 1 1 1 1 1
86 2 1 2 2 1 1 1 1 1 1
87 2 1 2 1 1 1 1 1 1 1
88 2 1 2 2 1 1 1 1 1 1
89 2 1 2 2 1 1 1 1 1 1
90 2 1 2 1 1 1 1 1 1 1
91 1 1 1 2 1 1 1 1 1 1
92 5 1 1 2 1 1 1 1 1 1
93 1 1 4 1 1 1 1 1 1 1
94 2 1 2 2 2 1 1 1 1 1
95 2 1 4 1 1 1 1 1 1 1
96 5 1 2 1 1 1 1 1 1 1
97 1 1 1 2 1 2 1 1 2 1
98 1 1 4 2 1 1 1 1 1 1
99 1 1 4 2 1 2 2 1 1 1
100 2 1 4 1 2 1 1 1 1 1
101 5 2 1 1 1 2 1 2 1 1
102 5 1 1 1 2 1 1 1 1 1
103 2 1 2 1 1 1 1 1 1 1
104 2 1 2 2 2 2 * 1 1 1 1
105 5 1 1 1 2 2 1 2 1 1
106 5 1 3 1 1 1 1 1 1 1
107 5 1 4 2 1 1 1 1 1 1
108 5 1 2 2 1 1 1 1 1 1
109 5 1 3 1 1 1 1 1 1 1

112
Teacher Subject/Grade License Years Race Gender Retained Retired Non-
renewed
Resigned Div.
110 5 1 4 1 1 2 * 1 1 1 1
111 5 2 1 1 1 1 1 1 1 1
112 5 1 1 1 2 1 1 1 1 1
1 4 1 1 2 1 1 1 1 1 2
2 4 1 2 2 1 1 1 1 1 2
3 4 1 4 1 1 1 1 1 1 2
4 4 1 4 2 1 1 1 1 1 2
5 4 1 1 2 1 1 1 1 1 2
6 4 2 1 2 1 1 1 1 1 2
7 4 1 2 1 1 1 1 1 1 2
8 3 2 1 2 1 1 1 1 1 2
9 3 2 1 2 1 2 1 1 2 2
10 4 1 3 2 1 1 1 1 1 2
11 4 1 2 2 1 1 1 1 1 2
12 4 1 4 2 1 2 2 1 1 2
13 4 1 2 2 1 1 1 1 1 2
14 4 1 2 2 1 1 1 1 1 2
15 4 1 2 1 1 1 1 1 1 2
16 4 1 2 1 1 1 1 1 1 2
17 4 1 2 1 1 1 1 1 1 2
18 4 1 1 2 1 1 1 1 1 2
19 4 1 2 2 1 1 1 1 1 2
20 4 1 2 1 1 1 1 1 1 2
21 4 1 1 2 1 1 1 1 1 2
22 4 1 2 2 1 1 1 1 1 2
23 4 1 2 1 1 1 1 1 1 2
24 4 1 1 2 1 1 1 1 1 2
25 4 1 1 2 1 1 1 1 1 2

113
Teacher Subject/Grade License Years Race Gender Retained Retired Non-
renewed
Resigned Div.
26 4 1 4 2 1 1 1 1 1 2
27 4 1 4 1 1 1 1 1 1 2
28 4 1 3 1 1 1 1 1 1 2
29 4 1 4 2 1 1 1 1 1 2
30 4 1 2 2 1 1 1 1 1 2
31 4 1 2 2 1 1 1 1 1 2
32 4 1 1 2 1 1 1 1 1 2
33 3 1 1 1 1 2 1 1 2 2
34 4 1 3 1 1 1 1 1 1 2
35 4 1 1 2 1 1 1 1 1 2
36 4 1 2 1 1 1 1 1 1 2
37 4 1 4 2 2 1 1 1 1 2
38 4 1 2 1 1 1 1 1 1 2
39 5 1 3 2 1 1 1 1 1 2
40 3 2 2 2 1 2 1 1 2 2
41 4 1 2 1 1 1 1 1 1 2
42 4 1 2 2 1 1 1 1 1 2
43 3 1 2 2 1 1 1 1 1 2
44 3 1 1 2 1 2 1 1 2 2
45 4 1 2 2 1 1 1 1 1 2
46 4 1 3 2 1 1 1 1 1 2
47 3 2 1 2 2 1 1 1 1 2
48 4 1 2 2 1 1 1 1 1 2
49 4 1 1 2 1 1 1 1 1 2
50 4 1 2 1 1 1 1 1 1 2
51 5 1 3 2 1 1 1 1 1 2
52 3 1 2 1 1 1 1 1 1 2
53 4 1 3 1 1 1 1 1 1 2

114
Teacher Subject/Grade License Years Race Gender Retained Retired Non-
renewed
Resigned Div.
54 4 1 2 2 1 2 1 1 2 2
55 3 1 1 2 1 2 1 1 2 2
56 5 1 2 2 1 1 1 1 1 2
57 2 2 1 1 1 1 1 1 1 2
58 2 1 2 1 1 2 1 1 2 2
59 1 1 4 2 1 2 2 1 1 2
60 5 1 4 1 1 1 1 1 1 2
61 5 1 2 2 1 1 1 1 1 2
62 3 1 1 2 1 1 1 1 1 2
63 1 1 4 2 1 1 1 1 1 2
64 5 1 2 2 2 1 1 1 1 2
65 1 1 4 2 1 1 1 1 1 2
66 2 1 2 1 1 1 1 1 1 2
67 2 1 2 1 1 2 1 1 2 2
68 2 1 2 2 2 2 1 2 1 2
69 5 1 4 2 2 1 1 1 1 2
70 2 1 2 3 2 2 1 1 2 2
71 1 1 1 2 1 2 1 1 2 2
72 3 1 1 2 1 2 1 1 2 2
73 1 1 2 2 1 2 1 1 2 2
74 5 1 4 2 1 1 1 1 1 2
75 3 1 4 2 1 1 1 1 1 2
76 2 1 3 1 1 1 1 1 1 2
77 3 1 3 2 1 1 1 1 1 2
78 1 1 2 1 1 1 1 1 1 2
79 3 2 1 1 2 2 1 1 2 2
80 1 2 1 2 1 2 1 1 2 2
81 3 2 1 2 2 1 1 1 1 2

115
Teacher Subject/Grade License Years Race Gender Retained Retired Non-
renewed
Resigned Div.
82 2 1 2 2 2 1 1 1 1 2
83 2 1 4 2 1 2 1 1 2 2
84 5 2 1 2 2 2 1 1 2 2
85 5 1 4 2 1 1 1 1 1 2
86 1 1 2 2 1 1 1 1 1 2
87 5 1 2 2 1 2 1 1 2 2
88 5 1 1 2 2 2 1 1 2 2
89 5 2 1 3 1 1 1 1 1 2
90 2 1 1 2 1 1 1 1 1 2
91 5 1 4 2 1 1 1 1 1 2
92 3 1 2 2 2 2 1 2 1 2
93 1 1 2 3 1 1 1 1 1 2
94 1 1 3 2 1 1 1 1 1 2
95 3 1 1 1 1 1 1 1 1 2
96 3 1 4 1 1 1 1 1 1 2
97 2 2 1 1 1 2 1 1 2 2
98 2 1 1 1 2 2 1 2 1 2
99 2 1 2 2 1 2 1 1 2 2
100 2 1 4 1 1 1 1 1 1 2
101 1 1 4 2 1 1 1 1 1 2
102 5 1 2 1 1 1 1 1 1 2
103 1 1 1 2 2 1 1 1 1 2
104 1 1 2 2 1 1 1 1 1 2
104 5 1 2 3 1 1 1 1 1 2
106 5 1 2 1 2 1 1 1 1 2
107 1 1 4 1 1 1 1 1 1 2
108 5 1 1 1 1 1 1 1 1 2
109 3 1 3 1 1 1 1 1 1 2
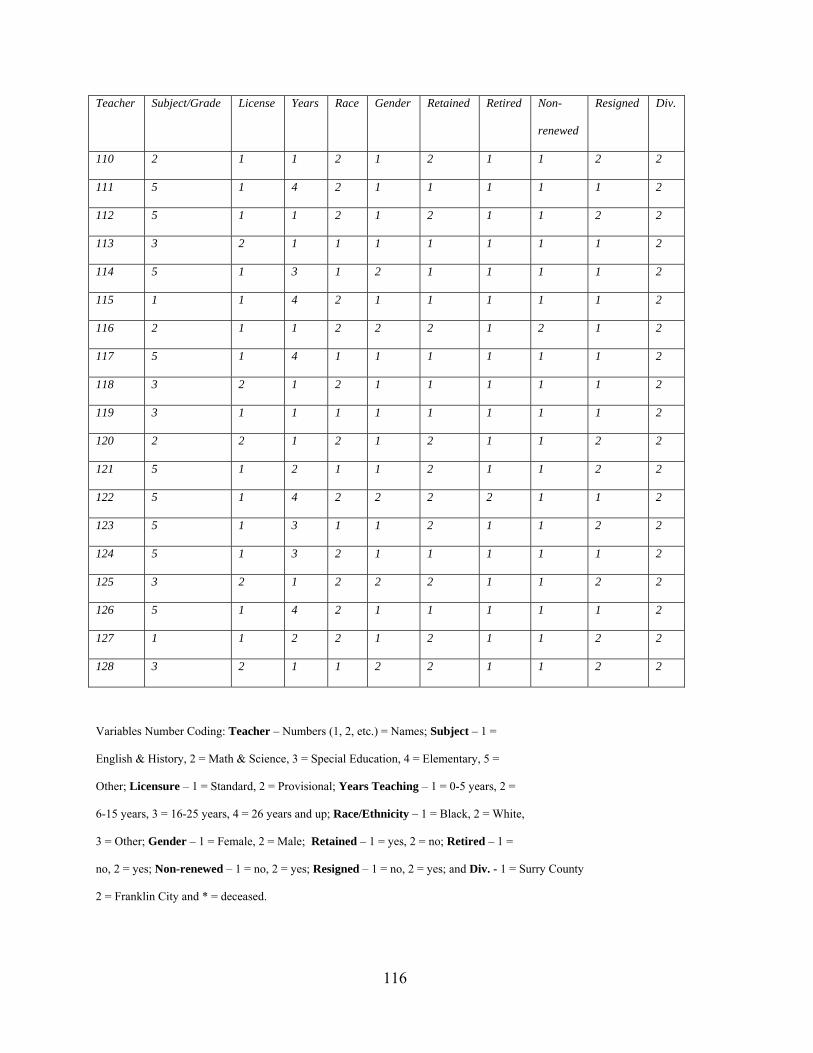
116
Teacher Subject/Grade License Years Race Gender Retained Retired Non-
renewed
Resigned Div.
110 2 1 1 2 1 2 1 1 2 2
111 5 1 4 2 1 1 1 1 1 2
112 5 1 1 2 1 2 1 1 2 2
113 3 2 1 1 1 1 1 1 1 2
114 5 1 3 1 2 1 1 1 1 2
115 1 1 4 2 1 1 1 1 1 2
116 2 1 1 2 2 2 1 2 1 2
117 5 1 4 1 1 1 1 1 1 2
118 3 2 1 2 1 1 1 1 1 2
119 3 1 1 1 1 1 1 1 1 2
120 2 2 1 2 1 2 1 1 2 2
121 5 1 2 1 1 2 1 1 2 2
122 5 1 4 2 2 2 2 1 1 2
123 5 1 3 1 1 2 1 1 2 2
124 5 1 3 2 1 1 1 1 1 2
125 3 2 1 2 2 2 1 1 2 2
126 5 1 4 2 1 1 1 1 1 2
127 1 1 2 2 1 2 1 1 2 2
128 3 2 1 1 2 2 1 1 2 2
Variables Number Coding: Teacher – Numbers (1, 2, etc.) = Names; Subject – 1 = English & History, 2 = Math & Science, 3 = Special Education, 4 = Elementary, 5 = Other; Licensure – 1 = Standard, 2 = Provisional; Years Teaching – 1 = 0-5 years, 2 = 6-15 years, 3 = 16-25 years, 4 = 26 years and up; Race/Ethnicity – 1 = Black, 2 = White, 3 = Other; Gender – 1 = Female, 2 = Male; Retained – 1 = yes, 2 = no; Retired – 1 = no, 2 = yes; Non-renewed – 1 = no, 2 = yes; Resigned – 1 = no, 2 = yes; and Div. - 1 = Surry County 2 = Franklin City and * = deceased.