a study on stock selection process and portfolio
TRANSCRIPT

A STUDY ON STOCK SELECTION PROCESS AND PORTFOLIO CONSTRUCTION IN
INDIAN CONTEXT
771
Turkish Online Journal of Qualitative Inquiry (TOJQI)
Volume 12, Issue 4, June 2021: 771-791
A Study On Stock Selection Process And Portfolio Construction In Indian
Context
Pankaj Choudhary1, Dr. Manisha Choudhary2, Dr. Praveen Choudhry3
1Principal, BMS College of Commerce & Management, Bengaluru
2Associate Dean, Department of Management Studies, VGU, Jaipur
3Dean, Department of Management Studies, VGU Jaipur
Abstract
The study is focused on in-depth understanding on identifying the investors view on the stock selection process
in Indian Context. The study is focused on parameters like stock market perception, investment awareness,
efficiency of firms, investment barriers, monitoring and evaluation, risk-return management and effective
investment decisions. The objective of the study is to study the perceptions and awareness of the investors about
the stock markets and to determine the impact of investors’ behavioural influences on Risk – Return
management and Effective investment decision.The research paper has undertaken primary data collected from
structured questionnaire with 397 respondents. Empirical and descriptive research design has been used in the
study. Statistical tools used for analysis arepercentage analysis, ANOVA, chi-Square and SEM (Structural
Equation Model). The interpretation of data and study variables were constructed using the path analysis and the
evaluation of the path coefficient was carried out using AMOS (Analysis of Moment Structure).
Keywords: stock market, investment analysis, portfolio management, super portfolio, rate of return
1. INTRODUCTION
Investment is commonly done by individuals in order to meet their future needs and furthermore to shield them
from the effect of inflation. Investment in shares will bring better returns in comparison with any other type of
investment. At whatever point the inflation rate is high, the stock market has given higher rate of return to the
investors. Share trading causes the corporate to raise extra assets for extension by increasing the demand for
securities. The liquidity that a trade gives enables the investors to sell the securities easily and quickly. This is
an appealing element of the stock market investment.
Investors can choose an avenue that is suitable as per their ideal level of risk, liquidity and return. Investment in
securities of capital market can be made through secondary or primary market (Lodhi, 2014). The investors can
purchase or sell the current securities at the predominant market cost in the stock trade through stockbrokers.
Investment is the arrangement of reserve with the point of accomplishing extra pay or growth in capital value.

Pankaj Choudhary1, Dr. Manisha Choudhary2, Dr. Praveen Choudhry3
Investment was a contributing movement that pulls in all individuals independent of their occupation, social
status and education. A downplaying of the core concepts and a careful analysis of the choices can assist
investors with creating a portfolio that expands returns while limiting risk exposure. The focal point of the
government and financial advisors was to see that each individual needs to contribute and gain returns on their
inert assets and produce a predetermined aggregate of money for anobjective throughout everyday life and
arrange for an unsure future.
INDIAN CAPITAL MARKET
Capital markets assume an imperative role in the economy, since capital is a basic segment for creating
monetary yield. Capital markets help channelize surplus assets from providers of capital, for example, retail
investors and institutional investors to clients of capital like organizations, government and people to put them
into long term beneficial use. Providers of capital for the most part need the greatest conceivable return at the
least conceivable risk, while clients of capital need to raise capital at the most reduced cost. Capital markets
have various members including individual investors, institutional investors, for example, mutual funds and
pension funds, governments and municipalities, organizations and firms, financial institutions and banks. These
members can raise capital for long term purposes by working in the capital markets in which money is
accommodated for periods longer than a year.
STOCK MARKET
Stock market is heart of the economic position of a country. The stock market plays a crucial role in the growth
of the business and trade of the nation that in the end influences the economy of the nation generally. This is the
reason why government, industry and central banks of the nation keep an eye on the happenings of the stock
market. The stock market is significant from both the business' perspective as well as the investors’ perspective.
Stock market is where stocks are purchased and sold. In an economy, other than assuming the role of a hotspot
for financing investment, stock market likewise plays out a capacity as a flagging system to administrators with
respect to investment decisions, and an impetus for corporate administration. In any case, stock market is most
popular for being the best channel for organization's capital raise. Individuals are keen on stock in view of "long
term growth of capital, profits, and a fence against the inflationary disintegration of buying power. The other
element that makes the stock market more appealing than different kinds of investment is its liquidity. Most
people invest into stocks since they need to be the proprietors of the firm, from which they obtain benefit when
the organization pay dividends or when stock price increases.
INVESTORS
A speculator is an individual who apportions capital with the desire for a future financial return. Investors use
investments to develop their money as well as give a pay during retirement, for example, with an annuity. A
wide assortment of investment vehicles exists including (however not constrained to) stocks, commodities,
wares, mutual assets, Exchange Traded Funds (ETFs), futures, options, foreign exchange, gold, silver, real
estate and retirement plans. Investors regularly perform specialized and additionally principal analysis to decide
great investment opportunities and prefer to limit risk while limiting returns.

A STUDY ON STOCK SELECTION PROCESS AND PORTFOLIO CONSTRUCTION IN
INDIAN CONTEXT
773
Types of investors
1. Retail investors
2. Institutional Investors
STOCK SELECTION PROCESS
The investor who is having additional money could invest in securities or in some other resources like gold or
land or could just deposit it in his bank account.At present, a wide assortment of investment roads is available to
the investors to suit their requirements and nature. Information about the distinctive investment empowers the
investors to choose investment cleverly. The necessary degree of return and the risk resistance choose the
decision of the investor. The investment options extend from National reserve funds endorsements, Indira Vikas
Patra, Kisan Vikas Patra,Mutual reserve plans, Insurance plans, Chits, organization shares, Bank fixed deposits,
Company fixed deposits, Provident fund, Bonds/Debentures, Postal investment funds plans, Government
securities and Real estate and others. An equity share is a section of the ownership capital of the organization
qualified to share numerous advantages from the organization.
Stock market is one of the most energetic sectors in the monetary framework, denoting a significant
commitment to financial development. Today long haul investors are intrigued to put resources into the Stock
market as opposed to contribute anyplace.The stock selection process is viewed as critical in behavioural
finance. A better comprehension of the behavioural procedure of investors and its results is noteworthy for
financial planners, in such a case that budgetary organizers get an understanding that how investor reacts to
showcase developments encourages them in creating reasonable methodologies of benefit portion for their
customers. Behavioural finance attempts to comprehend and to clarify that how intellectual errors and feelings
influence investors dynamically.
PORTFOLIO MANAGEMENT
Portfolio management is associated with the process of decision making in relation to investments strategy,
coordinating investments to targets, allocation of asset for individuals and establishments and adjusting risk
against performance.6 Portfolio management is more than completing a chain of task, specific analyses and
calculations such as return on investment, net present value, cost benefit, compensation period, and rate of
return and later changing all of these based on amount of risk, earned value or operating costing. One can gather
various activities into a portfolio that supports and these endeavors ought to be objective based that supports
significant objectives. The reason for constructing portfolio must reveal the specific needs of the investor.
Portfolio investment process is a significant advance to address the issues and accommodation of investors. The
portfolio investment process includes the following measures:
❖ Portfolio Planning
❖ Portfolio Implementation
❖ Monitoring portfolio performance
THE PORTFOLIO INVESTMENT PROCESS

Pankaj Choudhary1, Dr. Manisha Choudhary2, Dr. Praveen Choudhry3
PLANNING
• Investor Conditions
• Market Condition
• Speculative Policies
• Strategic Asset Allocation
MONITORING THE PERFORMANCE OF
PORTFOLIO
• Evaluate investment performance
IMPLEMENTATION OF PORTFOLIO PLAN
• Tactical Asset Allocation
• Rebalance Strategic Asset Allocation
• Security Selection
Figure 1
Source: http://www.mbaknol.com/investment-management/portfolio-investment-process/
PORTFOLIO AND SUPER PORTFOLIO
Portfolio and Super Portfolio is a collection of various financial investments held by an individual for certain
period of time. These financial investments may incorporate equity shares, fixed deposit schemes of
organizations, debentures, preference shares, Derivative, Bond, FD, NBFS, PF, Money Market Instrument,
Mutual fund, PPF, Insurance, Post office saving scheme etc. A portfolio is viewed as a better option in
comparison to the investment in an individual share. In the event that an individual possesses more than one
security, he is said to have an investment portfolio. Indian stock market has several portfolios to offer the
investors. Each portfolio falls within its own parent financial investment and thus forms an entity at a greater
level in the economic market. At the highest level, the financial investment market might have a portfolio within

A STUDY ON STOCK SELECTION PROCESS AND PORTFOLIO CONSTRUCTION IN
INDIAN CONTEXT
775
which there is a super portfolio. This super portfolio is enterprise wide that brings a systemic and holistic view
across the portfolio of investments in the stock market.
One can construct a portfolio by purchasing additional stocks, mutual funds, bonds or other investments. The
principle objective is to augment the portfolio value by choosing investments that will go up in price. This by
and large comprises of collection of securities. The decision to invest into stock market is taken after a great
deal of security analysis.Fundamentally, the stocks related information help in deriving the stock price
movements in the market.
2. REVIEW OF LITERATURE
Malathy and Saranya.J (2017) expressed in the paper that there are various factors that impact the perception
of investors, their behaviour and investment decision. It was analyzed that the principle factors affecting
investments are the return on investment and the profitability in short term. Each investor ought to be extremely
aware of market trend or risk while contributing since the respondents evaluated ROI exceptionally high. Return
on investment (ROI) is a significant factor that impacts the investment decision. Return is a definitive focus on a
speculator. Hence, Return on investment is rated very high
Sarkar and Sahu, (2017) Awareness of investors is moderate and needs an improvement towards stock market
activities for individual investors in market. Thus, the primary factors affecting investments are the return on
investment, awareness about market risks and returns and profitability on a short term basis.
Samreen Lodhi (2014) determined that financial literacy and accounting data helps investors in bringing down
data asymmetry and permits investors to invest into risky instruments. However, as age and experience increase,
investors’ inclination changes to safer investments, it does not imply that investor does not want to invest into
shares, he will yet with the intension of getting profit return as opposed to capital gain.
Mitra, Anupam (2014) Portfolio is a combination of bonds, future agreements, warrants, stocks, real estate,
ETFs and others, where an investor desires to invest. Markowitz Modern Portfolio Theory (MPT) enables to
understand how an investor ought to approach choosing the one best portfolio to address his issues. Or on the
other hand, more unequivocally, by what method should an investor approach choosing securities to buy and
decide what number of dollars to invest into each. Sharpe Index is utilized for performance evaluation of these
portfolios
Resnik, Bruce L (2010) possible failure of the Modern Portfolio Theory (MPT) which evaluated investment
risk and diversified a portfolio by consolidating investments with various chronicled performance
characteristics, in the credit emergency in 2010. MPT investors purportedly endured misfortunes in values,
fixed-income securities and speculative stock investments when the emergency hit. It is expressed that MPT
neglected to think about this present reality risk of cost and that it impeded strategic or vital contributing and
concentrating on resources that will probably acknowledge later on.
Aydin Ulucan (2007)studied about optimal holding period for the traditional mean-variance portfolio
optimization issues. Three distinctive target return levels, three diverse risk measures and 36 distinctive time

Pankaj Choudhary1, Dr. Manisha Choudhary2, Dr. Praveen Choudhry3
frame with moving data were utilized. It was found that portfolio returns with shifting holding periods have a
convex structure with an optimal holding period.
3. RESEARCH GAP
a) Investors’ preference towards portfolio selection is a dynamic process, is always temporal and
therefore this becomes ever new irrespective of number of studies carried on in this area. There is
always a gap and it is necessary to study the process periodically.
b) Despite a number of studies in the field of market efficiency, there is a requirement for research on
analyzing mean-variance efficient portfolio for Indian market. There is a dearth of empirical evidence
in Indian studies that investigate the impact of behavioural finance, attitude of investors and
construction of portfolio with optimal selection decisions.
c) The current study dealing with the financial behaviour of individual investors towards selection of
portfolio in Indian stock market not only covers the research gap, but also fills the knowledge gap of
the investors and employees of financial consultancy firms in constructing super portfolio with optimal
investment.
4. STATEMENT OF PROBLEM
An investor desiring to invest in securities faces the problem of choosing the right option from large number of
securities and way to allocate those funds on a group of securities. The major hurdle is the problem of decision
making faced by the investor in choosing which securities to hold and how much funds to invest in each of the
securities. According to Markowitz Model, an investor arrives at an optimal portfolio and according to Single
Index Model it helps in considering time cost and avoids unnecessary data input. These models also enable the
investor to comprehend the risks and returns in the transaction. It can be understood from these models that
selection of optimum portfolio is important.
There are large number of studies that explained these models and measures for stock selection and portfolio
management. However, there are no studies that emphasize on Construction of Super Portfolio in Indian
context. Also, not much empirical evidence exists in India on scrutinizing the factors such as Stock Market
Perception, Investor Awareness, Efficiency of Firms, Monitoring and Evaluation and Investment Barriers that
influences Risk-Return Management and Effective Investment Decision. The present study addresses the
concerns of creating a super portfolio and how the constructed Super portfolio outperforms the market indices.
5. OBJECTIVES OF THE STUDY
1. To study the perceptions and awareness of the investors about the stock markets.
2. To determine the impact of investors’ behavioural influences on Risk – Return management and
Effective investment decision.
6.RESEARCH METHODOLOGY

A STUDY ON STOCK SELECTION PROCESS AND PORTFOLIO CONSTRUCTION IN
INDIAN CONTEXT
777
Research Design:Descriptive research has been applied in the present study. Set of data were obtained from the
respondents for the purpose of testing the hypotheses and fulfill the objectives. Data was collected using self-
constructed questionnaire with the investors. The researcher has utilized has analyzed the data using different
statistical tools like percentage analysis, one-way ANOVA(Analysis of variance), Chi-Square and SEM Path
analysis for reporting the results.
Sampling Method: A simple random sampling is used in a research for selecting the representatives of the area
under study and the respondents of the research.
Sample Size: The sample size for the current study is 397 individual and institutional investors, invested in
various investment avenues in top 7 cities from four states of India i.e. Andhra Pradesh, Kerala, Karnataka and
Tamil Nadu
Table No 1
Sample size distribution using simple random sampling method
S.no Selected Top Seven Cities in
India
No.of
investors
approach
ed
Number of
investors
responded
Rate of
response
No.of
populace
included for
final study
Exclud
ed
respon
dents
1 Bangalore Karnataka 75 70 93% 63 5
2 Hyderabad A.P 70 67 96% 61 3
3 Chennai Tamil Nadu 72 66 92% 55 6
4 Visakhapatnam A.P 77 72 94% 64 5
5 Coimbatore Tamil Nadu 70 65 93% 56 5
6 Mysore Karnataka 63 42 67% 39 21
7 ErnakulamKerala 73 65 89% 59 8
Total 500 447 89% 397 53
Source: Compiled by the researcher
Data collection: Both primary and secondary data have been collected for the study.
• Primary Data:
The primary data are collected with the help of structured questionnaire for the current study. The questionnaire
included both closed and open-ended questions and had two sections. The first part deals with general

Pankaj Choudhary1, Dr. Manisha Choudhary2, Dr. Praveen Choudhry3
information on the participants. While the second section sought information through various dimensions viz.
Stock Market Perception, Investment Awareness, Efficiency of Firms, Investment Barriers, Monitoring &
Evaluation, Risk-Return Management and Effective Investment Decision
• Secondary data:
For the purpose of this study, the secondary data related to the study topic were gathered from the review of
literature through different sources, BSE & NSE. The secondary data were also collected from websites, books,
journals and magazines which were used to design the conceptual framework for the study and also the review
of literature.
Variables in the present study
Hypothesis
H01: There is no significant difference between age groups with regards to the Stock market perception,
Investment awareness, Efficiency of firms, Investment barriers, Monitoring & evaluation, Risk-Return
management and Effective investment decision.
H02: There is no significant difference between education groups with regards to the Stock market perception,
Investment awareness, Efficiency of firms, Investment barriers, Monitoring & evaluation, Risk-Return
management and Effective investment decision.
H03: There is no significant difference between profession groups with regards to the Stock market perception,
Investment awareness, Efficiency of firms, Investment barriers, Monitoring & evaluation, Risk-Return
management and Effective investment decision.
7. DATA ANALYSIS
Socio-Demographic
➢ The study reveals that nearly 51.1% of respondents are Male and 48.9% of respondents are Female.
➢ The study reveals that nearly 33.5% respondents are between 20 to 40 years, 35.3% respondents are
between 40 to 60 years, and 31.2% respondents are above 60 years.
➢ The study reveals that nearly 17.1% of the respondents are higher secondary, 37.8% of the respondents
have completed their graduate and 45.1% of the respondents have completed their post-graduate.
➢ The study reveals that nearly 51.6% of the respondents are stock broker, 32.7% of the respondents are
sub-broker and 15.6% of the respondents are trading and clearing member.
Independent variables
Stock Market Perception
Investment Awareness
Efficiency of Firms
Investment Barriers
Monitoring & Evaluation
Dependent variable
Risk-Return Management
Dependent variable
Effective Investment Decision
A STUDY ON STOCK SELECTION PROCESS AND PORTFOLIO CONSTRUCTION IN
INDIAN CONTEXT
779
➢ The study reveals that nearly 14.9% of the respondents earn less than rupees 2,00,000, 19.6% of the
respondents earn between rupees 2,00,001 to 4,00,000, 19.9% of the respondents earn between rupees
4,00,001 to 6,00,000, 11.6% of the respondents earn between rupees 6,00,001 to 8,00,000, 15.4% of the
respondents earn between rupees 8,00,001 to 10,00,000, and 18.6% of the respondents earn rupees
10,00,001 and more.
➢ The study reveals that nearly 56.4% of respondents are less than 3 years, 31.0% respondents are under
3-5 years, and 12.6% respondents are under above 5 years.
➢ The study reveals that nearly 46.9% of respondents are belongs to securities and exchange board of
India, 18.4% of respondents are belongs to national stock exchange of India, and 34.8% respondents
are belongs to Bombay stock exchange.
➢ The study reveals that nearly 55.9% of the respondents are preferred to go by online, 28.2% of the
respondents are preferred to go by offline and 15.9% of the respondents are preferred to go by both.
➢ The study reveals that nearly 17.6% of the respondents are under print media newspaper, 23.7% of the
respondents are under electronic media TV, 29.0% of the respondents are under internet, 10.6% of the
respondents are under financial advisors, 13.6% of the respondents are under friends & peer investors,
and 5.5% of the respondents are under own analysis.
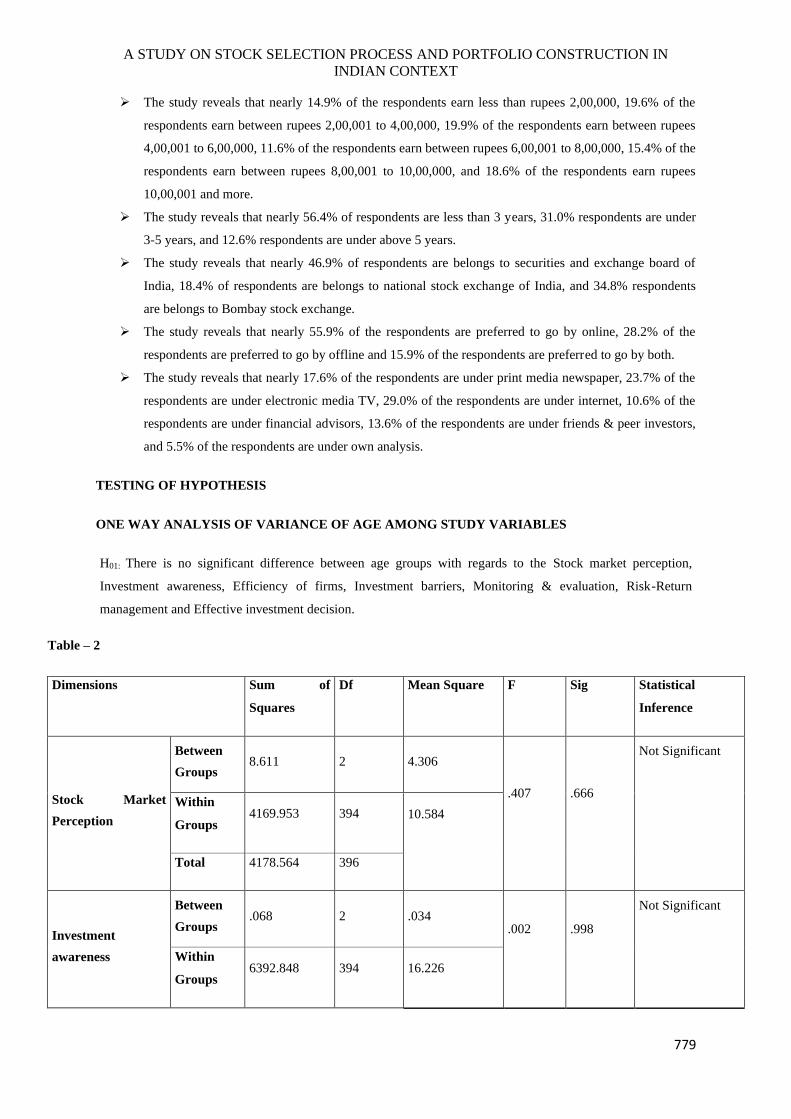
TESTING OF HYPOTHESIS
ONE WAY ANALYSIS OF VARIANCE OF AGE AMONG STUDY VARIABLES
H01: There is no significant difference between age groups with regards to the Stock market perception,
Investment awareness, Efficiency of firms, Investment barriers, Monitoring & evaluation, Risk-Return
management and Effective investment decision.
Table – 2
Dimensions Sum of
Squares
Df Mean Square F Sig Statistical
Inference
Stock Market
Perception
Between
Groups 8.611 2 4.306
.407
.666
Not Significant
Within
Groups 4169.953 394 10.584
Total 4178.564 396
Investment
awareness
Between
Groups .068 2 .034
.002
.998
Not Significant
Within
Groups 6392.848 394 16.226

Pankaj Choudhary1, Dr. Manisha Choudhary2, Dr. Praveen Choudhry3
Total 6392.917 396
Efficiency of firms
Between
Groups 79.803 2 39.901
2.705
.048
Significant
Within
Groups 5812.187 394 14.752
Total 5891.990 396
Investment barriers
Between
Groups 29.400 2 14.700
1.294
.275
Not Significant
Within
Groups 4476.635 394 11.362
Total 4506.035 396
Monitoring &
evaluation
Between
Groups 110.350 2 55.175
4.022
.019
Significant
Within
Groups 5404.557 394 13.717
Total 5514.907 396
Risk-Return
management
Between
Groups 8.556 2 4.278
.487
.615
Not Significant
Within
Groups 3462.240 394 8.787
Total 3470.796 396
Effective
investment decision
Between
Groups 28.030 2 14.015
1.177
.309
Not Significant
Within
Groups 4691.546 394 11.907
Total 4719.577 396
* Significant at the 5% level
Inference
Since the significant (p) values are greater than 0.05, the level of significance, it is concluded that there is no
statistically significant difference between the three age groups. The null hypothesis is accepted and therefore, it

A STUDY ON STOCK SELECTION PROCESS AND PORTFOLIO CONSTRUCTION IN
INDIAN CONTEXT
781
can be concluded that, age of the respondents have no significant relationship on Stock market perception,
investment awareness, Investment barriers, Risk-Return management and effective investment decision.
Since the significant (p) values are lesser than 0.05, the level of significance, it is concluded that there is
statistically significant difference between the three age groups. The null hypothesis is rejected and therefore, it
can be concluded that, age of the respondents have significant relationship on efficiency of firm and Monitoring
& evaluation.
There is significant difference between age groups with regards to the efficiency of firm and Monitoring &
evaluation. There is no significance difference between age groups with regards to Stock market perception,
investment awareness, Investment barriers, Risk-Return management and effective investment decision.
ONE WAY ANALYSIS OF VARIANCE OF EDUCATION AMONG STUDY VARIABLES
H02: There is no significant difference between education groups with regards to the Stock market perception,
Investment awareness, Efficiency of firms, Investment barriers, Monitoring & evaluation, Risk-Return
management and Effective investment decision.
Table – 5.18
Dimensions Sum of
Squares
Df Mean Square F Sig Statistical
Inference
Stock Market
Perception
Between
Groups 24.746 2 12.373
1.174
.310
Not
Significant
Within
Groups 4153.818 394 10.543
Total 4178.564 396
Investment
awareness
Between
Groups 7.106 2 3.553
.219
.803
Not
Significant
Within
Groups 6385.811 394 16.208
Total 6392.917 396
Efficiency of firms
Between
Groups 37.333 2 18.666
1.256
.286
Not Significant
Within
Groups 5854.657 394 14.860

Pankaj Choudhary1, Dr. Manisha Choudhary2, Dr. Praveen Choudhry3
Total 5891.990 396
Investment
barriers
Between
Groups 13.940 2 6.970
.611
.543
Not
Significant
Within
Groups 4492.095 394 11.401
Total 4506.035 396
Monitoring &
evaluation
Between
Groups 73.981 2 36.990
2.679
.070
Not
Significant
Within
Groups 5440.926 394 13.809
Total 5514.907 396
Risk-Return
management
Between
Groups 3.306 2 1.653
.188
.829
Not Significant
Within
Groups 3467.490 394 8.801
Total 3470.796 396
Effective
investment decision
Between
Groups 28.223 2 14.111
1.185
.307
Not
Significant
Within
Groups 4691.354 394 11.907
Total 4719.577 396
* Significant at the 5% level
Inference
Since the significant (p) values are greater than the level of significance (0.05 or 5%), it is concluded that there
is no statistically significant difference between the three education groups. The null hypothesis is accepted and
therefore, it can be concluded that education of the respondents has no significant relationship on Stock market
perception, Investment awareness, Investment barriers, Risk-Return management, effective investment decision,
Efficiency of the firm and Monitoring & evaluation.
There is no significance difference between education groups with regards to Stock market perception,
Investment awareness, Investment barriers, Risk-Return management, Effective investment decision, Efficiency
of firm and Monitoring & evaluation.

A STUDY ON STOCK SELECTION PROCESS AND PORTFOLIO CONSTRUCTION IN
INDIAN CONTEXT
783
ONE WAY ANALYSIS OF VARIANCE OF PROFESSION AMONG STUDY VARIABLES
H03: There is no significant difference between profession groups with regards to the Stock market perception,
Investment awareness, Efficiency of firms, Investment barriers, Monitoring & evaluation, Risk-Return
management and Effective investment decision.
Table – 5.19
Dimensions Sum of
Squares
Df Mean Square F Sig Statistical
Inference
Stock Market
Perception
Between
Groups 79.088 2 39.544
3.801
.023
Significant
Within
Groups 4099.476 394 10.405
Total 4178.564 396
Investment
awareness
Between
Groups 97.750 2 48.875
3.059
.048
Significant
Within
Groups 6295.166 394 15.978
Total 6392.917 396
Efficiency of firms
Between
Groups 34.556 2 17.278
1.162
.314
Not Significant
Within
Groups 5857.434 394 14.867
Total 5891.990 396
Investment
barriers
Between
Groups 92.521 2 46.261
4.130
.017
Significant
Within
Groups 4413.514 394 11.202
Total 4506.035 396
Monitoring &
evaluation
Between
Groups 144.050 2 72.025 5.284 .005

Pankaj Choudhary1, Dr. Manisha Choudhary2, Dr. Praveen Choudhry3
Within
Groups 5370.857 394 13.632
Significant
Total 5514.907 396
Risk-Return
management
Between
Groups 1.474 2 .737
.084
.920
Not Significant
Within
Groups 3469.322 394 8.805
Total 3470.796 396
Effective
investment decision
Between
Groups 59.163 2 29.582
2.501
.083
Not
Significant
Within
Groups 4660.413 394 11.828
Total 4719.577 396
* Significant at the 5% level
Inference
It can be perceived from the above table that there is a statistically significant difference between the three
profession groups as the variables - Stock market perception, Investment awareness, Investment barriers and
Monitoring & evaluation have their (p) values lesser than the level of significance (0.05 or 5%). The null
hypothesis is rejected and therefore, it can be concluded that the profession of the respondents has significant
relationship on Stock market perception, Investment awareness, Investment barriers and Monitoring &
evaluation.
On the other hand, there is no statistically significant difference between the three profession groups as the
variables - Efficiency of firms, Risk-Return management and Effective investment decision have their
significant (p) values are greater than the level of significance (0.05 or 5%). The null hypothesis is accepted and
therefore, it can be concluded that the profession of the respondents has no significant relationship on the
Efficiency of firms, Risk-Return management and Effective investment decision.
Structural Equation Modelling
Figure – 2
SEM Path Analysis

A STUDY ON STOCK SELECTION PROCESS AND PORTFOLIO CONSTRUCTION IN
INDIAN CONTEXT
785
Source: Primary data

Pankaj Choudhary1, Dr. Manisha Choudhary2, Dr. Praveen Choudhry3
SEM PATH ANALYSIS
Table – 3
Significant at 5% level
Testing of Hypothesis
H01.1: Stock Market Perception has no impact on the Risk Return Managment.
Analysis:: It can be seen from Table 5.23 that the Stock Market Perception being 0.001 represents the impact of
Stock Market Perception on Risk Return Managment, holding other variables constant. The p value is
significant at 5% level and therefore the null hypothesis rejected.
Result:Stock Market Perception has a positive impact on the Risk Return Managment.
H01.2: Investment Awareness has no impact on the Risk Return Management
Analysis: It can be seen from Table 5.23 that the Investment Awareness being 0.012 represents the impact of
Investment Awareness on Risk Return Managment, holding other variables constant. The p value is significant
at 5% level and therefore the null hypothesis rejected.
Result:Investment Awareness has a positive impact on the Risk Return Managment.
H01.3: Efficiency of Firms has no impact on Risk Return Management
Analysis: It can be seen from Table 5.23 that the Efficiency of Firms being0.031 represents the impact of
Efficiency of Firms on Risk Return Managment, holding other variables constant. The p value is significant at
5% level and therefore the null hypothesis rejected.
Result:Efficiency of Firms has a positive impact on Risk Return Managment.
H01.4: Investment Barriers has no impact on Risk Return Management
Dimensions Path Dimensions SE P Value Result
Risk Return Management <---
Stock Market Perception 1.748 0.001
Significant
Risk Return Management <---
Investment Awareness 1.144 0.012
Significant
Risk Return Management <---
Efficiency of Firms 2.055 0.031
Significant
Risk Return Management <---
Investment Barriers 0.987 0.009
Significant
Risk Return Management <---
Monitoring & Evaluation 0.046 1.180
Not Significant
Effective Investment Decision <---
Risk Return Management 1.841 0.016 Significant

A STUDY ON STOCK SELECTION PROCESS AND PORTFOLIO CONSTRUCTION IN
INDIAN CONTEXT
787
Analysis: It can be seen from Table 5.23 that the Investment Barriers being0.009 represents the impact of
Investment Barriers on Risk Return Managment, holding other variables constant. The p value is significant at
5% level and therefore the null hypothesis rejected.
Result:Investment Barriers has a Positive impact on the Risk Return Managment.
H01.5: Monitoring & Evaluation has no impact on Risk Return Management
Analysis: It can be seen from Table 5.23 that Monitoring & Evaluation being1.180 represents the impact
Monitoring & Evaluation on Risk Return Managment, holding other variables constant. The p value is not
significant at 5% level and therefore the null hypothesis accepted.
Result: Monitoring & Evaluation has a Negative impact on Risk Return Managment.
H02.1: Risk Return Management has no impact on the Effective Investment Decision
Analysis:: It can be seen from Table 5.23 that the Risk Return Management being 0.016 represents the impact
of Effective Investment Decision, holding other variables constant. The p value is significant at 5% level and
therefore the null hypothesis rejected.
Result:Risk Return Management has a Positive impact on Effective Investment Decision.
Confirmatory Factor Analysis Result
Table – 5.24
Model Parameters Cut – off Values The values on model
Cmin/df Less than 3 1.187
GFI More than 0.95 0.996
RMR Less than 0.05 0.034
CFI More than 0.95 0.991
RMSEA Less than 0.07 0.022
Source: Primary Data
Result and Discussion:
To evaluate the appropriateness of the overall model, the study assessed the measures representing the overall fit
(CMIN /df = 1.187), absolute goodness of fit (GFI = 0.996) Comparative fit indices (CFI=0.991), root mean
square error of approximation (RMSEA= 0.022) and root mean square residual (RMR = 0.034). Though there is
no universal digits for these SEM fit measure, guidelines can be taken from multiple literature to arrive at
decision. Based on literature it was found that, RMSEA can be ranging from 0.06 to 0.08, CMIN/df should be
less than 3.0, GFI , CFI and RMSEA can be less than 0.07 preferably. Hence the above value shows the model
is good fit.

Pankaj Choudhary1, Dr. Manisha Choudhary2, Dr. Praveen Choudhry3
8. KEY FINDINGS
➢ From the one way ANOVA test researcher found that the significant (p) values are greater than 0.05,
the level of significance, it is concluded that there is no statistically significant difference between the
three age groups. The null hypothesis is accepted and therefore, it can be concluded that, age of the
respondents have no significant relationship on Stock market perception, investment awareness,
Investment barriers, Risk-Return management and effective investment decision. There is significant
difference between age groups with regards to the efficiency of firm and Monitoring & evaluation.
➢ From the one way ANOVA test researcher found the significant (p) values are lesser than 0.05, the
level of significance, it is concluded that there is statistically significant difference between the three
age groups. The null hypothesis is rejected and therefore, it can be concluded that, age of the
respondents have significant relationship on efficiency of firm and Monitoring & evaluation. There is
no significance difference between age groups with regards to Stock market perception, investment
awareness, Investment barriers, Risk-Return management and effective investment decision.
➢ One way ANOVA test shows that the significant (p) values are greater than 0.05, the level of
significance, it is concluded that there is no statistically significant difference between the three
education groups. The null hypothesis is accepted and therefore, it can be concluded that, education of
the respondents have no significant relationship on Stock market perception, Investment awareness,
Investment barriers, Risk-Return management, effective investment decision, Efficiency of firm and
Monitoring & evaluation. There is no significance difference between education groups with regards to
Stock market perception, Investment awareness, Investment barriers, Risk-Return management,
Effective investment decision, Efficiency of firm and Monitoring & evaluation.
➢ From the study researcher found that the significant (p) values are lesser than 0.05, the level of
significance, it is concluded that there is statistically significant difference between the three profession
groups. The null hypothesis is rejected and therefore, it can be concluded that, profession of the
respondents have significant relationship on Stock market perception, Investment awareness,
Investment barriers and Monitoring & evaluation. There is significance difference between profession
groups with regards to Stock market perception, Investment awareness, Investment barriers and
Monitoring & evaluation.
➢ One-way ANOVA shows that the significant (p) values are greater than 0.05, the level of significance,
it is concluded that there is no statistically significant difference between the three profession groups.
The null hypothesis is accepted and therefore, it can be concluded that, profession of the respondents
have no significant relationship on Efficiency of firms, Risk-Return management and Effective
investment decision. There is no significance difference between profession groups with regards to
Efficiency of firms, Risk-Return management and Effective investment decision.
SEM (Structural Equation Modelling)
➢ SEM is done to evaluate the appropriateness of the overall model, the study assessed the measures
representing the overall fit (CMIN /df = 1.187), absolute goodness of fit (GFI = 0.996) incremental fit
indices (CFI=0.991), root mean square error of approximation (RMSEA= 0.022) and root mean square
residual (RMR = 0.034). Though there is no universal digits for these SEM fit measure, guidelines can

A STUDY ON STOCK SELECTION PROCESS AND PORTFOLIO CONSTRUCTION IN
INDIAN CONTEXT
789
be taken from multiple literature to arrive at decision. Based on literature it was found that, RMSEA
can be ranging from 0.06 to 0.08, CMIN/df should be less than 3.0, GFI , CFI and RMSEA can be less
than 0.07 preferably. Hence the above value shows the model is good fit.
9. LIMITATIONS OF THE STUDY
➢ It was difficult to gather primary data using questionnaire as most individual investors were not
comfortable in responding to the questionnaire and argues about their privacy being infringed. At the
same time, it was hard to control high response rate for some statements in the questionnaire.
➢ Some investors were not aware of their own expected rate of return for their investments and the
average return rate of the stock market. This can lead to ambiguity in the results.
➢ Though the sample size was relatively high and satisfied the prerequisite of statistical techniques, it is
suggested that having a larger sample size in future researches can reflect more accurate results in
realistic situation of Indian stock market.
➢ The data obtained from this study may lack depth on the topic or details about construction of super
portfolio in Indian stock market as there is very limited number of references about portfolio
construction.
➢ The data collection for the present study is limited to the top seven cities from four states of India i.e.
Andhra Pradesh, Kerala, Karnataka and Tamil Nadu and other states or countries were not considered
and hence the result of the study cannot be generalized globally.
10. SUGGESTIONS
❖ While investing in equity shares it is encouraged to contribute for long time to create more wealth. It is
prudent to do organization analysis, industry analysis and economy analysis while investing into equity
shares.
❖ People do not have their insight on the Market and prospects of the method of investment, it is
important to drive awareness campaigns by the administrative bodies and financier houses with the
support of the legislature.
❖ It is proposed to consider credit rate score given by credit rating agencies to the corporate giving
debenture/securities/corporate deposit while investing into debenture/securities/corporate deposit. One
ought to likewise consider post expense form in the wake of investing into
debenture/securities/corporate deposit.
❖ Government should make accessible more assessment investment funds products so as to diminish
centralization of reserve funds in Life Insurance and Provident fund.
❖ Investors select the areas while making investment, it is shown that however the Indian stock market is
to a great extent clarified by the development of Sensex and NSE CNX Nifty their vacillations are not
sent to segments like BSE Power, BSE TECk, NSE CNX Service, NSE CNX MNC, NSE CNX Bank
and NSE CNX Finance. Subsequently, while developing a portfolio the investors can have this in their
psyche to play safe with such stable segments.

Pankaj Choudhary1, Dr. Manisha Choudhary2, Dr. Praveen Choudhry3
11. CONCLUSION
Any investment has two perspectives – time and risk. The management of the portfolio starts once the portfolio
plan is executed. Portfolio management is done by observing the investments and estimating the portfolio's
presentation comparative with the benchmarks. It is basic to report investment performance at standard interval.
As investors travel through their life stages, changes may happen, for example, job changes, deaths, births,
divorce or contracting time frames, which may expect acclimations to their objectives, risk reward profiles or
resource designations. As changes happen, or as market or economic conditions direct, the portfolio planning
process starts once again to guarantee that the correct investment system is set up.
This study helped all the investor in taking investment decision in current situation and will improve their level
of awareness in various financial investment avenues. Thus, this study had contributed to society in
comprehending awareness about various financial investment avenues and the variables to be thought of while
investing into various financial investment avenues and stock selection process and construction of optimal
portfolio.
12. SCOPE FOR FUTURE RESEARCH
➢ Incorporation of variables like portfolio utility, risk penalty, transaction costs, restrictive instability and
so on were not included because of data constraints. These variables can be taken into account in
future.
➢ A relative study between semi urban and urban Investment pattern could be conducted in future.
➢ In addition to Indian markets, other nations or regional countries can also be explored as part of
international portfolio diversification.
➢ The Data Envelopment Analysis technique can be feasibly augmented with various input and output
framework to have a superior performing portfolio.
References
➢ Aalberts, Robert J., Poon, Percy S (2011) ―the new prudent investor rule and the modern portfolio
theory: a new direction for fiduciaries American Business Law Journal 00027766, Fall96, Vol. 34,
Issue 1
➢ Mahajan M. A. (2012), Management Of Portfolio – A Research Study Of Investors (Doctoral
Dissertation), Shri Jagdish Prasad JhabarmalTibrewala University, Rajasthan.
➢ Edward Qian(2012) ―Diversification Return and Leveraged Portfolios‖ The Journal of Portfolio
Management, Institutional Investor Journals, Number 4, Volume 38 New York
➢ Fogel, O.C.S. and Berry, T. (2006). The Disposition Effect and Individual investor Decisions: The
roles of regret and counterfactual alternatives. Journal of Behavioral Finance 7 (2): 107-116.
➢ Nagpal, S. and Bodla, B.S. (2007). Psychology of Investments and Investor’s Preferences. Regal
Publications, New Delhi.
➢ Nalini R (2014) Optimal Portfolio Construction Using Sharpe’s Single Index Model - A Study of
Selected Stocks From BSE International Journal of Advanced Research in Management and Social
Sciences, Vol. 3 | No. 12 ISSN: 2278-6236 PP 72-93

A STUDY ON STOCK SELECTION PROCESS AND PORTFOLIO CONSTRUCTION IN
INDIAN CONTEXT
791
➢ Ndirangu, Antony wahome [2014] Factors influencing individual investor behavior during initial
public offers in Kenya: International Journal of Economics, Commerce and Management: Pp 89
➢ Doshi, B.M. and Tikyani, H., 2020. A Theoretical Integration of GIG Economy: Advancing
Opportunity, Challenges and Growth. International Journal of Management (IJM), 11(12).
➢ Doshi, B.M., Rajharia, P., Acharya, A. and Ranjan, S.K., 2020. Psychological Contract Breach and
Workplace Outcome: A Theoretical Integration.
➢ Choudhary, M. and Ranjan, S.K., 2020. Work Stress and Burnout: Eustress A Tool to
Deal. International Journal of Management (IJM), 11(12).
➢ Rajharia, P. and Sharma, B., 2014. Corporate governance in India evolution, issues and challenges for
the future. International Journal of Scientific Research and Management, 2(12), pp.1815-1824.
➢ Rajharia, P. and Sharma, B., 2014. Legal aspects of corporate governance for it companies in
India. IMPACT: International Journal of Research in Business Management (IMPACT: IJRBM), 2(11),
pp.35-42.