a study on risk,return and customer satisfaction of mutual fund industry
TRANSCRIPT
Analysing the risk, return and customer satisfaction in mutual
fund industry in special reference to SBI mutual fund DRAFT REPORT (SIP-2015)
Submitted To:- Submitted by:-
Dr. Jessy John Prateek Goyal
Roll No. 2933
PGDM-BM

CERTIFICATE
It is to certify that this project report entitled “Analysing the risk, return and customer
satisfaction in mutual fund industry with special reference to SBI Mutual fund” is a record
of project work done independently by Mr. Prateek Kumar Goyal under my guidance and
supervision and that it has not previously formed any basis for the award of any degree,
fellowship or associate-ship to him.
Date: 17th July 2015 Dr. Jessy John
Faculty
FMS-IRM
Jaipur

DECLARATION
I, Prateek Kumar Goyal hereby declare that this project report entitled “Analysing the risk,
return and customer satisfaction in mutual fund industry with special reference to SBI
Mutual fund” is a bonafide record of work done by me during the course of summer internship
and that it has not previously formed the basis of award to me, for any degree/diploma, associate
ship, fellowship or other similar title, of any other institute/society.
Date: 17th July 2015 Prateek Goyal
PGDM (BM),
FMS-IRM
Jaipur

ACKNOWLEDGEMENT
This report bears the imprint of many people and without their support it would not have existed.
I acknowledge my deepest thanks to my project guide Mr. Praveen Saini – Senior Manager,
Jaipur for his constant support and encouraging words that helped me in shaping the project in
the best possible way, also for providing me with valuable suggestions and guidance. Truly such
enriching exposure shall now firmly remain foundation pillar of my career which is about to
initiate.
I would also like to thank, here, my faculty guide Dr. Jessy John without whose guidance this
project would not have been possible and also for providing me vital inputs to co-relate the
present project work and hence provide a sound base to the report structure.
Finally, my sincere thanks to all the employees of SBI Mutual Fund for their cooperation and
support in completing the project.
With that I dedicate this work of research to my parents, friends and teachers.

EXECUTIVE SUMMARY
This project is the result of Descriptive study of Mutual Funds in India. A Mutual Fund is a trust that pools the savings of a number of investors who share a common financial goal. It throws the light on how Mutual funds really work, how much risk involved in it, how they diversify themselves and how much return is there while investing in mutual fund. Investing involves risk of loss of principal and is more concerned on the return of investment. This total risk, measured by standard deviation, can be divided into two parts: Unsystematic risk, systematic risk. Unsystematic risk is also called diversifiable risk. Systematic risk may be called non-diversifiable risk, unavoidable risk or market risk and can be measured by Beta. The main objective of the study is to give investors a basic idea of risk involved in Mutual Funds industry and encourage them to invest in those areas where they can maximize the return on their capital. The research provided an interesting insight into awareness about the mutual funds, differences in age groups, occupation, income levels, risk taking ability of individuals, investment options preferred etc. The Indian capital market has been increasing tremendously during last few years. With the reforms of economy, reforms of industrial policy, reforms of public sector and reforms of financial sector, the economy has been opened up and many developments have been taking place in the Indian money market and capital market. In order to help the small investors, mutual fund industry has come to occupy an important place. This study helps me to understand how the companies diversify themselves in different sectors and in different companies to maximize the return and to minimize the risk involved in it. It also taught me how to take every experience in the right sprit & learn from each one. Finally, I shall consider all my hard work worthwhile, if this endeavor of mine is able to satisfy all those concerned & proves useful to any one or for any study in the future
TABLE OF CONTENTS
CONTENTS Page no.
CHAPTER-1 – INTRODUCTION
1.1 OVERVIEW
1.2 CONCEPT OF MUTUAL FUND(PROCEDURE)
1.3 A BRIEF ON MUTUAL FUND
1.4 CONCEPTUAL ANALYSIS OF MUTUAL FUND
1.5 ADVANTAGE AND DISADVANTAGE OF MUTUAL FUND
1.6 TYPES OF MUTUAL FUND
1.7 ACCOUNTING AND VALUATION (PORTFOLIO ANALYSIS TOOL)
1.8 MJOR PLAYERS IN MUTUAL FUND
1.9 THEROTICAL ASPECTS OF MEASURES OF RISK & RETURN IN
MUTUAL FUND SECTOR
1.10 TYPES OF RISKS
1.11 MEASURES OF RETURNS
CHAPTER -2 COMPANY PROFILE
1.1 IDENTITY
1.2 VISION
1.3 SERVICES
CH-3 REVIEW OF LITERATURE

CH-4 RESEARCH METHODOLOGY
1.1 OBJECTIVE OF STUDY
1.2 JUSTIFICATION FOR STUDY
1.3 RESEARCH DESIGN
1.4 SOURCES OF DATA COLLECTION
1.5 SAMPLE SIZE & SAMPLE TECHNIQUE
1.6 TOOLS FOR DATA COLLECTION
1.7 LIMITATION OF STUDY
CH-5 ANALYSIS AND INTERPRETATION
CH-6 FINDINGS
CH-7 CONCLUSION
CH-8 SUGGESTION
CH-9 REFERENCES

Chapter-1
INTRODUCTION
1.1 OVERVIEW
Prudent investing requires information of key financial concepts and an understanding of your investment profile and how these works together to affect investing decisions and results. "Saving" and "investing" are often used interchangeably. However, there are differences between the two. Saving refers to funds kept for making specific purchases in the relatively near future (usually three years or less) and for emergencies. Preservation of the principal and liquidity of the funds (ease of converting to cash) are essential aspects of savings. Consequently, savings generally yield a low rate of return and do not maintain purchasing power. Investing, on the other hand, focuses on increasing net worth and achieving long-term financial goals. Investing involves risk (of loss of principal) and is to be considered only after you have adequate savings and have done proper risk management. In short, investing is more concerned on the return of investment, while savings is on the return of capital. All investments involve some element of risk because the future value of an investment is uncertain. Risk, simply stated, is the possibility that the actual return on an investment will vary from the anticipated return or that the initial principal will decline in value. Risk implies the possibility of loss on your investment. Mutual Fund “Is a fund, managed by an investment company with the financial objective of generating high Rate of Returns” or an investment vehicle managed by finance professionals that raise capital by selling shares (called units) in a chosen and balanced set of securities to the public. An investment fund is a collection of investments, such as stocks, bonds or other funds. Unlike most other types of investment funds, mutual funds are “open-ended,” which means as more people invest, the fund issues new units or shares. A mutual fund typically focuses on specific types of investments. For example, a fund may invest mainly in government bonds, stocks from large companies or stocks from certain countries. Some funds may invest in a mix of stocks and bonds, or other mutual funds. These asset management or investment management companies collects money from the investors and invests those money in different Stocks, Bonds and other financial securities in a diversified manner. Before investing they carry out thorough research and detailed analysis on the market conditions and market trends of stock and bond prices. These things help the fund managers to speculate properly in the right direction. The investors, who invest their money in the Mutual fund of any Investment Management Company, receive an Equity Position in that particular mutual fund. When after certain period of time, whether long term or short term, the investors sell the Shares of the Mutual Fund, they receive the return according to the market conditions.

CONCEPT OF MUTUAL FUND(PROCEDURE)
A BRIEF ON MUTUAL FUND
Mutual fund is the pool of the money, based on the trust who invests the savings of a number of investors who shares a common financial goal, like the capital appreciation and dividend earning. The money thus collect is then invested in capital market instruments such as shares, debenture, and foreign market. Investors invest money and get the units as per the unit value which we called as NAV (net assets value). Mutual fund is the most suitable investment for the common man as it offers an opportunity to invest in diversified portfolio management, good research team, professionally managed Indian stock as well as the foreign market, the main aim of the fund manager is to taking the scrip that have under value and future will rising, then fund

manager sell out the stock. Fund manager concentration on risk – return trade off, where minimize the risk and maximize the return through diversification of the portfolio. The most common features of the mutual fund unit are low cost.
CONCEPTUAL ANYLISIS OF MUTUAL FUNDS
UNDERSTANDING MUTUAL FUND
Mutual fund is a trust that pools money from a group of investors (sharing common financial goals) and invest the money thus collected into asset classes that match the stated investment objectives of the scheme. Since the stated investment objectives of a mutual fund scheme generally form the basis for an investor's decision to contribute money to the pool, a mutual fund can not deviate from its stated objectives at any point of time.
Every Mutual Fund is managed by a fund manager, who using his investment management skills and necessary research works ensures much better return than what an investor can manage on his own. The capital appreciation and other incomes earned from these investments are passed on to the investors (also known as unit holders) in proportion of the number of units they own.

When an investor subscribes for the units of a mutual fund, he becomes part owner of the assets of the fund in the same proportion as his contribution amount put up with the corpus (the total amount of the fund). Mutual Fund investor is also known as a mutual fund shareholder or a unit holder.
Any change in the value of the investments made into capital market instruments (such as shares, debentures etc.) is reflected in the Net Asset Value (NAV) of the scheme. NAV is defined as the market value of the Mutual Fund scheme's assets net of its liabilities. NAV of a scheme is calculated by dividing the market value of scheme's assets by the total number of units issued to the investors.
For example:
1. If the market value of the assets of a fund is Rs 100,000
2. The total number of units issued to the investors is equal to 10,000.
3. Then the NAV of this scheme = (A)/ (B), i.e. 100,000/10,000 or 10.00
4. Now if an investor 'X' owns 5 units of this scheme
5. Then his total contribution to the fund is Rs. 50 (i.e. Number of units held multiplied by the NAV of the scheme).
FIGURE 3.1 THE FLOW CHART BELOW DESCRIBES BROADLY THE WORKING OF A MUTUAL FUND

CLASSIFICATION OF MUTUAL FUND SCHEMES
AMFI Classification of MF schemesFUND SCHEMES PORTFOLIO OBJECTIVEGrowth and Income High Risk and High ReturnBalanced Moderate Risk and ReturnLiquid and Money Market Fixed ReturnGilt Zero RiskELSS Tax SavingFund of Funds Additional DiversificationETFs Market Driven
ADVANTAGES OF MUTUAL FUND
Professional Management Fund manager undergoes through various research works and has better investment management skills which ensure higher returns to the investor than what he can manage on his own.
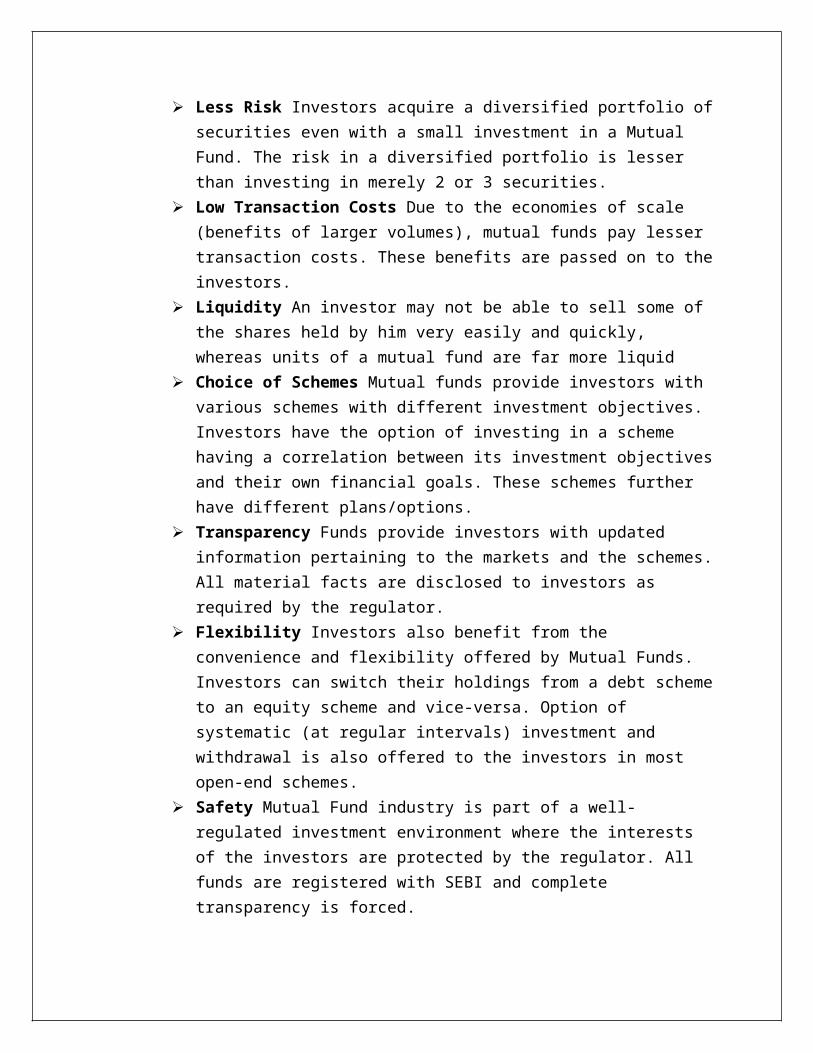
Less Risk Investors acquire a diversified portfolio of securities even with a small investment in a Mutual Fund. The risk in a diversified portfolio is lesser than investing in merely 2 or 3 securities.
Low Transaction Costs Due to the economies of scale (benefits of larger volumes), mutual funds pay lesser transaction costs. These benefits are passed on to the investors.
Liquidity An investor may not be able to sell some of the shares held by him very easily and quickly, whereas units of a mutual fund are far more liquid
Choice of Schemes Mutual funds provide investors with various schemes with different investment objectives. Investors have the option of investing in a scheme having a correlation between its investment objectives and their own financial goals. These schemes further have different plans/options.
Transparency Funds provide investors with updated information pertaining to the markets and the schemes. All material facts are disclosed to investors as required by the regulator.
Flexibility Investors also benefit from the convenience and flexibility offered by Mutual Funds. Investors can switch their holdings from a debt scheme to an equity scheme and vice-versa. Option of systematic (at regular intervals) investment and withdrawal is also offered to the investors in most open-end schemes.

Safety Mutual Fund industry is part of a well-regulated investment environment where the interests of the investors are protected by the regulator. All funds are registered with SEBI and complete transparency is forced.
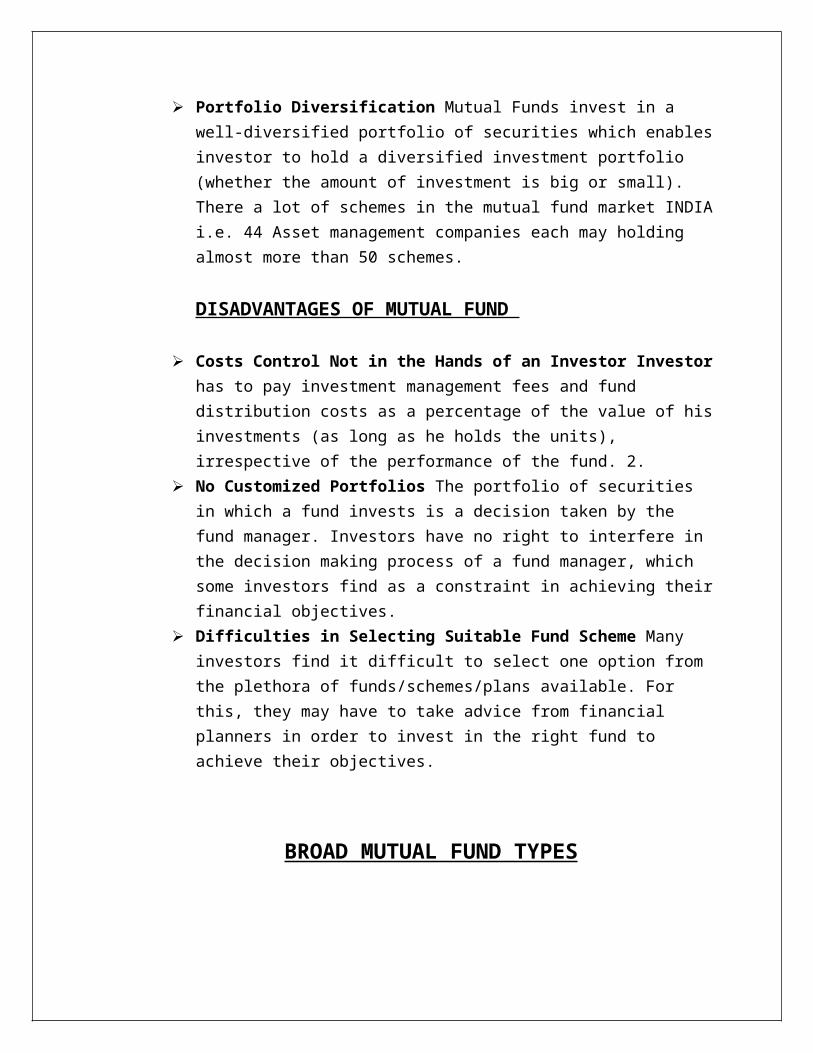
Portfolio Diversification Mutual Funds invest in a well-diversified portfolio of securities which enables investor to hold a diversified investment portfolio (whether the amount of investment is big or small). There a lot of schemes in the mutual fund market INDIA i.e. 44 Asset management companies each may holding almost more than 50 schemes.
DISADVANTAGES OF MUTUAL FUND
Costs Control Not in the Hands of an Investor Investor has to pay investment management fees and fund distribution costs as a percentage of the value of his investments (as long as he holds the units), irrespective of the performance of the fund. 2.
No Customized Portfolios The portfolio of securities in which a fund invests is a decision taken by the fund manager. Investors have no right to interfere in the decision making process of a fund manager, which some investors find as a constraint in achieving their financial objectives.
Difficulties in Selecting Suitable Fund Scheme Many investors find it difficult to select one option from the plethora of funds/schemes/plans available. For this, they may have to take advice from financial planners in order to invest in the right fund to achieve their objectives.
BROAD MUTUAL FUND TYPES

TYPES OF MUTUAL FUNDS
Open-end Funds Fund that can sell and purchase units at any point in time are classified as Open-end Funds. The fund size (corpus) of an open-end fund is variable (keeps changing) because of continuous selling (to investors) and repurchases (from the investors) by the fund. An open-end fund is not required to keep selling new units to the investors at all times but is required to always repurchase, when an investor wants to sell his units. The NAV of an open-end fund is calculated every day.
Closed-end funds Fund that can sell a fixed number of units only during the New Fund Offer (NFO) period are known as Closed-end Funds. The corpus of a Closed-end Fund remains unchanged at all. After the closure of the offer, buying and redemption of units by the investors directly from the Funds is not allowed. However, to protect the interests of the investors, SEBI provides investors with two avenues to liquidate their positions:
1. Closed-end Funds are listed on the stock exchanges where investors can buy/sell units from/to each other. The trading is generally done at a discount to the NAV of the scheme. The NAV of a closed-end fund is computed on a weekly basis. 2. Closed-end Funds may also offer "buy-back of units" to the unit holders. In this case, the corpus of the Fund and its outstanding units do get changed.
Load Funds Mutual Funds incur various expenses on marketing, distribution, advertising, portfolio churning, fund manager's salary etc. Many funds recover these

expenses from the investors in the form of load. These funds are known as Load Funds. A load fund may impose following types of loads on the investors: * Entry Load - Also known as Front-end load, it refers to the load charged to an investor at the time of his entry into a scheme. Entry load is deducted from the investor's contribution amount to the fund. * Exit Load - Also known as Back-end load, these charges are imposed on an investor when he redeems his units (exits from the scheme). Exit load is deducted from the redemption proceeds to an outgoing investor. * Deferred Load - Deferred load is charged to the scheme over a period of time. * Contingent Deferred Sales Charge (CDSS) - In some schemes, the percentage of exit load reduces as the investor stays longer with the fund. This type of load is known as Contingent Deferred Sales Charge.
No-load Funds All those funds that do not charge any of the above mentioned loads are known as No-load Funds.
Tax-exempt Funds Fund that invests in securities free from tax are known as Tax-exempt Funds. All open-end equity oriented funds are exempt from distribution tax (tax for distributing income to investors). Long term capital gains and dividend income in the hands of investors are tax-free. 6. Non-Tax-exempt Funds Fund that invest in taxable securities are known as Non-Tax-exempt Funds. In India, all funds, except open-end equity oriented funds are liable to pay tax on distribution income. Profits arising out of sale of units by an investor within 12 months of purchase are categorized as short-term capital gains, which are taxable. Sale of units of an equity oriented fund is subject to Securities Transaction Tax (STT). STT is deducted from the redemption proceeds to an investor
ACCOUNTING AND VALUATION (PORTFOLIO ANALYSIS TOOLS
Net Asset Value (NAV) The net asset value of the fund is the cumulative market value of the assets fund net of its liabilities. In other words, if the fund is dissolved or liquidated by selling off all the assets in the fund, this is the amount that the shareholders would

collectively own. This gives rise to the concept of net asset value per unit, which is the value represented by the ownership of one unit in the fund.
It is calculated simply by dividing the net asset value of the fund by the number of units. However, most people refer loosely to the NAV per unit as NAV, ignoring the “per unit”. We also abide by the same convention.
Calculation of Net Asset Value
The most important part of the calculation is the valuation of the assets owned by the fund. Once it is calculated, the NAV is simply the net value of assets divided by the number of the units outstanding. The detailed methodology for the calculation of the net asset value is given below:
NAV = Market value of investments + Current assets and other assets+ Accrued income - Current liabilities and other liabilities - Accrued expense
RISK
Every type of investment, including mutual funds, involves risk. Risk refers to the possibility that you will lose money (both principal and any earnings) or fail to make money on an investment. A fund's investment objective and its holdings are influential factors in determining how risky a fund is. Generally speaking, risk and potential return are related. This is the risk/return trade-off. Higher risks are usually taken with the expectation of higher returns at the cost of increased volatility. While a fund with higher risk has the potential for higher return, it also has the greater potential for losses or negative returns. Lonnie L. Bryant and Hao-Chen Liu (2008) investigated that implement various risk measures to analysis the impacts management structure, fund objective, fund market capitalization and other fund level characteristics have on investor wealth. Our evidence indicates that when fund managers manage multiple funds simultaneously, the risk of one of the managed funds is significantly increased, minimizing the inherit benefits of mutual fund stock diversification. Thus, all else equal, the more time that a manager devotes to an individual fund the more likely the fund will reduce its risk exposure. This increased risk exposure of the multiple management structure results in fund misclassification.
RETURN
The annual return on an investment, expressed as a percentage of the total amount invested also called rate of return or the yield of a fixed income security. The interaction of mutual funds flows and security returns in emerging markets. Philippas Nikolaos D., (2006) examined the hypothesis that mutual funds may act as instability factors in financial markets within a VAR framework. Daily data from a period, that the emerging
market of Greece had no particular trend, are used. This empirical evidence suggested that mutual fund flows can be predicted by lagged flows and index returns. He also obtained a negative relationship between index returns and lagged mutual fund flows, and he found no correlation between contemporary flows and Index returns. This analysis implied that mutual fund shareholders are unsophisticated frequently wrong and often worse than informed investors
BETA RATIO / BETA VALUE
A high beta is good or bad depending on the state of the market. If the market sentiments are bullish, i.e., the market is seeing a rise in general, then a high beta stock is better and if the market sentiment is bearish then low beta is preferred.
A beta of 1 indicates that the security's price will move with the market. A beta is less than 1 means that the security will be less volatile than the market. A beta greater than 1 indicates that the security's price will be more volatile than the market.
Every investment involves risk, and it's important to determine how much risk is appropriate for any fund that you are considering. Risk means making less than your planned return or even losing capital. Research by behavioral economists suggests that most people feel twice the pain over a financial loss as they do pleasure in an equivalent gain. Although not exactly ideal, the standard deviation (dispersion around the mean return) is generally accepted as a measure of risk. Unlike the standard deviation, Beta measures the volatility of a fund relative to a benchmark index. Funds of the same type can have significantly different levels of risks. For example, funds that put in the best performances throughout the bull market of the 1990s, such as technology and Internet sector funds, usually are ranked very low in terms of risk-adjusted performance. Put another way, investors were exposed to an extreme level of volatility in return for those stellar returns. A fund with a Beta of higher than 1.0 (1.0 = the benchmark index) would be expected to outperform the market, while one below that figure would likely underperform. But a Beta of greater than 1.0 also means the fund is volatile. In bear markets, the value of these funds may fall much more than the major market indexes.
Beta, a component of Modern Portfolio Theory statistics, is a measure of a fund's sensitivity to market movements. It measures the relationship between a fund's excess return over T-bills and the excess return of the benchmark index. Betas are typically, but not always, calculated over the last 36 months.
MAJOR PLAYERS IN MUTUAL FUNDS INDUSTRY
1. Birla Sun Life Mutual Fund Birla Sun Life Mutual Fund is the joint venture of Aditya Birla
Group and Sun Life Financial. Sun Life Financial is a global organization evolved in 1871 and is
being represented in Canada, the US, the Philippines, Japan, Indonesia and Bermuda apart from
India. Birla Sun Life Mutual Fund follows a conservative long-term approach to investment.
Recently it crossed AUM of Rs.10,000 Crores.
2. Bank of Baroda Mutual Fund or BOB Mutual Fund was setup on October 30, 1992 under
the sponsorship of Bank of Baroda. BOB Asset Management Company Limited is the AMC of
BOB Mutual Fund and was incorporated on November 5, 1992. Deutsche Bank AG is the
custodian.
3. HSBC Mutual Fund HSBC Mutual Fund was setup on May 27, 2002 with HSBC Securities
and Capital Markets (India) Private Limited as the sponsor. The Board of Trustees, HSBC
Mutual Fund acts as the Trustee Company of HSBC Mutual Fund.
4. ING Vysya Mutual Fund ING Vysya Mutual Fund was setup on February 11, 1999 with the
same named Trustee Company. It is a joint venture of Vysya and ING. The AMC, ING
Investment Management (India) Pvt. Ltd. was incorporated on April 6, 1998.
THEORITICAL ASPECTS OF MEASURES OF RISK & RETURN IN MUTUAL FUND SCHEME
Every individual has their own risk taking capacity. Your risk-return profile is your level of risk tolerance. If you invest in a high risk business like a startup firm your risk would be high. There are three types of risk return profiles which you can fall under depending upon your source of funds and the investments you choose to make. They are:
1. Conservative i.e. you take minimal risks ensuring your funds are secure. You prefer investing in post office deposit schemes, bank fixed deposits, government bonds
2. Moderate i.e. you are willing to take some risks and prefer investing in mutual fund schemes.

3. Aggressive i.e. you are willing to take high risks and prefer investing in equity, commodities markets and you may even be speculating for returns.
There is an important investment principle which says the level of your returns depends on the level of risk you take. While you stay invested it is crucial you take necessary measures to manage your risk. Once you invest in any asset class you should monitor your investments and keep yourself updated about various market happenings to avoid any pitfalls. Always check the potential risks when quoted returns are unusually high.
4.1 DRIVERS OF RETURNS IN A SCHEME
The portfolio is the main driver of returns in a mutual fund scheme. The underlying factors are different for each asset class.
EQUITY SCHEMES Securities Analysis Disciplines – Fundamental Analysis and Technical Analysis These are quantitative approaches to securities analysis. As will be appreciated, a passive fund maintains a portfolio that is in line with the index it mirrors. Therefore, a passive fund
1. Earnings per Share (EPS): Net profit after tax ÷ No. of equity shares this tells investors how much profit the company earned for each equity share that they own.
2. Price to Earnings Ratio (P/E Ratio): Market Price ÷ EPS When investors buy shares of a company; they are essentially buying into its future earnings. P/E ratio indicates how much investors in the share market are prepared to pay (to become owners of the company), in relation to the company’s earnings. This ratio is normally calculated based on a projected EPS for a future period (also called forward EPS) A simplistic (but faulty) view is that low P/E means that a share is cheap, and therefore should be bought; the corollary being that high P/E means that a share is expensive, and therefore should be sold. In reality, the P/E may be high because the company’s prospects are indeed good, while another company’s P/E may be low because it is unlikely to replicate its past performance.
3. Book Value per Share: Net Worth ÷ No. of equity shares this is an indicator of how much each share is worth, as per the company’s own books of accounts. The accounts represent a historical perspective, and are a function of various accounting policies adopted by the company.
4. Price to Book Value: Market Price ÷ Book Value per Share An indicator of how much the share market is prepared to pay for each share of the company, as compared to its book value. Such financial parameters are compared across companies, normally within a sector. Accordingly, recommendations are made to buy / hold / sell the shares of the company. As in the case of P/E ratio, most financial indicators cannot be viewed as

stand-alone numbers. They need to be viewed in the context of unique factors underlying each company. The fundamental analyst keeps track of various companies in a sector, and the uniqueness of each company, to ensure that various financial indicators are understood in the right perspective. The discipline of Technical Analysis has a completely different approach. Technical Analysts believe that price behavior of a share, and the volumes traded are a reflection of investor sentiment, which in turn will influence future price of the share.
Both types of analysts swear by their discipline. It is generally agreed that longer term investment decisions are best taken through a fundamental analysis approach, while technical analysis comes in handy for shorter term speculative decisions, including intra-day trading. Even where a fundamental analysis-based decision has been taken on a stock, technical analysis might help decide when to implement the decision i.e. the timing. Investment Styles – Growth and Value Growth investment style entails investing in high growth stocks i.e. stocks of companies that are likely to grow much faster than the economy. Many market players are interested in accumulating such growth stocks. Therefore, valuation of these stocks tends to be on the higher side. Value investment style is an approach of picking up stocks which are valued lower, based on fundamental analysis. The belief is that the market has not appreciated some aspect of the value in a company’s share – and hence it is cheap. When the market recognizes the intrinsic value, then the price would shoot up. Such stocks are also called value stocks.
Since no time frame can be set for the market to recognize the value, value stocks tend to be longer term investments, at times beyond two years. Even then, the market may not recognize it, in which case the investment fails. It is important to note that ‘high valuation’ is not the equivalent of ‘high share price’, just as ‘low valuation’ is not the same as ‘low share price’. For example, how much is the share price as compared to its earnings per share (Price to Earnings Ratio); or how much is the share price as compared to its book value (Price to Book Value Ratio). Thus, a company’s share price may be high, say Rs 100, but still reasonably valued given its earnings; similarly, a company may be seen as over-valued, even when its share price is Rs 5, if it is not matched by a reasonably level of earnings. Investments of a scheme can thus be based on growth, value or a blend of the two styles. In the initial phases of a bull run, growth stocks deliver good returns. Subsequently, when the market heats up, value picks end up being safer. Portfolio building approach – Top down and Bottom up.-
In a top down approach, the portfolio manager decides how to distribute the investible corpus between countries (if it invests in multiple geographies) and sectors. Thereafter, the good stocks within the identified sectors are selected for investment. Thus sector allocation is a key decision. A bottom-up approach on the other hand does not assign too much importance to the country-allocation and sector-allocation. If a stock is good, it is picked for investment. The approach is therefore also called stock picking. Stock

selection is the key decision in this approach; sector allocation is a result of the stock selection decisions. Both approaches have their merit. What is important is that the approach selected should be implemented professionally. Therefore, it can be said that equity returns are a function of sector and stock selection.
DEBT
Investment in a debt security, as in the case of a loan, entails a return in the form of interest (at a pre-specified frequency for a prespecified period), and refund of a pre-specified amount at the end of the pre-specified period. The pre-specified period is also called tenor. At the end of the tenor, the securities are said to mature. The process of repaying the amounts due on maturity is called redemption. Debt securities that are to mature within a year are called money market securities. The return that an investor earns or is likely to earn on a debt security is called its yield. The yield would be a combination of interest paid by the issuer and capital gain (if the proceeds on redemption are higher than the amount invested) or capital loss (if the proceeds on redemption are lower than the amount invested) Debt securities may be issued by Central Government, State Governments, Banks, Financial Institutions, Public Sector Undertakings (PSU), Private Companies, Municipalities etc.
• Securities issued by the Government are called Government Securities or G-Sec or Gilt.
• Treasury Bills are short term debt instruments issued by the Reserve Bank of India on behalf of the Government of India.
• Certificates of Deposit are issued by Banks (for 91 days to 1 year) or Financial Institutions (for 1 to 3 years)
• Commercial Papers are short term securities (up to 1 year) issued by companies.
• Bonds / Debentures are generally issued for tenors beyond a year.
Governments and public sector companies tend to issue bonds, while private sector companies issue debentures. Since the government is unlikely to default on its obligations, Gilts are viewed as safe. The yield on Gilt is generally the lowest in the market. Since non- Government issuers can default, they tend to offer higher yields. The difference between the yield on Gilt and the yield on a non-Government Debt security is called its yield spread.
The possibility of a non-government issuer defaulting on a debt security i.e. its credit risk, is measured by Credit Rating companies like CRISIL, ICRA, CARE and Fitch. They assign different symbols to indicate the credit risk in a debt security. For instance ‘AAA’ is CRISIL’s indicator of highest safety in a debenture. Higher the credit risk, higher is likely to be the yield on the debt security. The interest rate payable on a debt security may be specified
as a fixed rate, say 6%. Alternatively, it may be a floating rate i.e. a rate linked to some other rate that may be prevailing in the market, say the rate that is applicable to Gilt. Interest rates on floating rate securities (also called floaters) are specified as a “Base + Spread”. This means that the interest rate that is payable on the debt security would be 2% above whatever is the rate prevailing in the market for Government Securities of 5-year maturity. The returns in a debt portfolio are largely driven by interest rates and yield spreads. Interest Rates suppose an investor has invested in a debt security that yields a return of 8%. Subsequently, yields in the market for similar securities rise to 9%. It stands to reason that the security, which was bought at 8% yield, is no longer such an attractive investment. It will therefore lose value. Conversely, if the yields in the market go down, the debt security will gain value. Thus, there is an inverse relationship between yields and value of such debt securities which offer a fixed rate of interest. A security of longer maturity would fluctuate a lot more, as compared to short tenor securities. Debt analyst’s work with a related concept called modified duration to assess how much a debt security is likely to fluctuate in response to changes in interest rates. If the portfolio manager expects interest rates to rise, then the portfolio is switched towards a higher proportion of floating rate instruments; or fixed rate instruments of shorter tenor. On the other hand, if the expectation is that interest rates would fall, then the manager increases the exposure to longer term fixed rate debt securities. The calls that a fund manager takes on likely interest rate scenario are therefore a key determinant of the returns in a debt fund – unlike equity, where the calls on sectors and stocks are important. Yield Spreads Suppose an investor has invested in the debt security of a company. Subsequently, its credit rating improves. The market will now be prepared to accept a lower yield spread. Correspondingly, the value of the debt security will increase in the market. A debt portfolio manager explores opportunities to earn gains by anticipating changes in credit quality, and changes in yield spreads between different market benchmarks in the market place.
INTEREST RATES
When money is cheap and easily available, more people buy real estate. This pushes up real estate values. Rise in interest rates therefore softens the real estate market. The behavior of real estate is also a function of the nature of real estate viz. residential or commercial; industrial, infrastructural, warehouse, hotel or retail. Similarly, a lot of innovation is possible in structuring the real estate exposure. Real estate analysts are experts in assessing the future direction of different kinds of real estate, and structuring exposure to them. The portfolio is the most important driver of returns in a scheme. The factors that drive the return of some of the asset classes were discussed here. The factors that cause fluctuation in the returns of these asset classes, and the schemes that invest in them, are discussed in a later section on risk drivers.
RISK-RETURNS STRUCTURE OF SCHEMES
TYPES OF RISK AVAILABLE IN MUTUAL FUNDS
Inflation risk
Changing interest rates affect both equities and bonds in many ways. Investors are reminded that “predicting” which way rates will go is rarely successful. A diversified portfolio can help in offsetting these changes.
Effect of loss of key professional and inability to adopt
An industries’ key asset is often the personnel who run the business i.e. intellectual properties of the key employees of the respective companies. Given the ever-changing complexion of few industries and the high obsolescence levels, availability of qualified,

trained and motivated personnel is very critical for the success of industries in few sectors. It is, therefore, necessary to attract key personnel and also to retain them to meet the changing environment and challenges all investments involve some form of risk, which should be evaluated them potential Rewards when an investment is selected.
Managing risk
At times the prices or yields of all the securities in a particular market rises or falls due to broad outside influences. When this happens, the Mutual prices of an outstanding, highly profitable company and a fledgling corporation may be affected. This change in price is due to “market risk”.
Interest rate risk
It referred to as “loss of purchasing power”. Whenever inflation sprints forward faster than the earnings on your investment, you run the risk that you will actually be able to buy less, not more. Inflation risk also occurs when prices rise faster than your returns.
Credit risk
The sector offers. Failure or inability to attract/retain such qualified key personnel may impact the prospects of the companies in the particular sector in which the fund invests.
Exchange risks
A number of companies generate revenues in foreign currencies and may have investments or expenses also denominated in foreign currencies. Changes in exchange rates may, therefore, have a positive or negative impact on companies which in turn would have an effect on the investment of the fund.
Investment risks
The sectorial fund schemes, investments will be predominantly in equities of select companies in the particular sectors. Accordingly, the NAV of the schemes are linked to the equity performance of such companies and may be more volatile than a more diversified portfolio of equities.
Changes in government policy
Changes in Government policy especially in regard to the tax benefits may impact the business prospects of the companies leading to an impact on the investments made by the fund.
RISK AVAILABLE IN EQUITY, DEBT & BALANCED FUNDS
Risk in Equity Funds
Generic
Equity markets seek to reflect the value in the real economy. In performing this role, the following significant risks come up:
The real economy goes through cycles. For a few years until 2008, the economy was booming. Then things started changing. 2009 was gloomy. However, during 2010 an economic recovery is being seen.
In the long run, equity markets are a good barometer of the real economy – but in the short run, markets can get over-optimistic or over-pessimistic, leading to spells of greed and fear. Equity markets therefore tend to be volatile. Portfolio Specific The nature of the portfolio influences scheme risk as follows:
Sector funds suffer from concentration risk - the entire exposure is to a single sector. If that sector does poorly, then the scheme returns are seriously affected. Diversified equity funds, on the other hand, have exposure to multiple sectors. Thus, even if a few sectors perform poorly, other better performing sectors can make up. Diversified equity funds are therefore less risky than sector funds.
Thematic funds are a variation of sector funds. Here the investment is as per a theme, say, and infrastructure. Multiple sectors, such as power, transportation, cement, steel, contracting and real estate are connected to infrastructure. Thus, a thematic fund tends to have wider exposure than a sector fund, but a narrower exposure than a diversified fund. Therefore, thematic funds are less risky than sector funds, but riskier than diversified equity funds.
Mid cap funds invest in mid cap stocks, which are less liquid and less researched in the market, than the frontline stocks. Therefore, the liquidity risk is high in such portfolios. Further, since they are intrinsically not as strong as the frontline stocks, they become riskier during periods of economic turmoil.
Contra funds take positions that are contrary to the market. Such an investment style has a high risk of misjudgments.
Dividend yield funds invest in shares whose prices fluctuate less, but offer attractive returns in the form of dividend. Such funds offer equity exposure with lower downside.

Arbitrage funds are categorized as equity funds because they invest in equity. In reality, the risks are arbitraged (i.e. cancelled out), normally between the cash market and the F&O market. Therefore, the risk in this category of funds turns out to be the lowest among equity funds – even lower than diversified equity funds. The returns too are lower – more in line with money market returns, rather than equity market returns. However, one should not forget the basis risk in an arbitrage fund – the risk that both cash and F&O position on a company cannot be reversed at the same time. During the time gap between unwinding of the two positions, the market can move adverse to the scheme.
Risk in Debt Funds
Generic
Unlike equity, debt securities are repayable on maturity. Thus, whatever the imperfections in the market, a solvent issuer will still repay the amount promised, on maturity. This assured value on maturity makes debt a lot safer than equity. Despite the assured value on maturity, debt securities fluctuate in value, with changes in yield in the overall market. The interest rates in the economy are influenced by factors beyond the control of any single entity. Policies of the government and RBI are unpredictable, and these too influence interest rates. A fund manager taking a wrong call on the direction of interest rates can seriously affect the scheme performance.
The debt market, especially the non-government segment, is not as vibrant and liquid as the equity market. Therefore, there is the possibility of not finding a buyer for the securities held. In the past, when the markets turned illiquid, RBI has stepped in to make it easier for mutual funds to operate. Further, SEBI has laid down detailed portfolio valuation guidelines to enhance the transparency of NAV.
Portfolio Specific
Short maturity securities suffer lesser fluctuation in value, as compared to the ones with longer tenor. Therefore, liquid schemes, which invest in securities of up to 91 days maturity, have the lowest risk amongst all kinds of schemes. Even gilt schemes, which invest in only government securities, have higher risk than liquid schemes because their NAV can fluctuate a lot more, on account of changes in yield in the market. Greater the proportion of longer maturity securities in the portfolio, higher would be the fluctuation in NAV. In the interim, the value of these securities will fluctuate in line with the market – and therefore, the scheme’s NAV too will fluctuate. If the FMP is structured on the basis of investment in non-government paper, then the credit risk is an issue. While an equity share is an equity share, several variants of debt securities are possible. Advanced computing technology makes it possible to ‘slice and dice’ debt securities and create complex structures in innovative ways. In pursuit of innovation, instruments are created and traded, without the intellectual rigour that has improved our understanding of traditional debt instruments. In the case of specific structures like securitized debt, it is not possible for the
investor to study the debtors whose obligations support the securitization. A pure capital guaranteed scheme is one where the guarantee comes out of sovereign debt i.e. government securities, which mature to the requisite value on or before the closure of the scheme. Schemes where the capital guarantee is based on investment in non-sovereign debt, even if it is an AAA-rated portfolio, have a credit risk. Therefore, the capital guarantee cannot be taken for granted. There are therefore in the nature of capital protection oriented schemes rather than capital guaranteed schemes.
Risk in Balanced Funds
Balanced funds invest in a mix of debt and equity. It is rare for both debt and equity markets to f are poorly at the same time. Since the performance of the scheme is linked to the performance of these two distinct asset classes, the risk in the scheme is reduced.
Monthly Income Plan is a balanced fund that seeks to combine a large debt portfolio with an yield-kicker in the form of an equity component. In such a structure, it is possible that losses in the equity component eat into the profits in the debt component of the portfolio. If the scheme has no profits to distribute, then no dividend will be declared. Thus, the investor may not get the monthly income implicit in the name only Income Plan. Some balanced schemes offer significant asset allocation flexibility to the fund manager. They can switch a large part of their portfolio between debt and equity, depending on their view on the respective markets. This kind of scheme is called flexible asset allocation scheme. These are risky for investors, because there is always the risk that the fund manager takes a wrong asset allocation call. Further, investors do not know whether they are investing in a debt scheme or an equity scheme. Therefore, investors do not have clarity on whether to treat it as equity or debt, in the asset allocation for their financial plan.
MEASURES OF RETURNS
SIMPLE RETURN
Whatever the nature of a mutual fund scheme, its value is reflected in the NAV. Suppose you invested in a scheme, when its NAV was Rs 12. Later, you found that the NAV has grown to Rs 15. How much is your return? The Simple Return can be calculated with the following formula: i.e. 25%
(Later value-Initial Value)*100/Initial Value
(Rs15-Rs12)*100/Rs12
ANNUALIZED RETURN
Two investment options have indicated their returns since inception as 5% and 3% respectively. If the first investment was in existence for 6 months, and the second for 4 months, then the two returns are obviously not comparable. Annualisation helps us compare the returns of two different time periods.
SIMPLE RETURN*12/Period of simple return (in months)
COMPANY PROFILE
Identity
With 25 years of rich experience in fund management, we at SBI Funds Management Pvt. Ltd. bring forward our expertise by consistently delivering value to our investors. We have a strong and proud lineage that traces back to the State Bank of India (SBI) - India's largest bank. We are a Joint Venture between SBI and AMUNDI (France), one of the world's leading fund management companies.
With our network of over 222 points of acceptance across India, we deliver value and nurture the trust of our vast and varied family of investors.
Excellence has no substitute. And to ensure excellence right from the first stage of product development to the post-investment stage, we are ably guided by our philosophy of ‘growth through innovation’ and our stable investment policies. This dedication is what helps our customers achieve their financial objectives.
Vision
“To be the most preferred and the largest fund house for all asset classes, with a consistent track record of excellent returns and best standards in customer service, product innovation, technology and HR practices.”
Services
Mutual Funds
Investors are our priority. Our mission has been to establish Mutual Funds as a viable investment option to the masses in the country. Working towards it, we developed innovative, need-specific

products and educated the investors about the added benefits of investing in capital markets via Mutual Funds.
Today, we have been actively managing our investor's assets not only through our investment expertise in domestic mutual funds, but also offshore funds and portfolio management advisory services for institutional investors.
This makes us one of the largest investment management firms in India, managing investment mandates of over 5.4 million investors.
Portfolio Management and Advisory Services
SBI Funds Management has emerged as one of the largest player in India advising various financial institutions, pension funds, and local and international asset management companies.
We have excelled by understanding our investor's requirements and terms of risk / return expectations, based on which we suggest customized asset portfolio recommendations. We also provide an integrated end-to-end customized asset management solution for institutions in terms of advisory service, discretionary and non-discretionary portfolio management services.
Off shore Funds
SBI Funds Management has been successfully managing and advising India's dedicated offshore funds since 1988. SBI Funds Management was the 1st bank sponsored asset management company fund to launch an offshore fund called 'SBI Resurgent India Opportunities Fund' with an objective to provide our investors with opportunities for long-term growth in capital, through well-researched investments in a diversified basket of stocks of Indian Companies
REVIEW OF LITERATURE
Friend, et al., (1962) made an extensive and systematic study of 152 mutual funds found that mutual fund schemes earned an average annual return of 12.4 percent, while their composite benchmark earned a return of 12.6 percent. Their alpha was negative with 20 basis points. Overall results did not suggest widespread inefficiency in the industry. Comparison of fund returns with turnover and expense categories did not reveal a strong relationship
Irwin, Brown, FE (1965) analyzed issues relating to investment policy, portfolio turnover rate, performance of mutual funds and its impact on the stock markets. They identified that mutual funds had a significant impact on the price movement in the stock market. They concluded that, on an average, funds did not perform better than the composite markets and there was no persistent relationship between portfolio turnover and fund performance

Treynor (1965) used ‘characteristic line’ for relating expected rate of return of a fund to the rate of return of a suitable market average. He coined a fund performance measure taking investment risk into account. Further, to deal with a portfolio, ‘portfolio-possibility line’ was used to relate expected return to the portfolio owner’s risk preference.
Sharpe, William F (1966) developed a composite measure of return and risk. He evaluated 34 open-end mutual funds for the period 1944-63. Reward to variability ratio for each scheme was significantly less than DJIA (Dow Jones Industrial Average) and ranged from 0.43 to 0.78. Expense ratio was inversely related with the fund performance, as correlation coefficient was 0.0505. The results depicted that good performance was associated with low expense ratio and not with the size. Sample schemes showed consistency in risk measure.
Treynor and Mazuy (1966) evaluated the performance of 57 fund managers in terms of their market timing abilities and found that, fund managers had not successfully outguessed the market. The results suggested that, investors were completely dependent on fluctuations in the market. Improvement in the rates of return was due to the fund managers’ ability to identify under-priced industries and companies. The study adopted Treynor’s (1965) methodology for reviewing the performance of mutual funds.
Jensen (1968 ) developed a composite portfolio evaluation technique concerning risk-adjusted returns. He evaluated the ability of 115 fund managers in selecting securities during the period 1945-66. Analysis of net returns indicated that, 39 funds had above average returns, while 76 funds yielded abnormally poor returns. Using gross returns, 48 funds showed above average results and 67 funds below average results. Jensen concluded that, there was very little evidence that funds were able to 22 perform significantly better than expected as fund managers were not able to forecast securities price movements.
Fama (1972) developed methods to distinguish observed return due to the ability to pick up the best securities at a given level of risk from that of predictions of price movements in the market. He introduced a multiperiod model allowing evaluation on a period-by-period and on a cumulative basis. He concluded that, return on a portfolio constitutes of return for security selection and return for bearing risk. His contributions combined the concepts from modern theories of portfolio selection and capital market equilibrium with more traditional concepts of good portfolio management
Klemosky (1973) analyzed investment performance of 40 funds based on quarterly returns during the period 1966-71. He acknowledged that, biases in Sharpe, Treynor, and Jensen’s measures, could be removed by using mean absolute deviation and semi-standard deviation as risk surrogates compared to the composite measures derived from the CAPM (Capital Asset Pricing Modal).
Gupta (1974) evaluated the performance of mutual fund industry for the period 1962-71 using Sharpe, Treynor, and Jensen models. All the funds covered under the study outperformed the
market irrespective of the choice of market index. The results indicated that all the three models provided identical results. Return per unit of risk varied with the level of volatility assumed and he concluded that, funds with higher volatility exhibited superior performance.
Gupta Ramesh (1989) evaluated fund performance in India comparing the returns earned by schemes of similar risk and similar constraints. An explicit risk-return relationship was developed to make comparison across funds with different risk levels. His study decomposed total return into return from investors risk, return from managers’ risk and target risk
RESEARCH METHODOLOGY
OBJECTIVES OF THE STUDY
Part-I: Primary Objective
Customers Perspective : (1) To analyze the Risk related to investment in mutual fund
(2) To analyze the Return
Company Perspective : (1) To analyze the Risks associated with mutual fund
(2) To analyze the Return.
Part-II: Secondary Objective
To know the mutual fund Market
To know the satisfaction level and loyalty of customers
To analyze the factors for covering Risk from mutual fund industry.
1.3 JUSTIFICATION FOR THE PROPOSED STUDY
Practical Utility of this study is divided in three parts:
Part- I: For Company

This study will help company in understanding customer’s responses for their company
and services. Moreover this study will help company in attaining the needs and
requirement of their customers.
Part- II: For Customers
This study will help customers in knowing more about their company that where they
invest their money.
Part-III: For Researcher
This study helped me in understanding the mutual fund market specially SBI Mutual Fund procedure and market. I was exposed to the corporate culture and working environment of corporate.
DATABASE
RESEARCH DESIGN:
Research design for the present study was descriptive. Descriptive study with regard to Mutual
fund customers and employees’ preferences and experiences was undertaken using structured
questionnaires. Separate questionnaires were prepared for mutual fund customers as well as for
the Employees of the Company.
Also, the working of mutual fund market was studied by reference to secondary data and
collecting data using unstructured interviews from customers and employees.
SOURCES OF DATA COLLECTION:
Both primary and secondary sources were used for the purpose of data collection.

Primary Data- First hand data was collected from employees of branches of Jaipur and customers
who daily walked in the branch using questionnaire.
Secondary Data- Secondary data pertaining to research work was collected from:
Literature pertaining to research work done
Company Brochure
Books
Internet.
SAMPLE SIZE AND SAMPLING TECHNIQUE:
Universe : customers who walk in branches and employees of SBI in Jaipur
Sample Size- The sample size for the study was 100 customers of SBI Mutual Fund and 100
employees of SBI.
Sampling Method- Sampling was done on the basis of purposive sampling method.
Tools of data collection :
Two sets of Questionnaires consisting of questions i.e. questions was framed separately for both
employees and customers.
ANALYSIS TOOLS AND TECHNIQUES: Analysis Tools- data was analyzed used
graphical representation, percentage analysis, t test and correlation.
LIMITATIONS OF THE STUDY
Possibility of error in data collection because many of investors may have not given actual answers of my questionnaire.
Small sample size decreases the generalizability. Some respondents were reluctant to divulge personal information which can affect
the validity of all responses. The research is confined to limited geographical part of Jaipur.
Part–I : ANALYSIS OF RESPONSES OF EMPLOYEES ON
RISK ,RETURN AND CUSTOMER SATISFATION TOWARDS MUTUAL
FUND
Q. Gender of the Respondents/ Employees working in SBI Mutual Fund?
Table-
Gender of Respondents Male Female
No. of Responses 58 42
58%
42%
Male
Female
INTERPRETATION: Most of the employees are Male i.e. 58% and 42% are female out of 100 employees.
Majority is of Male.
Q. Age of Respondents?
Gender of Respondents
Table
Age of Respondents
15-25 26-37 38-49 Above 50
Total Responses 20 36 33 11
Total % of Responses
20% 36% 33% 11%
15-25 26-37 38-49 Above 500%
5%
10%
15%
20%
25%
30%
35%
40%
AGE
AGE
INTERPRETATION: Majority of employees is between 26-37 age and because of that they can understand and convince the customers easily.
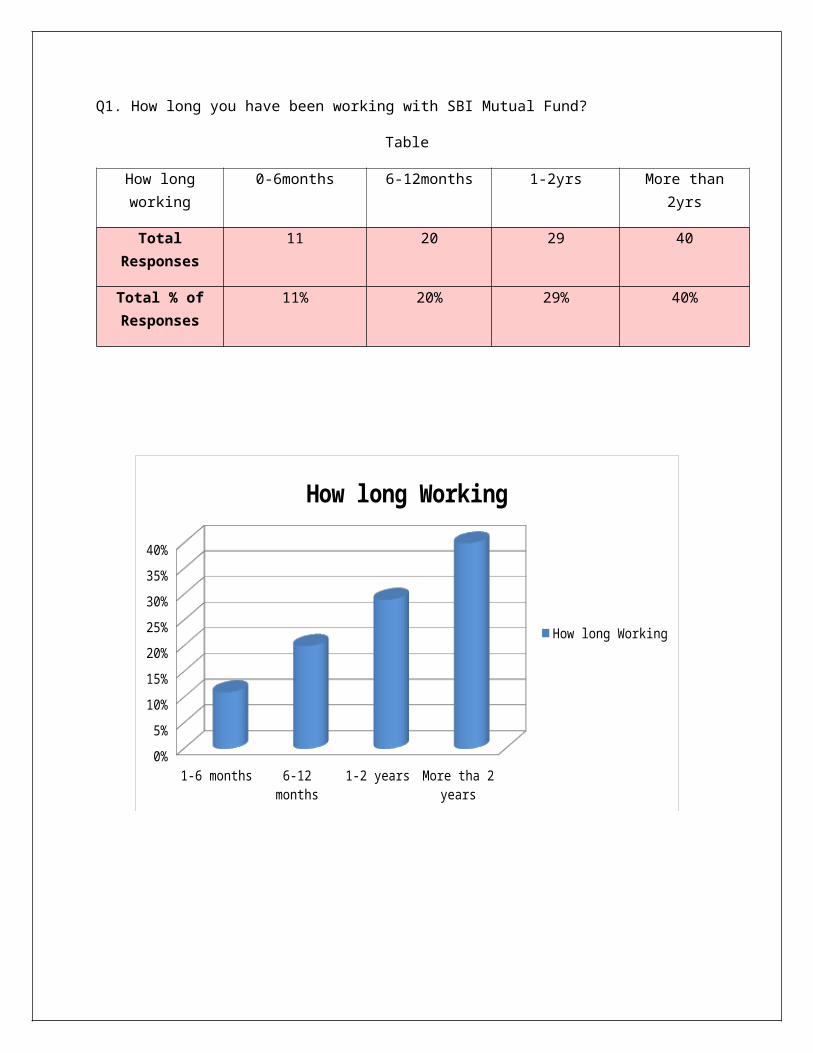
Q1. How long you have been working with SBI Mutual Fund?
Age of Respondents

Table
How long working 0-6months 6-12months 1-2yrs More than 2yrs
Total Responses 11 20 29 40
Total % of Responses
11% 20% 29% 40%
1-6 months 6-12 months 1-2 years More tha 2 years0%
5%
10%
15%
20%
25%
30%
35%
40%
How long Working
How long Working
INTERPRETATION: Majority of employees is having experience more than 2 years.
Q2. What kinds of customers are mostly associated with SBI Mutual Fund?
Kinds of customers
associated
Government
employees
Businessmen Professionals
Total Responses 21 50 29
Total % of Responses 21% 50% 29%
Government Employees Businessman Professionals0%
5%
10%
15%
20%
25%
30%
35%
40%
45%
50%
Customers
Customers
Fig.
INTERPRETATION: Majority of customers are businessman and government employees are very much less in number therefore company should launches such schemes which attract the government employees also.
Q3. In which scheme does the customer invest mostly?
Table
Which scheme
customer invest mostly
Balanced fund Sectorial fund Tax gain fund Equity Fund
Total Responses 25 16 26 33
Total % of Responses 25% 16% 26% 33%
25%
16%
26%
33%
Balanced fund Sectorial fund Tax gain fund Equity Fund
INTERPRETATION: Mostly customers invest in equity fund because it gives better
return as compare to other fund.
Q4.Which fund is more risky?
Which scheme customer invest mostly
Table
Which fund is Risky Equity Fund Sectorial Fund Any Other
Total Responses 27 51 22
Total % of Responses 27% 51% 22%
27%
51%
22%
Equity Fund Sectorial Fund Any Other
INTERPRETATION: Sectorial fund is more risky as compare to other funds because in
this diversification feature of mutual fund does not apply because in this the whole money is invest in particular sector.
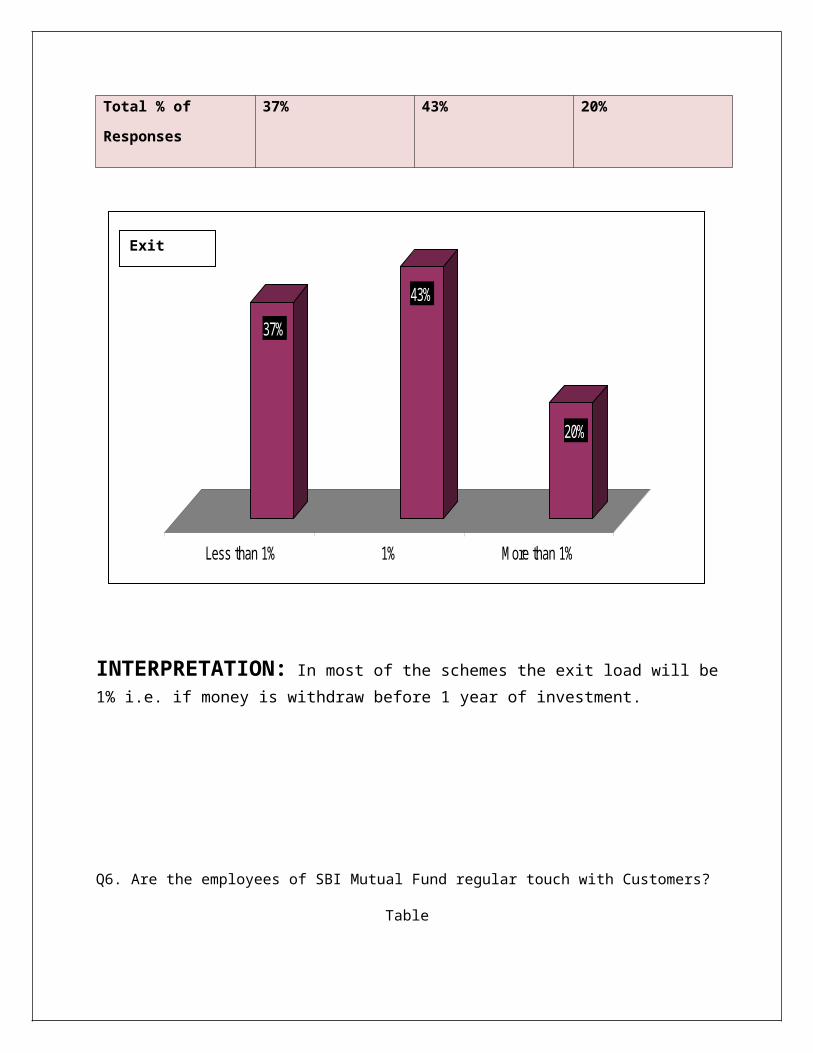
Q5.How much exit load will be there in the schemes?
Which fund is Risky

Table
Exit Load Less than 1% 1% More than 1%
Total Responses 37 43 20
Total % of Responses 37% 43% 20%
37%
43%
20%
Less than 1% 1% More than 1%
INTERPRETATION: In most of the schemes the exit load will be 1% i.e. if money is
withdraw before 1 year of investment.
Q6. Are the employees of SBI Mutual Fund regular touch with Customers?
Exit Load
Table
Regular Touch with Customers Yes No
Total No. of Responses 91 9
Total % of Responses 91% 9%
91%
9%
Yes
No
INTERPRETATION: Majority of the employees is regular touch with their customers
and only 9% say that they are not regular touch with their customers.
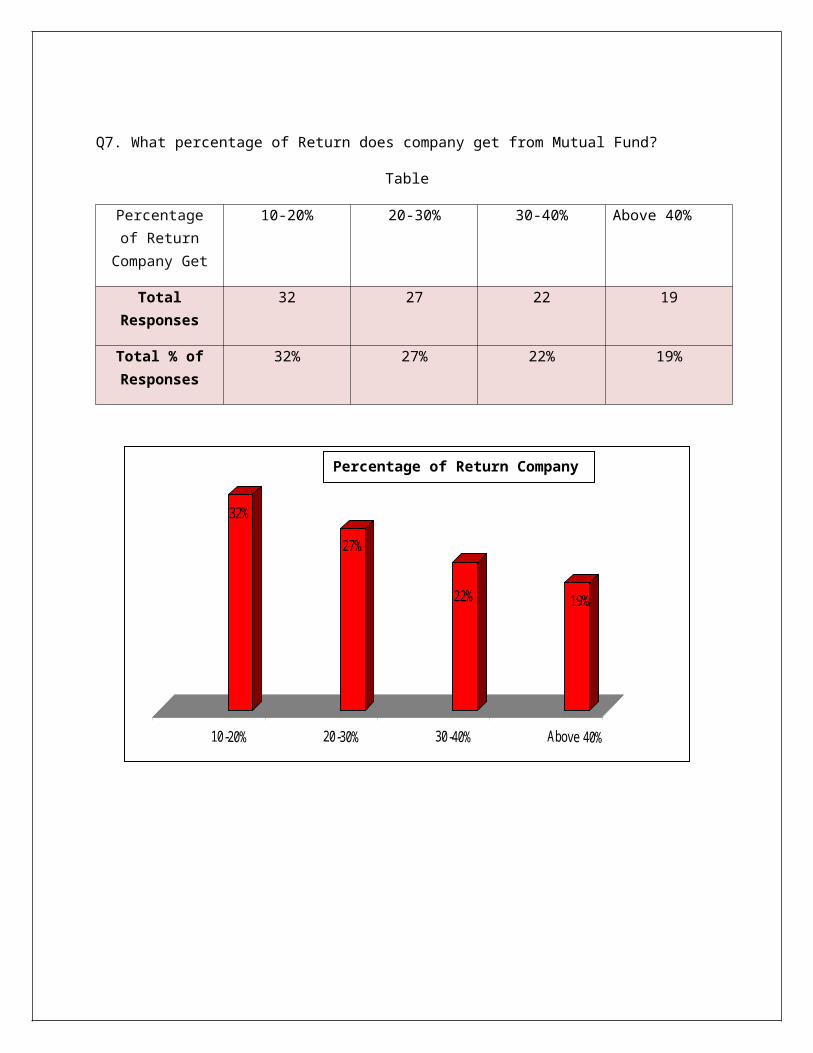
Q7. What percentage of Return does company get from Mutual Fund?
Regular Touch With Customers

Table
Percentage of Return Company
Get
10-20% 20-30% 30-40% Above 40%
Total Responses 32 27 22 19
Total % of Responses
32% 27% 22% 19%
32%
27%
22% 19%
INTERPRETATION: Majority of them get the return between 10% to 20%
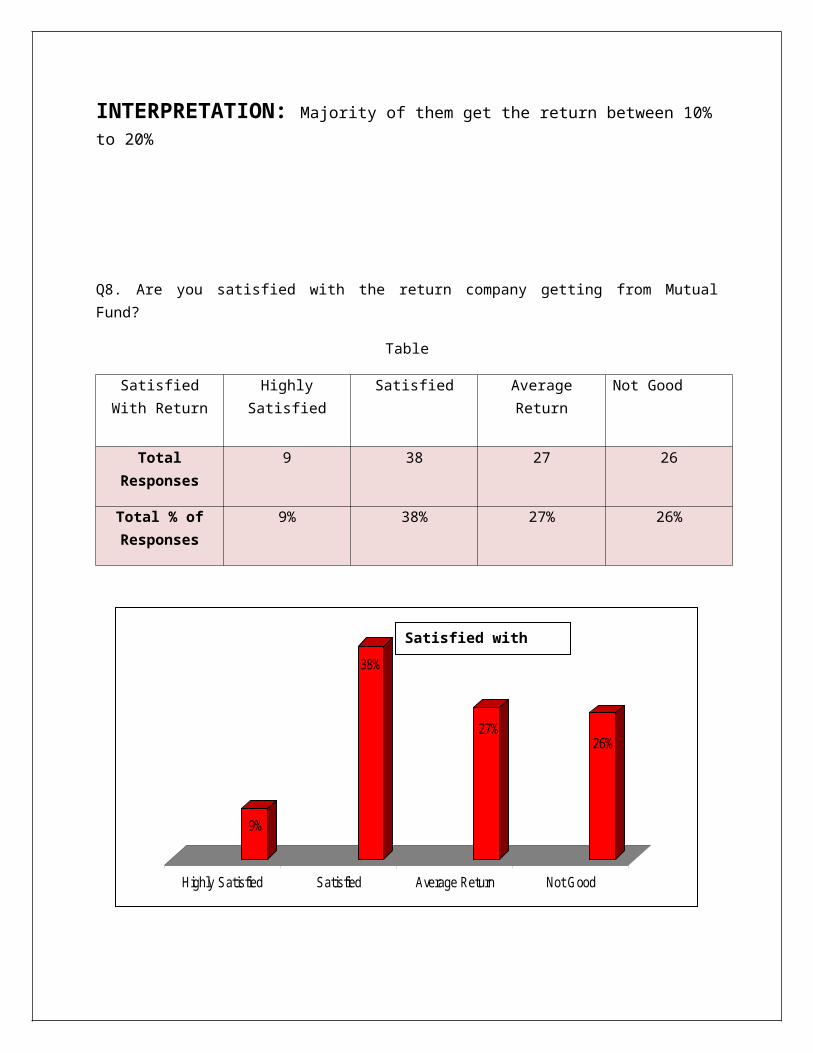
Q8. Are you satisfied with the return company getting from Mutual Fund?
Percentage of Return Company Get
Table
Satisfied With Return
Highly Satisfied Satisfied Average Return Not Good
Total Responses 9 38 27 26
Total % of Responses
9% 38% 27% 26%
9%
38%
27%26%
Highly Satisfied Satisfied Average Return Not Good
INTERPRETATION: 38% are satisfied with the return that comes from mutual fund
but only 9% are highly satisfied.
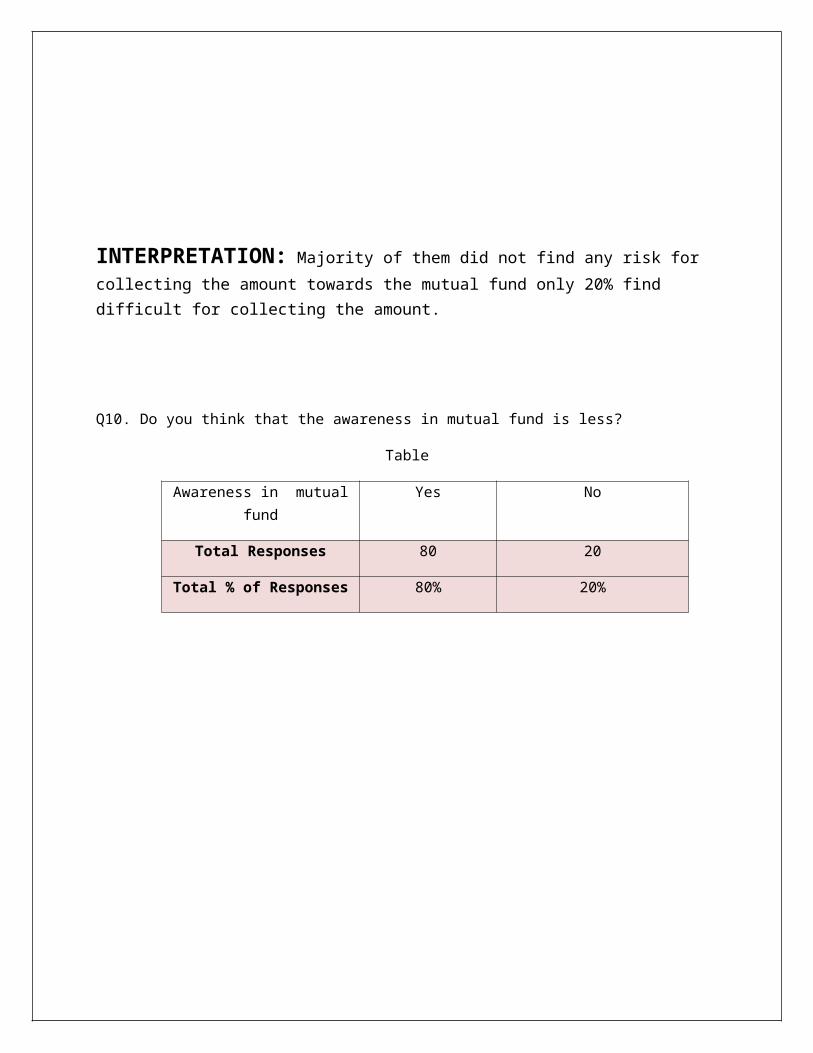
Q9.There is any risk for collecting the amount from investors?
Satisfied with Return

Risk for Collecting Yes No
Total No. of Responses 20 80
Total % of Responses 20% 80%
20%
80%
Yes
No
INTERPRETATION: Majority of them did not find any risk for collecting the amount
towards the mutual fund only 20% find difficult for collecting the amount.
Q10. Do you think that the awareness in mutual fund is less?
Table
Risk for Collecting

Awareness in mutual fund Yes No
Total Responses 80 20
Total % of Responses 80% 20%
YES NO0%
10%
20%
30%
40%
50%
60%
70%
80%
AWARENESS
AWARENESS
INTERPRETATION:
Part–II : ANALYSIS OF RESPONSES OF CUSTOMERS ON
RISK ,RETURN AND CUSTOMER SATISFATION TOWARDS MUTUAL
FUND
Q. Gender of the Respondents/ Employees working in SBI Mutual Fund?
Table-
Gender of Respondents Male Female
No. of Responses 59 41
59%
41%
Male Female
Gender of Respondents
Q. Age of Respondents?

Table
Age of Respondents
15-25 26-37 38-49 Above 50
Total Responses 35 37 15 13
Total % of Responses
35% 37% 15% 13%
15-25 26-37 38-49 Above 500%
5%
10%
15%
20%
25%
30%
35%
40%
AGE
AGE
Q. What is the Occupation of the Respondent?
Table
Age of Respondents

Occupation
of Customers
Service Professionals Business
class
Students Retired
Total
Responses
31 20 21 20 8
Total % of
Responses
31% 20% 21% 20% 8%
31%
20%21%
20%8%
ServiceProfessionalsBusiness classStudentsRetired
Occupation
Q. Income of the Respondent?
Table-
Monthly Income Below 20,000 20,000-40,000 40,000-60,000
Total Responses 11 54 35
Total % of
Responses
11% 54% 35%
Income of the Respondent

Below 20,000 20,000-40,000 40,000-60,000
11%
54%
35%
Series1Series2Series3
Q1.In which kind of mutual fund you would like to invest?

Kind of mutual fund like to invest Public Private
Total Responses 53 47
Total % of Responses 53% 47%
53%
47%
PublicPrivate
Q2. Which feature of mutual fund allure you the most?
Kind of mutual fund like to invest

Table
Feature of mutual fund
Diversification Better return Tax Benefit Any other
Total Responses 20 32 28 20Total % of Responses
20% 32% 28% 20%
Diversification Better Return Tax Benefit Any Other0%
5%
10%
15%
20%
25%
30%
35%
Feature of Mutual Fund
Feature of Mutual Fund
Feature of mutual fund
Q3. What do you look before investing in a particular mutual fund scheme?
Table
Look Before Investing
Past Performance (NAV)
Ratings (by CRISIL, ICRA, Etc.)
Asset Management Companies
(AMC)
Expert Advise
Total Responses 33 34 9 24Total % of Responses
33% 34% 9% 24%
33%
34%
9%
24%
Past Performance (NAV)Ratings (by CRISIL, ICRA, Etc.)Asset Management Companies (AMC)Expert Advise
Look Before Investing
Q4. Your investment horizon in investing in mutual fund?

Table
Investment Horizon Short-term Medium term Long term
Total Responses 25 24 51Total % of Responses
25% 24% 51%
Short-term Medium term Long term
25% 24%
51%
Q5. While investing your money which factor do you prefer?
Investment Horizon

Table
Factor Do You Prefer
Liquidity Low risk High return Trust
Total Responses 27 20 30 23Total % of Responses
27% 20% 30% 23%
Liquidity Low risk High return Trust
27%
20%
30%
23%
Q6.How would you like to receive the return every year?
Factor Do You Prefer

Table
Like To Receive Return Dividend payout Dividend re-investment
Growth in NAV
Total Responses 24 44 32Total % of Responses
24% 44% 32%
Dividend payout Dividend re-investment Growth in NAV
24%
44%
32%
Q7. Do you know what is current NAV (Net Asset Value) of your plan?
Table
Like To Receive Return

Current NAV Yes No
Total Responses 75 25Total % of Responses 75% 25%
75%
25%
YesNo
Q8. What do you feel about services provided by SBI in terms of Mutual Fund?
Table
Current NAV
Services Provided Excellent Good Satisfactory Bad
Total Responses 48 28 13 11Total % of Responses
48% 28% 13% 11%
Excellent Good Satisfactory Bad
48%
28%
13%11%
Q9. What do you think about the transparency level of your account?
Table
Services Provided

Transparency Level
Excellent Good Satisfactory Bad
Total Responses 65 18 13 4Total % of Responses
65% 18% 13% 4%
Excellent Good Satisfactory Bad
65%
18%13%
4%
Q10. Other than SBI in which company you prefer to invest?
Table
Preferences Birla Sun Life HDFC Mutual Fund Others
Total Responses 30 40 30Total % of Responses 30% 40% 30%
[Type a quote from the document or the summary of an interesting point. You can position the text box anywhere in the document. Use the Drawing Tools tab to change the formatting of the pull quote text box.]
Transparency Level
30%
40%
30%
PREFERENCESBirla Sun Life HDFC Mutual Fund OTHERS
INTERPRETATION: 84% are satisfied after investment in SBI mutual fund
Only 16% are not satisfied
CONCLUSION: Majority of them are satisfied after investment in SBI and from these we can conclude that they are happy with the return from the company.
Q11. How much return do you expect from your investment?
Table
Return Expect 5% to 10% 10% to 20% More than 20%
Total Responses 11 41 48Total % of Responses
11% 41% 48%
5% to 10% 10% to 20% More than 20%
11%
41%
48%
Q12. How would you like to invest your money in mutual fund?
Table
Like to Invest The Money One Time Investment SIP
Total Responses 9 91Total % of Responses 9% 91%
0.09
0.91
One Time InvestmentSIP
Q13. Are you satisfied with the return from your investment?
Table
Return Expect
Like to Invest The Money

Satisfied With The Return Yes No
Total Responses 65 35Total % of Responses 65% 35%
65%
35%
YesNO
Q14. Which fund would you find more risky?
Table
Find More Risky Sectorial fund Equity fund Balanced FundTotal Responses 49 38 13
Total % of Responses
49% 38% 13%
Satisfied With The Return
Sectorial Fund Equity Fund Bakanced Fund0
5
10
15
20
25
30
35
40
45
50
Find More Risky
Find More Risky
CONCLUSION
The Indian mutual funds industry has transformed totally for good since last decade and has shown growth and potential. Though the Asset under Management and number of schemes has increased significantly, but it is yet to be a household product, and needs to cover the retail segment effectively. Moreover, there are still many remote and potential areas which lack the required knowledge and infrastructure of mutual funds.
Mutual fund is an excellent product offering great flexibility and liquidity, which can be tailored to suit any investor’s objective and it is affordable for the all people of different income levels and saving habits. Mutual funds now represent perhaps most appropriate investment opportunity for most investors. As financial market become more sophisticated and complex, investor need a financial intermediary who provides the required knowledge nd professional expertise on successful investing, as the investor always try to maximize the return and minimize the risk. Mutual funds satisfy these requirements by providing attractive return and affordable risks. The fund industry has already overtaken the banking industry, more funds being under mutual fund management than deposited with banks. With the emergence of tough competition in this sector mutual funds are launching a variety of schemes which caters to the requirement of the particular class of investors, risk takers for getting capital appreciation should invest in growth, equity schemes. Investors who are in need of regular income should invest in income plans.

The stock market has also been rising for over three years now. This in turn has not only protected the money invested in funds but has also to help grow these investments. This has also instilled greater confidence among fund investors who are investing more into market through the MF route than ever before.
After doing study it is concluded that yes mutual funds are much better investment option but as future is uncertain so no one can give a sure guarantee of good return, no matter whether it is equity or a mutual fund. Investors can minimize their risk by doing little research before investing in the markets which will help them to decide the right investment plan or product.
RECOMMENDATIONS OF THE STUDY
As it was found from the above findings that the mutual funds are providing better returns and gaining its importance in the finance industry. Therefore, the mutual fund companies in India should make vice decisions while making investments and provide more benefits to investor.
As many investor get fooled by some mutual fund companies which gave false promise to investor for investing their money in their mutual fund. So government should make strict rules for all the mutual fund companies in order to safeguard the investment of all investors.
The charges should be reduced to minimum and also the lock in period factor should be minimized, which will attract more investors from the market.
Key features of mutual fund should be mentioned in the advertisement. Features like diversification. Systematic investment plan (SIP), tax benefits should be mentioned in the advertisements. Otherwise, people will see mutual funds as normal shares in which we invest money.
Many fund firms themselves have provided assurance regarding restitution (compensation) for losses to shareholders i.e reassuring. However, these promises

have been short on specifies indicating how those losses will be measured and how the compensation will be provided.
Mutual fund should use appropriate and simple names for the schemes, which match the feature of the schemes, so that investors are not confused and feel cheated after investing.