a study on knowledge and usage of electronic …
TRANSCRIPT

University of Nebraska - LincolnDigitalCommons@University of Nebraska - Lincoln
Library Philosophy and Practice (e-journal) Libraries at University of Nebraska-Lincoln
December 2018
A STUDY ON KNOWLEDGE AND USAGEOF ELECTRONIC RESOURCES BY THE SC/ST RESEARCH SCHOLARS AND PGSTUDENTS AMONG PERIYAR UNIVERSITYAFFILIATED COLLEGESKavitha [email protected]
Follow this and additional works at: http://digitalcommons.unl.edu/libphilprac
Part of the Library and Information Science Commons
ES, Kavitha, "A STUDY ON KNOWLEDGE AND USAGE OF ELECTRONIC RESOURCES BY THE SC/ST RESEARCHSCHOLARS AND PG STUDENTS AMONG PERIYAR UNIVERSITY AFFILIATED COLLEGES" (2018). Library Philosophy andPractice (e-journal). 1999.http://digitalcommons.unl.edu/libphilprac/1999

A STUDY ON KNOWLEDGE AND USAGE OF ELECTRONIC
RESOURCES BY THE SC/ST RESEARCH SCHOLARS AND PG
STUDENTS AMONG PERIYAR UNIVERSITY AFFILIATED
COLLEGES
Dr. E. S. Kavitha,
Assistant Professor,
Department of Library and Information Science,
Periyar University, Salem, Tamil Nadu
Abstract
Advances in computer applications during the past few decades have brought radical changes
in the way information is gathered, stored, organized, accessed, retrieved and consumed. The
foremost focus of the research paper was to study the knowledge and use of electronic
resources by SC/ST research scholars and PG students among colleges in Salem District
affiliated to Periyar University. The study was carried out for SC/ST research scholars and
PG students studying in colleges affiliated to Periyar University, Salem to explore their usage
pattern of electronic resources. A Structured questionnaire was designed to achieve the
objectives of the study and collect data from the research scholars. The results revealed that
more number of research scholars and PG students were frequently using the e-resources for
class assignments and preparation of examinations. Moreover, most of the users preferred to
download the e-resources as in PDFformats. However some of the institutional based
problems are being faced by the users.
Keywords: Electronic Resources, Research Scholars, SC/ST, PG Students, Periyar
University
Introduction
E‐resources are increasingly important to all aspects of education – from teaching and
learning, through to the collection of student data, administration and marketing activities the
institutions engage in. Advances in computer applications during the past few decades have
brought radical changes in the way information is gathered, stored, organized, accessed,
retrieved and consumed. The application of computers in information processing has brought
several products and services to the scene. The Internet and the Web are constantly
influencing the development of new modes of scholarly communication; their potential for
delivering goods is quite vast, as they overcome successfully the geographical limitations
associated with the print media. Electronic resources are online information resources,
including bibliographic databases, electronic reference books, search engines for full text
collections, digital collections of data and data sets. Non reference e-books and e-journals
will be referred to as e-resources in this report. With the information explosion, the internet
has revolutionized the research processes and made information retrieval very convenient.
The electronic resources which come in the form of e-books and e-journals accessed through
various databases have made research activities conveniently available. E-resources are
convenient to use and make research a lot easier in that, they enable one to search for
information at a faster rate because search engines are utilized as opposed to manual
searches. Libraries have witnessed a great metamorphosis in recent years both in their

collection development and in their service structure. Over the last several years, a significant
transformation has been noticed in collection development policies and practices. Print
medium is increasingly giving way to the electronic form of materials.
Bala, Suniti (2018) explored the use of open access resources (OARs) by researchers of
Punjab Agricultural University, Ludhiana. The findings of the study shows that research
articles, theses and e-books are extensively used open access resources for course and
research work. Training and online tutorials can be helpful in overcoming the problems faced
by researchers in using OARs. Yebowaah, Franklina Adjoa (2017) examined the use of
electronic resources by lecturers of the University for Development Studies, Wa campus. The
study recommended that efforts to improve the use of e-resources in the Library should
include ways of creating user awareness, training/workshops for users and staff, and
responding to the challenges confronting utilization. Amusa, Oyintola Isiaka (2016)
surveyed the level of availability, use and constraints to use of electronic resources among
law lecturers in Nigeria. The study recommended regular subscriptions to electronic
resources and provision of basic information literacy skills with emphasis on how to access,
retrieve, download and print electronic resources for the law lecturers. Viswanathan, V
(2016) attempted to deal with users opinion regarding the usage of Library Electronic
Resources of selected arts and science colleges in Tamil Nadu. This paper provided few
suggestions for the effective use of the resources among arts and science college libraries.
Jogan, Sushma N (2015) examined the views of postgraduate students’ on the access,
awareness and usage in facilitating their research and their satisfaction with the sources and
services currently provided. It suggested further for an improvement in the access facilities
with high Internet speed and subscription to more e-resources by the University Library. The
study attempted to encounter different problems faced by the students during accessing e-
resources. Kumar, Devendra (2015) analyzed the awareness and usage of EIRS among the
Teachers and Students of IIMS. The study demonstrated and elaborated the various aspects of
the purpose of using EIRS, types, methods and linking pattern of EIRS. The study discussed
with the reason for using EIRS and suggested to make the EIRS more beneficial. Kwadzo,
Gladys (2015) examined the awareness level and usage of electronic databases by graduate
students in the University of Ghana. The study found that students were very much aware of
the databases available and established that majority of students knew about the databases
from their lecturers and most of them accessed from the central library. Nazir, Tawfeeq
(2015) attempted to determine the use and satisfaction level with respect to the electronic
resources provided by the University of Kashmir to its users. The findings could be helpful to
know the different challenges and concerns faced by users while accessing and using e-
resources. The study highlighted the current scenario of the faculties of University of
Kashmir with reference to the awareness and usage of electronic resources. Priyadharshini,
R (2015) described the awareness, access and use of electronic resources available in the
Agricultural College and Research Institute, Madurai. The study focused on the use of
different types of electronic information resources, awareness of users, access and use of
digital resources freely available by the Post Graduate Students, Ph.D Scholars and Faculty
Members.
Objectives
The present study aimed to study the awareness and usage of electronic resources by SC/ST
research scholars and PG students among Periyar University affiliated colleges.
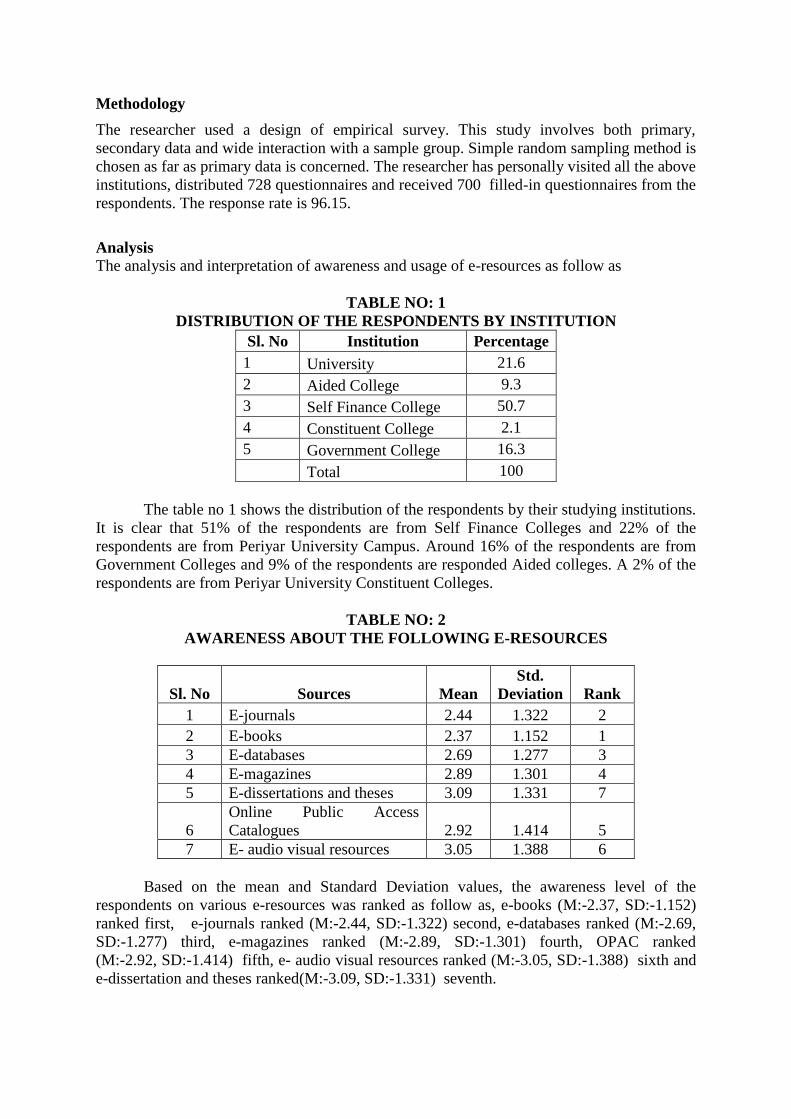
Methodology
The researcher used a design of empirical survey. This study involves both primary,
secondary data and wide interaction with a sample group. Simple random sampling method is
chosen as far as primary data is concerned. The researcher has personally visited all the above
institutions, distributed 728 questionnaires and received 700 filled-in questionnaires from the
respondents. The response rate is 96.15.
Analysis
The analysis and interpretation of awareness and usage of e-resources as follow as
TABLE NO: 1
DISTRIBUTION OF THE RESPONDENTS BY INSTITUTION
Sl. No Institution Percentage
1 University 21.6
2 Aided College 9.3
3 Self Finance College 50.7
4 Constituent College 2.1
5 Government College 16.3
Total 100
The table no 1 shows the distribution of the respondents by their studying institutions.
It is clear that 51% of the respondents are from Self Finance Colleges and 22% of the
respondents are from Periyar University Campus. Around 16% of the respondents are from
Government Colleges and 9% of the respondents are responded Aided colleges. A 2% of the
respondents are from Periyar University Constituent Colleges.
TABLE NO: 2
AWARENESS ABOUT THE FOLLOWING E-RESOURCES
Sl. No Sources Mean
Std.
Deviation Rank
1 E-journals 2.44 1.322 2
2 E-books 2.37 1.152 1
3 E-databases 2.69 1.277 3
4 E-magazines 2.89 1.301 4
5 E-dissertations and theses 3.09 1.331 7
6
Online Public Access
Catalogues 2.92 1.414 5
7 E- audio visual resources 3.05 1.388 6
Based on the mean and Standard Deviation values, the awareness level of the
respondents on various e-resources was ranked as follow as, e-books (M:-2.37, SD:-1.152)
ranked first, e-journals ranked (M:-2.44, SD:-1.322) second, e-databases ranked (M:-2.69,
SD:-1.277) third, e-magazines ranked (M:-2.89, SD:-1.301) fourth, OPAC ranked
(M:-2.92, SD:-1.414) fifth, e- audio visual resources ranked (M:-3.05, SD:-1.388) sixth and
e-dissertation and theses ranked(M:-3.09, SD:-1.331) seventh.

TABLE NO: 3
ANOVA BETWEEN AWARENESS LEVEL VARIOUS E-RESOURCES AND
COURSE OF STUDY
HO: There is no difference between awareness level on various e-resources and course of
study
ANOVA
Sum of
Squares df
Mean
Square F Sig.
E-journals Between Groups 48.759 2 24.380 14.499 .000
Within Groups 1171.955 697 1.681
Total 1220.714 699
E-books Between Groups 16.489 2 8.244 6.300 .002
Within Groups 912.156 697 1.309
Total 928.644 699
E-databases Between Groups 14.539 2 7.269 4.491 .002
Within Groups 1128.318 697 1.619
Total 1142.857 699
E-dissertations
and theses
Between Groups 58.556 2 29.278 17.294 .000
Within Groups 1180.031 697 1.693
Total 1238.587 699
E- audio visual
resources
Between Groups 18.864 2 9.432 4.953 .005
Within Groups 1327.285 697 1.904
Total 1346.149 699
The table no. 3 shows the Analysis of Variance between awareness levels of various
e-resources and Courses of study. From the above table it is clearly understood that
significant value of the two variables is zero and lesser than the table value at the significant
level of 5%. Calculated values of F are greater than the table value. Hence the null
hypothesis is rejected and the alternative hypothesis is accepted. The alternative hypothesis is
being “There is a significant difference between course what they study and their
awareness level on various e-resources.”

TABLE NO: 4
REGRESSION BETWEEN AWARENESS LEVEL ON VARIOUS E-RESOURCES
AND THE INSTITUTION
HO: There is no difference between awareness level on various e-resources and the
institution where they study
Model Summary
Model R R Square
Adjusted R
Square
Std. Error of
the Estimate
1 .243a .059 .049 1.233
a. Predictors: (Constant), E- audio visual resources, E-
databases , E-dissertations and theses, E-magazines ,
Online Public Access Catalogues , E-journals , E-books
ANOVAb
Model
Sum of
Squares df Mean Square F Sig.
1 Regression 65.972 7 9.425 6.199 .000a
Residual 1052.062 692 1.520
Total 1118.034 699
a. Predictors: (Constant), E- audio visual resources, E-databases , E-
dissertations and theses, E-magazines , Online Public Access Catalogues , E-
journals , E-books
b. Dependent Variable: Institution
The table no 4 shows the regression between awareness level on various e-resources
and the Institution where they study. From the above table it is clearly understood that
significant value of the two variables is zero and lesser than the table value at the significant
level of 5%. Hence the null hypothesis is rejected and the alternative hypothesis is accepted.
The alternative hypothesis is being “There is a significant difference between awareness
level on various e-resources and the institution where they study”.
TABLE NO: 5
FREQUENCY OF USE OF ELECTRONIC INFORMATION RESOURCES
Sl. No Frequency No of Respondent Percentage
1 Daily 252 36
2 Twice a week 113 16.1
3 Thrice a week 61 8.7
4 Weekly 189 27
5 Occasionally 85 12.1
Total 700 100

The table no 5 shows the frequency level of using the electronic information sources.
It is noticed that majority (36%) of the respondents were using the electronic information
sources on a daily basis. Around 27% of the respondents were using once in a weekly and
16% the respondents were using e-resources twice in a week. 12% of the respondents were
using the e-resources occasionally and 9% of the respondents were using the e-resources
thrice a week.
TABLE NO: 6
CHI-SQUARE TEST BETWEEN INSTITUTION AND PLACE OF ACCESSING THE
E-RESOURCES
HO: There is no relationship between the institution where they study and place of
accessing the e-resources
Sl.
No Place
Pearson Chi-Square Test
Value df Asymp. Sig.
(2-sided)
1 Home 35.341a 16 .004
2 Departmental Lab 35.341a 16 .004
3 Main Library 35.142a 16 .004
4 Other Places 65.561a 16 .000
The table no 6 shows the chi-square between the Institution where they study and
place of accessing the e-resources. From the above table it is clearly understood that
significant value of the two variables is zero and lesser than the table value at the significant
level of 5%. Hence the null hypothesis is rejected and the alternative hypothesis is accepted.
The alternative hypothesis is being “There is a significant relationship between the
institution where they study and place of accessing the e-resources”
TABLE NO: 7
PURPOSES OF USING THE E-RESOURCES
Sl. No Purpose Mean
Std.
Deviation Rank
1 Class Assignment 2.03 1.225 1
2 Research Paper 2.43 1.283 3
3 Seminar / Conference 2.42 1.15 4
4 Preparation for Exam 2.25 1.207 2
5 Update the Subject 2.56 1.337 5
6 Other 3.44 1.366 6
Based on the mean and Standard Deviation values, the various purpose of accessing
the e-resources has been ranked as follows, Class assignment was ranked (M:-2.03, SD:-
1.225) first, preparation of examination was ranked (M:-2.25, SD:-1.207) second, research
paper was ranked (M:-2.43, SD:-1.283) third, preparing for seminars/ conferences was ranked
(M:-2.42, SD:-1.15) fourth, updating the subject knowledge was ranked (M:-2.56, SD:-1.337)
fifth and for other purposes was ranked (M:-3.44, SD:-1.366) sixth.

TABLE NO: 8
REGRESSION BETWEEN COURSE AND PURPOSE OF USING THE VARIOUS E-
RESOURCES
HO: There is no difference between course and purpose of using the various
e-resources
Model Summary
Model R R Square
Adjusted R
Square
Std. Error of
the Estimate
1 .319a .102 .094 .590
a. Predictors: (Constant), Purpose: Other, Purpose:
Preparation for Exam, Purpose: Research Paper, Purpose:
Class Assignment , Purpose: Seminar / Conference,
Purpose: Update the Subject
ANOVAb
Model
Sum of
Squares df Mean Square F Sig.
1 Regression 27.258 6 4.543 13.054 .000a
Residual 241.170 693 .348
Total 268.429 699
a. Predictors: (Constant), Purpose: Other, Purpose: Preparation for Exam,
Purpose: Research Paper, Purpose: Class Assignment , Purpose: Seminar /
Conference, Purpose: Update the Subject
b. Dependent Variable: Course
The table no 8 shows the regression between course and purpose of using the various
e-resources. From the above table it is clearly understood that significant value of the two
variables is zero and lesser than the table value at the significant level of 5%. Hence the null
hypothesis is rejected and the alternative hypothesis is accepted. The alternative hypothesis is
being “There is a significant difference between course and purpose of using the various
e-resources”

TABLE NO: 9
REGRESSION BETWEEN INSTITUTION AND PURPOSE OF USING THE
VARIOUS E-RESOURCES
HO: There is no difference between Institution and purpose of using the various
e-resources
Model Summary
Model R R Square
Adjusted R
Square
Std. Error of
the Estimate
1 .190a .036 .028 1.247
a. Predictors: (Constant), Purpose: Other, Purpose:
Preparation for Exam, Purpose: Research Paper, Purpose:
Class Assignment , Purpose: Seminar / Conference,
Purpose: Update the Subject
ANOVAb
Model
Sum of
Squares df Mean Square F Sig.
1 Regression 40.532 6 6.755 4.345 .000a
Residual 1077.503 693 1.555
Total 1118.034 699
a. Predictors: (Constant), Purpose: Other, Purpose: Preparation for Exam,
Purpose: Research Paper, Purpose: Class Assignment , Purpose: Seminar /
Conference, Purpose: Update the Subject
b. Dependent Variable: Institution
The table no 9 shows the regression between Institution and purpose of using the
various e-resources. From the above table it is clearly understood that significant value of the
two variables is zero and lesser than the table value at the significant level of 5%. Hence the
null hypothesis is rejected and the alternative hypothesis is accepted. The alternative
hypothesis is being “There is a significant difference between Institution and purpose of
using the various e-resources”.
TABLE NO: 10
FREQUENCY LEVEL OF USING THE E-RESOURCES
Sl. No Sources Mean
Std.
Deviation Rank
1 E-journals 2.36 1.295 1
2 E-books 2.39 1.096 2
3 E-databases 2.79 1.24 3
4 E-magazines 3.07 1.189 6
5 E-dissertations and theses 3.04 1.303 5
6 Online Public Access Catalogues 2.94 1.438 4
7 E- audio visual resources 3.08 1.386 7

Based on the mean and Standard Deviation values, the frequency level of accessing
the e-resources has been ranked as follows, e-journals was ranked (M:-2.36, SD:-1.295)
first, e-books was ranked (M:-2.39, SD:-1.096) second, e-databases was ranked (M:-2.79,
SD:-1.24) third, OPAC was ranked (M:-2.94, SD:-1.438) fourth, e-dissertations and theses
ranked (M:-3.04, SD:-1.303) fifth, e-magazines ranked (M:-3.07, SD:-1.189) sixth and e-
audio visual resources was ranked (M:-3.08, SD:-1.386) seventh.
TABLE NO: 11
REGRESSION BETWEEN INSTITUTION AND FREQUENCY OF ACCESSING
THE VARIOUS E-RESOURCES
HO: There is no difference between Institution and frequency of accessing the various e-
resources
Model Summary
Model R R Square
Adjusted R
Square
Std. Error of
the Estimate
1 .224a .050 .040 1.239
a. Predictors: (Constant), Frequency: E- audio visual
resources, Frequency: E-books , Frequency: E-magazines
, Frequency: E-dissertations and theses, Frequency:
Online Public Access Catalogues , Frequency: E-journals
, Frequency: E-databases
ANOVAb
Model
Sum of
Squares Df Mean Square F Sig.
1 Regression 55.891 7 7.984 5.202 .000a
Residual 1062.143 692 1.535
Total 1118.034 699
a. Predictors: (Constant), Frequency: E- audio visual resources, Frequency: E-
books , Frequency: E-magazines , Frequency: E-dissertations and theses,
Frequency: Online Public Access Catalogues , Frequency: E-journals ,
Frequency: E-databases
b. Dependent Variable: Institution
The table no. 11 shows the regression between Institution and frequency of accessing the
various e-resources. From the above table it is clearly understood that significant value of the
two variables is zero and lesser than the table value at the significant level of 5%. Hence the
null hypothesis is rejected and the alternative hypothesis is accepted. The alternative
hypothesis is being “There is a significant difference between Institution and frequency of
accessing the various e-resources.”

TABLE NO: 12
PREFERABLE FILE FORMAT
Sl. No Format Mean
Std.
Deviation Rank
1 PDF 1.89 1.245 1
2 Full-text HTML 2.79 1.234 3
3 PPT 2.42 1.235 2
4 Other 3.49 1.39 4
Based on the mean and Standard Deviation values, the preferred file format to
download has been ranked as follows, PDF was ranked (M:-1.89, SD:-1.245) first, PPT was
ranked (M:-2.42, SD:-1.235) second, Full text HTML was ranked (M:-2.79, SD:-1.234) third
and other file formats was ranked (M:-3.49, SD:-1.39) fourth.
TABLE NO: 13
REGRESSION BETWEEN COURSE OF STUDY AND PREFERRED FORMAT TO
DOWNLOAD
HO: There is no difference between course of study and preferred format to download
Model Summary
Model R R Square
Adjusted R
Square
Std. Error of
the Estimate
1 .151a .023 .017 .614
a. Predictors: (Constant), Preferred format: Other,
Preferred format: PDF , Preferred format: Full-text
HTML , Preferred format: PPT
ANOVAb
Model
Sum of
Squares df Mean Square F Sig.
1 Regression 6.114 4 1.528 4.049 .003a
Residual 262.315 695 .377
Total 268.429 699
a. Predictors: (Constant), Preferred format: Other, Preferred format: PDF ,
Preferred format: Full-text HTML , Preferred format: PPT
b. Dependent Variable: Course
The table no 13 shows the regression between course of study and preferred format to
download. From the above table it is clearly understood that significant value of the two
variables is zero and lesser than the table value at the significant level of 5%. Hence the null
hypothesis is rejected and the alternative hypothesis is accepted. The alternative hypothesis is
being “There is a significant difference between course of study and preferred format to
download.”

TABLE NO: 14
Regression between Institution and preferred format to download
HO: There is no difference between institution where they study and preferred format to
download
Model Summary
Model R R Square
Adjusted R
Square
Std. Error of
the Estimate
1 .143a .020 .015 1.255
a. Predictors: (Constant), Preferred format: Other,
Preferred format: PDF , Preferred format: Full-text
HTML , Preferred format: PPT
ANOVAb
Model
Sum of
Squares df Mean Square F Sig.
1 Regression 22.900 4 5.725 3.633 .005a
Residual 1095.135 695 1.576
Total 1118.034 699
a. Predictors: (Constant), Preferred format: Other, Preferred format: PDF ,
Preferred format: Full-text HTML , Preferred format: PPT
b. Dependent Variable: Institution
The table no 14 shows the regression between institution where they study and
preferred format to download. From the above table it is clearly understood that significant
value of the two variables is zero and lesser than the table value at the significant level of 5%.
Hence the null hypothesis is rejected and the alternative hypothesis is accepted. The
alternative hypothesis is being “There is a significant difference between institution where
they study and preferred format to download.”
TABLE NO: 15
SATISFACTION LEVEL ON VARIOUS E-RESOURCES
Sl. No Sources Mean
Std.
Deviation Rank
1 E-journals 1.97 0.996 1
2 E-books 2.07 0.874 2
3 E-databases 2.38 1.093 4
4 E-magazines 2.6 1.137 7
5 E-dissertations and theses 2.71 1.281 8
6 CD-ROMs 2.77 1.194 9
7 Online Public Access Catalogues 2.49 1.194 6
8 E-Images 2.33 1.159 3
9 E- audio visual resources 2.57 1.241 5

Based on the mean and Standard Deviation values, the satisfaction level on various
e-resources has been ranked as follows, e-journals was ranked (M:-1.97, SD:-0.996) first, e-
books ranked (M:-2.07, SD:-0.874) second, e-images was ranked (M:-2.33, SD:-1.159) third,
e-databases was ranked (M:-2.38, SD:-1.093) fourth, e-audio visual resources was ranked
(M:-2.57, SD:-1.241) fifth, OPAC was ranked (M:-2.49, SD:-1.194) sixth, e-magazines was
ranked (M:-2.6, SD:-1.137) seventh, e- dissertation and theses was ranked (M:-2.71, SD:-
1.281) eighth and CD-ROMs was ranked (M:-2.77, SD:-1.194) ninth.
TABLE NO: 16
REGRESSION BETWEEN COURSE AND LEVEL OF SATISFACTION ON
VARIOUS E-RESOURCES
HO: There is no difference between course of study and their satisfaction level on various
e-resources.
Model Summary
Model R R Square
Adjusted R
Square
Std. Error of
the Estimate
1 .194a .038 .025 .612
a. Predictors: (Constant), Satisfaction: E- audio visual
resources, Satisfaction: E-journals , Satisfaction: E-
magazines , Satisfaction: E-Images , Satisfaction: Online
Public Access Catalogues , Satisfaction: E-databases ,
Satisfaction: CD-ROMs , Satisfaction: E-books ,
Satisfaction: E-dissertations and theses
ANOVAb
Model
Sum of
Squares df Mean Square F Sig.
1 Regression 10.096 9 1.122 2.996 .002a
Residual 258.333 690 .374
Total 268.429 699
a. Predictors: (Constant), Satisfaction: E- audio visual resources, Satisfaction:
E-journals , Satisfaction: E-magazines , Satisfaction: E-Images , Satisfaction:
Online Public Access Catalogues , Satisfaction: E-databases , Satisfaction: CD-
ROMs , Satisfaction: E-books , Satisfaction: E-dissertations and theses
b. Dependent Variable: Course
The table no. 16 shows the regression between course and satisfaction level on
various e-resources. From the above table it is clearly understood that significant value of the
two variables is zero and lesser than the table value at the significant level of 5%. Hence the
null hypothesis is rejected and the alternative hypothesis is accepted. The alternative
hypothesis is being “There is a significant difference between course of study and their
satisfaction level on various e-resources.”

TABLE NO: 17
REGRESSION BETWEEN INSTITUTION AND LEVEL OF SATISFACTION ON
VARIOUS E-RESOURCES
HO: There is no difference between Institution where they studying and their satisfaction
level on various e-resources
Model Summary
Model R R Square
Adjusted R
Square
Std. Error of
the Estimate
1 .205a .042 .029 1.246
a. Predictors: (Constant), Satisfaction: E- audio visual
resources, Satisfaction: E-journals , Satisfaction: E-
magazines , Satisfaction: E-Images , Satisfaction: Online
Public Access Catalogues , Satisfaction: E-databases ,
Satisfaction: CD-ROMs , Satisfaction: E-books ,
Satisfaction: E-dissertations and theses
ANOVAb
Model
Sum of
Squares df Mean Square F Sig.
1 Regression 46.891 9 5.210 3.356 .000a
Residual 1071.143 690 1.552
Total 1118.034 699
a. Predictors: (Constant), Satisfaction: E- audio visual resources, Satisfaction:
E-journals , Satisfaction: E-magazines , Satisfaction: E-Images , Satisfaction:
Online Public Access Catalogues , Satisfaction: E-databases , Satisfaction: CD-
ROMs , Satisfaction: E-books , Satisfaction: E-dissertations and theses
b. Dependent Variable: Institution
The table no 17 shows the regression between Institution and satisfaction level on
various e-resources. From the above table it is clearly understood that significant value of the
two variables is zero and lesser than the table value at the significant level of 5%. Hence the
null hypothesis is rejected and the alternative hypothesis is accepted. The alternative
hypothesis is being “There is a significant difference between Institution where they
studying and their satisfaction level on various e-resources.”

TABLE NO: 18
PROBLEMS FACED WHILE ACCESSING THE E-RESOURCES
Sl. No Problems Mean
Std.
Deviation Rank
1 Slow network Connection 2.3 1.21 1
2 Electricity 2.72 1.214 3
3 Advertisements 2.53 1.277 2
4 Licensing 2.89 1.315 5
5 Scattered Data 3.15 1.289 8
6 Authentication 3.18 1.289 9
7 Misuse 3.21 1.378 10
8 Time Consuming 2.83 1.309 4
9 Document Saving Issues 3.07 1.262 6
10 Limited Information 3.09 1.331 7
Based on the mean and Standard Deviation values, the various problems faced by the
respondents while of accessing the e-resources has been ranked as follows, slow network
connection was ranked (M:-2.30, SD:-1.21) first, unwanted advertisement was ranked (M:-
2.53, SD:-1.277) second, electricity problem was ranked (M:-2.72, SD:-1.214) third, time
consuming was ranked (M:-, SD:-) fourth, Licensing problem was ranked (M:-2.89, SD:-
1.315) fifth, Documents saving issues was ranked (M:-3.07, SD:-1.262) sixth, Limited
information was ranked (M:-3.09, SD:-1.331) seventh, Scattered data was ranked (M:-3.15,
SD:-1.289) eight, authentication was ranked (M:-3.18, SD:-1.289) ninth, misuse of data was
ranked (M:-3.21, SD:-1.378) tenth.
TABLE NO: 19
CHI-SQUARE TEST BETWEEN FREQUENCY LEVEL USING THE
E-RESOURCES AND PROBLEMS FACED WHILE ACCESSING
THE E-RESOURCES
HO: There is no relationship between frequency level of using the e-resources and
problems faced while accessing the e-resources
Sl.
No
Problems Pearson Chi-Square Test
Value df
Asymp. Sig.
(2-sided)
1. Slow network Connection 62.002a 16 .000
2. Electricity 76.914a 16 .000
3. Advertisements 77.427a 16 .000
4. Licensing 63.269a 16 .000
5. Scattered Data 63.269a 16 .000
6. Authentication 77.149a 16 .000
7. Misuse 77.149a 16 .000
8. Time Consuming 75.862a 16 .000
9. Document Saving Issues 1.046E2a 16 .000
10. Limited Information 76.605a 16 .000

The table no 19 shows the chi-square between the frequency of accessing the e-
resources and problems faced while accessing the e-resources. From the above table it is
clearly understood that significant value of the two variables is zero and lesser than the table
value at the significant level of 5%. Hence the null hypothesis is rejected and the alternative
hypothesis is accepted. The alternative hypothesis is being “There is a significant
relationship between the frequency level of using the e-resources and problems faced while
accessing the e-resources”
Findings
The study indicated that 51% of the respondents were from Self Finance Colleges and
22% of the respondents were from Periyar University. Around 16% of the
respondents were from Government Colleges and 9% of the respondents were
responded Aided colleges.
It is understood from the study that most of the respondents were higher aware of e-
books, e-journals, e-databases and e-magazines. Some of the respondents had lesser
level of awareness on OPAC, e- audio visual resources and e-dissertation and theses.
The hypothesis “There is a significant difference between course what they study and
their awareness level on various e-resources” has been proved.
The hypothesis “There is a significant difference between awareness level on various
e-resources and the institution where they study” has been proved.
The study indicated that 36% of the respondents were using the electronic information
sources on a daily basis and 27% of the respondents were using weekly once.
The hypothesis “There is a significant relationship between the institution where they
study and place of accessing the e-resources” has been proved.
Based on the mean and Standard Deviation values, the various purposes of accessing
the e-resources has been ranked as follows, Class assignment was ranked first,
preparation of examination was ranked second, research paper was ranked third,
preparing for seminars/ conferences was ranked fourth, updating the subject
knowledge was ranked fifth and for other purposes was ranked sixth.
The hypothesis “There is a significant difference between course and purpose of using
the various e-resources” has been proved.
The hypothesis “There is a significant difference between Institution and purpose of
using the various e-resources” has been proved.
Based on the mean and Standard Deviation values, the frequency level of accessing
the e-resources has been ranked as follows, e-journals was ranked first, e-books was
ranked second, e-databases was ranked third, OPAC was ranked fourth, e-
dissertations and theses ranked fifth, e-magazines ranked sixth and e-audio visual
resources was ranked seventh.
The hypothesis “There is a significant difference between Institution and frequency of
accessing the various e-resources” has been proved.
Based on the mean and Standard Deviation values, the preferred file format to
download was ranked as follow as, PDF was ranked first, PPT was ranked second,
Full text HTML was ranked third and other file formats was ranked fourth.
The hypothesis proved that “There is a significant difference between course of study
and preferred format to download.”
The hypothesis “There is a significant difference between institution where they study
and preferred format to download” has been proved.
The study indicated the satisfaction level on various e-resources has been ranked as
follows, e-journals was ranked first, e-books ranked second, e-images was ranked

third, e-databases was ranked fourth, e-audio visual resources was ranked fifth,
OPAC was ranked sixth, e-magazines was ranked seventh, e- dissertation and theses
was ranked eighth and CD-ROMs was ranked ninth.
The hypothesis “There is a significant difference between course of study and their
satisfaction level on various e-resources” has been proved.
The hypothesis “There is a significant difference between Institution where they
studying and their satisfaction level on various e-resources” has been proved.
Based on the mean and Standard Deviation values, the various problems faced by the
respondents while of accessing the e-resources have been ranked as follows, slow
network connection was ranked first, unwanted advertisement was ranked second,
electricity problem was ranked third, time consuming was ranked fourth, Licensing
problem was ranked fifth, Documents saving issues was ranked sixth, Limited
information was ranked seventh, Scattered data was ranked eight, authentication was
ranked ninth, misuse of data was ranked tenth.
The hypothesis “There is a significant relationship between the frequency level of
using the e-resources and problems faced while accessing the e-resources” has been
proved.
Conclusion
It is of significant importance, essentially with respect to learning and teaching outcomes,
that the usage of e-resources is constantly monitored among various target groups of users
and reflected in the way in which institutions develop e‐learning strategies and embed
e‐learning imperatives into other strategies. The study shows the use of e-resources is very
common among the SC/ST PG students and research scholars of Periyar University and
majority of the SC/ST PG students and research scholars are dependent on e-resources to get
the desired and relevant information. But practical use of e-resources is not up-to the worth in
comparison to investments made in acquiring these resources. The study also indicated the
infrastructure and training programs should also be revised as per requirements. It is observed
that the availability of e-resources on the campus was almost enough for all the existing
disciplines but the infrastructure must also be adequately provided and consistently updated.
Acknowledgement
The author would like to thank the Indian
Council of Social Science Research for it’s
Financial support under the ICSSR Minor
Research Project F.No. 02 /448/2016-17/RP dt.
30.03.2017.
Reference
1. Adeyoyin, Samuel Olu (2016), Awareness, Access, and Use of Electronic
Information Resources among the Seminarians in Nigeria, Journal of
Religious & Theological Information, 15 (1-2), 1-18
2. Akpojotor, Lucky O (2016) Awareness And Usage Of Electronic Information
Resources Among Postgraduate Students Of Library And Information Science
In Southern Nigeria, Library Philosophy and Practice (e-journal).
1408.http://digitalcommons.unl.edu/libphilprac/1408

3. Akussah, Maxwell (2015), Impact of Electronic Resources and Usage in
Academic Libraries in Ghana: Evidence from Koforidua Polytechnic & All
Nations University College, Ghana, Journal of Education and Practice, 6(33),
33-38
4. Amusa, Oyintola Isiaka (2016) Availability, Level of use and
Constraints to use of Electronic Resources by Law Lecturers in Public
Universities in Nigeria, JLIS, 7(3)
5. Bala, Suniti (2018), Awareness of Open Access Resources among the
Researchers of Punjab Agricultural University, Ludhiana, International
Journal of Library Information Network and Knowledge, 3(1), 139-145
6. Jogan, Sushma N (2015) Access, Awareness And Use Of Electronic
Resources By Post Graduate Students In Gulbarga University, International
Journal of Informative & Futuristic Research (IJIFR), 2(6), 1540 - 1547
7. Joseph Jestin K J (2016) E-Resources in engineering College Libraries in
Kerala: Awareness and Availability – A Study, International Journal of
Digital Library Services, 6(2), 85-90
8. Kaur, Kulveen (2016) Awareness and Use of E-resources: A Case Study of
Mohinder Singh Randhawa Punjab Agricultural University Library, Ludhiana,
DESIDOC Journal of Library & Information Technology, 36(6), 396-404
9. Kumar, Devendra (2015) Use and Awareness of Electronic Information
Resources and Services Among the Teachers and Students of Institute of
Informatics and Management Sciences (IIMS) Meerut,U.P.(India): A Case
Study, International Journal of Information Library & Society, 1(1), 8-18
10. Kwadzo, Gladys (2015), Awareness and usage of Electronic Databases by
Geography and Resource Development Information Studies Graduate Students
in the University Of Ghana, Library Philosophy and Practice (e-journal).
1210. http://digitalcommons.unl.edu/libphilprac/1210
11. Nazir, Tawfeeq (2015) Use and adequacy of e-resources by the research
scholars and students of the University Of Kashmir In Science & Social
Science Faculties: A Case Study, Brazilian Journal of Information
Science, 9(1).
12. Priyadharshini, R (2015), Awareness in usage of e-Resources among users at
Agricultural College and Research Institute, Madurai: A case study, European
Academic Research, II(11), 14816-14823.
13. Veena G (2016), Awareness and use of open access electronic information
resources by university students: a study, International Journal of Digital
Library Services, 6(1), 113-120
14. Viswanathan, V. (2016) Use of Library Electronic Resources Among Selected
Arts And Science Colleges In Tamil Nadu, International Journal of Library
Science and Research (IJLSR), 6(4), 17-22
15. Yebowaah, Franklina Adjoa Ms (2017), Awareness and Use of Electronic
Resources in University Libraries: A Case Study of University for
Development Studies Library, Library Philosophy and Practice (ejournal).
1562. http://digitalcommons.unl.edu/libphilprac/1562.
