a study on human thermal comfort criteria from a non-bse
TRANSCRIPT
Final Report on
CIBSE HK Research Project
A Study on
Human Thermal Comfort Criteria From a non-BSE Perspective
K.K. Lam1, Albert So2, Brian Tse2, Qin Hua Hu3, Wilson Suen2
1 Chartered Institution of Building Services Engineers HK Branch 2 City University of Hong Kong
3 Dong Guan University of Technology
1st June, 2008 to 31st October, 2008
Research Seminar conducted on 7th February, 2009
Final Report submitted in November, 2009

Background In the two previous CIBSE research projects conducted by CIBSE HK Branch, City University of Hong Kong and Dong Guan University of Technology, from 2005 to 2006, the research team was able to show that energy saving could be achieved by manipulating the PMV equations so that an elevation of room temperature setting could be compensated by the increase in air speed. Then, it was further discovered that people living in tropical countries, such as the long summer in the southern part of Mainland China, Dong Guan more precisely, preferred a slightly negative Predicted Mean Vote (PMV) while people living in temperate countries, such as Japan, might prefer a comparatively positive PMV. Such findings were surprising to the research team. However, due to the limitation of research funding, the research team was only able to carry out experiments and surveys on 230+ human subjects and therefore the result was not that convincing scientifically. There should be some reasons to explain such phenomena but they might fall outside the scope of building services engineering. Such knowledge had to be explored by the research team to supplement conventional understanding related to human comfort by building services engineers. With a view to this desire, CIBSE HK funded the research team in the summer of 2008 to conduct this captioned project. Introduction The primary objective of air-conditioning in office, commercial and residential buildings is to provide thermal comfort to the occupants. The most popular way to estimate “human comfort” is by means of PMV which takes into account of six parameters, i.e. human metabolic rate, clothing, dry-bulb temperature, water vapour pressure (i.e. humidity), radiant temperature and speed of air movement. PMV is based on the thermal comfort equation introduced by Prof. P.O. Fanger in 1970 and now, it has become an international standard, being used everywhere around the world. BS EN 7730: 2005 also incorporates PMV in the prediction of thermal comfort. However it is obvious that the PMV equation was developed using research findings and experience in Europe. It is believed that people in the southern part of Mainland China may prefer PMV values that are different from those in Europe. In our first research project, we carried out a simple survey with six human subjects to get a general concept the range of acceptable PMV values of

Chinese. They were of different sex and age groups. The result revealed that young Chinese could prefer a PMV value around 0.5 while senior Chinese could prefer a higher PMV value. It may imply that the temperature setting of existing air-conditioning systems in China has been too low, thus wasting energy. Then, in our second project, we engaged 230+ human subjects of different sex and age groups and also originations. It was found that the trend was similar, i.e. young Chinese preferring a lower PMV than senior Chinese. However, it seemed that they liked an environment with a slightly negative PMV. This captioned research project aimed at further investigating the preferable range of PMV values of Chinese from a different perspective. Most of the works had been based on literature survey. As far as the investigators were aware, there had not been any study in this aspect ever conducted in China before. It was very meaningful to carry out a preliminary study on this issue although a comprehensive study based on experiments would be very costly. The research was conducted jointly by the City University of Hong Kong, the Dongguan University of Technology and CIBSE HK Branch. Funding was provided under a research grant from CIBSE HK Branch. Measurement of Human Thermal Comfort Traditionally, it was believed that human comfort was mainly based on the ambient temperature. Therefore, in the past, air-conditioning control was normally associated with signals from thermostats. However, it was found in the seventies that human thermal comfort was not merely temperature based and it was the first time when human thermal comfort could be expressed quantitatively. Appendix I shows findings of the research team as the introduction to this project. Role of Metabolic Rate in Human Thermal Comfort One of the suggestions from the 2007 study was that an explanation was offered to a special phenomenon discovered. It was found that people in the southern part of Mainland China preferred a slightly negative PMV. In order to maintain the conventional saying that PMV = 0 should be an optimal condition for human subjects to feel comfortable, the research team proposed that the metabolic rate of southern Chinese got to be slightly higher than that of northern Chinese. Therefore, in this captioned project,
the role of metabolic rate in determining human thermal comfort was studied. Appendix II gives a summary of our findings. Role of Air Movement in Human Thermal Comfort Obviously, air movement is one key factor in the PMV equation proposed by P.O. Fanger. However, the research team discovered that the impact of the same quantity of air movement to the PMV equation could be slightly different depending on the type of air-conditioned environment, either air-conditioned or naturally ventilated. Appendix III gives a summary of our findings. Room for Improvement to the PMV Equation Generally speaking, in this captioned project, the research team discovered that there was still room for improvement of the conventional PMV equation included in ISO 7730:2005, at least when it was applied to this part of the world. A summary of the concerns and suggestions was included as Appendix IV of this report. This final part concludes the whole project. Simply speaking, it is considered that human thermal comfort measurement is critical to the design and operation of the air-conditioning system. However, there is still room for improvement to the equation of quantifying thermal comfort. More studies and research works have to be done in this area as the world is demanding more and more energy efficient air-conditioning systems.

Appendix I
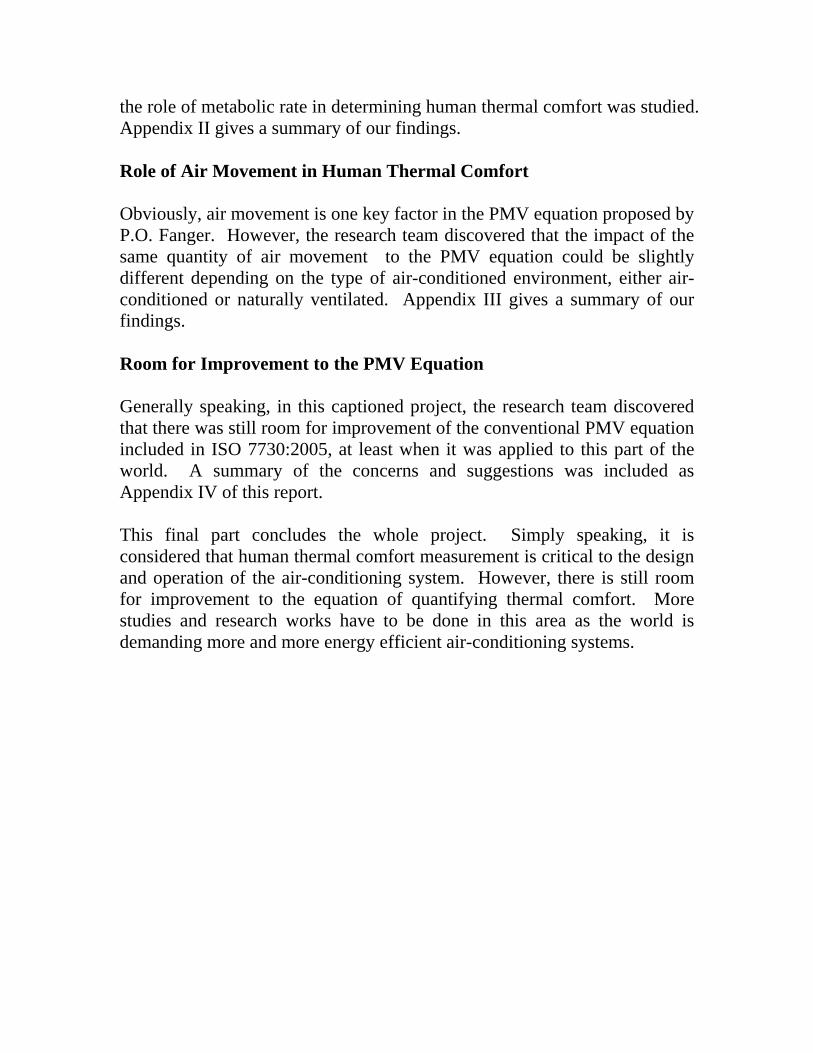
An Introduction toThermal Comfort Criteria
Professor K K Lam Training Coordinator CIBSE HKB
2009
Comfort•In any subjective assessment of the comfort of the whole environment, thermal, acoustic and visual factors all play a part.•All 3 aspects need to be considered together since the means of providing one component may influence the design of another.•Thermal comfort is today’s topic. One feels thermally comfortable when the environment is able to remove the exact amount of heat generated by him/her.
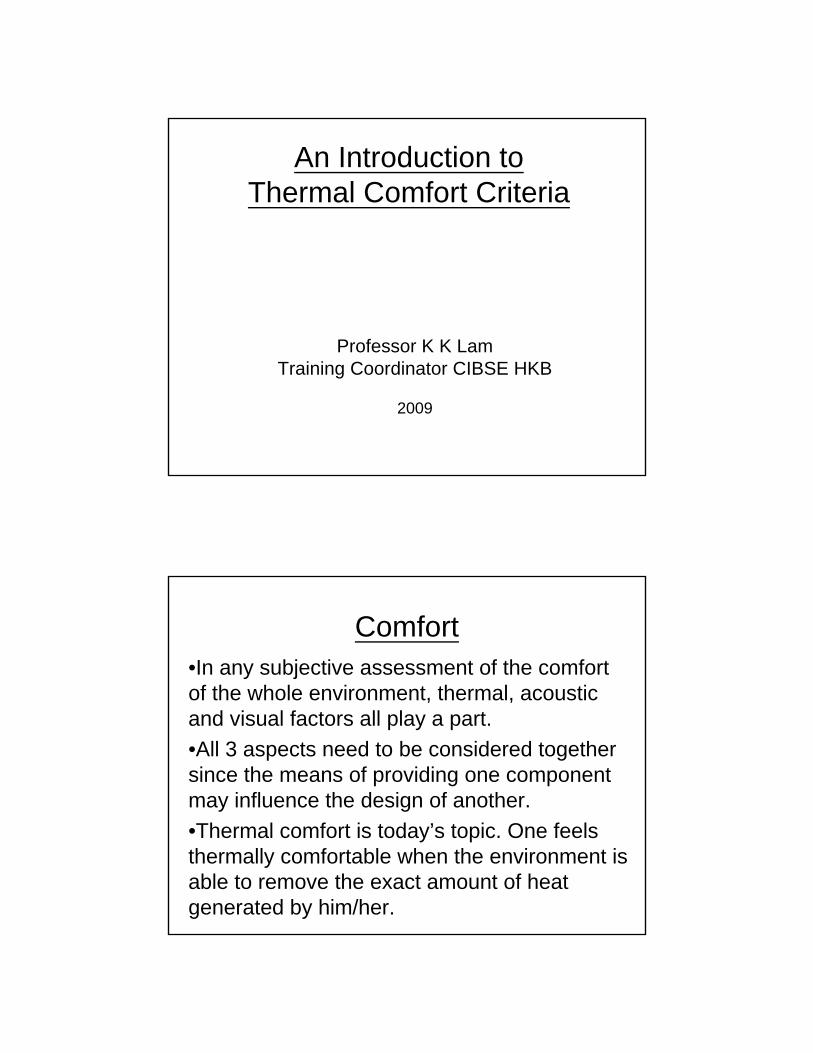
Thermal Comfort
•In a first-class AC system one is not really conscious of the temperature or humidity because he is comfortable.•Comfort zone varies with activities and with season.•Different individuals require different comfort zone (due to age, sex, race and degree of acclimatization).
Parameters affecting Thermal Comfort
•Dry bulb temperature•Wet bulb temperature•Relative humidity•Air velocity•Mean Radiant temperature•Resultant temperature •Operative temperature

Earlier Concepts of Thermal Comfort
Thermal Comfort in the SeventiesIHVE Guide in 1971 specified the following conditions leading to thermal comfort:•Relative Humidity:-lies within 30 to 70%•Velocity-At 200C: Upper limit of 0.15 m/s
Lower limit of 0.1 m/s-At 250C: Upper limit of 0.45 m/s
Lower limit of 0.2 m/s
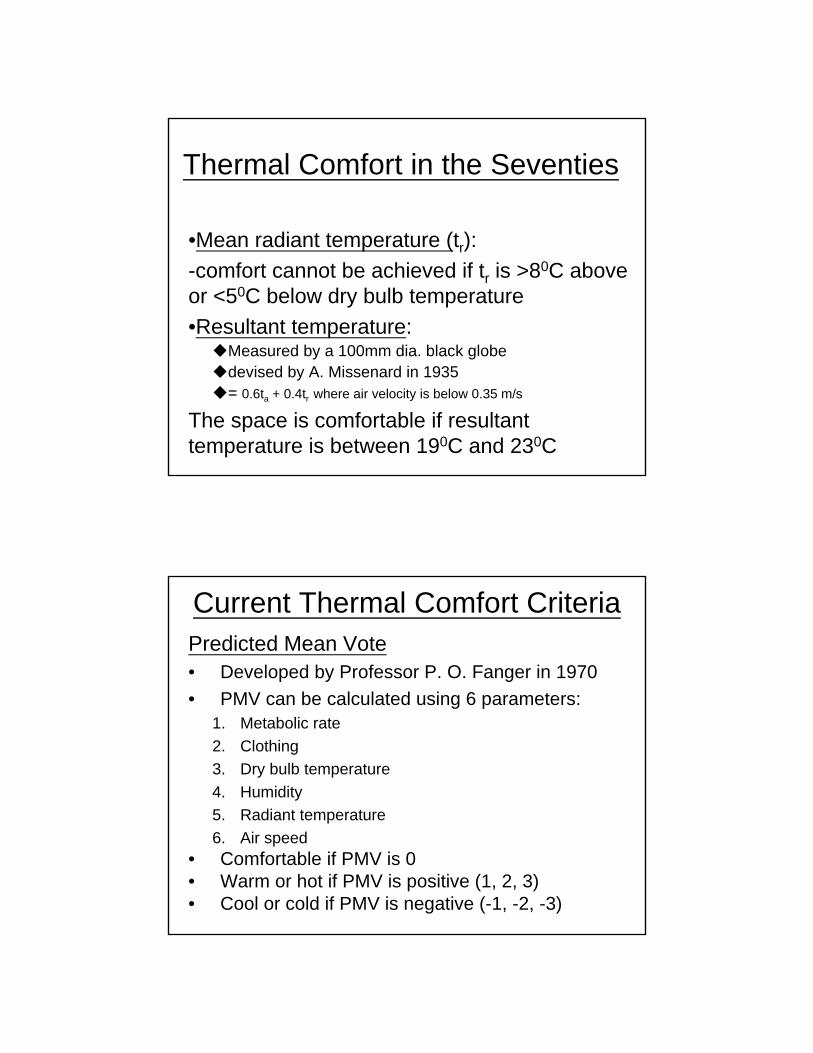
Thermal Comfort in the Seventies
•Mean radiant temperature (tr): -comfort cannot be achieved if tr is >80C above or <50C below dry bulb temperature•Resultant temperature:
Measured by a 100mm dia. black globedevised by A. Missenard in 1935= 0.6ta + 0.4tr where air velocity is below 0.35 m/s
The space is comfortable if resultant temperature is between 190C and 230C
Current Thermal Comfort CriteriaPredicted Mean Vote• Developed by Professor P. O. Fanger in 1970• PMV can be calculated using 6 parameters:
1. Metabolic rate2. Clothing3. Dry bulb temperature4. Humidity5. Radiant temperature6. Air speed
• Comfortable if PMV is 0• Warm or hot if PMV is positive (1, 2, 3)• Cool or cold if PMV is negative (-1, -2, -3)

Current Thermal Comfort Criteria
Current Thermal Comfort Criteria

BS EN ISO 7730: 2005• Make reference to PMV• Predicted percentage dissatisfied (PPD)
75% dissatisfied for PMV = 2 or -225% dissatisfied for PMV = 1 or -15% dissatisfied for PMV = 0
• Offices will be comfortable if operative temperature is 24.50C +/- 10C
• Operative temp. = Ata + (1-A)tr
Velocity < 0.2 m/s 0.2 to 0.6 0.6 to 1A 0.5 0.6 0.7
Research on Thermal Comfort Criteria by CIBSE HKB
• CIBSE HKB recognizes that a better understanding of thermal comfort criteria is vital in energy efficiency design.
• The current thermal comfort criteria are developed by experts in Europe based on different climatic conditions and different societal requirements.
• These criteria assume that age and sex have no influence on the PMV equation. This is contrary to our common believe that older people and female prefer higher temperature.

Research on Thermal Comfort Criteria by CIBSE HKB
• CIBSE HKB funded and participated in research works conducted by City University of Hong Kong and University of Science and Technology in Dongguan.
• The research works started in 2006 consisting of experiments, surveys and literature searches on published papers by BS and non-BS experts.
• The objectives of the research is to develop better understanding of thermal comfort criteria and to propose criteria that will be suitable for Hong Kong.
Climate Chamber for Experiment
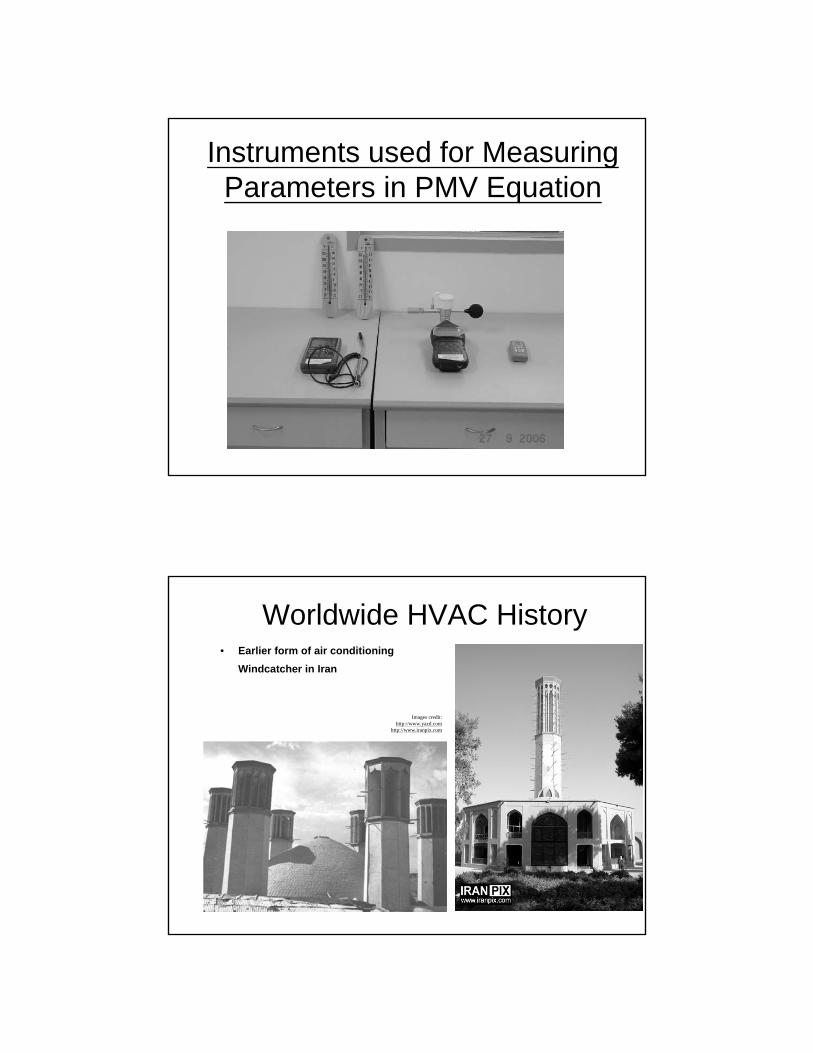
Instruments used for Measuring Parameters in PMV Equation
Worldwide HVAC History• Earlier form of air conditioning
Windcatcher in Iran
Images credit:http://www.yazd.com
http://www.iranpix.com

Worldwide HVAC History• 19th Century
Ice and Fan
• DrawbackUnable to control humidity
Images credit:http://www.ashrae.com
Worldwide HVAC History• 20th Century
Willis Haviland Carrier, Father of Air Conditioning, initiating modern MVAC industry
• 1902 first air conditioning system for manufacturing process control
• 1911Rational Psychometric Formulae (Psychometric Chart)
• 1924 Cooling for human comfort; from department stores to movie theatres
• 1928 1st residential air conditioner, ‘Weathermaker’ for private home use
Images credit:http://www.ashrae.com
http://www.global.career.comhttp://www.nauticadehumid.com

Appendix II
1
人体的新陈代谢率An Introduction to Metabolic Rate
Dr. Qinhua HuDongguan University of Technology
2009
人体的新陈代谢率(Metabolic Rate)
一. 代谢率及影响因素
二.基础代谢率
三.代谢率与PMV

2
一 人体能量代谢率
1.1 代谢率
人体靠摄取食物维持生命,食物通过化学反应
被分解氧化,实现人体的新陈代谢,在化学反应中释放能量的速率叫做代谢率(Metabolic Rate)。
考虑人体的能量平衡时,应注意到人体与非生
物体的能量平衡存在根本的区别,即人体的能量释放量和释放方式不是固定的,而是受主观和客观环境因素影响并反作用于主观和客观因素的。因此人体的能量平衡描述比非生物体的能量平衡描述要复杂的多。
主要影响因素
人体代谢率影响因素
肌肉活动强度 食物 精神活动环境温度

3
1.2 影响因素
人体的能量代谢率受多种因素影响,如肌肉活动
强度、环境温度、性别、年龄、神经紧张程度、进食后时间的长短。
1.2.1肌肉活动
肌肉活动对能量代谢的影响较为显著。一般健康人剧烈运动时的能耗量增大,可达安静时的15~20倍。影响运动时能量消耗的因素较多,但主要是
取决于运动量的大小,即运动强度,密度和运动的持续时间。
1.2.2环境温度
人体安静时的能量代谢在20℃~30℃的环境下最稳定。当环境温度低于20℃时,代谢
开始增加。这主要是由于寒冷的刺激反射性的引起肌肉紧张程度增加,导致产热增多。如环境温度达到30℃以上,能量代谢也增
加,这可能是温度的上升提高了体内生化反应的速率。

4
1.2.3食物的特殊动力作用
人在进食后的一段时间内(1~8h),产热量比进食前有所增加,这种作用称为食物的特殊动力作用。食物的特殊动力作用可因不同食物而异。
全蛋白质食物可增加热量30%,糖类或脂肪类食物只能增加4%~6%,混合食物一般增加产热量10%。
1.2.4精神活动
当人的精神紧张伴有情绪激动(如恐惧,焦虑,愤怒)时能量代谢明显增强。一方面是由于精神紧张时骨骼肌的紧张性也加强;另一方面是由于交感神经兴奋,肾上腺素分泌增加,使机体组织代谢加强,导致产热量增多。
精神活动的影响是比较显著的,同时也是目前无法定量测定的。

5
二 基础代谢率方程
2.1 基础代谢率临床上规定未进早餐前,保持清醒静卧半小
时,室温条件维持在18~25℃ 之间测定的代谢率叫做基础代谢率(Basal Metabolic Rate,BMR)。
由于人体的能量代谢率易受多种因素的影响,基础代谢率可用作衡量代谢的一个标准。
人体的基础代谢率随年龄逐渐下降,少年较高,老年稍低。女性比男性低6%~10%。BMR正常的活动范围在10%~15%之内,如果变动超过20%,则处于病理状态
2.2 基础代谢率方程
1919年建立最原始的基础代谢率方程为
daykcal
yeara
cmh
kgMP )4730.66
17550.6
10033.5
17516.13( +−+=男性:
daykcal
yeara
cmh
kgmP )0955.655
16756.4
18496.1
15634.9( +−+=女性:
6
其中s男性取+5,女性取-161
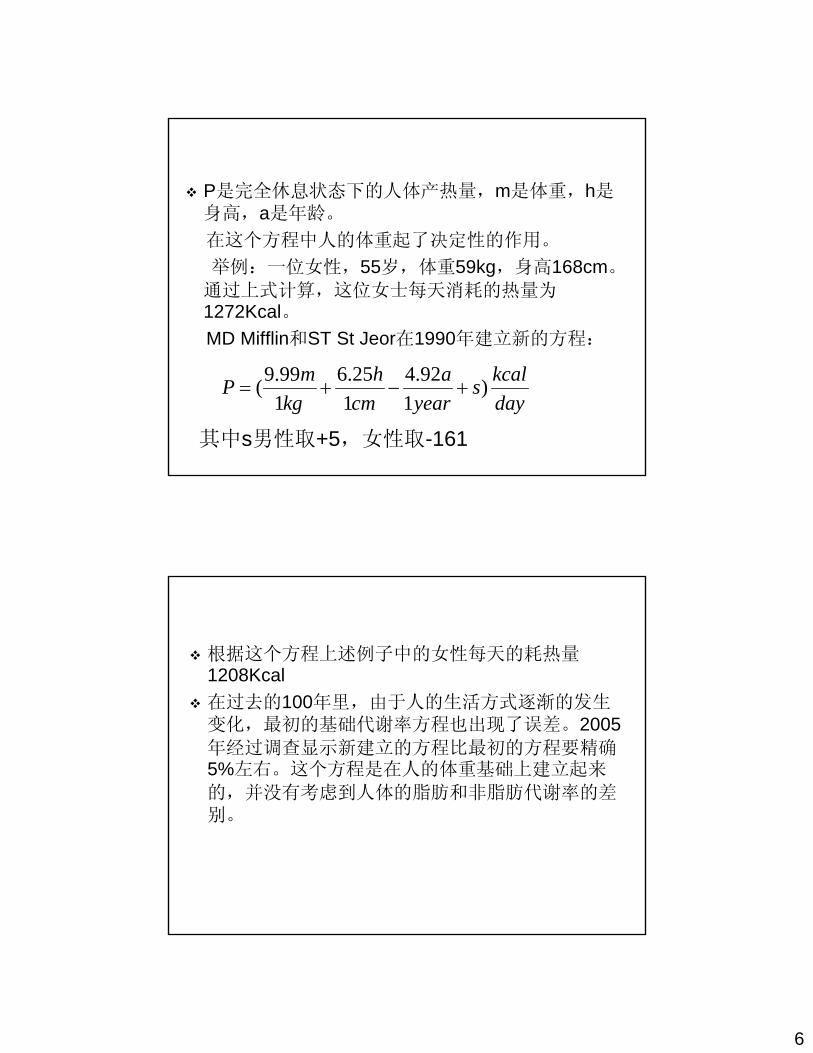
P是完全休息状态下的人体产热量,m是体重,h是身高,a是年龄。
在这个方程中人的体重起了决定性的作用。
举例:一位女性,55岁,体重59kg,身高168cm。
通过上式计算,这位女士每天消耗的热量为1272Kcal。MD Mifflin和ST St Jeor在1990年建立新的方程:
daykcals
yeara
cmh
kgmP )
192.4
125.6
199.9( +−+=
根据这个方程上述例子中的女性每天的耗热量1208Kcal在过去的100年里,由于人的生活方式逐渐的发生变化,最初的基础代谢率方程也出现了误差。2005年经过调查显示新建立的方程比最初的方程要精确5%左右。这个方程是在人的体重基础上建立起来
的,并没有考虑到人体的脂肪和非脂肪代谢率的差别。

7
Katch McArdle在非脂肪物质的基础上建立了更准
确的方程:
其中LBM是人体中非脂肪物质的体重,单位为kg。根据这个方程,上述例子中女性身体脂肪占体重的
30%,那么他一天的耗热量为1263Kcal.如果要计算一天的消耗量,可以根据个体的活动强度乘以1.2~1.9的系数。
)1*6.21(370kgLBMP +=
三 代谢率与PMV 人体的代谢率受多种因素的影响,而PMV也受多
种因素影响,并且具有一定的局限性。通过一些实验和理论计算来比较一下:
3.1 实验结论在做人体热舒适实验时,通过对受试者状态的
观察及其填写的热感觉调查问卷显示,不同状态的人对热感觉有不同的感受。年轻人与年老人:在同样的室内环境下,年轻人比年老人更喜欢较凉爽的环境。心情愉悦者与沮丧者:心情好坏对新陈代谢率影响很大,同时对PMV影响也很大,通常脾气暴躁发火的人容易出汗。

8
受试之前的运动状态:这一点对PMV及新陈代谢影
响都很大,跑步和正常走路来实验室接受实验的受试者对实验都有一定的影响,但这一点在实验前休息15分钟后,在一定程度上能减弱影响。
人的肥胖程度:按常理,胖人比瘦人更喜欢凉爽一点的环境,通过实验也验证了这一点。
心情的好坏:心情愉悦者的新陈代谢比较平稳,对环境的忍受力也比较强,而心情沮丧者的新陈代谢率比较紊乱,烦躁程度直接影响到代谢率及对环境的评价。
3.2 通过PMV计算程序
在给定环境参数下,只改变代谢率来观察PMV的变化规律

9
2.69391 200做体操
1.80565 150跳交谊舞
1.36469 123站着,偶尔走动
0.37436 70站着休息
0.21375 65办公室打字
-0.06197 58.2静坐
-0.21619 55办公室阅读
-1.33601 40 睡眠状态空气温度ta=25.8℃黑球温度tg=26℃湿球温度tw=22.7℃相对湿度RH=77%
PMV代谢率W/㎡室内参数
通过上表可以看出,代谢率对PMV的影响是很大的,但PMV与人体真正的热感觉又有一定差别。处于睡眠状态的人可能会感觉有点冷,在办公室打字或偶尔走动的人会感觉适中,而跳舞的人虽然会流汗,但是心情是愉悦的,也会感觉比较舒服,这样就关系到热感觉和热舒适这两个概念的区别。
总之,人体的热感觉和热舒适是受多种因素影响的,其中新陈代谢也是一个比较重要的因素,截止目前,对人体热舒适和热感觉的研究基本上停留在单个因素的影响,多种因素叠加的多元素的研究也是值得期待的。

Appendix III
Impact of Air Movement on Human Thermal Comfort
Ir Dr W. L. TseDepartment of Building and Construction
City University of Hong Kong
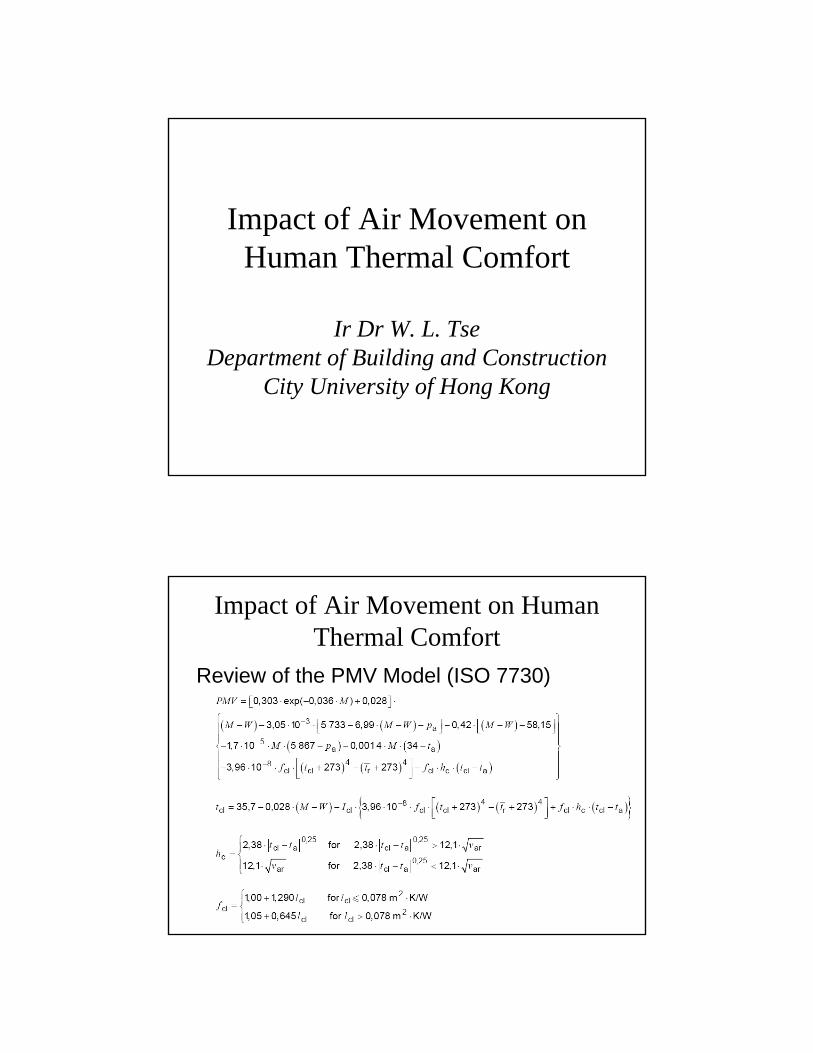
Impact of Air Movement on Human Thermal Comfort
Review of the PMV Model (ISO 7730)
Impact of Air Movement on Human Thermal Comfort
Impact of Air Movement on Human Thermal Comfort
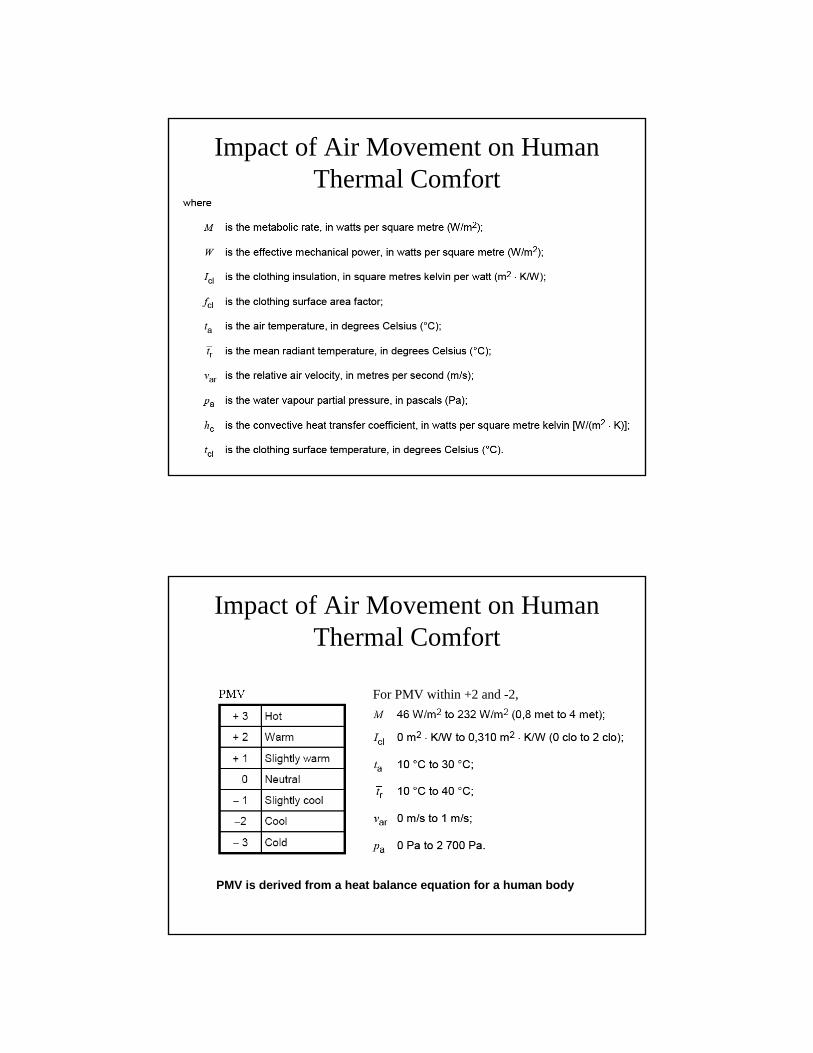
For PMV within +2 and -2,
PMV is derived from a heat balance equation for a human body
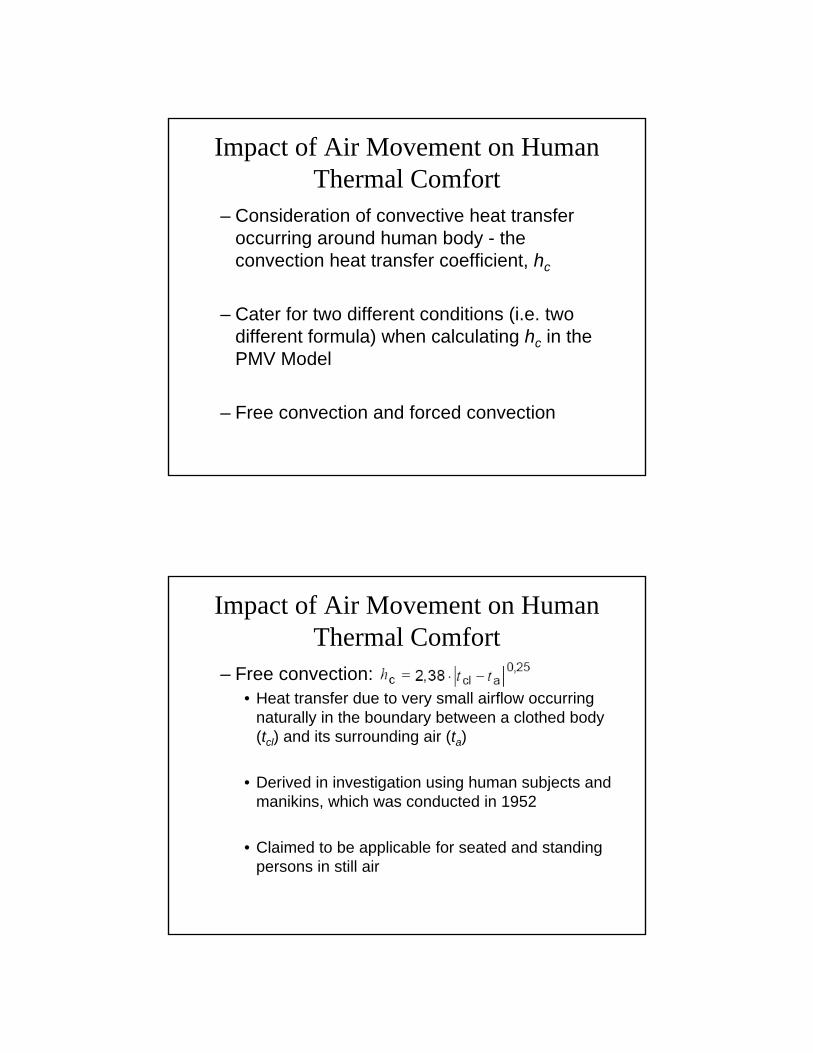
Impact of Air Movement on Human Thermal Comfort
– Consideration of convective heat transfer occurring around human body - the convection heat transfer coefficient, hc
– Cater for two different conditions (i.e. two different formula) when calculating hc in the PMV Model
– Free convection and forced convection
Impact of Air Movement on Human Thermal Comfort
– Free convection:• Heat transfer due to very small airflow occurring
naturally in the boundary between a clothed body (tcl) and its surrounding air (ta)
• Derived in investigation using human subjects and manikins, which was conducted in 1952
• Claimed to be applicable for seated and standing persons in still air

Impact of Air Movement on Human Thermal Comfort
– Forced convection:• Heat transfer taken place due to significant airflow
across a human body• Derived in investigation using human subjects in a
semi-reclining position with downward airflow (i.e. supply air diffusers on the ceiling), which was conducted in 1939
• Claimed to be applicable for var < 2.6m/s• Lack of consideration of turbulence (i.e. change in
air speed), which is measured by turbulence intensity (Tu).
• In this study, Tu is assumed to be zero in this formula.
Impact of Air Movement on Human Thermal Comfort
– Select the higher value of hc to calculate PMV
– In practice, the upper formula is employed for air speed below 0.1m/s. The formula for forced convection is used for higher air speed.
– When ta < tcl, increasing air movement (i.e. higher hc) enhances cooling (i.e. lower PMV).
Impact of Air Movement on Human Thermal Comfort
Note:Icl=0.078m2K/WM=69.6W/m2
( ISO7730 , pp45)
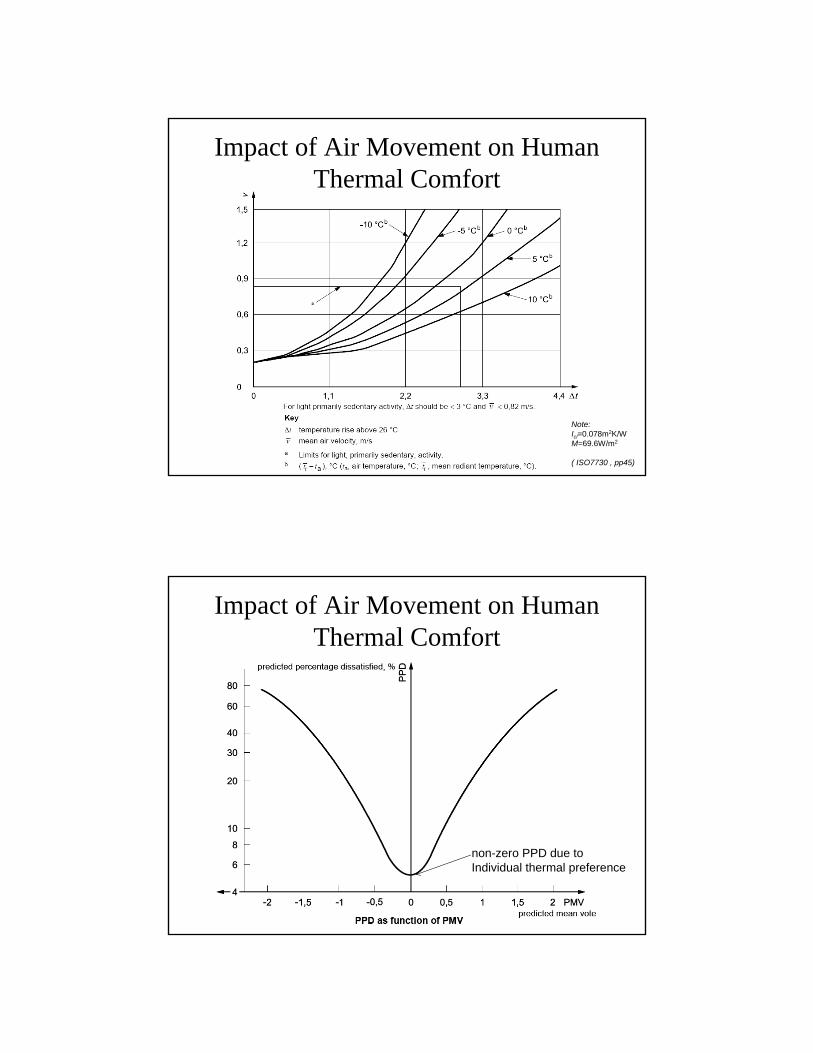
Impact of Air Movement on Human Thermal Comfort
non-zero PPD due to Individual thermal preference

Impact of Air Movement on Human Thermal Comfort
Review of the Draught Model (ISO 7730)
DR: draught rate (percentage of people being bothered by draught)
Impact of Air Movement on Human Thermal Comfort
– Draught: an unpleasant cooling of the body caused by air movement (i.e. draught)
– Usually occur when cool air flows across the body of an occupant, particularly the head, who is situated close to a supply air diffuser
– Applicable to people at light, mainly sedentary activity with a thermal sensation for the whole body close to neutral (PMV=0) and for prediction of draught at the neck

Impact of Air Movement on Human Thermal Comfort
DR=15% (i.e.15% occupants feeling draught)
The Draught Model also suggests the existence of individual thermal preference.
Impact of Air Movement on Human Thermal Comfort
Recent Research Findings– The PMV Model predicts warmer thermal
perception as compared to what people in naturally-ventilated (NV) buildings feel.
• According to the study conducted by Humphreys M. A. and Nicol J.F., the mean PMV value and the mean subjective sensation vote for a group of NV buildings are 0.69 and 0.53 respectively.
• People in NV buildings always find ways to make themselves comfortable. Increasing air speed to enhance cooling is one of the popular ways.

Impact of Air Movement on Human Thermal Comfort
– A relatively large amount of air movement is favourable to occupants in warm environments such as NV buildings
• According to the study conducted by Fountain et al., occupants in warm environments prefer locally controlled air movement.
• From the report “Trends in thermal comfort research” written by Oseland and Humphreys, the following statements are stated:
– A person who is too warm overall will welcome local cooling but protest at local heating.
– A person who is too cool overall will welcome local warming but protest at local cooling.
Impact of Air Movement on Human Thermal Comfort
Case Study (Modification of the PMV Model)
– Consider the effect of turbulence in the Model
– Make use findings from the previous study in forced convection
• Derivation of the area-averaged Nusselt number, NuD of an isothermal sphere (the diameter D in meter and the thermal conductivity k in W/m-K)
• (i.e. hc is proportional to NuD)
DkNuh Dc =

Impact of Air Movement on Human Thermal Comfort
– The surface area of a nude human body is about 1.74m2 (from the textbook “Thermal Comfort – Analysis and Applications in Environmental Engineering” pp.158)
– For the clothing insulation to be 0.53clo, the factor, fcl, is found to be 1.1 indicating that the total surface area of a clothed body is 1.91m2
Impact of Air Movement on Human Thermal Comfort
– The equivalent diameter (D) of a sphere for a human body is found to be 0.78m.4πR2 = 1.91m2 where D = 2R
– The measured data in the survey conducted in Singapore are employed in this study.
• ta = 29.4oC (approximation for simplicity)• tr = 29.4oC (approximation for simplicity)• RH = 73% (corresponding to the certain value of pa)• var = 0.3m/s• Icl = 0.53clo, fcl = 1.1• M = 1 met (i.e. 50kcal/m2-hr), W = 0 (no effective mechanical
output)• Tu = 67%

Impact of Air Movement on Human Thermal Comfort
– The value of hc under 67% Tu and zero Tucan be found. They are 344 (i.e. 67% Tu) and 71 (i.e. zero Tu).
– The value of hc is increased by 4.8 times.
Impact of Air Movement on Human Thermal Comfort
– For a human body, the formula on Page 6 is employed. For var = 0.3 m/s and zero Tu,
.
– For var = 0.3 m/s and 67%Tu, the value of hc for a human body should also be increased by 4.8 times (i.e. assumption). The equivalent air speed (var
’) is calculated as follows:var
’= 4.82 x 0.3 = 6.9 m/s

Impact of Air Movement on Human Thermal Comfort
– The PMV value with zero Tu is found to be 1.24 which matches with the value (i.e. PMV = 1.1) obtained from the chart on Page 26.
Impact of Air Movement on Human Thermal Comfort
– The PMV value with 67% Tu is found to be 0.25 corresponding to 6% PPD.
Impact of Air Movement on Human Thermal Comfort
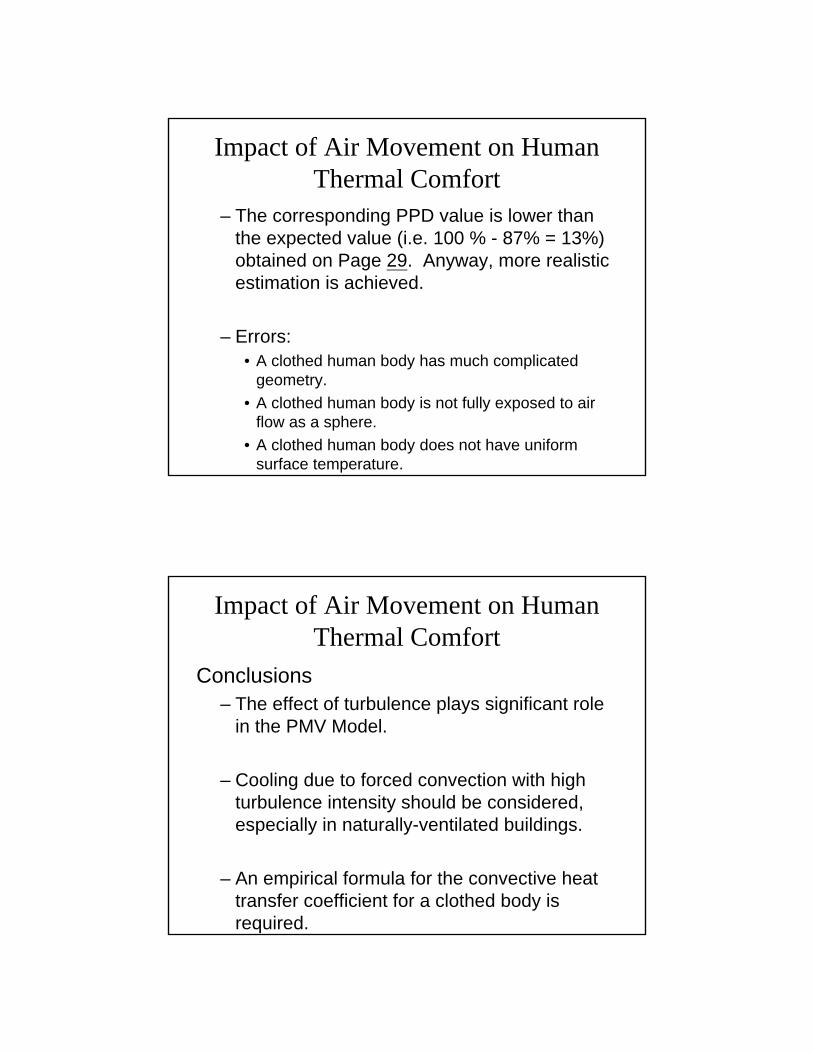
– The corresponding PPD value is lower than the expected value (i.e. 100 % - 87% = 13%) obtained on Page 29. Anyway, more realistic estimation is achieved.
– Errors:• A clothed human body has much complicated
geometry.• A clothed human body is not fully exposed to air
flow as a sphere.• A clothed human body does not have uniform
surface temperature.
Impact of Air Movement on Human Thermal Comfort
Conclusions– The effect of turbulence plays significant role
in the PMV Model.
– Cooling due to forced convection with high turbulence intensity should be considered, especially in naturally-ventilated buildings.
– An empirical formula for the convective heat transfer coefficient for a clothed body is required.

Thank You!
APPENDIX

Impact of Air Movement on Human Thermal Comfort
Impact of Air Movement on Human Thermal Comfort

Impact of Air Movement on Human Thermal Comfort
The above information from the publication “Adaptive behaviour and thermal comfort in Singapore’s naturally ventilated housing” (Building Research & Information, 2003)
Impact of Air Movement on Human Thermal Comfort
The above information from the publication “Adaptive behaviour and thermal comfort in Singapore’s naturally ventilated housing” (Building Research & Information, 2003)
Tu = 67%

Impact of Air Movement on Human Thermal Comfort
The above information from the publication “Adaptive behaviour and thermal comfort in Singapore’s naturally ventilated housing” (Building Research & Information, 2003)
61%
16%
23%
Average PMV value = 1.1 corresponding to 30% PPD!
Impact of Air Movement on Human Thermal Comfort
The above information from the publication “Adaptive behaviour and thermal comfort in Singapore’s naturally ventilated housing” (Building Research & Information, 2003)
Impact of Air Movement on Human Thermal Comfort
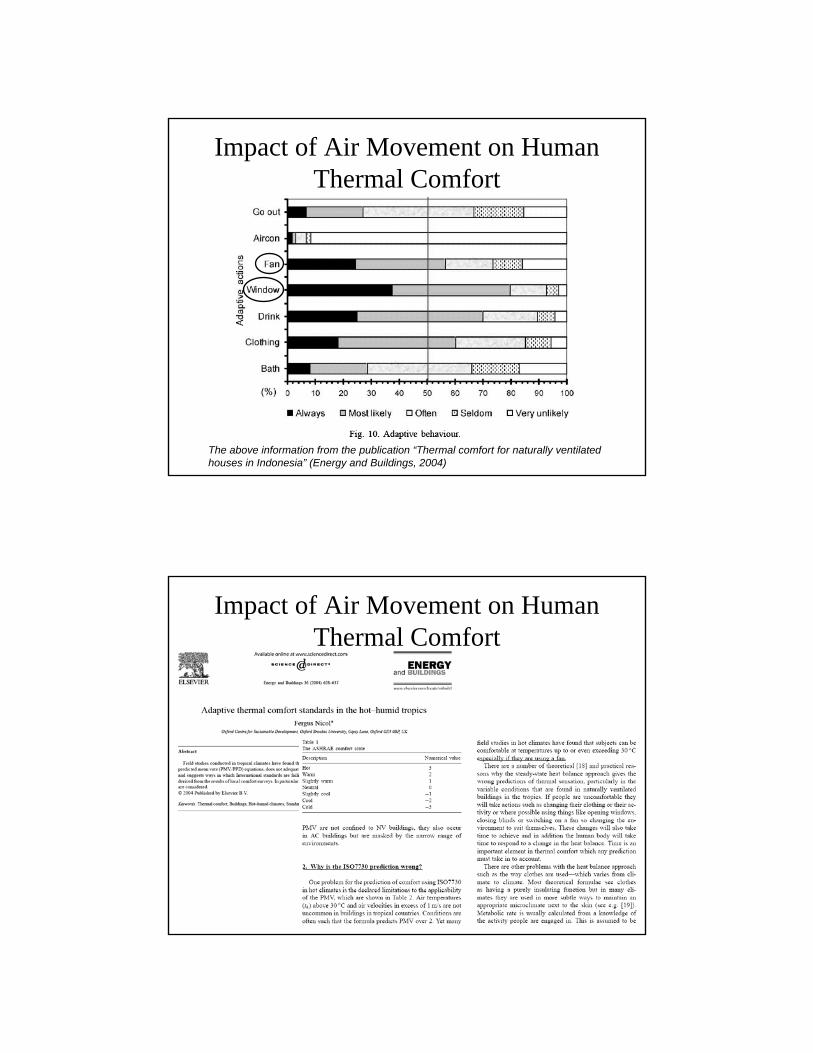
The above information from the publication “Thermal comfort for naturally ventilated houses in Indonesia” (Energy and Buildings, 2004)
Impact of Air Movement on Human Thermal Comfort
Impact of Air Movement on Human Thermal Comfort
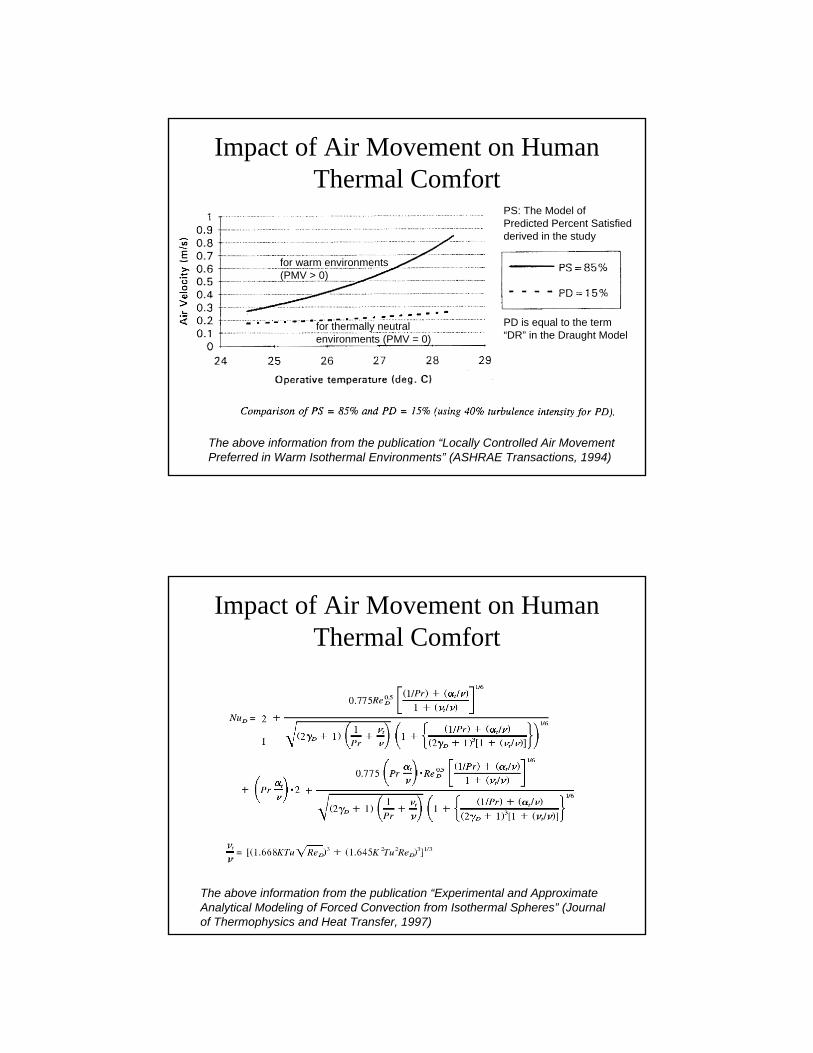
The above information from the publication “Locally Controlled Air Movement Preferred in Warm Isothermal Environments” (ASHRAE Transactions, 1994)
PS: The Model of Predicted Percent Satisfied derived in the study
for warm environments (PMV > 0)
for thermally neutral environments (PMV = 0)
PD is equal to the term “DR” in the Draught Model
Impact of Air Movement on Human Thermal Comfort
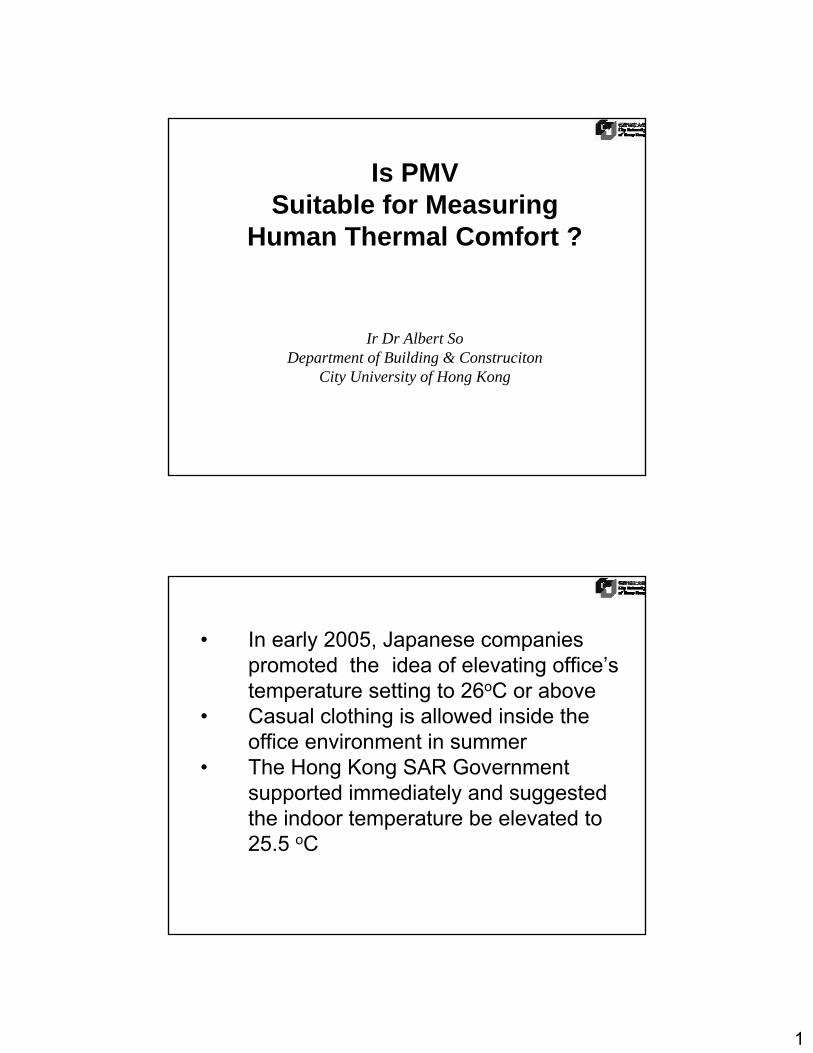
The above information from the publication “Experimental and Approximate Analytical Modeling of Forced Convection from Isothermal Spheres” (Journal of Thermophysics and Heat Transfer, 1997)

Appendix IV
1
Is PMV Suitable for Measuring
Human Thermal Comfort ?
Ir Dr Albert SoDepartment of Building & Construciton
City University of Hong Kong
• In early 2005, Japanese companies promoted the idea of elevating office’s temperature setting to 26oC or above
• Casual clothing is allowed inside the office environment in summer
• The Hong Kong SAR Government supported immediately and suggested the indoor temperature be elevated to 25.5 oC

2
• If we elevate the temperature setting, we can at the same time elevate the supplied chilled water temperature, normally set at 6 oC
• Of course, that can save a substantial amount of energy
• But whether it is acceptable or not ???• This is the main question • Our opinion is that “nobody can work
efficiently inside the office during summer in Hong Kong”
Fanger’s Equation Set 1970

3
• human metabolic rate (met and η -mechanical efficiency respectively)
• clothing (Tcl, hcl and fcl respectively)• dry-bulb temperature (Trm)• water vapour pressure (Pa) (i.e. humidity)• radiant temperature (i.e. thermal radiation,
Tmrt)• speed of air movement (va,avg and vact - speed
of occupants respectively).
( ) max,25.0
, ]4.10,05.2[),,( actavgarmclactavgaclrmcl vvTTvvTTh +−=+
)}(])273()273[(104.3
)34(0014.0)44(0023.0]50)1([42.0])1(061.043[35.0)1({)032.0352.0(
448
042.0
rmclclclmrtclcl
rma
amet
TThfTTfx
TmetPmetmetPmetmetePMV
−−+−+−
−−−−−−−−−−−−+=
−
−
ηηη
• Actually, we proposed “PMV based control of HVAC systems” in 2000 and presented the concept in an ASHRAE meeting
• Indoor air-conditioning control must be PMV based instead of the conventional dry-bulb temperature based
Ref: Tse W.L. and So A.T.P., "Implementation of comfort-based air-handling unit control algorithms", ASHRAE Transactions, Vol. 106, Pt. 1, 2000, pp. 29-44.

4
Table 1 Living room with all doors to bedrooms closed; all fan-lamps OFF; temperature setting adjusted to 17oC
From 16:00 to 16:30 Energy Consumption = 211.86-210.66 = 1.20 kWh
0.3661.1723.200.0222.81.5G
0.1261.1723.280.0622.81.5F
0.1761.1723.260.0522.81.5E
-0.1061.7723.250.1222.71.5D
-0.1061.7723.250.1222.71.5C
0.3461.0823.100.0222.71.5B
0.1061.6823.230.0622.61.5A
PMVRelative Humidity (%)
tr (oC)var (m/s)ta (oC)HeightPosition
Table 2 Living room with all doors to bedrooms closed; all fan-lamps ON; temperature setting adjusted to 25oC
From 16:50 to 17:20 Energy Consumption = 212.97-212.56 = 0.41 kWh
0.3167.7825.320.2725.101.5G
0.2067.1025.100.3525.11.5F
-0.0367.6425.250.6324.91.5E
0.2967.0425.000.2425.01.5D
0.4368.3125.290.1624.91.5C
0.6568.3125.060.0624.91.5B
0.4468.2425.370.1524.81.5A
PMVRelative Humidity (%)
tr(oC)var (m/s)ta (oC)HeightPosition
Figure 4 The Climate Chamber for Experiments renovated from a standard Classroom
Figure 5 Equipment for measuring the four Environmental Parameters of the PMV Equations
Experiments conducted in CAMPUS of
Dong Guan University of Technology
Laboratory houses 12 human subjects at the same time
5
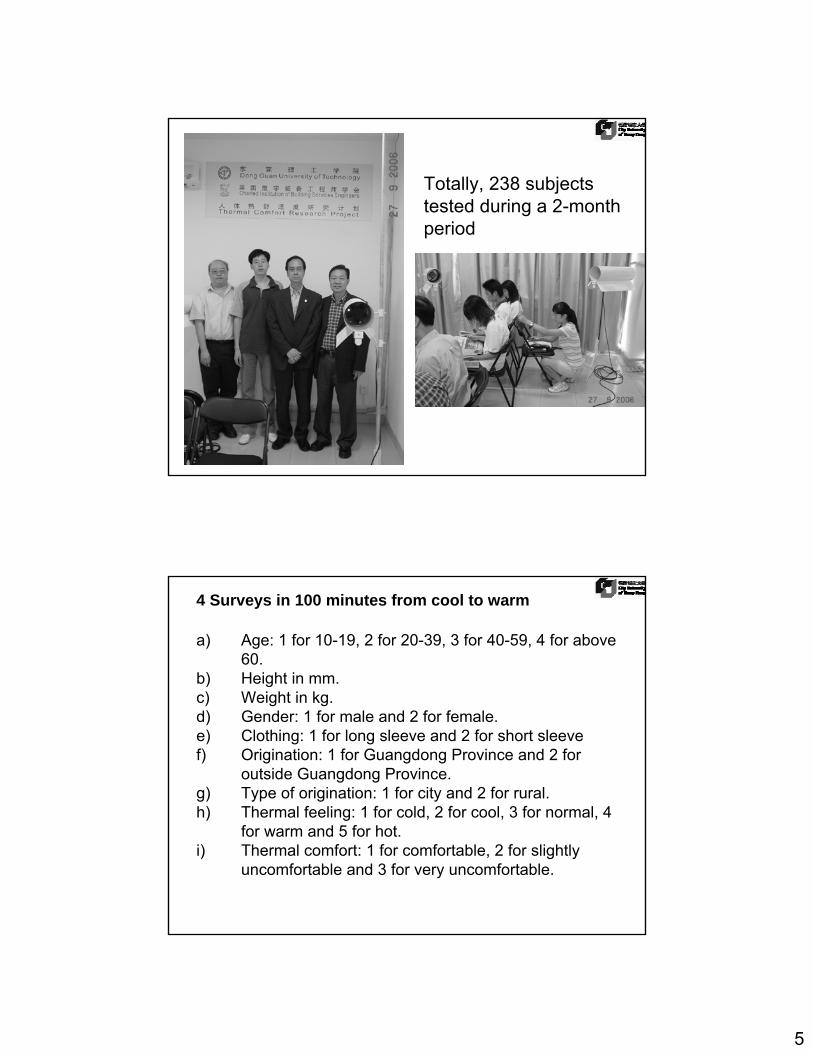
Totally, 238 subjects tested during a 2-month period
a) Age: 1 for 10-19, 2 for 20-39, 3 for 40-59, 4 for above 60.
b) Height in mm.c) Weight in kg.d) Gender: 1 for male and 2 for female.e) Clothing: 1 for long sleeve and 2 for short sleevef) Origination: 1 for Guangdong Province and 2 for
outside Guangdong Province.g) Type of origination: 1 for city and 2 for rural.h) Thermal feeling: 1 for cold, 2 for cool, 3 for normal, 4
for warm and 5 for hot.i) Thermal comfort: 1 for comfortable, 2 for slightly
uncomfortable and 3 for very uncomfortable.
4 Surveys in 100 minutes from cool to warm
6
452131456N =
95% Confidence Interval for Mean
Subjective Thermal Feeling
HotWarmNormalCoolCold
95%
CI
Pred
icte
d M
ean
Vote
with
met
=50
3
2
1
0
-1
-2
-3
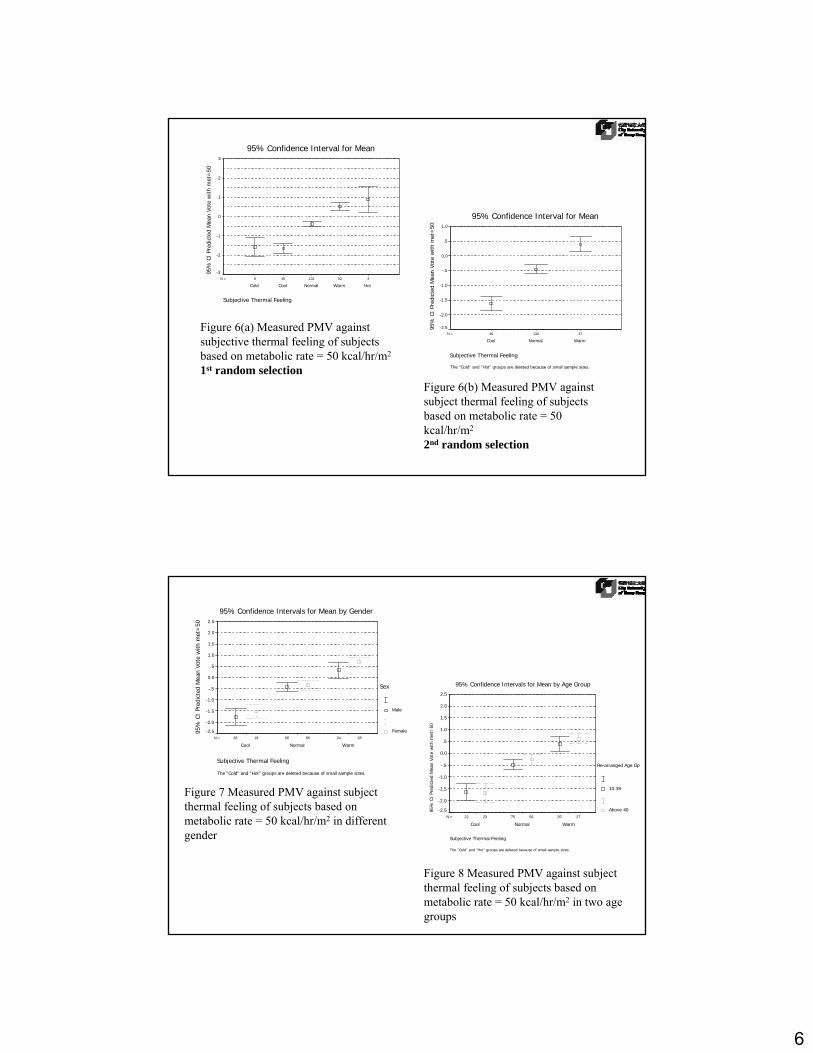
Figure 6(a) Measured PMV against subjective thermal feeling of subjects based on metabolic rate = 50 kcal/hr/m2
1st random selectionFigure 6(b) Measured PMV against subject thermal feeling of subjects based on metabolic rate = 50 kcal/hr/m2
2nd random selection
4713446N =
95% Confidence Interval for Mean
The "Cold" and "Hot" groups are deleted because of small sample sizes.
Subjective Thermal Feeling
WarmNormalCool
95%
CI
Pred
icte
d M
ean
Vote
with
met
=50 1.0
.5
0.0
-.5
-1.0
-1.5
-2.0
-2.5
286519 246626N =
95% Confidence Intervals for Mean by Gender
The "Cold" and "Hot" groups are deleted because of small sample sizes.
Subjective Thermal Feeling
WarmNormalCool
95%
CI
Pred
icte
d M
ean
Vote
with
met
=50 2.5
2.0
1.5
1.0
.5
0.0
-.5
-1.0
-1.5
-2.0
-2.5
Sex
Male
Female
Figure 7 Measured PMV against subject thermal feeling of subjects based on metabolic rate = 50 kcal/hr/m2 in different gender
275623 257522N =
95% Confidence Intervals for Mean by Age Group
The "Cold" and "Hot" groups are deleted because of small sample sizes.
Subjective Thermal Feeling
WarmNormalCool
95%
CI
Pred
icte
d M
ean
Vote
with
met
=50
2.5
2.0
1.5
1.0
.5
0.0
-.5
-1.0
-1.5
-2.0
-2.5
Re-arranged Age Gp
10-39
Above 40
Figure 8 Measured PMV against subject thermal feeling of subjects based on metabolic rate = 50 kcal/hr/m2 in two age groups

7
Results a little bit strange:
• Conventional belief that people in hot climate prefer higher temperature whereas people in cold climate prefer lower temperature
• We got contradictory result
• ANY PARTICULAR IMPLICATION?
• Out of the 6 parameters, only 1 could not be measured accurately, M
• So, we iterated M
95% Confidence Interval for mean of PMV50-PMV80
SEX: Male
PMV80
PMV78
PMV76
PMV74
PMV72
PMV70
PMV68
PMV66
PMV64
PMV62
PMV60
PMV58
PMV56
PMV54
PMV52
PMV50
95%
CI
1.0
.8
.6
.4
.2
0.0
-.2
-.4
-.6
-.8
Figure 10 Iteration process of adjusting the metabolic rate from 50 kcal/hr/m2 to 80 kcal/hr/m2 for male subjects expressing "normal" in first exercise of random selection

8
5213145N =
95% Confidence Intervals for Mean
The "Cold" and "Hot" groups are deleted because of small sample sizes.
Subjective Thermal Feeling
WarmNormalCool
95%
CI
Pred
icte
d M
ean
Vote
with
met
=58 1.5
1.0
.5
0.0
-.5
-1.0
-1.5
Figure 11 Measured PMV against subject thermal feeling of subjects based on metabolic rate = 58 kcal/hr/m2 in two age groups
2 Schools of Thermal Comfort
• Static Approach or Heat Balancing Approach represented by Fanger’s Equation and ISO 7730
• Adaptive Approach
• Having debated for more than 2 decades
• Both approaches have drawbacks

9
2 Schools of Thermal Comfort• Traditionally, people in tropical countries prefer
warmer environment and vice versa
• However, our experience is opposite (trips to Japan prove that)
• Nakano et al 2002 found that Japanese prefer 24.8oC while non-Japanese prefer 22.7oC
• Our hypothesis: Metabolic Rate of Individuals is ADAPTIVE
• People in tropical countries prefer warmer environment but cooler environment if they live in air-conditioned space all day long
• Let’s look at what other researchers said
Limitations of Fanger’s Equation Set
• Not applicable to all people, PPD = 5% at PMV = 0
• PMV model is based on a measure of how warm or cool occupants feel
• Thermal sensation ≠ thermal satisfaction (satisfied/not satisfied), thermal acceptability (acceptable/unacceptable), thermal comfort or thermal preference (like to be warmer/cooler)
• Thermal sensation simply measures the conditions that occupants perceive
• -1, 0 or +1 may also mean “satisfaction”
• These terms are too vague to be defined

10
Limitations of Fanger’s Equation Set
• Schiller found that 27-39% of office occupants who voted extreme conditions (-3, -2, +2, +3) also reported “moderately or very comfortable”
• Brager found that 11-36% of office occupants voting “0” reported they would prefer to feel warmer or cooler
• 3-50% of occupants who reported extreme sensations (-3, -2, +2, +3) also preferred no change in temperature
• That means, thermal sensation ≠ thermal comfort
Limitations of Fanger’s Equation Set• Doherty and Arens found that there were discrepancies
between predicted and actual thermal sensation as large as 1.3 scale
• Humphreys found that “0” may mean a range from 0.8 oC to 3 oC higher than those predicted by the PMV
• Humphreys found that PMV model is accurate in laboratory studies under sedentary activities and light clothing but not accurate for heavier clothing and higher activity levels
• PMV model behaves extremely well in air-conditioned buildings BUT NOT IN naturally ventilated building
• Brager and de Dear found that PMV overestimated actual neutral temperature by up to 2.1 oC and underestimated it by up to 3.4 oC
• de Dear also found that although observed neutral temperatures were largely consistent with those predicted by PMV, difference was large with non-neutral conditions, i.e. PMV accurate at PMV ≈ 0

11
Measurement Errors in PMV Model - clo
• Difficult to measure the four physical parameters accurately at field; easy to measure accurately in laboratories
• Measuring clothing insulation in “clo” is time consuming; normally take an average 0.35-0.6 cloin summer and 0.8-1.2 clo in winter
• Current clo values DO NOT fully reflect the effects of posture, clothing material and cut, dynamic heat transfer, chair insulation, and variation in heat loss over the body (can be up to 0.3 clo)
Measurement Errors in PMV Model - met
• “met” is difficult to measure
• In laboratory, heat or oxygen production are measured for participants conducting specific activities
• Alternatively, heart beating rate can be measured and table look-up
• Goto, Toftum, de Dear and Fanger noted that “activity level is probably one of the least well-described parameters of all the parameters that affect thermal sensation, comfort and temperature preferences indoors”
12
Measurement Errors in PMV Model - met
• Method of measuring the basal metabolic rate BMR
• Rate of heat production in BMR determinations can be measured directly or indirectly.
• Direct: use direct calorimetry –
• person sits in an insulated chamber with water circulating through the walls
• difference in temperature of water entering and leaving the chamber reflects the amount of heat librated by the person and picked up by the water
• the method is not practical because the calorimeter chamber is costly and take up a lot of space
Measurement Errors in PMV Model - met
• Indirect: indirect calorimetry
• The person’s O2 uptake per unit of time is measured
• Food + O2 → CO2 + H2O + energy (mostly transformed to heat)
• Direct relationship exists between volume of O2 used and quantity of heat produced
• But relationship depends on type of food oxidized
• Carbohydrates, protein and fats require different amounts of O2 for oxidation and yield different amounts of kilocalories
• Average quantity of heat produced per liter of O2 ‘energy equivalent of O2’ is 4.8 kilocalories�
13
Measurement Errors in PMV Model - met
• Metabolic rate = energy expenditure / unit of time
• The metabolic rate of a person consuming 15 liters/hr of O2 is:
• 15 liters/hr (O2 consumption) x 4.8 kilocalories/liter (energy equivalent of O2) = 72 kilocalories/hr (estimated metabolic rate)
• Large man has a higher rate heat of production than a smaller man
• But if in terms of total surface area (height and weight) the output in kilocalories per hour per square meter of surface area is normally about the same
Measurement Errors in PMV Model - met
• A hormone called thyroid hormone increases, the BMR increases correspondingly
• Temperature regulation
• Internal core temperature is homeostatically maintained at 100F
• Increased skeletal muscle activity generates more heat in response to a fall in core temperature
• Shivering consists of rhythmic, oscillating skeletal muscle contractions that occur at a rapid rate of 10 to 20 per second
• Within a matter of seconds to minutes, internal heat production may increase two to fivefold as a result of shivering
14
Measurement Errors in PMV Model - met
• Current “met” tables are for “average” person but DO NOT accurately reflect differences between people and contexts
• So, we proposed higher “met” for tropical people when sedentary and lower “met” for temperate people
• Fanger found that periods of stressful activity result in greater muscle tension and could increase office “met” rate up to 1.5 met.
• Wyon also found that performing mental tasks could increase activity level up to 1.3 met
Measurement Errors in PMV Model - met
• Rowe did 144 occupants and found that average office met rate was 1.2 but it could range from 1.0 to 1.9 between people and over time
• Havenith (2002) concluded that current met tables are not sufficiently accurate and more information is needed for activities below 2.0.
• PMV model best predicts actual thermal sensation for activity level up to 1.4 met. Above 1.8 met, PMV overestimates thermal sensation by up to one scale unit.
15
Contextual Assumptions• De Dear and Brager noted that “current thermal comfort
standards and models equally applicable across all types of building, ventilation, occupany pattern and climate zone”
• Fanger concluded that the neutral temperature of a large group of people was independent of age, gender, menstrual cycle, race, obesity, time of day, or physiological acclimatisation
• Later, found that female more sensitive to deviation from neutral temperature
• Many researchers suggested that people from different climatic regions differ in their neutral temperatures
• But some researchers argued there is little evidence to prove that neutral temperature is influenced by physiological acclimatisation, although sensitivity to temperature change is likely to be affected.
Contextual Assumptions• Observed neutral temperature in air-conditioned buildings
differ from that in naturally ventilated buildings, ranging from1.3 oC to 1.7 oC in Australia
• Fortunately, most researchers found that PMV model is more accurate in air-conditioned buildings instead of naturally ventilated buildings (can be 0.6 oC to 3.6 oC higher than observed neutral temperatures)
• Brager and de Dear (1998) noted that “heat balance models view the person as a passive recipient of thermal stimuli”
• A growing number of researchers have acknowledged that occupants interact with their environments, and that they will adapt their behaviours and expectations with respect to thermal comfort (e.g. Baker & Standeven, 1996; Benton et al, 1990; Brager & de Dear, 1998; Cena et al, 1986; de Dear & Brager, 2001; 2002; Humphreys, 1994).
16
Contextual Assumptions• Humphreys (1994) commented that “characteristically, people
seek to be comfortable, and take actions to secure thermal comfort; the motivation to do so is powerful”.
• This argument was in line with our findings.
• In addition to behavioural adjustments, occupants might also modify their expectations and attitudes towards the thermal environment.
• This psychological adaptation is argued to be influenced by culture, social norms, and previous experience, and is likely tobe context dependent (Baker & Standeven, 1996; Cena, 1994, Oseland, 1995).
Conclusions• Humphreys (1994) argues that, if there are no constraints
placed upon adaptation processes, then over time neutral temperatures will come to be similar to air temperatures.
• The occupant will adapt both the thermal environment and their own expectations, until a comfortable situation exists.
• However, if constraints, such as wealth, climate, social norms, or organizational policies, restrict occupants’ opportunities to adapt, this natural process will not occur.
• PMV model is not always a good predictor of actual thermal sensation, particularly in field study settings. Discrepancies between actual and predicted neutral temperatures reflect the difficulties inherent in obtaining accurate measures of clothinginsulation and metabolic rate.

17
Conclusions• PMV model works well when people feel comfortable, not
uncomfortable.
• In other words, -1 < meaningful PMV < + 1
• Humphreys and Nicol’s (2002) analysis of the ASHRAE RP-884 database provides a concise summary of the biases inherent in the PMV model.
• PMV predicted actual thermal sensation most accurately for clothing insulation in the range 0.3 to 1.2 clo, for activity levels below 1.4 met, and for air-conditioned buildings.
• In addition, bias in the PMV’s prediction is less severe for room temperatures below 27oC, for air velocities less than 0.2 m/s, and for relative humidity below 60%.
END OF PRESENTATION
Questions and Discussions